
Pluvial Flood Susceptibility in the Local Community of the City of Gospić (Croatia)


Abstract
1. Introduction
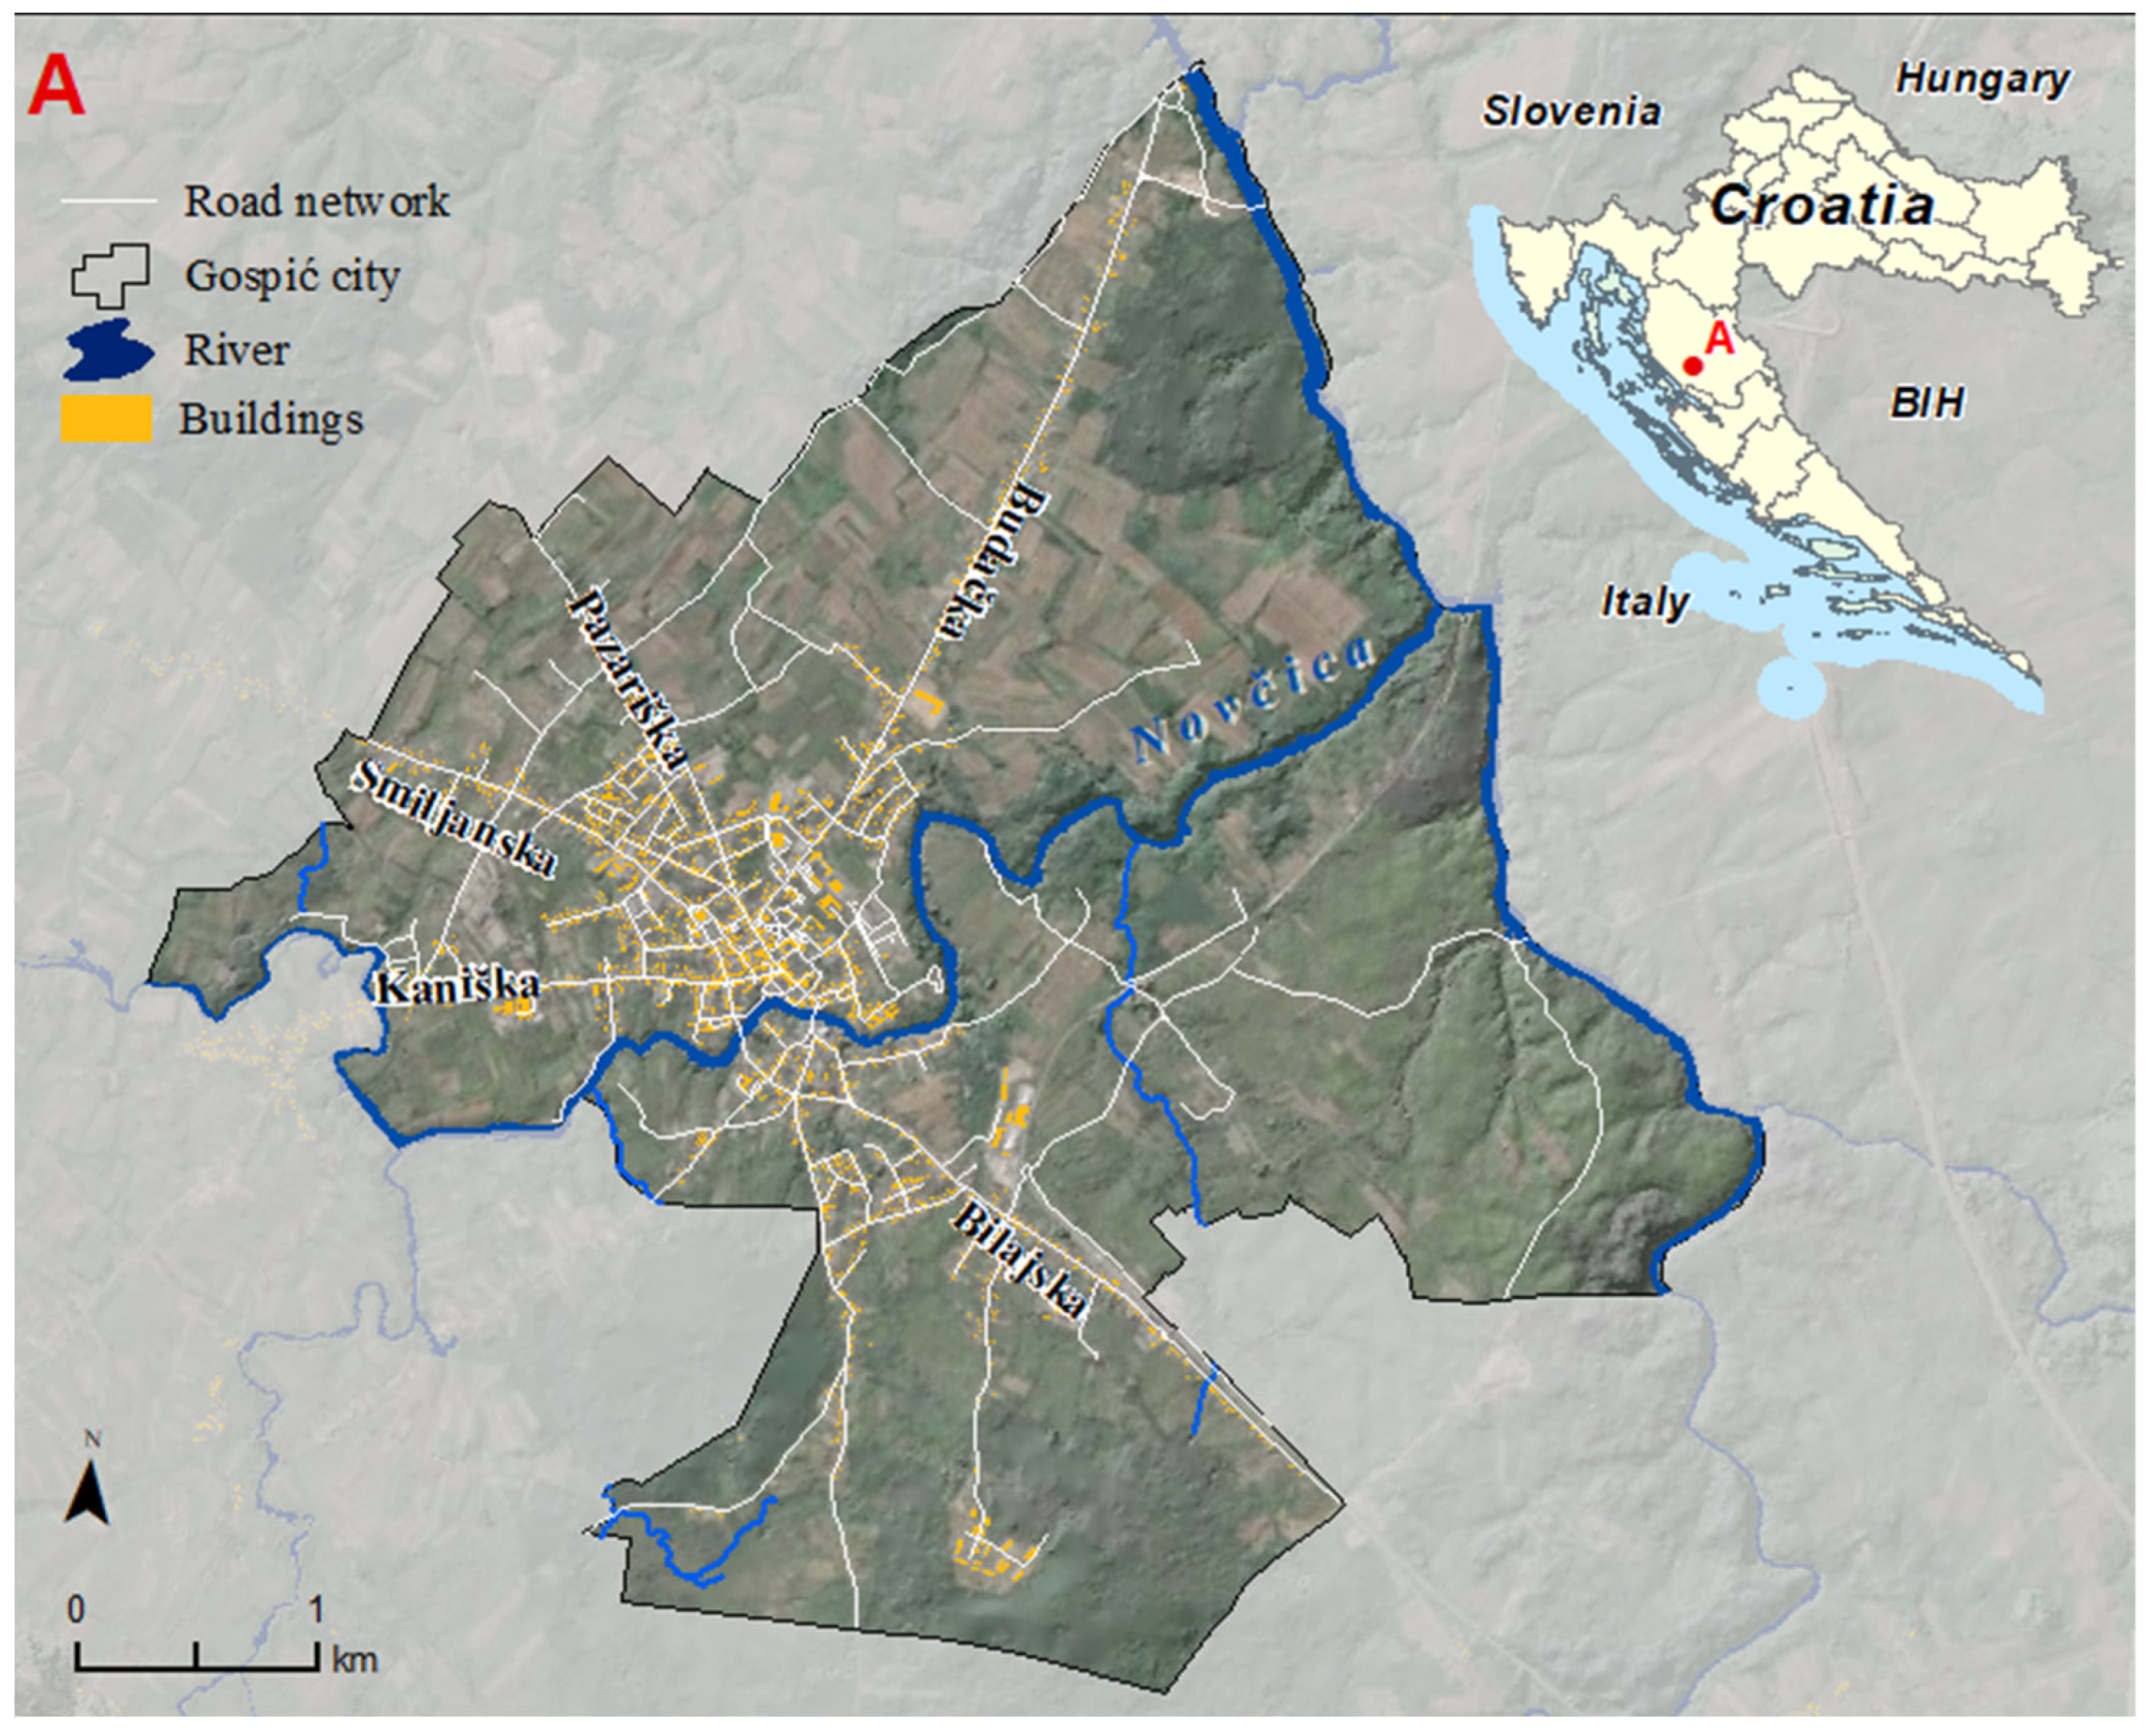
2. Study Area
3. Materials and Methods
3.1. Public Perception of Pluvial Floods Risk
3.2. Questionnaire Design
- F1 Awareness of the Pluvial Flood Risk: Questions were focused on familiarity with PF and evaluating the risk level associated with various facets, such as respondents’ homes, drinking water sources, agricultural areas, urban infrastructure, material property, tourism, and others. A Likert scale ranging from 1 (insignificant) to 5 (high) was utilized.
- F2 Anthropogenic Causes of Pluvial Floods: The respondents’ perceptions of human-induced causes of PF were explored, particularly urbanization, excessive concrete construction, lack of green spaces, inadequate pumping stations, and lack of maintenance of stormwater drainage systems. Participants rated their agreement on a scale from 1 (absolute disagreement) to 5 (absolute agreement).
- F3 Natural Causes of Pluvial Floods: Respondents also evaluated the influence of natural factors such as topographic conditions, soil characteristics, and climate change on PF occurrence.
- F4 Consequences of Pluvial Floods in the Future: This section gauged participants’ expectations regarding the future impact of PF. They provided opinions about a potential increase in the frequency of heavy rainfall events. Furthermore, they expressed expectations of material damage, awareness, and financial investments in flood prevention over the next decade.
- F5 Preparedness for Pluvial Floods: This section focused on respondents’ knowledge of how to respond during PF and their level of preparedness. Participants self-evaluated their preparedness on a scale of 1 (insufficient) to 5 (excellent). Additionally, they expressed their views on various PF-related factors and their perceived roles and responsibilities in prevention and protection.
Statistical Methods
- is the number of items on the scale,
- is the variance of each item, and
- is the total variance of all the items.
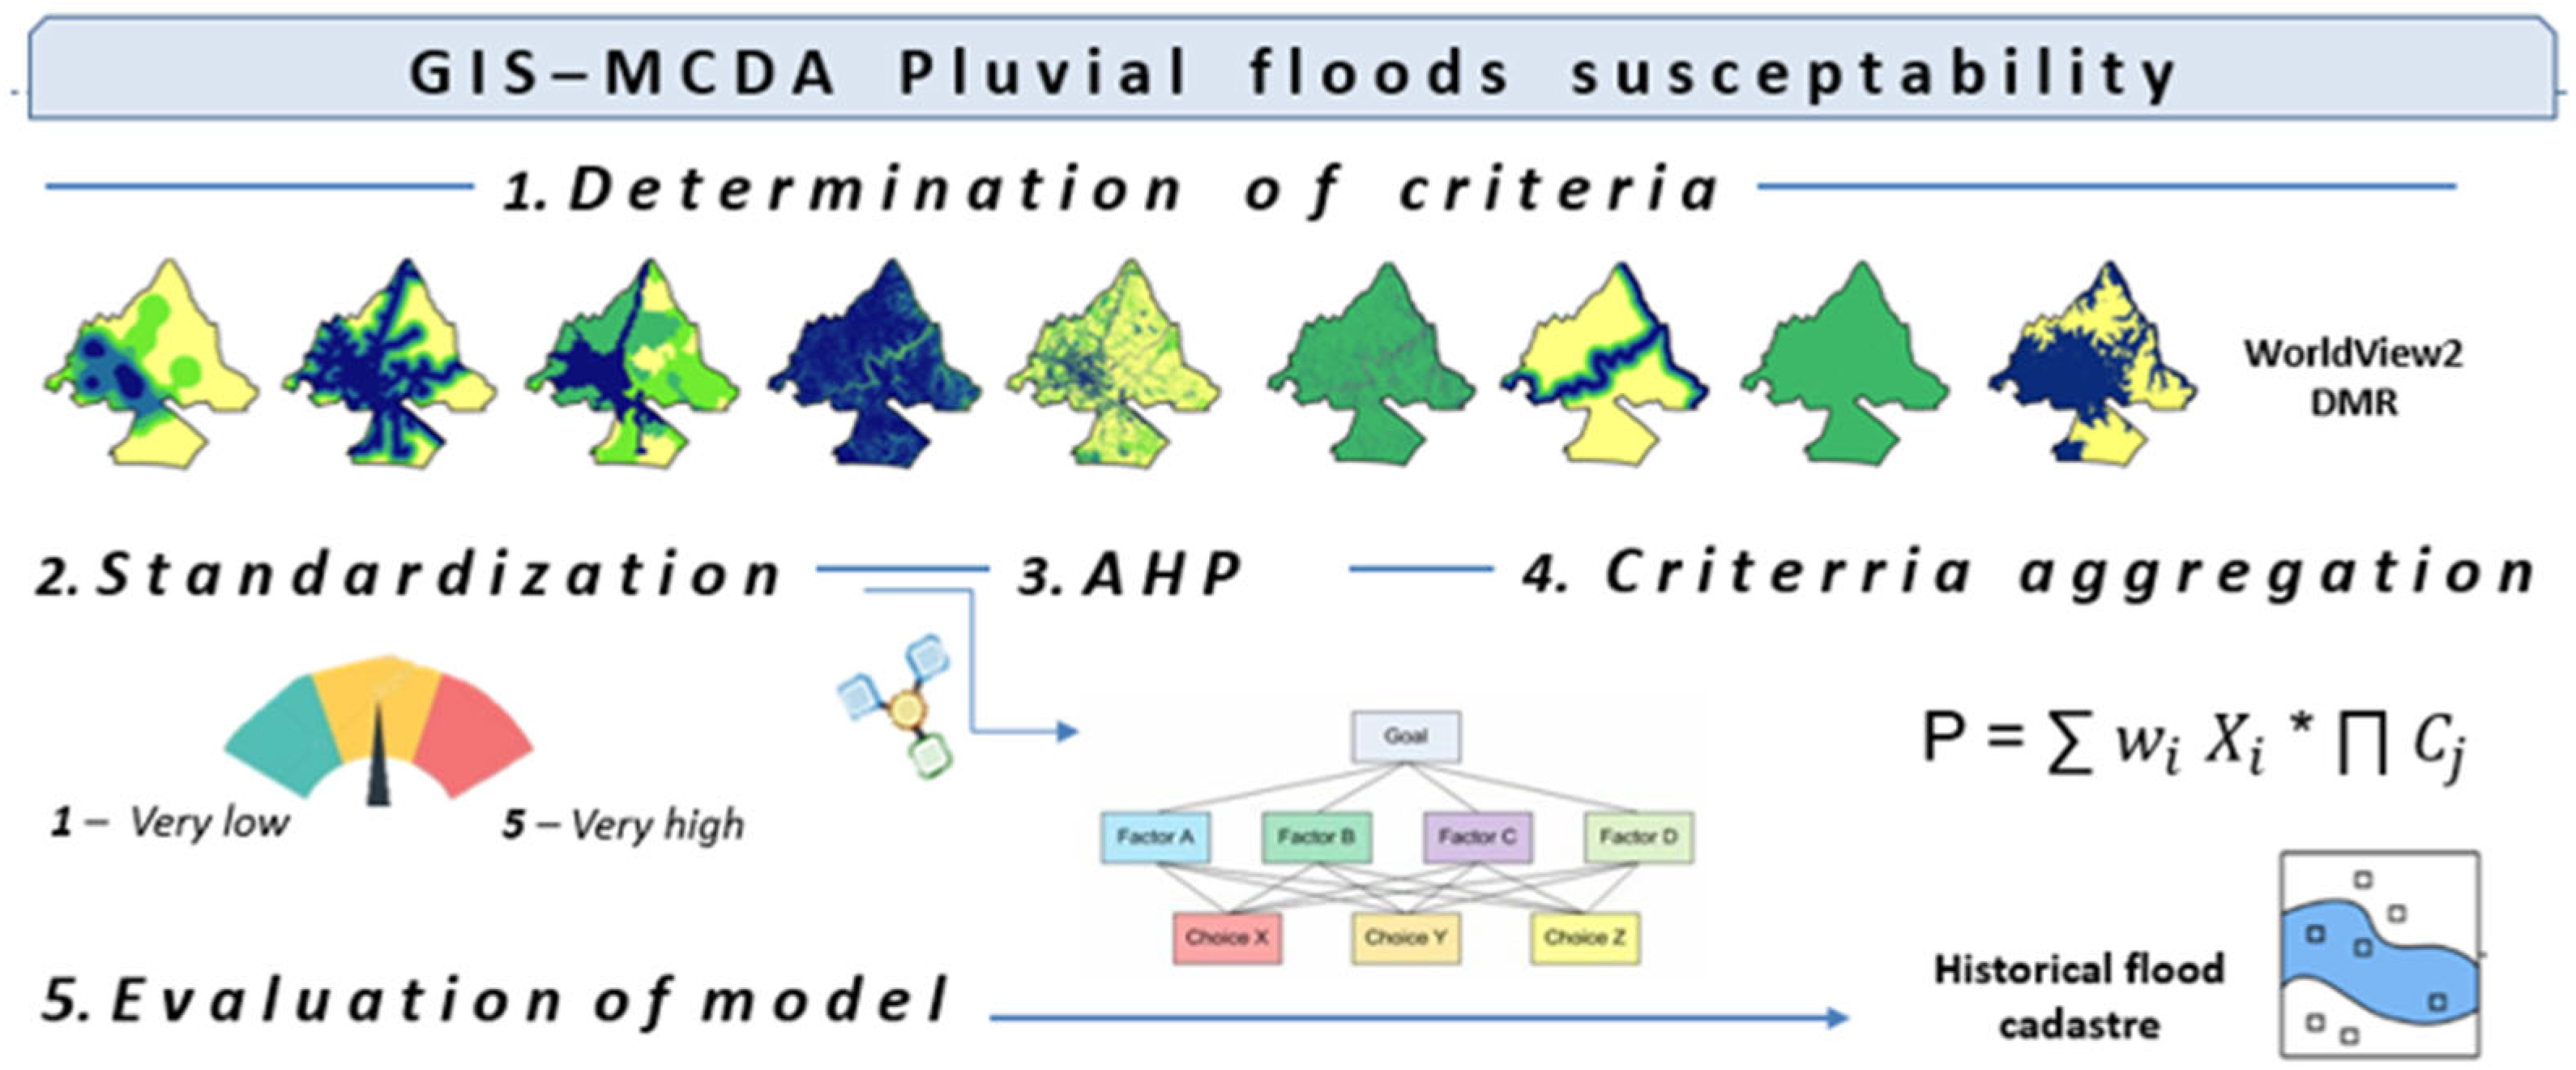
3.3. GIS-MCDA Pluvial Flood Susceptibility Model
4. Results and Discussion
4.1. Public Perception of Risk
Socio-economics Characteristics of Population
4.2. Public Perception of Risk
Statistical Analysis
- Assessment of the threat to respondents’ homes
- Familiarity with the concept of PF
- Willingness to invest more personal financial resources in improving drainage systems.
- Taken preventive measures on personal property in the last ten years.
- The impact of PF on the quality of life
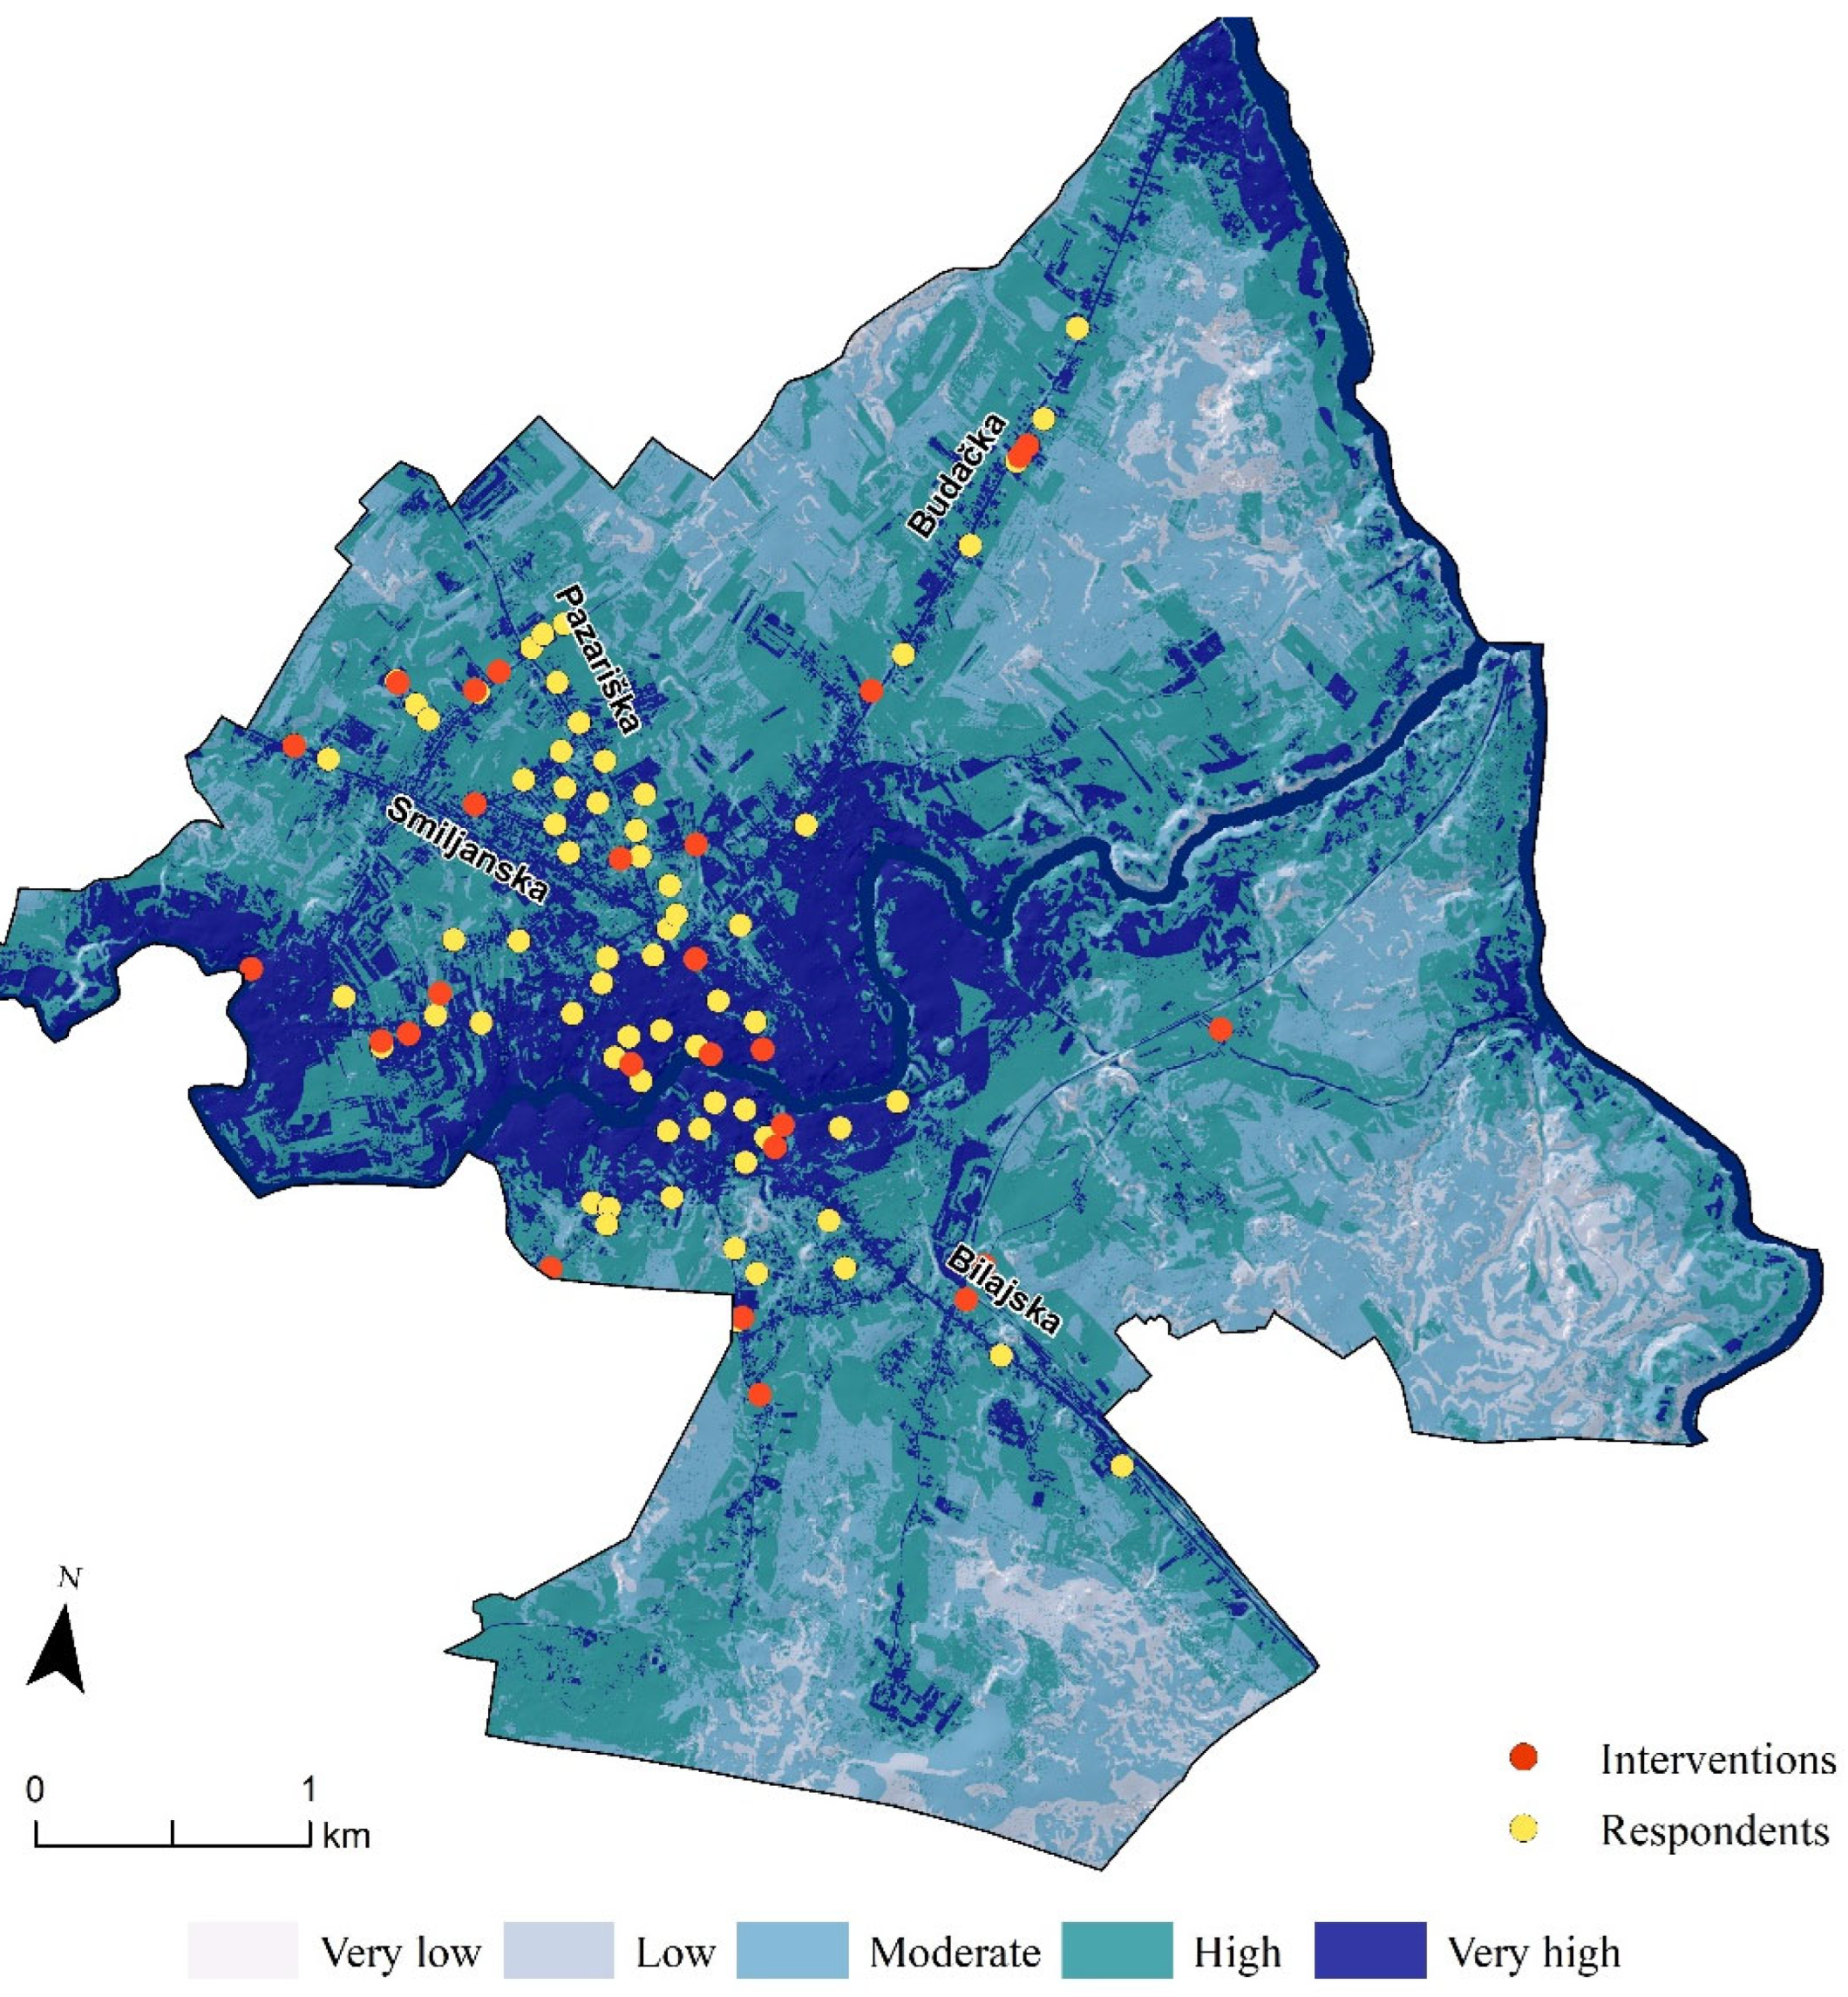
4.3. GIS-MCDA Pluvial Flood Susceptibility
5. Conclusions
- -
- Invest in the restoration and enhancement of drainage systems.
- -
- Maintain existing infrastructure, including manholes and drainage channels, regularly.
- -
- Systematic documentation of pluvial flood events in the form of pluvial flood cadasters.
- -
- Implement amendments to urban planning documents to regulate construction in flood-prone areas.
- -
- Improve communication regarding flood risks and protective infrastructure measures.
- -
- Undertake structural measures, such as canal construction and riverbed regulation.
Author Contributions
Funding
Institutional Review Board Statement
Informed Consent Statement
Data Availability Statement
Conflicts of Interest
Appendix A
- Dear,We are surveying to explore residents’ opinions regarding risk, experience, and preparedness for floods resulting from heavy rainfall (pluvial floods). The research is part of the STREAM project—Strategic Development of Flood Management—in a partnership between Croatian and Italian institutions. The survey is anonymous, and there is no need to provide your full name. Please help us with responses to contribute to the research. Thank you so much for your attention and participation.Address:________________________________________________________F1 Awareness of the Pluvial Flood Risk
- Are you familiar with floods caused by heavy rainfall (pluvial floods)?□ YES 2□ NO
- 2.
- I live in an area with a high risk of pluvial floods.□ YES 2□ NO
- 3.
- How often do pluvial floods occur in your town?□ once a year□ several times a year□ once every five years□ once every ten years□ do not occur
- 4.
- On a scale of 1 to 5, please rate the level of risk for the following statements (1—insignificant; 2—moderately significant; 3—significant; 4—very significant; 5—high)
1 2 3 4 5 Risk of floods from heavy rainfall as a threat to your home Risk of floods from heavy rainfall as a threat to drinking water sources Risk of floods from heavy rainfall as a threat to agricultural areas Risk of floods from heavy rainfall as a threat to human health Risk of floods from heavy rainfall as a threat to human life Risk of floods from heavy rainfall as a threat to residential structures Risk of floods from heavy rainfall as a threat to city infrastructure Risk of floods from heavy rainfall as a threat to material possessions Risk of floods from heavy rainfall as a threat to the occurrence of secondary events (erosion, landslides, rockfalls, etc.) Risk of floods from heavy rainfall as a threat to tourism Risk of floods from heavy rainfall as a threat to cultural heritage
- F2 Anthropogenic and F3 Natural Causes of Pluvial Floods
- 5.
- On a scale of 1 to 5, please rate what you believe is the leading cause of pluvial floods (1—completely disagree; 2—disagree; 3—neither agree nor disagree; 4—agree; 5—agree entirely)
1 2 3 4 5 Urbanisation Excessive concrete development Lack of green spaces Insufficient pumping stations Absence of a stormwater drainage system Lack of maintenance of stormwater drainage systems Outdated stormwater drainage system Population density Natural and artificial water flow barriers Topographic conditions Soil Lack of investments in drainage systems Climate change
- 6.
- In your opinion, during which season is the greatest risk for pluvial floods?1□ Spring 2□ Summer 3□ Autumn 4□ Winter
- 7.
- Which city district or street in your town is particularly vulnerable to pluvial floods?____________________________________________________________________
- F4 Consequences of Pluvial Floods in the Future
- 8.
- On a scale of 1 to 5, please rate your agreement with the occurrence of the following statements. (1—strongly disagree, 2—disagree, 3—neither agree nor disagree, 4—agree, 5—strongly agree)
1 2 3 4 5 In the next ten years, the frequency of heavy rainfall in my area will increase. The material damages caused by heavy rainfall in my area will increase in the next ten years. In the next ten years, I expect material damage to my property due to the consequences of rainfall. In the next ten years, the awareness of pluvial floods among the population will increase. In the next 10 years, greater financial resources will be invested in improving, preventing, and protecting against pluvial floods.
- F5 Preparedness for Pluvial Floods
- 9.
- How much do you agree with the statement that citizens can take private initiatives to reduce the risk of pluvial floods?(1—Strongly disagree, 2—Disagree, 3—Neither agree nor disagree, 4—Agree, 5—Strongly agree)1□ 2□ 3□ 4□ 5□
- 10.
- Which of the listed measures for mitigating pluvial floods is most necessary?□ Changes in the legislative framework in spatial planning documentation during the construction of residential buildings and infrastructure (e.g., elevating structures to a higher level, increasing the proportion of undeveloped green areas around buildings, mandatory construction of drainage channels, etc.)□ Amendments to the Water Act and related sub-legislation□ Construction of a rainwater drainage system for the entire city area□ Construction of stormwater grates along roadways□ Utilization of green infrastructure measures (stormwater wells, green roofs, rain gardens, etc.)□ Optimization of a combination of construction and non-construction measures□ More frequent maintenance and cleaning of the existing stormwater drainage system□ Other ___________________________________________
- 11.
- Do you believe conducting education and information campaigns for citizens about pluvial floods is necessary? 1□ YES 2□ NO
- 12.
- Would you invest more personal financial resources every month to improve the stormwater drainage system in your city? 1□ YES 2□ NO
- 13.
- Would you convert a part of your concrete/asphalt-covered backyard into a green or permeable surface to reduce stormwater runoff? 1□ YES 2□ NO
- 14.
- Your previous experience with pluvial floods has been:□ Directly (I have personally been affected by a flood)□ Indirectly (I know people from the city who have been affected by a flood)□ I have no experience
- 15.
- In the last ten years, have you taken measures to prevent and protect your property against the possibility of pluvial floods?□ YES □ NO
- 16.
- Has any damage from pluvial floods on your property in the last ten years?□ YES □ NO
- 17.
- Has any damage from pluvial floods to the infrastructure near your residential property in the last ten years?□ YES □ NO
- 18.
- To what extent do pluvial floods affect your quality of life:(1—Not at all, 2—Do not affect, 3—Neither affect nor do not affect, 4—Affect, 5—Completely affect)1□ 2□ 3□ 4□ 5□
- 19.
- Is your property insured against damage caused by flooding?□ YES □ NO
- 20.
- How much money have you invested in the last five years to prevent and protect your property against the possibility of pluvial floods?□ 0 HRK □ 1–150 EUR □ 150–700 EUR □ more than 700 EUROn a scale from 1 to 5, rate how informed you are on behaving during a pluvial flood.(1—Insufficient, 2—Adequate, 3—Good, 4—Very good, 5—Excellent)1□ 2□ 3□ 4□ 5□
- 21.
- On a scale of 1 to 5, rate the extent you agree with the given statements (1—completely disagree, 5—agree entirely).
1 2 3 4 5 1. Can you defend yourself independently against pluvial floods? 2. Are your fellow citizens aware of the danger of pluvial floods? 3. Is there a developed flood defence system for your city? 4. Will the local community help you in the event of damage caused by pluvial floods? 5. Are local authorities sufficiently engaged in informing the population about the danger of pluvial floods? 6. Is the responsibility for flood defence on the individual? 7. Is the responsibility for flood defence on the local community? 8. Have decision-makers taken all necessary measures regarding protection from pluvial floods? 9. Is there sufficient drainage manholes, channels, drains, grids, etc., installed in your street? 10. Does the flood early warning system need improvement? 11. Does the evacuation of stormwater to the ultimate recipient (watercourse, sea, lake) need improvement? 12. Is the construction of retention basins and other structures (e.g., stormwater rotors) needed? 13. Is the implementation of structural measures needed (reconstruction, construction of levees, channels, retention basins, river remediation, riverbed regulation, etc.)? 14. Is the implementation of non-structural measures needed (planning, design, preparedness measures, environmental issues, financing, etc.)? 15. Is it necessary to identify priority areas susceptible to pluvial floods? 16. Is a flood risk management plan, hazard map, and other relevant documentation needed to inform citizens about preparation and recovery from pluvial floods?
- Socio-demographic data
- 22.
- Gender: 1□ Female 2□ Male
- 23.
- Age:□ 0–14□ 15–59□ >60
- 24.
- Education:□ No formal education 3□ elementary education□ secondary education□ undergraduate studies□ graduate studies or equivalent□ doctoral education
- 25.
- Employment status:1□ Employed 2□ Unemployed 3□ Retired 4□ Student
- 26.
- Monthly household income:□ Up to 530 EUR□ 530 to 560 EUR□ 560 to 1600 EUR□ 210 to 2100 EUR□ 2100 to 2700 EUR□ More than 2700 EUR□ Prefer not to answer
- 27.
- According to its purpose, the property you live in is:□ Residential□ Residential and commercial (business space)□ Residential and agricultural (for renting)□ Residential, commercial, and agricultural
- 28.
- Your housing status is:□ Owner/buyer of property without a mortgage/loan□ Owner/heir of property without a mortgage/loan□ Tenant, paying rent to a private individual□ Accommodation without paying rent (at parents’, partner’s, etc.)□ Owner/buyer with a mortgage/loan□ Tenant paying rent in a social/municipal apartment□ Other
- 29.
- Does your residential property have a basement? 1□ YES 2□ NO
- 30.
- You live:□ On the ground floor□ On the first floor□ On the third floor or higher
- 31.
- At your property, the predominant infrastructure is:□ Green infrastructure (all types of green areas)□ Gray infrastructure (parking lots, paved areas, garages, etc.)
References
- Banholzer, S.; Kossin, J.; Donner, S. The Impact of Climate Change on Natural Disaster. In Reducing Disaster: Early Warning Systems for Climate Change; Dordrecht, The Netherlands, 2014; ISBN 978-94-017-8597-6. pp. 21–49. Available online: https://eprints.gla.ac.uk/162145/ (accessed on 24 October 2023).
- The Potential Impacts of Climate Variability and Change on Health Impacts of Extreme Weather Events in the United States. Environmental Health Perspectives. Volume 109, No. Suppl. 2. Available online: https://ehp.niehs.nih.gov/doi/abs/10.1289/ehp.109-1240666 (accessed on 8 January 2024).
- Trenberth, K.E. Changes in Precipitation with Climate Change. Clim. Res. 2011, 47, 123–138. [Google Scholar] [CrossRef]
- Houston, D.; Werritty, A.; Bassett, D.; Geddes, A.; Hoolachan, A.; McMillan, M. Pluvial (Rain-Related) Flooding in Urban Areas: The Invisible Hazard; Joseph Rowntree Foundation: London, UK, 2011. [Google Scholar]
- Di Salvo, C.; Ciotoli, G.; Pennica, F.; Cavinato, G.P. Pluvial Flood Hazard in the City of Rome (Italy). J. Maps 2017, 13, 545–553. [Google Scholar] [CrossRef]
- Francipane, A.; Pumo, D.; Sinagra, M.; La Loggia, G.; Noto, L.V. A Paradigm of Extreme Rainfall Pluvial Floods in Complex Urban Areas: The Flood Event of 15 July 2020 in Palermo (Italy). Nat. Hazards Earth Syst. Sci. 2021, 21, 2563–2580. [Google Scholar] [CrossRef]
- Siljeg, S.; Milosevic, R.; Pandja, L. Public Perception of the Urban Pluvial Floods Risk-Case Study of Porec (Croatia). J. Geogr. Inst. Jovan Cvijic SASA 2022, 72, 147–158. [Google Scholar] [CrossRef]
- Feng, Y.; Sester, M. Extraction of Pluvial Flood Relevant Volunteered Geographic Information (VGI) by Deep Learning from User Generated Texts and Photos. ISPRS Int. J. Geo-Inf. 2018, 7, 39. [Google Scholar] [CrossRef]
- Krvavica, N.; Šiljeg, A.; Horvat, B.; Panđa, L. Pluvial Flash Flood Hazard and Risk Mapping in Croatia: Case Study in the Gospić Catchment. Sustainability 2023, 15, 1197. [Google Scholar] [CrossRef]
- Netzel, L.M.; Heldt, S.; Engler, S.; Denecke, M. The Importance of Public Risk Perception for the Effective Management of Pluvial Floods in Urban Areas: A Case Study from Germany. J. Flood Risk Manag. 2021, 14, e12688. [Google Scholar] [CrossRef]
- Douglas, I.; Garvin, S.; Lawson, N.; Richards, J.; Tippett, J.; White, I. Urban Pluvial Flooding: A Qualitative Case Study of Cause, Effect and Nonstructural Mitigation: Urban Pluvial Flooding. J. Flood Risk Manag. 2010, 3, 112–125. [Google Scholar] [CrossRef]
- Pham, B.T.; Phong, T.V.; Nguyen, H.D.; Qi, C.; Al-Ansari, N.; Amini, A.; Ho, L.S.; Tuyen, T.T.; Yen, H.P.H.; Ly, H.-B.; et al. A Comparative Study of Kernel Logistic Regression, Radial Basis Function Classifier, Multinomial Naïve Bayes, and Logistic Model Tree for Flash Flood Susceptibility Mapping. Water 2020, 12, 239. [Google Scholar] [CrossRef]
- Swain, K.C.; Singha, C.; Nayak, L. Flood Susceptibility Mapping through the GIS-AHP Technique Using the Cloud. ISPRS Int. J. Geo-Inf. 2020, 9, 720. [Google Scholar] [CrossRef]
- Khosravi, K.; Shahabi, H.; Pham, B.T.; Adamowski, J.; Shirzadi, A.; Pradhan, B.; Dou, J.; Ly, H.-B.; Gróf, G.; Ho, H.L.; et al. A Comparative Assessment of Flood Susceptibility Modeling Using Multi-Criteria Decision-Making Analysis and Machine Learning Methods. J. Hydrol. 2019, 573, 311–323. [Google Scholar] [CrossRef]
- Siegrist, M.; Gutscher, H. Natural Hazards and Motivation for Mitigation Behavior: People Cannot Predict the Affect Evoked by a Severe Flood. Risk Anal. 2008, 28, 771–778. [Google Scholar] [CrossRef]
- Renn, O. Concepts of Risk: An Interdisciplinary Review Part 1: Disciplinary Risk Concepts. GAIA Ecol. Perspect. Sci. Soc. 2008, 17, 50–66. [Google Scholar] [CrossRef]
- Brilly, M.; Polic, M. Public Perception of Flood Risks, Flood Forecasting and Mitigation. Nat. Hazards Earth Syst. Sci. 2005, 5, 345–355. [Google Scholar] [CrossRef]
- Birkholz, S.; Muro, M.; Jeffrey, P.; Smith, H.M. Rethinking the Relationship between Flood Risk Perception and Flood Management. Sci. Total Environ. 2014, 478, 12–20. [Google Scholar] [CrossRef]
- Oubennaceur, K.; Chokmani, K.; Lessard, F.; Gauthier, Y.; Baltazar, C.; Toussaint, J.-P. Understanding Flood Risk Perception: A Case Study from Canada. Sustainability 2022, 14, 3087. [Google Scholar] [CrossRef]
- Pluvial Flooding: New Approaches in Flood Warning, Mapping and Risk Management—Falconer—2009—Journal of Flood Risk Management—Wiley Online Library. Available online: https://onlinelibrary.wiley.com/doi/full/10.1111/j.1753-318X.2009.01034.x?casa_token=nZkPaijH2lEAAAAA%3AGpFyBWauNGYfmi39SRY4u2lcBzbRXxtWnJoWml0EAnZ5cNLdtZoeAfGGfZG_Wf_MM2bWGAHrBF-ncLQ04A (accessed on 8 January 2024).
- Kellens, W.; Terpstra, T.; De Maeyer, P. Perception and Communication of Flood Risks: A Systematic Review of Empirical Research. Risk Anal. 2013, 33, 24–49. [Google Scholar] [CrossRef]
- Schmitt, T.G.; Scheid, C. Evaluation and Communication of Pluvial Flood Risks in Urban Areas. WIREs Water 2020, 7, e1401. [Google Scholar] [CrossRef]
- Lechowska, E. What Determines Flood Risk Perception? A Review of Factors of Flood Risk Perception and Relations between Its Basic Elements. Nat. Hazards 2018, 94, 1341–1366. [Google Scholar] [CrossRef]
- Pagneux, E.; Gísladóttir, G.; Jónsdóttir, S. Public Perception of Flood Hazard and Flood Risk in Iceland: A Case Study in a Watershed Prone to Ice-Jam Floods. Nat. Hazards 2011, 58, 269–287. [Google Scholar] [CrossRef]
- Cibilić, A.; Barbalić, D.; Rubinić, J.; Karleuša, B.; Krvavica, N. Heavy Rain Flood Risk Management—RAINMAN Project. 2019. Available online: https://www.researchgate.net/publication/333747035_Heavy_Rain_Flood_Risk_Management_-_RAINMAN_Project (accessed on 24 October 2023).
- Popis 2021. Available online: https://dzs.gov.hr/naslovna-blokovi/u-fokusu/popis-2021/88 (accessed on 24 October 2023).
- Pejnović, D. Režim tekućica kao indikator općih hidrogeografskih obilježja Like. Hrvat. Geogr. Glas. 1991, 53, 41–55. [Google Scholar]
- Pejnović, D. Prilog poznavanju obilježja klime i klimatska regionalizacija Like. Acta Geogr. Croat. 1990, 25, 1–21. [Google Scholar]
- Cronbach, L.J. Coefficient Alpha and the Internal Structure of Tests. Psychometrika 1951, 16, 297–334. [Google Scholar] [CrossRef]
- Mishra, P.; Pandey, C.; Singh, U.; Gupta, A.; Sahu, C.; Keshri, A. Descriptive Statistics and Normality Tests for Statistical Data. Ann. Card. Anaesth. 2019, 22, 67. [Google Scholar] [CrossRef]
- Domazetović, F.; Šiljeg, A.; Lončar, N.; Marić, I. Development of Automated Multicriteria GIS Analysis of Gully Erosion Susceptibility. Appl. Geogr. 2019, 112, 102083. [Google Scholar] [CrossRef]
- Vojtek, M.; Vojteková, J. Flood Susceptibility Mapping on a National Scale in Slovakia Using the Analytical Hierarchy Process. Water 2019, 11, 364. [Google Scholar] [CrossRef]
- Lin, L.; Wu, Z.; Liang, Q. Urban Flood Susceptibility Analysis Using a GIS-Based Multi-Criteria Analysis Framework. Nat. Hazards 2019, 97, 455–475. [Google Scholar] [CrossRef]
- Šiljeg, A.; Šiljeg, S.; Milošević, R.; Marić, I.; Domazetović, F.; Panđa, L. Multi-Hazard Susceptibility Model Based on High Spatial Resolution Data—A Case Study of Sali Settlement (Dugi Otok, Croatia). Environ. Sci. Pollut. Res. 2023. [Google Scholar] [CrossRef]
- Lin, J.; Zhang, W.; Wen, Y.; Qiu, S. Evaluating the Association between Morphological Characteristics of Urban Land and Pluvial Floods Using Machine Learning Methods. Sustain. Cities Soc. 2023, 99, 104891. [Google Scholar] [CrossRef]
- Gudiyangada Nachappa, T.; Tavakkoli Piralilou, S.; Gholamnia, K.; Ghorbanzadeh, O.; Rahmati, O.; Blaschke, T. Flood Susceptibility Mapping with Machine Learning, Multi-Criteria Decision Analysis and Ensemble Using Dempster Shafer Theory. J. Hydrol. 2020, 590, 125275. [Google Scholar] [CrossRef]
- Haque, M.N.; Siddika, S.; Sresto, M.A.; Saroar, M.M.; Shabab, K.R. Geo-Spatial Analysis for Flash Flood Susceptibility Mapping in the North-East Haor (Wetland) Region in Bangladesh. Earth Syst. Environ. 2021, 5, 365–384. [Google Scholar] [CrossRef]
- Choudhury, K.N.; Yabar, H.; Mizunoya, T. GIS and Remote Sensing-Based Spatiotemporal Analysis of Cumulative Flood Risk over Bangladesh’s National Highways. Asia-Pac. J. Reg. Sci. 2022, 6, 335–364. [Google Scholar] [CrossRef]
- Arabameri, A.; Saha, S.; Chen, W.; Roy, J.; Pradhan, B.; Bui, D.T. Flash Flood Susceptibility Modelling Using Functional Tree and Hybrid Ensemble Techniques. J. Hydrol. 2020, 587, 125007. [Google Scholar] [CrossRef]
- Conforti, M.; Aucelli, P.P.C.; Robustelli, G.; Scarciglia, F. Geomorphology and GIS Analysis for Mapping Gully Erosion Susceptibility in the Turbolo Stream Catchment (Northern Calabria, Italy). Nat. Hazards 2011, 56, 881–898. [Google Scholar] [CrossRef]
- North, M.A. A Method for Implementing a Statistically Significant Number of Data Classes in the Jenks Algorithm. In Proceedings of the 2009 Sixth International Conference on Fuzzy Systems and Knowledge Discovery, Tianjin, China, 14–16 August 2009; Volume 1, pp. 35–38. [Google Scholar]
- Croatian Bureau of Statistics. Popis stanovništva 2021 [Census 2021]. 2021. Available online: https://popis2021.hr/ (accessed on 24 October 2023).


| Jan | Feb | Mar | Apr | May | Jun | Jul | Aug | Sep | Oct | Nov | Dec | |
|---|---|---|---|---|---|---|---|---|---|---|---|---|
| Air temperature | ||||||||||||
| Mean [C°] | −1.7 | −0.3 | 3.9 | 8.5 | 13.2 | 16.9 | 19.1 | 18.4 | 14.1 | 9.3 | 4.5 | 0.2 |
| Precipitation | ||||||||||||
| Total (mm) | 114.5 | 114.4 | 111.1 | 118.8 | 109.7 | 95.5 | 71 | 82.4 | 134.7 | 185.6 | 191.1 | 165.8 |
| Max snow (cm) | 105 | 285 | 110 | 62 | 24 | - | - | - | 3 | 25 | 95 | 100 |
| FD | LC | SLO | PLAN | RD | SD | DD | TWI | TRI | SPI | NDVI | ELV | wok | |
|---|---|---|---|---|---|---|---|---|---|---|---|---|---|
| FD | 1 | 2 | 2 | 3 | 3 | 3 | 4 | 8 | 8 | 8 | 8 | 9 | 0.241 |
| LC | 1/2 | 1 | 1 | 1 | 2 | 2 | 2 | 3 | 5 | 5 | 5 | 5 | 0.129 |
| SLO | 1/2 | 1 | 1 | 2 | 2 | 2 | 3 | 3 | 3 | 4 | 4 | 7 | 0.135 |
| PLAN | 1/3 | 1 | 1/2 | 1 | 1 | 1 | 2 | 3 | 2 | 3 | 4 | 5 | 0.092 |
| RD | 1/3 | 1/2 | 1/2 | 1 | 1 | 1 | 2 | 3 | 3 | 3 | 3 | 5 | 0.086 |
| SD | 1/3 | 1/2 | 1/2 | 1 | 1 | 1 | 3 | 5 | 7 | 9 | 3 | 5 | 0.117 |
| DD | 1/4 | 1/2 | 1/3 | 1/2 | 1/2 | 1/3 | 1 | 2 | 3 | 3 | 2 | 3 | 0.057 |
| TWI | 1/8 | 1/3 | 1/3 | 1/3 | 1/3 | 1/5 | 1/2 | 1 | 2 | 2 | 1 | 3 | 0.038 |
| TRI | 1/8 | 1/5 | 1/3 | 1/2 | 1/3 | 1/7 | 1/3 | 1/2 | 1 | 3 | 1 | 2 | 0.033 |
| SPI | 1/8 | 1/5 | 1/4 | 1/3 | 1/3 | 1/9 | 1/3 | 1/2 | 1/3 | 1 | 1 | 2 | 0.025 |
| NDVI | 1/8 | 1/5 | 1/4 | 1/4 | 1/3 | 1/3 | 1/2 | 1 | 1 | 1 | 1 | 1 | 0.028 |
| ELV | 1/8 | 1/5 | 1/7 | 1/5 | 1/5 | 1/5 | 1/3 | 1/3 | 1/2 | 1/2 | 1 | 1 | 0.019 |
| 1 | |||||||||||||
| λmax | 12.603 | ||||||||||||
| CI | 0.055 | ||||||||||||
| CR | 0.036 |
| F1 | F2 | F3 | F4 | F5 | |
|---|---|---|---|---|---|
| Mean | 2.77 | 3.32 | 3.06 | 2.91 | 3.13 |
| Sd | 0.999 | 0.75 | 0.897 | 0.95 | 0.539 |
| Minimum | 1 | 1.56 | 1.6 | 1 | 1.69 |
| Maximum | 5 | 5 | 5 | 4.4 | 4.81 |
| Cronbach′s α | 0.913 | 0.761 | 0.676 | 0.765 | 0.72 |
| Factor | Kolmogorov-Smirnova | Shapiro-Wilk | ||||
|---|---|---|---|---|---|---|
| Statistic | df | Sig. | Statistic | df | Sig. | |
| F1 Awareness | 0.095 | 64 | 0.200 * | 0.966 | 64 | 0.076 |
| F2 Anthropogenic caus. | 0.098 | 64 | 0.200 * | 0.983 | 64 | 0.53 |
| F3 Natural causes | 0.102 | 64 | 0.096 | 0.965 | 64 | 0.064 |
| F4 Consequences | 0.123 | 64 | 0.018 | 0.94 | 64 | 0.004 |
| F5 Preparedness | 0.096 | 64 | 0.200 * | 0.963 | 64 | 0.052 |
| Is your property insured against pluvial flood damage? | ||||||
| YES | NO | |||||
| N | % | N | % | |||
| Living floor | Ground | 8 | 29.6 | 23 | 62.2 | p = 0.028 |
| 1st floor | 16 | 59.3 | 13 | 35.1 | df = 2 | |
| 3d floor | 3 | 11.1 | 1 | 2.7 | χ2 = 7.181 | |
| Total | 27 | 100 | 37 | 100 | ||
| Would you transform your concreted part of the yard into a green surface to increase infiltration? | ||||||
| Surrounding infrastructure | Green areas | 30 | 88.2 | 14 | 46.7 | p = 0.000 |
| Impermeable | 4 | 11.8 | 16 | 53.3 | df = 1 | |
| Total | 34 | 100 | 30 | 100 | χ2 = 12.818 | |
| Do you live in an area highly susceptible to PF? | ||||||
| Property elevation | Lowland | 5 | 31.2 | 0 | 0 | p = 0.000 |
| Moderately elevated | 2 | 12.5 | 18 | 38 | df = 2 | |
| Hilly terrain | 9 | 56.3 | 30 | 63 | χ2 = 17.477 | |
| Total | 16 | 100 | 48 | 100 | ||
| Chi square | ||||||
Disclaimer/Publisher’s Note: The statements, opinions and data contained in all publications are solely those of the individual author(s) and contributor(s) and not of MDPI and/or the editor(s). MDPI and/or the editor(s) disclaim responsibility for any injury to people or property resulting from any ideas, methods, instructions or products referred to in the content. |
© 2024 by the authors. Licensee MDPI, Basel, Switzerland. This article is an open access article distributed under the terms and conditions of the Creative Commons Attribution (CC BY) license (https://creativecommons.org/licenses/by/4.0/).
Share and Cite
Šiljeg, S.; Milošević, R.; Mamut, M. Pluvial Flood Susceptibility in the Local Community of the City of Gospić (Croatia). Sustainability 2024, 16, 1701. https://doi.org/10.3390/su16041701
Šiljeg S, Milošević R, Mamut M. Pluvial Flood Susceptibility in the Local Community of the City of Gospić (Croatia). Sustainability. 2024; 16(4):1701. https://doi.org/10.3390/su16041701
Chicago/Turabian StyleŠiljeg, Silvija, Rina Milošević, and Marica Mamut. 2024. "Pluvial Flood Susceptibility in the Local Community of the City of Gospić (Croatia)" Sustainability 16, no. 4: 1701. https://doi.org/10.3390/su16041701
APA StyleŠiljeg, S., Milošević, R., & Mamut, M. (2024). Pluvial Flood Susceptibility in the Local Community of the City of Gospić (Croatia). Sustainability, 16(4), 1701. https://doi.org/10.3390/su16041701