1. Introduction
Since 2016, the shared micro-mobility industry in China has entered an early stage of rapid expansion. In pursuit of short-term profitability, most enterprises have adopted an extensive expansion strategy but have neglected the systematic operation and planning management of their product lines [
1]. Excessive vehicle deployments and chaotic product operations have led to the occupation and waste of urban resources, thus negatively affecting users’ travel experience as well as the sustainability of urban transportation. In addition, at this stage, most shared mobility products in the market are too homogeneous in terms of their designs and services, without paying full attention to the experience and diversified needs of users and therefore weakening the attractiveness and user stickiness of enterprises’ services. As a result, since 2020, the shared micro-mobility industry has begun to pay more attention to the diversified demands of users, with a focus on the standardization, efficiency, and environmental sustainability of urban mobility, indicating that this industry is gradually entering the post-sharing era [
2]. In this era, the focus of the shared micro-mobility industry has shifted from acquiring more market shares to seeking stable development, and enterprises are placing more emphasis on the precision of customer services and market operations. Thus, the shared micro-mobility industry has gradually entered a benign and stable development stage.
Micro-mobility means include human-powered and electric-assisted vehicles such as bicycles, e-bikes, smart e-vehicles, scooters, and motorized scooters, as well as skateboards, single-wheeled balance boards, and four-wheeled motorized micro-vehicles [
3]. According to “The 2023 Analysis Report on Transportation in China’s Major Cities”, during the period 2017–2022, the total average daily travel demand of Chinese residents gradually hiked, with two-wheeled vehicles and other micro-vehicles accounting for a higher percentage of the demand than private cars and public transportation vehicles; thus, two-wheeled vehicles and other micro-vehicles have become some of the main travel modes for urban residents in China [
4]. As an important aspect of micro-transportation modes, shared mobility has seen increasingly more numbers and varieties of its products following continuous iteration and development. It is expected that by 2025, the number of shared motorcycles deployed across China will reach 7.945 million, and this market’s size will be boosted accordingly, hopefully reaching 43.50 billion yuan [
5]. Compared with traditional private transportation tools, shared micro-mobility can deliver a more convenient and flexible travel experience, addressing users’ pain points more effectively in 2–10 km short- and medium-distance travels; thus, it is widely welcomed by urban residents. In addition, traffic vehicles for shared micro-mobility can better meet national green and carbon-reduction policies, thus gradually growing into an important driving force behind the transformation and sustainable development of urban transportation.
Certain research results have been acquired in the field of micro-mobility. Bozzi et al. produced a systematical retrospective study on the impacts of micro-mobility on urban transportation and the environment [
6]. Jaber et al. investigated the preference factors influencing users’ choice of micro-mobility from the perspective of social demographic variables [
7]. Eccarius et al., through an examination of user behavioral psychology, demonstrated that a lack of personal values and mobility needs may reduce students’ intention to use green transportation services [
8]. In addition, research has been conducted on such issues as the operation, safety, and subjective well-being related to shared micro-mobility [
9,
10]. However, the existing research on shared micro-mobility predominantly focuses on specific areas such as user behavior characteristics or corporate operations, lacking a comprehensive exploration of factors influencing shared micro-mobility satisfaction in the product dimension. Product perceived value, the core content of user satisfaction, has not been fully analyzed. Product perceived value is the user’s subjective perception of product value, which plays a key role in the evaluation of user satisfaction. In existing research, the satisfaction impact mechanism of the perceived value of shared micro-mobility products has not yet been fully explored from the user’s perspective. Shared micro-mobility should provide users with diversified service experiences, rather than just a single product [
8]. For the enterprises that provide shared services, an effective way to enhance user satisfaction is to provide diversified functions and a rich traveling experience [
9]. Under this premise, acquiring a deep understanding of users’ perceived values in the context of shared micro-mobility and revealing the influencing factors and deep mechanisms behind the perceived value and user satisfaction of products have become urgent requirements for making objective assessments of the development of shared micro-mobility and optimizing marketing strategies. This is also in alignment with the common requirement of delivering on the sustainable development of urban transportation.
This study is divided into two parts. In Research No. 1, we conducted text mining on user comments from five major shared micro-mobility apps and two social media apps in China. We collected comprehensive online comment data related to shared micro-mobility from January 2022 to June 2023. This nationwide dataset, distinct from traditional survey data, laid the foundation for establishing broad and objective thematic clustering. Subsequently, employing the latent dirichlet allocation (LDA) algorithm, which provides higher differentiation than traditional word frequency clustering methods, we performed a clustering analysis. This allowed us to further explore the key factors influencing user satisfaction (sub-topics) and to categorized them into four research topics constituting the product perceived value [
11]. In Study 2, building on the conclusions from Study 1, we expanded the content of the American Customer Satisfaction Index (ACSI) [
12]. We constructed a user satisfaction research model for the product perceived value of shared micro-mobility. Subsequently, we collected survey data through questionnaires and conducted empirical analysis using structural equation modeling (SEM) [
13,
14,
15], aiming for innovation in the field of research methods. Additionally, this study integrated the concept of perceived value into the product dimension of shared micro-mobility, conducting detailed research from four perspectives: product quality, user expectations, interaction experience, and subjective consciousness. Based on the final research results, some recommendations will be proposed for the design, development, marketing, and promotion of shared micro-mobility so as to boost the sustainability of urban transportation.
The rest of this paper is organized according to the following structure. The second section will review the relevant literature and illustrate the theoretical basis of this study. The third section concerns Research No. 1, which uses the LDA to explore the factors influencing the shared micro-mobility users’ satisfaction from online users’ comments. The fourth section concerns Research No. 2, which aims to validate the authenticity and intrinsic relationship of various topics in Research No. 1; based on the ASCI model, an empirical study will be conducted to examine the factors that may affect the satisfaction of shared micro-mobility users while exploring the underlying mechanisms that influence users’ continuous use of shared micro-mobility vehicles. And the fifth, sixth, and seventh sections will discuss the theoretical and practical implications of the findings of this study, as well as the limitations of this study and future research directions.
2. Literature Review
2.1. Micro-Mobility in the Background of Post-Sharing Era
The focus of academic research in the micro-mobility field is gradually becoming more refined and systematic. The evaluation of shared micro-mobility is a composite concept, with scholars conducting quantitative assessments by collecting a series of performance indicators from shared micro-mobility enterprises and comparing them with past performance standards [
16]. Additionally, researchers can deduce the evolution of future micro-transportation systems by studying data such as city user travel rates and shared vehicle routes [
17]. The mentioned studies primarily focus on evaluating the service quality of shared micro-mobility from a non-user perspective, and the indicators themselves do not provide specific qualitative results. Therefore, some scholars have constructed quality assessment models based on the user characteristics and service attributes of shared micro-mobility to assist companies in enhancing service quality from the user’s perspective [
18]. In the post-sharing era, an increasing number of studies are evaluating the product service experience of shared micro-mobility from the user’s perspective. How to obtain more authentic and accurate user subjective experiences has become a hot topic in research. In summary, the post-sharing era provides a new context and opportunity for researching the micro-mobility phenomena, and the continued development of micro-mobility services is a response to the diverse demands of urban commuters in the post-sharing era. With the advancement of science and technology, as well as society’s hiking concern over environmental protection, the travel modes in the post-sharing era will become more diversified as an important part of urban life [
19,
20]. The shared micro-mobility industry shall no longer rely on the blind expansion of resource scales; rather, they will have to address new market demands. Emphasizing the importance of research to user satisfaction is a key point in ensuring that these products can deliver continued success in a rapidly changing market environment. This will not only help meet the diverse needs of users in order to boost the growth of enterprises; they will also help raise the social recognition of shared micro-mobility and promote the development of sustainable urban transportation.
2.2. Shared Micro-Mobility Satisfaction
The existing research results have greatly advanced the benign development of shared micro-mobility in all aspects. However, for a travel field such as this, with a high degree of freedom and flexibility, it is very important to undertake comprehensive evaluation research on the experience of travel products and services. User satisfaction is one of the important standards by which to measure the experience of shared micro-mobility, and it is also a comprehensive indicator when surveying the economic and social benefits of travel; in addition, it plays a key role in allocating travel resources, improving the quality of travel services, and meeting users’ travel needs [
21]. In recent years, many scholars have researched user satisfaction in the urban transportation domain from various perspectives. Zhang et al. approached the study via the characteristics of public transportation operators, demonstrating the impact of factors such as passenger expectations and perceived value on user satisfaction [
22]. Fishman and Soltani, in contrasting bike-sharing with existing transportation modes, identified pricing and safety as crucial factors influencing user satisfaction [
23,
24]. However, existing research has predominantly explored the factors affecting and optimizing user satisfaction in shared micro-mobility from macro perspectives such as businesses or government, lacking the consideration of end-users’ perspectives and the assessment of comprehensive product value [
25]. Therefore, conducting a comprehensive evaluation of the product value in shared micro-mobility from the user’s perspective and subsequently exploring the underlying mechanisms of user satisfaction is imperative. When individuals utilize shared mobility tools such as bike-sharing, they are engaging with shared micro-mobility services and can be considered customers of shared micro-mobility enterprises. Presently, the American Customer Satisfaction Index (ACSI) stands as the most widely applied model for measuring customer satisfaction. However, within the realm of shared micro-mobility research, there is a scarcity of studies examining satisfaction impact mechanisms from the user’s perspective. Therefore, our research is grounded in the American Customer Satisfaction Index (ACSI) theory, which is a comprehensive evaluation index for customer satisfaction with perceived value at its core, based on the process of product and service consumption. It encompasses six variables: customer expectations, perceived quality, perceived value, customer satisfaction, customer complaints, and customer loyalty [
13]. Building on the ACSI framework, Ibrahim et al. utilized structural equation modeling (SEM) to explore factors influencing passengers’ satisfaction with monorail services and their willingness to continue using the service [
26]. Chen et al., based on ACSI, constructed a research model involving heritage perception value, perceived enjoyment, visit satisfaction, and post-visit behavioral intentions, validating it through SEM [
27]. Although ACSI has been maturely applied in customer satisfaction research, with high academic authority and wide applicability, it has been little implemented in the field of micro-mobility; moreover, in-depth research is still required for the theoretical interpretation of the current comments or reviews of shared micro-mobility users. Hence, it is possible to make appropriate adjustments to the ACSI to construct a shared micro-mobility user satisfaction model, aligning it more closely with the practicalities of the research. Furthermore, the utilization of SEM or path analysis to analyze the relationships between satisfaction or service quality and various attributes has become increasingly popular [
28,
29].
2.3. A Study of User Satisfaction Based on Online Reviews
With regard to the research on the evaluation of user satisfaction, the existing literature generally adopts certain qualitative (e.g., the grounded theory) and quantitative (e.g., questionnaire surveys) methods to identify the factors influencing satisfaction, along with the dimensions of such factors. However, such methods tend to be operated in a costly manner, while collecting only limited samples, and the limited information from closed questions cannot provide rich data for more complex analyses [
30]. In recent years, therefore, with the rapid development of Internet technology, academic results related to user-generated content (UGC) have increased significantly, and online reviews have gained widespread attention as an important component of UGC. UGC not only encompasses a broad range of factual information but also indirectly reflects the emotional needs of the commentators [
31]. Dong and Kim, among others, have revealed the importance of online reviews in the hotel industry, and their studies have found that the information on customer experience showcased in online reviews is crucial for enhancing user satisfaction of hotel services [
32,
33]. Guo et al. have collected online reviews on rental apartments from social media and assessed the occupants’ satisfaction via topic modeling and sentiment analysis [
34]. As a kind of text data, online reviews have such characteristics as easy retrieval, wide range, low cost, and objectivity. With the feature of big data, online reviews contain a huge amount of valuable information, so they can effectively remedy the shortcomings of traditional econometric and statistical methods.
The vast textual data require further cluster analysis, and the latent dirichlet allocation (LDA) is a probabilistic model that utilizes topic modeling [
35,
36]. This topic model is capable of uncovering abstract themes latent in massive text and yields more distinctive results compared to traditional methods such as word frequency clustering statistics. Therefore, this study, based on the LDA model, conducts topic mining on online comment data to explore the dimensions of user evaluations and focal features regarding shared micro-mobility in the post-sharing era. Building on this, a research model for user satisfaction in Chinese shared micro-mobility is established based on the ACSI, and an SEM approach is employed to establish relevant quantitative models, conducting empirical research on the authenticity and correlation of these key factors. The overall research methodology framework is illustrated in
Figure 1.
3. Study 1: Exploring the Factors Based on Review Mining with Latent Dirichlet Allocation
In this section, the method of text mining is used to collect user reviews from shared micro-mobility platforms, and LDA is adopted to conduct clustering analysis on the results. The key factors affecting users’ satisfaction will be identified from the users’ perspective so as to lay the foundation for constructing a research model for shared micro-mobility users’ satisfaction in the next section.
3.1. Data
Taking the shared micro-mobility app platforms in China as the research object, this study collected online users’ reviews to identify relevant problems and concerns. In order to avoid the bias caused by narrow data, Python 3.8 was used to retrieve review contents from different shared micro-mobility app platforms, and reviews were also collected from third-party social media sites to enhance the diversity of the data. Specifically, this study selected data from two review channels in China: reviews by platform users and reviews on social media. And the following two principles were set for selecting appropriate target data sources: (1) the shared micro-mobility brands among the top 10 in terms of market shares; and (2) the social media presence of the top 10 in terms of user activity. Based on the above principles, two social media apps and five shared micro-mobility apps were finally selected. From Android and IOS app stores, five shared micro-mobility platform apps were screened outm namely, Hellobike, Meituan, Green Orange, Xiao Liu, and Song Guo, and the two social media platforms were Little Red Book and Zhi Hu. These apps have wide user coverage and a high utilization rate, and their data are publicly available. The apps can be downloaded from app stores for free. The user online comments from various platforms were selected from January 2022 to June 2023 (on social media platforms, keywords such as “shared mobility”, “bike-sharing”, and “electric scooter-sharing” were used for searching and collection). Considering that user comments, despite originating from different sources, represent the same type of subjective data, and that all online comments on various platforms are textual data, merging them directly enhances the generalizability of the results. A total of 7827 online reviews have been collected with Python. After de-duplication and screening of invalid reviews, a total of 6560 valid reviews were obtained, with some of them shown in
Table 1.
In order to perform topic clustering analysis in a better manner, a series of data preprocessing operations are required: (1) manually remove some invalid information, such as emoticons, symbol labels, blank fields, etc.; (2) jieba, a third-party open source Python 3.8 toolkit, is used to perform Chinese lexical segmentation so as to transform textual data into discrete words and provide a basis for the subsequent textual analysis and feature extraction; and (3) perform stopword processing so as to remove the words that appear frequently in the text but lack actual meanings, including conjunctions, auxiliaries, prepositions, and the like. Simultaneously, a custom lexicon was established, incorporating abbreviations such as “5G” and “GPS”. The above data preprocessing methods can effectively improve the effectiveness and accuracy of topic clustering. After three rounds of adjustment by using the above methods, the final word frequency statistics were acquired, as shown in
Table 2.
3.2. Methods
The word frequency results reflect the current hot topics that people are concerned about, but their distinctiveness and accuracy cannot be guaranteed. Therefore, we utilized the LDA for further cluster analysis of the vocabulary. The core idea of the LDA is to model the distribution of topics in a document as well as the distribution of words in a topic as random variables, and parameter estimation is performed through the observed text data so as to reveal the latent semantic structure in the text data. In the process of LDA modeling, the number of topics shall be set, and usually, the larger the volume of the text collection, the higher the number of topics. A large amount of practice and a large number of studies have proved that the topic-clustering effect of the LDA is directly related to the number of potential topics, and this number will directly affect the quality of the clustered document sets. In this paper, the perplexity degree, a widely used index, was used to determine the optimal number of topics. The perplexity degree is the deterministic judgment index when a model distinguishes topics, and it can demonstrate whether a model is applicable to new samples and whether a model can correctly distinguish topics [
35]. The calculation formula is as follows:
where
is the number of characters in the document;
is the length of document
; and
is the probability of a word in document
. If the model has a good classification effect for new samples as well, it will have a better generalization ability, and its value of perplexity will be small, and vice versa.
3.3. Topic Identification
The LDA was used to mine the implicit topic information from the text, and LDA analysis was performed through the sklearn library, a machine learning module in Python. The perplexity is calculated for different numbers of topics so as to determine the optimal number of topics.
Figure 2 shows how the perplexity changes with the number of topics.
As shown in the results, the value of perplexity will gradually decrease with the rising number of topics. And the perplexity’s decreasing rate will be lowered when the number of topics exceeds 20. Therefore, the optimal number of topics for the LDA model was determined to be 20, and the Dirichlet allocation parameters are set as α = 20/20 = 1 and β = 0.01. In addition, 20 topics were extracted by using the Gibbs sampling iteration method. After analyzing the extracted topics, it was revealed that some of the topics lacked practical significance or were not related to shared micro-mobility. Therefore, the topics were screened and named based on the word frequency results. Finally, this study identified 17 topics that are related to shared micro-mobility and have significance. The 17 potential topics were divided into dimensions to identify four prominent dimensions (research topics). The results of their affiliated topics and 10 keywords are shown in
Table 3.
3.4. Results
Through text mining online user reviews, Research No. 1 delineates four research topics affecting user satisfaction. Research Topic No. 1 is product quality, specifically including Topic 1 (comfort), Topic 2 (reliability), Topic 4 (aesthetics), and Topic 13 (stability), and the related review keywords are vehicle design, comfort, smoothness, battery life, reliability, etc. Research Topic No. 2 is user expectation, specifically including Topic 6 (safety standard), Topic 9 (brand image), Topic 10 (pricing strategy), Topic 15 (feedback handling), and Topic 17 (dispatch efficiency), and the related review keywords are ease of use, credibility, communication, scheduling, cost, etc. Research Topic No. 3 is interactive experience, specifically including Topic 3 (general-purpose), Topic 7 (social interaction), Topic 8 (ease of use), Topic 11 (technological innovation), and Topic 12 (software adaptability), and the related review keywords are ease of operation, update, intelligence, software, easy to understand, etc. Research Topic No. 4 is subjective consciousness, specifically including Topic 5 (health awareness), Topic 14 (Green motivation), and Topic 16 (self-identification), and the related review keywords include health, environmental protection, value, sustainability, habits, etc. After the clustering analysis of the online user reviews, the external variables of the model for the shared micro-mobility user satisfaction were enriched. In order to verify the objectivity of these factors and their interactions, Research No. 2 adopted the empirical method of a questionnaire survey.
4. Study 2: Empirical Test of Influencing Factors Based on American Customer Satisfaction Index
Based on the results of clustering the topics of user online reviews from Research No. 1, and in combination with product perceived value, this section will conduct SEM for shared micro-mobility user satisfaction on the basis of the ACSI and conduct empirical research through questionnaire data.
4.1. Construct Definition and Hypothesis Development
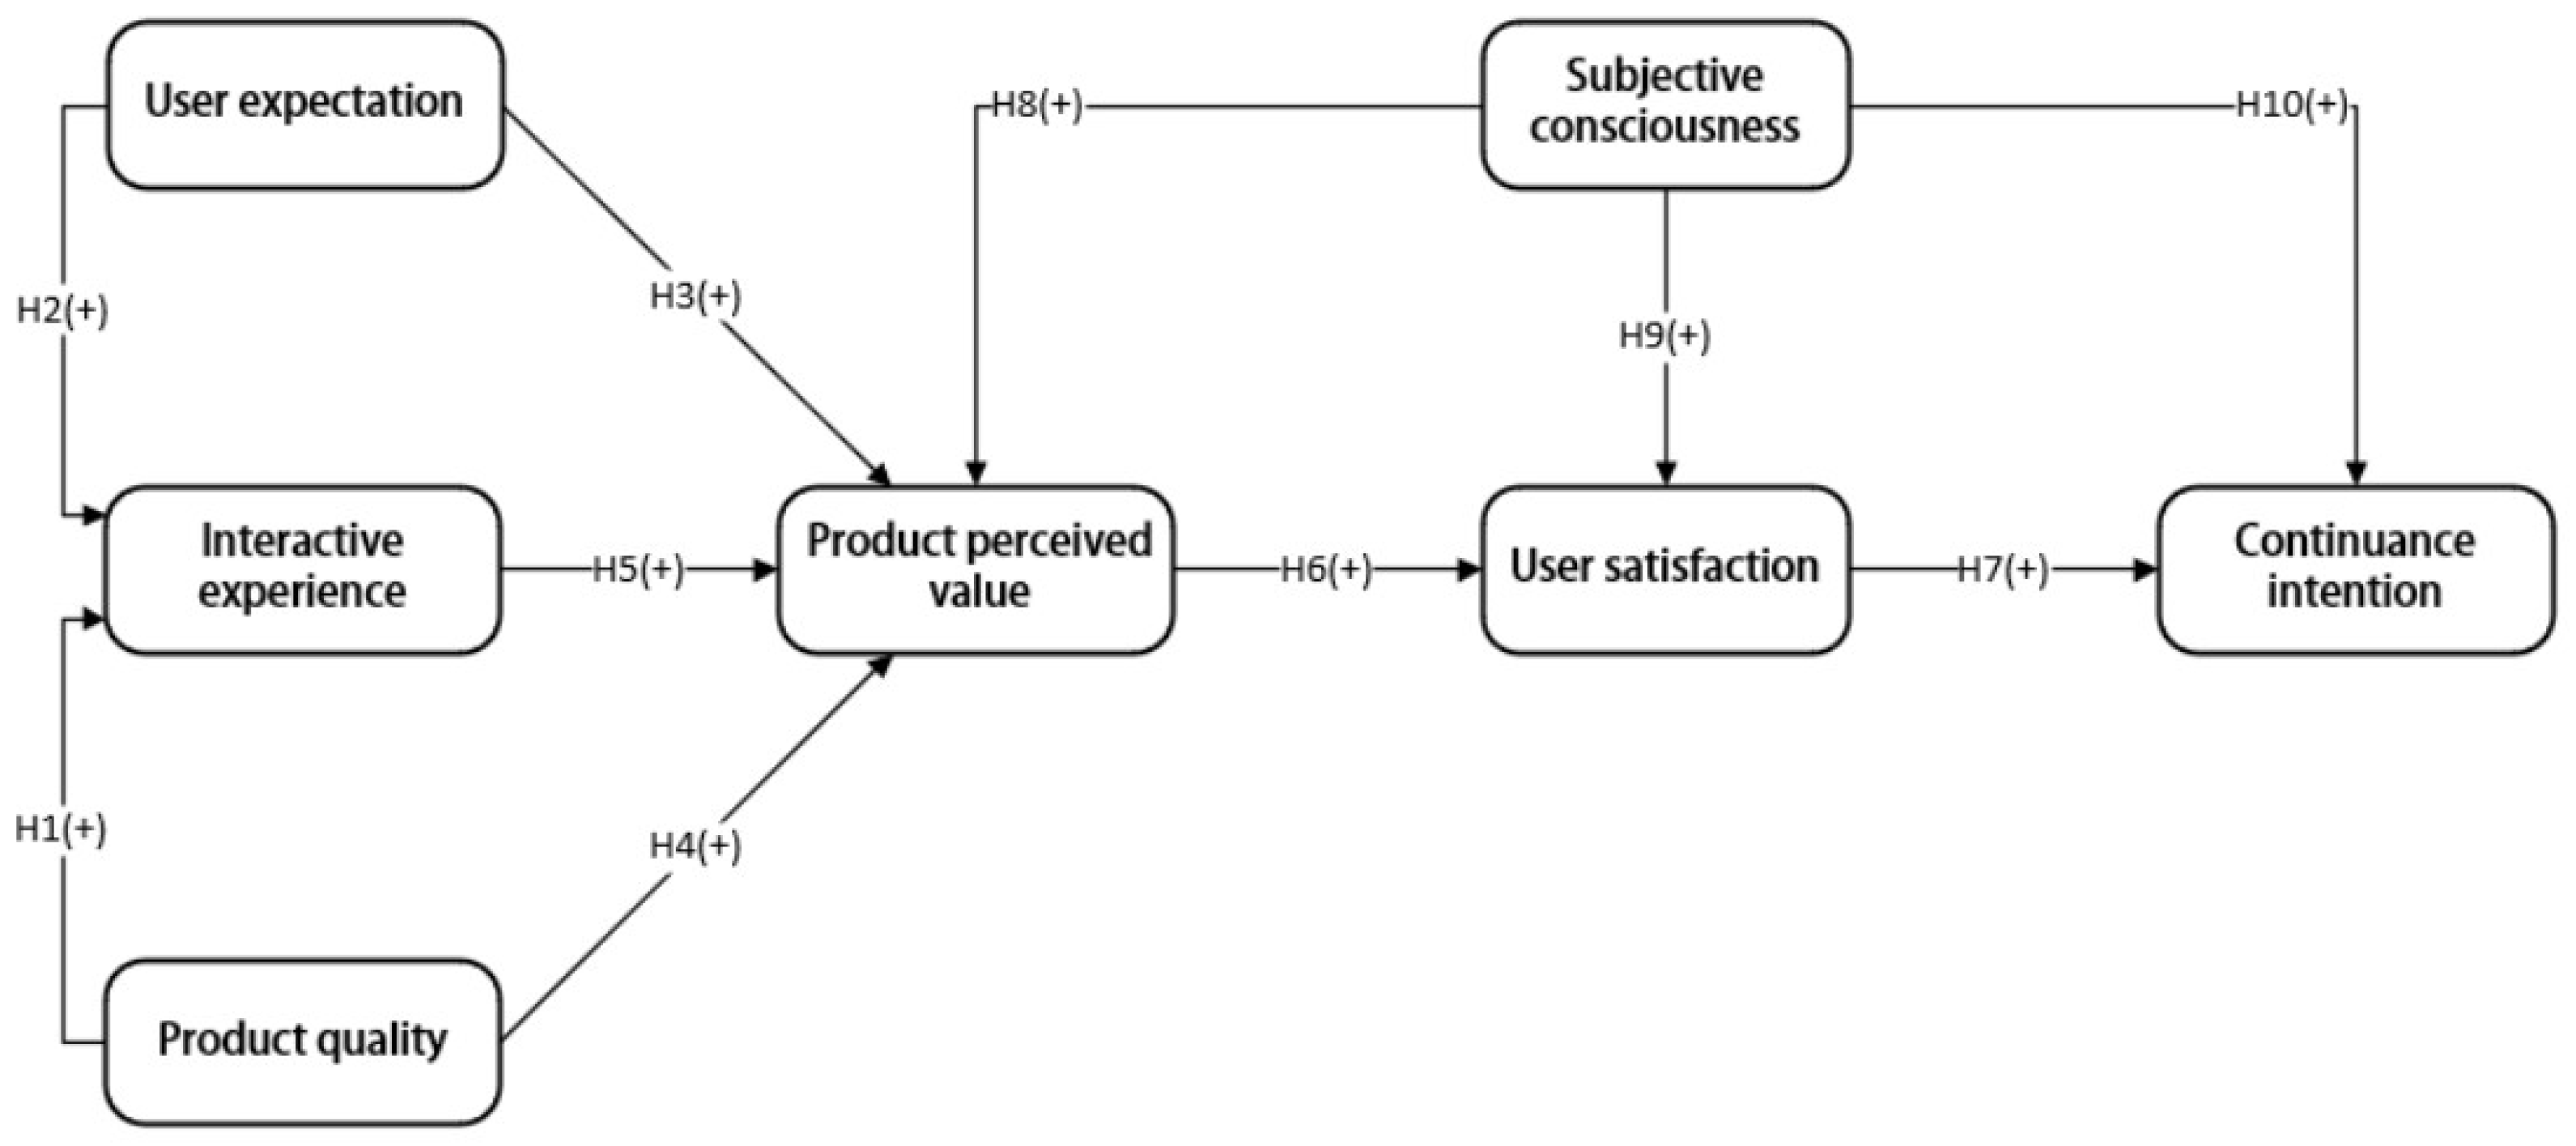
Based on the ACSI, this section proposes some research hypotheses which take the perceived value of products as the core influencing factor. The research model constructed for shared micro-mobility user satisfaction is shown in
Figure 3, which illustrates the paths of all hypotheses and their relevance. The details of these hypotheses are explained below.
- (1)
User expectation
User expectation is Research Topic No. 2, which refers to the overall expectation or hope that customers place on a product’s quality, service, etc., before the product is used and after it is experienced [
37]. Diehl and Meirovich et al. argued that in the field of micro-mobility, user expectation reflects people’s demand for convenient, efficient, and sustainable transportation solutions, and its relevant factors can influence satisfaction through emotional fluctuations [
38,
39]. This study finds that user expectation is closely related to satisfaction with micro-mobility services, involving such aspects as price rationality, service efficiency, and safety sense.
- (2)
Product quality
Product quality is Research Topic No. 1, which mainly reflects the actual feelings of users on the quality and performance of vehicles’ hardware. Lim and Ozkan et al. demonstrated that in daily consumption products, product quality has a significant positive impact on customers’ attitudes and satisfaction [
40,
41]. Agyeman et al. revealed a strong relationship between the perceived quality and school bus services’ accessibility, safety, efficiency, and other factors [
42]. As a hypothesis variable, product quality can not only help us understand users’ satisfaction with micro-mobility services but can also provide strong support for boosting service quality and promoting sustainable development in the micro-mobility sector.
- (3)
Interactive experience
Interactive experience is Research Topic No. 3, which refers to the sum of the interaction content that a person feels and obtains when using a product or accessing a service [
43]. The design of interactive experience was initially focused on the development and research of new products, aiming to enhance customers’ satisfaction and loyalty by boosting usefulness, ease of use, and enjoyment in the process of product interactions [
44,
45]. Michalco et al. found that before using a product, people would form some expectations about the experience, and users tend to compare the actual experience of a product with their expectations [
37]. This study believes that users’ expectations and the perceived quality of a product would have a certain impact on the interactive experience of the product.
- (4)
Product perceived value
Product perceived value is the overall evaluation of the utility of a product or service after users weigh the perceived benefits against the costs incurred in obtaining the product or service [
13]. Many scholars have also demonstrated that the perceived value takes the core position in users’ consumption decisions. Noble et al. emphasized three types of perceived value in the process of product design and development: rationality, kinesthesis, and emotion [
46]. In empirical research centered on perceived value, Fernandes et al. explored the design value proposition of product and service systems [
47]. This study argues that shared micro-mobility enterprises can effectively increase the user satisfaction and sustained use intention for their products by enhancing their perceived value [
48,
49], and this process is influenced by user expectations, product quality, and interactive experience. Therefore, the following hypotheses are proposed:
Hypothesis 1 (H1): Product quality has a significant positive impact on interactive experience.
Hypothesis 2 (H2): User expectation has a significant positive impact on interactive experience.
Hypothesis 3 (H3) : User expectation has a significant positive impact on product perceived value.
Hypothesis 4 (H4): Product quality has a significant positive impact on product perceived value.
Hypothesis 5 (H5): Interactive experience has a significant positive impact on product perceived value.
Hypothesis 6 (H6): Product perceived value has a significant positive impact on user satisfaction.
- (5)
User satisfaction
User satisfaction (US) refers to the subjective evaluation of users on an information system [
50]. In this study, it refers to the subjective feelings of users after they use and experience the functions and services of shared micro-mobility vehicles. In theoretical models about continuance intention, many scholars have also demonstrated the positive effect of satisfaction on continuance intention. This study believes that users’ satisfaction with shared micro-mobility will positively affect users’ attitudes toward using shared micro-mobility services and that it is also an important source of continuance intention [
51,
52].
- (6)
Continuance intention
Continuance intention refers to the behavior or likelihood of repeated consumption of a product or service and the likelihood of recommending it to others if a user is satisfied with it [
53]. Based on an integrated theoretical framework of expectation confirmation theory, Si et al. demonstrated that the key factors influencing consumers’ continuance intention of using carpooling services include satisfaction, perceived utility, economic benefits, environmental awareness, and platform incentives [
54]. Understanding the influencing factors for continuance intention could induce enterprises to establish their core competitiveness, while also offering references and suggestions for designing and promoting shared micro-mobility services; so, it is directly related to the success and sustainability of the services.
- (7)
Subjective consciousness
Subjective consciousness is Research Topic No. 4, which mainly reflects users’ subjective perceptions and attitudes toward shared micro-mobility. Bretones et al. have demonstrated the importance of psychosocial factors that influence users’ micro-mobility decisions; such nonfunctional factors as environmental issues, innovation, and a sense of belonging may even have a stronger impact on individuals than such traditional functional factors as speed, cost, and time savings [
55]. Subjective consciousness involves not only an individual’s moral responsibility and self-identity but also the social sustainability of micro-mobility. Together, these factors can shape people’s subjective experience of micro-mobility and, in turn, influence their choices and behaviors. Therefore, the following hypotheses are proposed:
Hypothesis 7 (H7): User satisfaction has a significant positive impact on continuance intention.
Hypothesis 8 (H8): Subjective consciousness has a significant positive impact on product perceived value.
Hypothesis 9 (H9): Subjective consciousness has a significant positive impact on user satisfaction.
Hypothesis 10 (H10): Subjective consciousness has a significant positive impact on continuance intention.
4.2. Questionnaires and Data
Wenjuanxing 2.0 software was used to create a questionnaire, and online surveys were conducted. The proposed research model and hypotheses were validated. The scales in this study were all developed based on the mature scales of the model in combination with the topic clustering results of Research No. 1. The questionnaire adopted 7-level Likert scales, and the survey subjects were the people who had used shared micro-mobility vehicles. The interviewees were mostly located in regions in central China (Hubei, Hunan, and Henan provinces), and 429 valid questionnaires were collected. The questionnaire content includes the following two parts. The first part is about basic personal information: males are dominant in the sample (53.8%); most of the interviewees are between 18 and 35 years old (80.5%); and their education level is generally above the undergraduate level (84.8%). Meanwhile, it can be seen that students are the main user group of shared micro-mobility (52.7%). This feature not only involves the travel preferences of young users but may also be related to the deployment areas selected by shared micro-mobility enterprises. The statistical information for the sample description is shown in
Table 4. The second part of the questionnaire consists of seven items of latent variables: (1) product quality; (2) user expectations; (3) interactive experience; (4) subjective consciousness; (5) product perceived value; (6) user satisfaction; and (7) continuance intention. Based on the literature review and the 17 clustering results, a total of 26 measured variables were set. The questionnaire design is shown in
Table A1.
The reliability of the questionnaire was assessed with Cronbach’s alpha coefficients. Generally, the reliability of a questionnaire will meet the requirement when the Cronbach’s α value is greater than 0.8. As shown in
Table 5 and
Table 6, the overall Cronbach’s α value of the questionnaire is 0.829, so the variables have good internal consistency, indicating that the questionnaire has high reliability. Additionally, the Kaiser–Meyer–Olkin (KMO) value is 0.874, greater than the optimal critical value of 0.8, and the significance index is 0.000; therefore, the data are suitable for factor analysis. Finally, the combined reliability (CR) of the seven variables is greater than 0.7, and the average variance extracted (AVE) was greater than 0.5, indicating that the variables have good convergent validity and internal consistency.
In this study, the square root of the average value extracted (AVE) of each variable is utilized to further determine the discriminant validity among the factors. In the model constructed, the square roots of AVE of all variables are greater than the correlation coefficients between the values of the variables, proving that there are significant differences between the variables and that the discriminant validity is good. The discriminant validity data are shown in
Table 7.
4.3. Structural Equation Model Testing
In order to test the validity of the hypothetical model, AMOS 26.0 software was used to assess the fit degree of the model. An index system consisting of absolute fit indexes (x
2/df and RMSEA), value-added fit indexes (IFI, TLI, and CFI), and reduced fit indexes (PGFI and PNFI) was used to test the fit degree of the theoretical model, and it was found that the test results of all the parameters could meet the fit criteria. Thus, the actual research data of shared micro-mobility satisfaction have a good fit with the theoretical model constructed in this study. The fit test results of the model and corresponding indicators are shown in
Table 8.
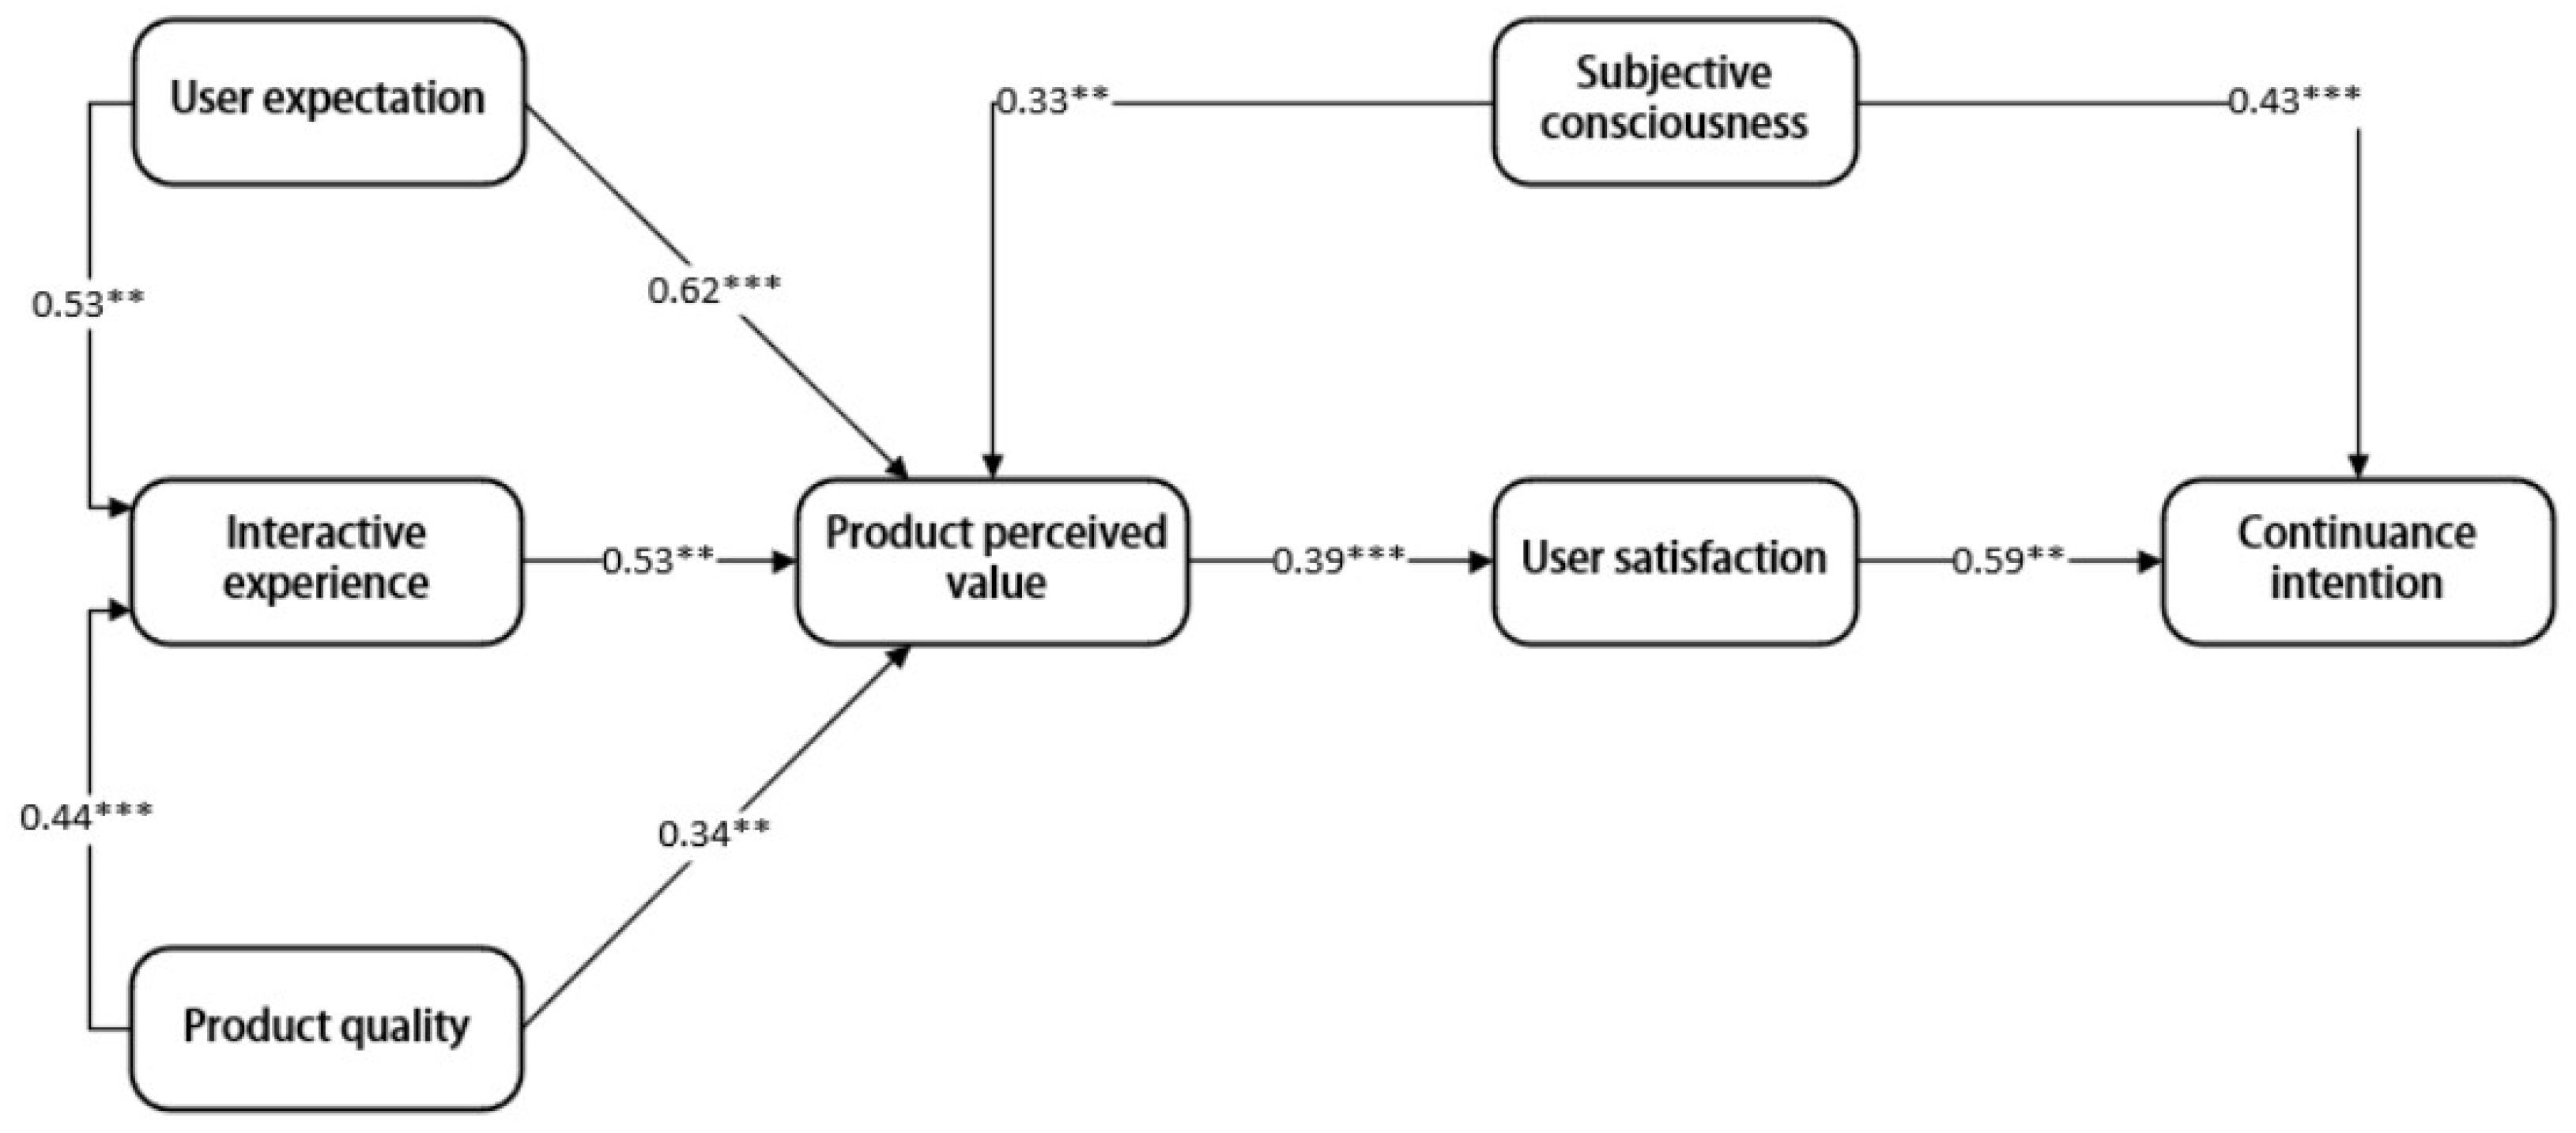
Then, AMOS 26.0 was used to validate the model path for the research of shared micro-mobility satisfaction. The results showcase that except for H9, hypotheses H1~H10 are all consistent with the theoretical expectations. After further correction to the initial structure model, the path coefficients of the structural equation modeling (SEM) were obtained, as shown in
Figure 4. And the results of the model’s hypothesis testing are shown in
Table 9.
In order to test the mediating effect of interactive experience, product perceived value, and user satisfaction, the bootstrap method was adopted in AMOS 26.0 to undertake repeated sampling. The results are shown in
Table 10, which demonstrates that interactive experience, product perceived value, and user satisfaction have a significant mediating effect in the research model for shared micro-mobility user satisfaction (
p < 0.001).
4.4. Results
From the analysis of the path coefficients and the mediating effect of the research model for shared micro-mobility user satisfaction, the following can be concluded: First, user expectation and product quality can significantly affect the interactive experience and further affect the product perceived value based on the mediating effect of the interactive experience, so hypotheses H1 (β = 0.441, p < 0.001) and H2 (β = 0.529, p < 0.01) are valid. Second, user expectations, product quality, interactive experience, and subjective consciousness significantly affect the perceived value of shared micro-mobility and then affect user satisfaction through the mediating variable of product perceived value; in addition, user satisfaction has a significant positive effect on continuance intention. So, hypotheses H3 (β = 0.617, p < 0.001), H4 (β = 0.337, p < 0.01), H5 (β = 0.534, p < 0.01), H6 (β = 0.387, p < 0.001), H7 (β = 0.589, p < 0.01), and H8 (β = 0.326, p < 0.01) are valid. Furthermore, as shown in the influence path coefficients, user expectation has the strongest effect on product perceived value. Third, although subjective consciousness cannot directly influence user satisfaction, it can influence user satisfaction through the mediating variable of product perceived value, so hypothesis H9 (β = 0.139, p > 0.05) is not supported but H10 (β = 0.428, p < 0.001) is valid.
5. Discussion
On the one hand, the “14th Five-Year Plan” for green transportation in China advocates for the comprehensive and in-depth promotion of green development in transportation. Understanding user evaluations and perceptions of emerging green transportation methods such as shared micro-mobility is crucial. On the other hand, in the field of shared micro-mobility research, most scholars typically assess its impact from a macro perspective, focusing on aspects such as enterprise operations and government planning. In investigating the factors influencing user satisfaction in shared micro-mobility, there has been a lack of research from the micro perspective of product value. This study employed quantitative research methods on online user comment data to explore and validate the composition of product perceived value in shared micro-mobility, as well as the critical influencing factors on user satisfaction in shared micro-mobility. The SEM results show that among the key factors, user expectation delivers the greatest influence; user expectation and product quality can positively affect the product perceived value; and interactive experience plays an important mediating effect among user expectation, product quality, and product perceived value. On the one hand, Similar to existing expectancy theory research, user expectation can provide a benchmark for interactive experience: When a product meets or exceeds such expectation, users may feel satisfied. On the other hand, product quality itself also determines users’ interactive experience; high-quality products tend to provide a better use experience, thus enhancing the product perceived value. Previous studies seem to have overlooked the comprehensive impact of product interaction experience. In contrast, we further substantiated its influencing mechanisms.
Among the four constituent factors of perceived product value, we also identified four corresponding important measurement variables. First, reliability is a key variable affecting product quality (β = 0.871,
p = 0.001). This finding is supported by the research of Javadinasr et al., who discovered that a prominent factor determining users’ decisions is the perceived reliability. A point of divergence between the results of their research and this study is as follows: they maintain that the source of reliability comes primarily from the temporal and spatial accessibility of micro-mobility [
56], whereas this study is focused more on users’ feedback on the vehicle condition during their riding. It can be observed that with the rapid expansion of shared micro-mobility, people’s focus on the product has shifted gradually from basic functionality to a more comprehensive experience. Second, as a measured variable, the safety standard has the greatest impact on user expectation (β = 0.868,
p = 0.001). Shaaban et al. pointed out that safety plays an important role in maintaining a high level of services for any mode of transportation [
57]. This finding is also supported by Pande et al., who have explored the safety of shared micro-mobility and the risk of associated liabilities from a governmental perspective [
58]. We believe that users also value the safety and compliance of travel tools. Therefore, governments and businesses should take effective measures to ensure and promote the safety of travel modes to increase user adoption rates. Third, similar to the results of Javadinasr et al. [
56], it is found that ease of use has a significant impact on users’ experience with shared micro-mobility (β = 0.863,
p = 0.001). Ratan et al. also emphasized that mobile apps could significantly influence the use experience of e-scooters, and media technology was a key factor impacting the usability of transportation vehicles [
59]. As a form of public good, the use of shared micro-mobility necessitates the use of mobile applications. Unlike other transportation products with additional smart apps, the key lies in how to enhance universality and user-friendliness in shared micro-mobility apps. And finally, green motivation is significant in determining users’ subjective consciousness for choosing shared micro-mobility (β = 0.827,
p = 0.001), and this point is supported by Flores et al. [
60], who demonstrated that green perceptions have a much high impact on the use of shared micro-mobility. However, Bozzi et al. pointed out that shared micro-mobility delivers a negative impact on the environment in terms of production, use, and maintenance. On the whole, the green and low-carbon slogans of shared micro-mobility companies do influence users’ choices of travel modes. However, for long-term development, green and low-carbon solutions targeting the entire product lifecycle are more aligned with users’ ultimate interests.
Subjective consciousness can deliver a direct positive impact on users’ continuance intention. This study demonstrates the important position of subjective consciousness (such as users’ green motivation, responsibility attribution, and health perceptions) in users’ decision-making process [
60]. This finding is consistent with current research results about the social psychology of micro-mobility users [
55]. Users’ intrinsic beliefs and attitudes have a profound effect on their behavioral choices; when users are convinced that a service or product is beneficial to them, they may become more inclined to use it consistently, and this willingness to use will be further enhanced when this belief is aligned with the perceived value of the product. In contrast to previous research results, we found that subjective consciousness cannot directly influence users’ satisfaction; it indirectly influences their satisfaction through the product’s perceived value. A possible explanation is that although users’ positive awareness can boost their use of a product, users have their own psychological evaluation of the goodness of the product. This point is embodied in the integrated perceived value of products, and satisfaction is the consequence following the psychological evaluation of products. We believe that the prerequisite for the government or companies advocating for shared micro-mobility is whether users can perceive the value of the product. In other words, the green motivation and similar motivations of users can only be effective when a product achieves high user satisfaction. In addition, user satisfaction and subjective consciousness delivers a significant direct effect on continuance intention, and this finding is consistent with the research results of Peng et al., who explored continuance intention in the use shared bicycle services [
61].
The results of this study support the discovery of Liao and Nikiforiadis et al.; that is, shared micro-mobility modes can attract people with similar sociodemographic characteristics [
62]. As shown in the basic statistical information acquired from the questionnaire survey, the majority of shared micro-mobility users are students, and they have a relatively high level of education. College students account for a large share of the shared micro-mobility market, possibly because the transportation modes currently adopted by students influence their choices [
63]. Additionally, in general, students with a high education level tend to be able to understand and utilize new technologies and apps more easily, so they are more likely to adopt and promote shared micro-mobility. For providers of shared micro-mobility services, this study can help them to better understand their target audiences so that they may develop targeted marketing strategies and service improvement plans. Moreover, the results of this study support the hypotheses of the ACSI framework, confirming the mediating effect of product perceived value between the influencing factors and user satisfaction.
In summary, the findings of this study offer a new perspective from which to understand the behavior and psychology of the users of shared micro-mobility services. This study emphasizes the key role of product perceived value in connecting the influencing factors with user satisfaction, underlines the dominance of user expectation among all influencing factors, and stresses the significant direct function of subjective consciousness in shaping users’ continuance intention to use the services. Future research could further explore the deeper relationships among these factors, as well as the interactions between these factors and other potential factors.
6. Conclusions
This study chose China’s five major shared micro-mobility APPs (Hellobike, Meituan, Green Orange, Xiao Liu, and Song Guo) and two major social media platforms (Little Red Book and Zhi Hu) as its research objects. Seventeen factors influencing users’ satisfaction with shared micro-mobility were mined from 6560 online user reviews, and then, based on the topic clustering results of ASCI and LDA, a research model was constructed for shared micro-mobility user satisfaction. A total of 429 valid users voluntarily answered the online questionnaire, which contains 30 questions. Finally, SEM was utilized to verify the relationships among user expectation, product quality, interactive experience, subjective consciousness, product perceived value, user satisfaction, and continuance intention. It is found in this study that product perceived value is primarily composed of user expectations, product quality, interaction experience, and subjective consciousness. Furthermore, from the perspective of the mechanism influencing user satisfaction, user expectation and product quality can positively affect product perceived value through interactive experience. User expectation, product quality, interactive experience, and subjective consciousness can positively affect user satisfaction through product perceived value, with user expectation holding the greatest influence. Subjective consciousness has a direct positive effect on users’ continuance intention and also indirectly affects continuance intention through product perceived value. It is worth noting that subjective consciousness cannot directly influence user satisfaction.
First, user expectation, interactive experience, and product quality have a great impact on product perceived value while indirectly affecting user satisfaction, with user expectations holding the greatest impact. Therefore, improving user expectations and other product-related factors is an important means of boosting the continuance intention of using shared micro-mobility. Generally, user expectations are determined by pre-use expectations and post-use experiences. On the one hand, based on the pre-expectation analysis, enterprises in the shared micro-mobility industry shall fully understand the needs of users, including safety norms, convenience, price acceptance, and other factors, so as to achieve the effect of appealing to users quickly and effectively. Meanwhile, they shall maintain their brand images, set up consistent visual profiles, and strengthen brand loyalty in the minds of users. On the other hand, they shall, in a timely manner, receive feedback on post-use experiences such as maintenance quality and scheduling efficiency, make targeted improvements based on users’ pain points, and regularly monitor product reputation and customer feedback so as to take timely action to solve problems and make improvements.
Second, paying attention to integrating user expectations and product quality can effectively boost interactive experience of products and, in turn, affect product perceived value and user satisfaction. As shown in the results of Research No. 1, user expectation is placed more on intangible services of products, and product quality represents users’ feelings about the vehicle hardware; therefore, enhancing the synergy between the hardware and software of products can significantly improve users’ riding experience. At present, intelligent hardware is utilized to provide support for the technical applications of big data, artificial intelligence, cloud computing, and others, or to predict users’ travel trajectories and consumption scenarios. This practice has become a major innovation trend in the shared micro-mobility industry. In brief, shared micro-mobility companies should enhance technological innovation to improve the perceived value of travel services.
Finally, as a psychosocial feeling of users, subjective consciousness has a significant impact on both product perceived value and continuance intention. On the one hand, shared micro-mobility provides users with a less sedentary way of traveling, thus helping increase their daily activities while producing less carbon emissions and noise pollution. For the urban dwellers who have health and environment consciousness, this category of transportation vehicles will become their first choice. Therefore, micro-mobility enterprises should emphasize their positive impact on increasing daily activities and improving health while attracting more users through social responsibility activities such as low-carbon travel. On the other hand, for young people and urban white-collar groups, this mode of travel could be regarded as a fashionable and modern lifestyle, which would help strengthen individuals’ self-identity. Enterprises can provide different styles of micro-mobility products so as to meet the needs of different users in terms of their self-identity and personalized expression.
We expanded upon previous research by integrating the concept of perceived value, incorporating aspects such as product quality, user expectations, interaction experience, and subjective consciousness into the product dimension of shared micro-mobility for analysis. Additionally, our study deviated from common survey research and corporate data and instead relied on multi-channel user online comments. This approach not only includes a wide range of authentic information but also indirectly reflects the emotional needs of the commentators, effectively addressing the limitations of traditional econometric and statistical methods. The research data were categorized into three levels: 4 main research topics, 17 sub-topics, and numerous keywords extracted from online comments. Our clustering hierarchy provides insights into various research topics that may influence user satisfaction. Governments or enterprises can leverage the insights from this research to enhance the quality of shared micro-mobility services and promote diversified green travel options. This aligns with the vision of China’s 14th Five-Year Plan for green transportation development and contributes to the sustainable progress of urban transportation.
7. Limitations and Future Research
This study makes certain theoretical contributions to the research related to shared micro-mobility and provides some practical guidance for shared micro-mobility enterprises in strengthening user satisfaction and expanding market share. However, it still has some limitations. First, the data for this study were collected through an online survey. Those who can respond to questionnaires online tend to be younger users who would use the Internet frequently; therefore, if offline surveys were also conducted, more objective and detailed results would be acquired. Future research can focus on the moderating effect of such demographic factors as age, gender, education, income, and others on the research model; this effort will help identify the impact of demographic characteristics on user satisfaction in a detailed manner. Second, the shared micro-mobility of concern in this study is a broad concept, which covers shared bicycles, shared electric vehicles, shared scooters, and other emerging urban travel means. There may be some differences across shared mobility products, so the differences in terms of product types and the influencing factors behind such differences deserve in-depth exploration as well. Finally, the topic clustering results acquired in this study can be combined with other theories so as to fully understand the influence weights of factors and their interactions under different theories. In brief, future research needs to further refine the findings of this study by taking these factors into account.


