Article

Evaluating the Spatial Evolution of the Eco-Economy Harmony in Anxi County, China, Based on Ecosystem Services Value

1
College of Digital Economy, Fujian Agriculture and Forestry University, Fuzhou 350002, China
2
Institute of Agroecology, Fujian Agriculture and Forestry University, Fuzhou 350002, China
3
College of Rural Revitalization, Fujian Agriculture and Forestry University, Fuzhou 350002, China
4
Ecological Civilization Research Center, Fujian Agriculture and Forestry University, Fuzhou 350002, China
*
Authors to whom correspondence should be addressed.
These authors contributed equally to this work.
Sustainability 2024, 16(4), 1491; https://doi.org/10.3390/su16041491
Submission received: 11 December 2023 / Revised: 4 February 2024 / Accepted: 7 February 2024 / Published: 9 February 2024
(This article belongs to the Section Sustainable Urban and Rural Development)

Abstract

:
The harmonious development of the ecological environment and the economy is extremely important to achieve regional ecological construction and sustainable development. To properly assess the status of the harmonious development of the ecosystem and the economy, this study constructed an improved ecosystem services value (ESV) and eco-economic harmony (EEH) model to analyze the coordination relationships between the ecosystem and the economy in this region, based on Landsat TM/OLI data of Anxi County in 1999, 2009, and 2019. The results were as follows. (1) Significant changes in land- use occurred in Anxi County between 1999 and 2019. While grassland, cultivated land, and water bodies decreased by 22.91%, 36.82%, and 8.18%, respectively, other land-use types expanded including construction land (206.10%), garden land (56.39%), forest land (10.37%), and unutilized land (90.43%). (2) The ESV decreased by CNY 41.02 billion during this period, with the largest contribution from forest land and the most important service function being regulating services, and mountainous townships made a great contribution to the total ESV. (3) The eco-economic system of Anxi County was at an inharmonic level. The evaluation model produced more favorable results, especially at the township scale, which is highly sensitive to economic policy. This can provide scientific evidence for inter-regional ecological compensation and sustainable development while providing reference and inspiration for similar areas around the world to carry out relevant research.

1. Introduction

With the rapid pace of socio-economic development, industrialization, and urbanization, the demand for natural resources, particularly land resources, continues to increase, resulting in more conflicts between built-up areas, cultivated land, and environmental protection [1]. This kind of resource consumption has led to several issues, such as an irrational structure of construction land, the spatial distribution of land use, and the inefficient use of resources [2]. Land-use change can significantly alter ecosystems and their spatial distribution, thereby affecting the structure and functioning of ecosystems. This, in turn, usually reduces the ecosystems’ ability to provide services [3,4,5]. At present, the mutual constraints between the ecological environment and economic and social development are becoming increasingly clear, and the conflict is becoming more serious. Therefore, achieving the coordinated development of ecology and the economy is necessary to address the issue. Eco-economy harmony (EEH) is a critical requirement for regional sustainable development and a necessary way to build a regional ecological civilization. The quantitative assessment of the coordinated development of ecology and the economy at the regional level can provide a scientific basis for achieving this goal. Therefore, the quantitative evaluation of the coordinated development of ecological and economic systems is crucial for the realization of regional sustainable development and is one of the most challenging areas of research in ecology and geography.
As we know, not only is the ecosystem services value (ESV) affected by biomass, but its monetary value is also affected by economic development [6]. Therefore, this study improved the ESV assessment method by adopting the biomass factor adjustment coefficient and the socio-economic factor adjustment coefficient. On this basis, the level of harmonious development of the regional eco-economy was measured, which provided a new way of thinking for the study of regional eco-economic harmony. In addition, previous studies have mainly used ESV assessment methods to measure ESV at the global, national, and provincial scales, but there has been less analysis of the ESV at the township scale. The study focuses on Anxi County, assessing the ESV from 1999 to 2019, and exploring its response to changes in land use. The study aims to develop a scientific method to accurately measure the degree of EEH at a smaller scale to analyze the harmony of regional eco-economic systems and their spatial evolution.

2. Literature Review

Ecosystems provide many services (ecosystem services, ES) to humans; in addition to material goods such as food and raw materials, they also provide many intangible assets to human life and human habitats, such as regulating services, supporting services, and cultural services [7]. Variations in ecosystem services value are closely related to the level of regional economic development and the degree of exploitation [8,9], which synthesize and quantify the results of regional ecological changes [10]. The quantitative assessment of the ecosystem services value contributes to their effective management and the scientific formulation of ecological compensation policies [11]. In terms of ESV assessment, Costanza et al. [7] are the pioneers of ESV assessment, providing ideas and methodologies for subsequent studies. For example, Ouyang et al. [12] and Fu et al. [13,14] provided important discussions on the concepts, valuation methods, and ecological mechanisms of ESV. Xie et al. [15,16] carried out relevant research based on Costanza et al.’s valuation method, and their research result of “China’s ecosystem services value equivalent factor table” [17,18] has been recognized by a large number of scholars and has been widely used in the valuation of different scales and ecosystems. An analysis of the existing literature shows that most studies directly used the equivalence factor table proposed by Xie et al. to measure ESV [19]. However, this scale is based on the national average, and due to the heterogeneous nature of ecosystems [20,21], directly adopting this scale will make the results inaccurate. Therefore, it is necessary to revise the above equivalent factors and reconstruct the ESV assessment model by considering the actual situation of the study area. Furthermore, the ESV valuation methodology used in previous studies fails to accurately capture the true economic value of ecosystem services. This is due to its exclusive focus on the supply-side approach, which relies solely on the potential supply of ecosystem services provided by each land-use category [22]. However, the actual economic value of ecosystem services is determined by the interplay between the supply of ecosystems and the demand of society [23]. Therefore, as people begin to be willing to pay the corresponding costs for the protection of the ecological environment [24], it is necessary to consider both their willingness to pay and ability to pay when reflecting societal demand for ecosystem services, which is of great importance for the establishment of an ecological compensation mechanism and the realization of green socio-economic development.
Land-use change is a key factor influencing ecosystem services [25]. Land-use change reflects the complex interactions between climate change and human activities and is closely linked to several terrestrial processes such as biodiversity, surface energy balance, atmospheric circulation, and carbon cycling [26,27]. Due to the complex geological structure of hilly and mountainous areas and the high degree of fragmentation of land parcels, the ecological environment is more disturbed by human activities [28].
In terms of methods used to measure the harmonious development of ecological and economic systems, scholars have mainly tried the ecological footprint analysis method, the energy analysis method, the material flow analysis method, the market value method, and the sustainability evaluation method [29,30,31]. However, these methods do not consider the influence of externalities and socio-economic factors, so more and more scholars have adopted the EEH model for research. However, at present, this method is mainly limited to the global scale, national scale, and urban scale [17,32], and the research on small-scale counties, or even township-scale hilly areas, is very limited, especially for tea-producing areas. The novelty of the paper is the proposition of the dynamic ESV assessment method that fully considers the biomass factor and the socio-economic factor, which provided a new research model for the subsequent study. Therefore, the assessment values could better represent the dynamic change in the ESV and EEH development level across different periods and can be analyzed scientifically from a smaller scale.
China’s tea plantations account for 60% of the world’s total tea plantation area, and the ecosystems in these areas are often fragile, facing greater economic and social pressures, with large land-use changes that can easily affect the balance of the ecosystem. Therefore, the coordinated development of the economy and ecosystem in tea-producing regions has become a major scientific issue that urgently needs addressing. Anxi County, the birthplace of world-renowned Tieguanyin tea, is a leading tea-producing region in China. A former national poverty-stricken county, Anxi’s tea industry has lifted it into the top 100 counties in the country. However, unchecked development has caused soil erosion and ecological damage [33]. This impact is particularly significant in mountainous areas [34]. However, there is insufficient research evaluating the ecological and economic system’s harmony degree development and spatial ranking in Anxi County, and few of the current research findings are at the township scale.

3. Study Area and Methods
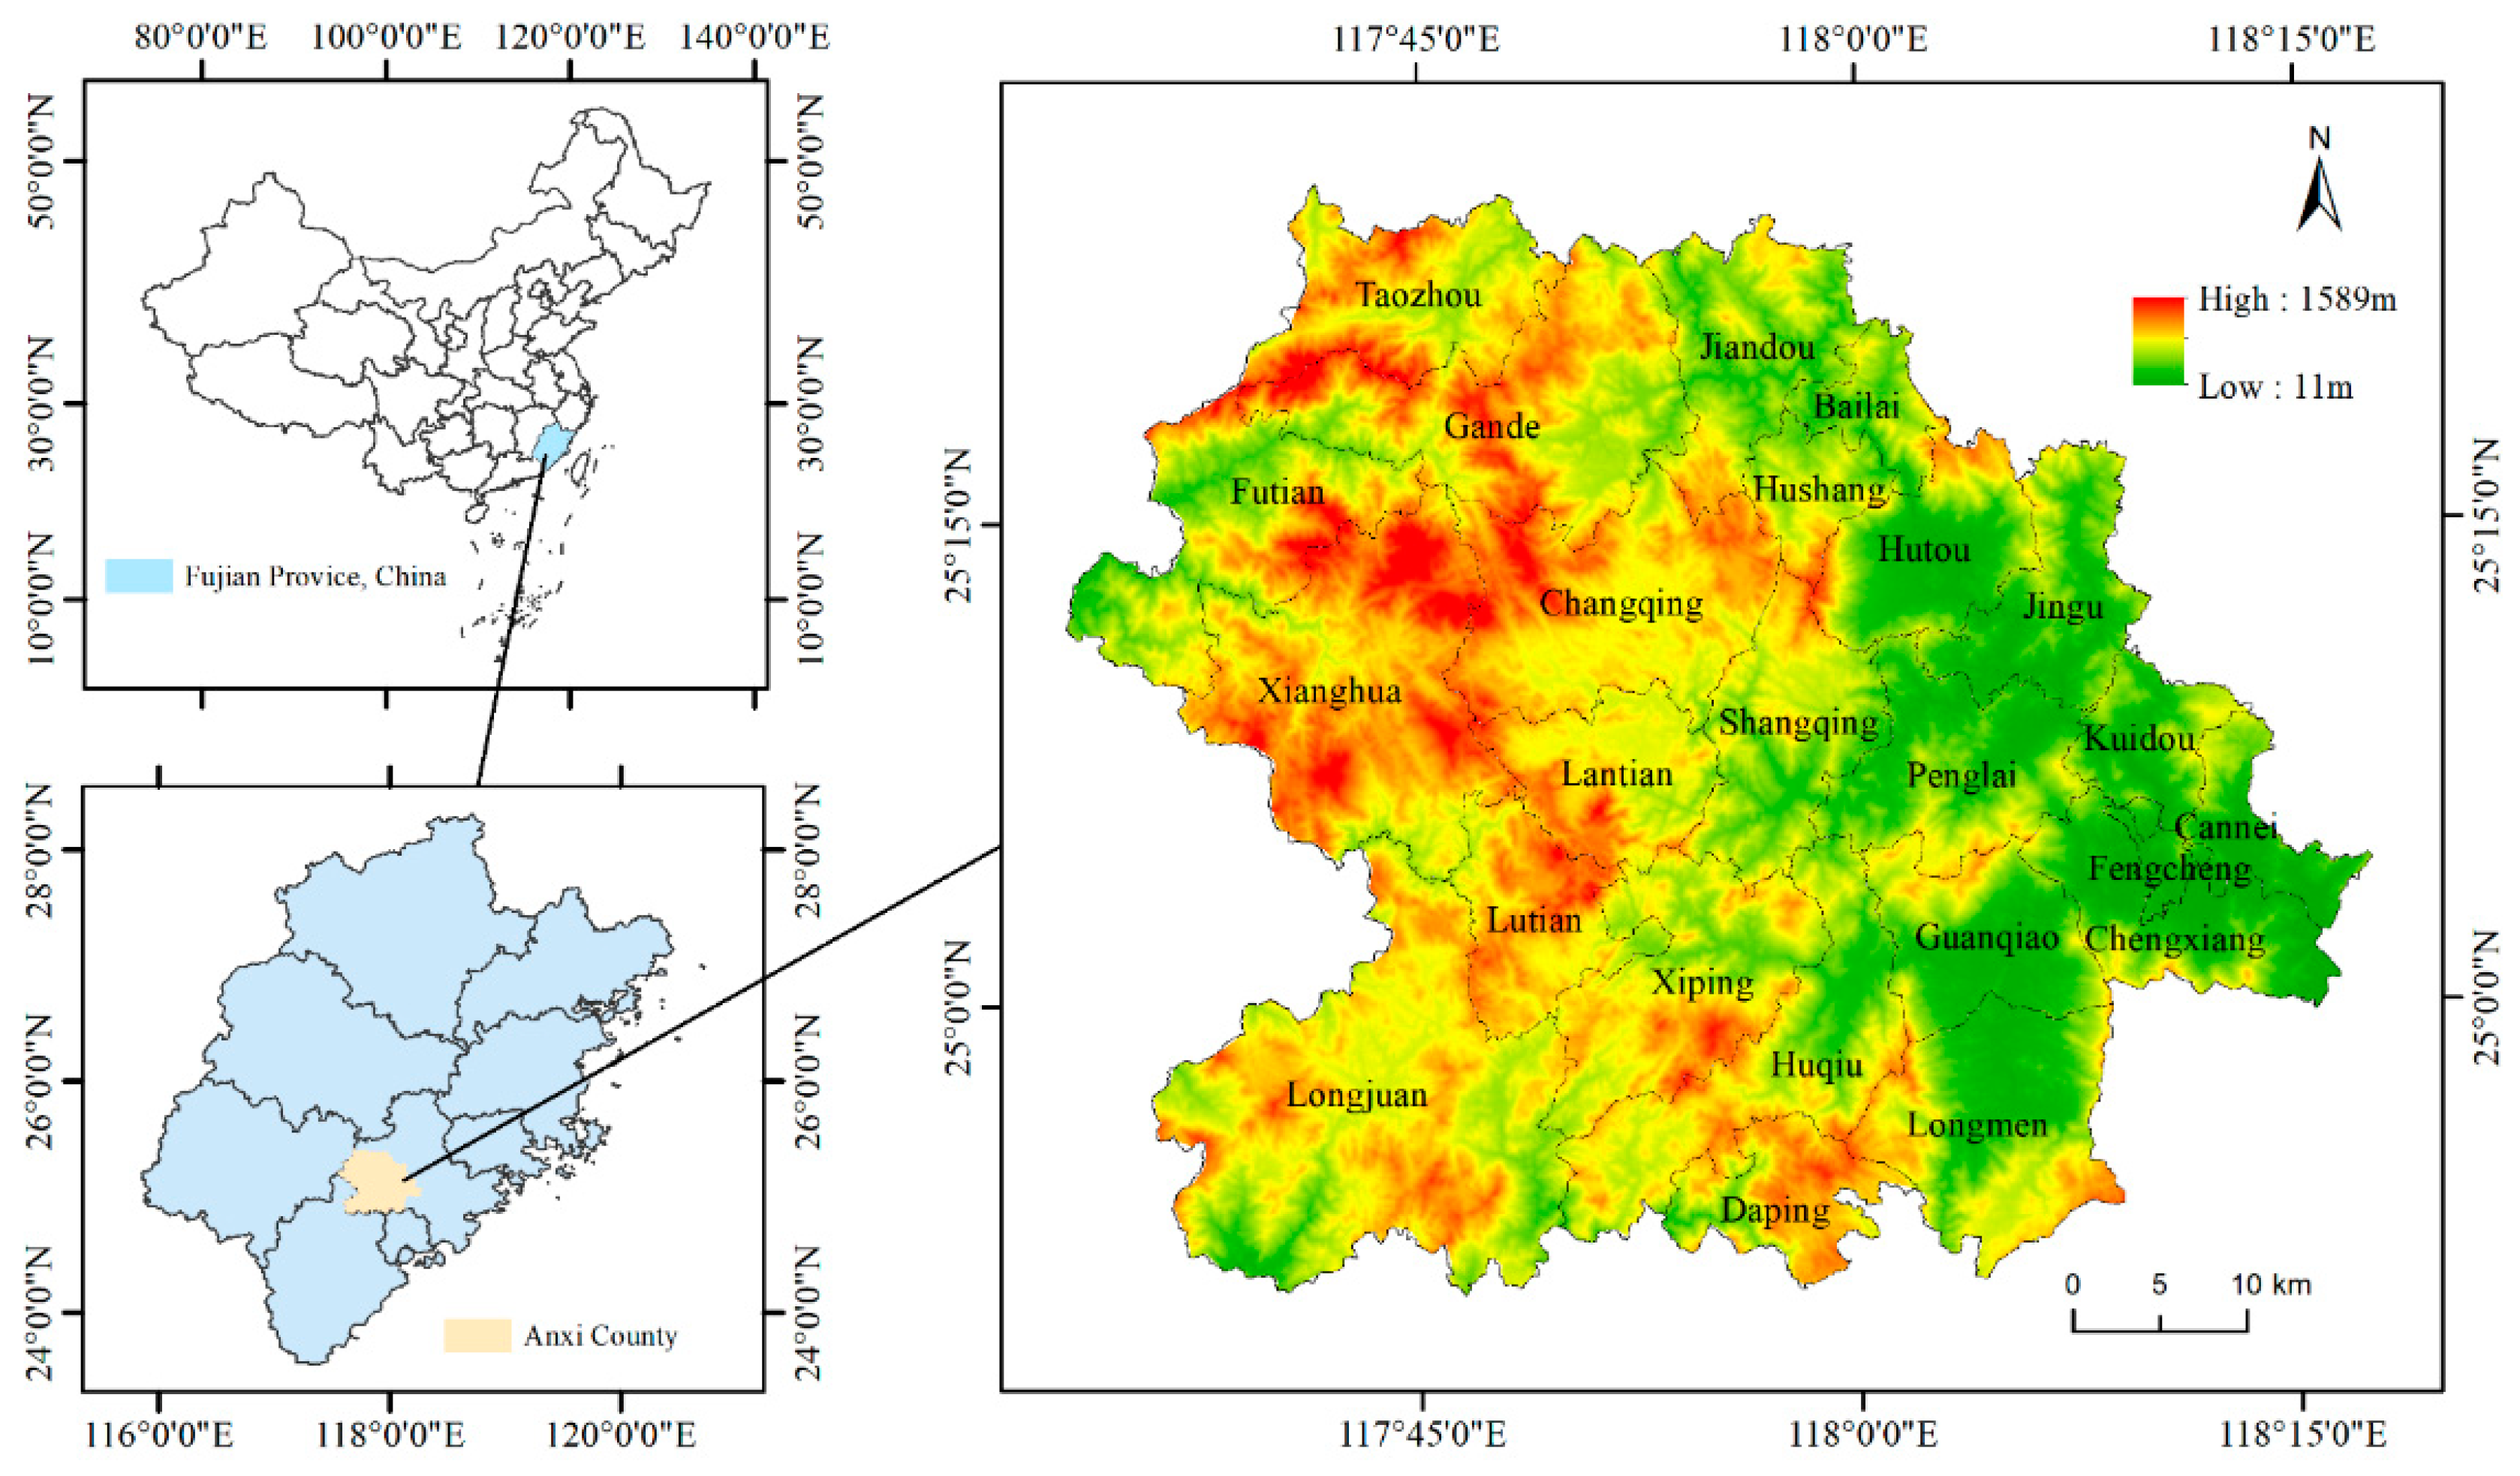
3.1. Study Area

Anxi County is located in the southeastern part of Fujian Province (between 117°36′~118°17′ E and 24°50′~25°26′ N) in the upper reaches of Jinjiang River’s Xixi Creek, and is under the jurisdiction of Quanzhou Municipality, with 488 villages in 24 townships under its jurisdiction (Figure 1). Anxi County has a southern and central subtropical, maritime, monsoon climate. Due to topographical differences, the climatic characteristics of Anxi’s eastern and western parts are significantly different. Eastern Anxi belongs to the southern subtropical zone, with an average annual temperature of 19~21 °C and an annual rainfall of 1600 mm; western Anxi, on the other hand, has an average annual temperature of 16~18 °C and an annual rainfall of 1800 mm, with four distinct seasons throughout the year. Anxi County lies within the southeastern extension of the Daiyun Mountains, boasting an average elevation of 700 m above sea level. The county is intersected by major rivers that flow through the basin and cut through the surrounding mountain ranges. In 2021, Anxi County’s GDP reached CNY 84.561 billion, with a resident population of 1.002 million. The primary, secondary, and tertiary industries accounted for 6.74%, 51.44%, and 41.82% of the county’s economy, respectively.

3.2. Data Collection and Processing

The Landsat TM/OLI remote-sensing images from 1999, 2009, and 2019, with a spatial resolution of 30m × 30m, were downloaded from USGS (the information on Landsat images can be found in Table 1). We used supervised classification to classify remotely sensed images, mainly using a random forest classifier. In this study, we set the number of decision trees to 100, and for the rest of the parameters, such as the number of split variables, maximum leaf nodes, and randomized species sub, the default values were selected. Seventy percent of the sample points were used to train the classifier, and thirty percent were used for accuracy verification. The pre-processing steps of satellite data were as follows: Landsat TM/OLI remote-sensing images → cloud screening (<5%) and image median synthesis → radiometric calibration and atmospheric correction → image enhancement and mosaic → training sample → random forest classification→ classification accuracy evaluation (kappa coefficient and overall accuracy) → land-use classification. After we conducted a kappa coefficient test (kappa coefficient is a measure of classification accuracy) [35] on the remote-sensing images, we found that all coefficient values exceeded 0.87. Moreover, the overall interpretation accuracy of these images exceeded 90%, meeting the research requirements.
With reference to the classification of current land-use situations (GB/T 21010-2017 [36]), and in combination with the scope of the study and the purpose of the study, we divided the land-use types into seven categories: cultivated land (including paddy fields, irrigated land, and dry land), forest land (including trees, bamboos, shrubs, and coastal mangrove forests), garden land (including fruit orchards, and tea gardens), grasslands, water bodies (including rivers, lakes, reservoirs, pits, and ponds), construction land (used for industry, commerce, housing, and transport), and unutilized land (i.e., land that is not utilized or difficult to utilize).
Climate factors were provided by the National Meteorological Information Center (http://data.cma.cn (accessed on 8 October 2023)). Urban population proportion, Engel coefficient, grain output, GDP and per capita GDP data were obtained from the Anxi County Statistical Yearbook (2000–2020), and food prices were provided by the Food and Price Reserve Bureau of Fujian Province (http://lsj.fujian.gov.cn/xxgk/tjxx/ (accessed on 8 October 2023)). Some detailed data can be found in Table 2.

3.3. Research Methodology

3.3.1. Accuracy Evaluation

This study used the overall accuracy (OA) and kappa coefficient to evaluate the accuracy of land-use classification. Overall accuracy (OA) refers to the number of correctly classified pixels distributed along the diagonal of the confusion matrix and directly reflects the proportion of correctly classified images. The kappa coefficient is used to test the consistency between the model predictions and the actual classification results and to check whether the model’s predicted results are consistent with the actual classification results. The formulas for the OA and kappa coefficient are shown below:
O A = P c P n × 100
K a p p a = N i = 1 r x i i i = 1 r x i + × x + i N 2 i = 1 r x i + × x + i  
where Pc is the number of correctly categorized pixels, Pn is the total number of pixels, r is the number of rows and columns in the error matrix, xii is the number of observations in the i-th row and the i-th column, xi+ is the total number of margins in the i-th row, x+i is the total number of margins in the i-th column, and N is the total number of observations.

3.3.2. Single Land-Use Dynamic Degree (K)

The dynamic degree of single land use can quantitatively describe the rate of land-use change [37]. It plays an important role in comparing regional differences and trends in land-use change [38], as expressed in the following formula:
K = U b U a U a × 1 T × 100 %
where K refers to the degree of the land-use dynamic. Ua and Ub denote the area of a certain land category at the beginning and end of the study, respectively, and T denotes the length of the study period.

3.3.3. Regional Ecosystem Services Valuation Modelling (ESV)

Referring to the results of existing research [39], this study constructed a valuation model of ecosystem services that is applicable to the study area. Its formula is shown below:
E S V = A i × V C i × S i × P I
where ESV is the value of ecosystem services (CNY); Ai is the area of land-use type i (hm2); VCi is the ESV adjustment factor for land-use area i (CNY/hm2); Si is the adjustment factor for the biomass factor; and PI is the adjustment factor for the socio-economic factor (based on the human willingness to pay and ability to pay measurements). Since ecosystem services are largely proportional to biomass, and NPP is commonly used to estimate biomass [18], the biomass factor adjustment coefficient (Si) can be corrected according to the net primary productivity (NPP) of vegetation [40,41].
The formulas for willingness and ability to pay are as follows:
P I = W t × A t
where PI represents the adjustment coefficient of socio-economic factors within the study area. Wt indicates the willingness to pay for ecosystem services, which can be determined through a logistic regression model. A higher value of Wt indicates a higher willingness to pay. At refers to the ability to pay for ecosystem services and is calculated based on the gross domestic product per capita. A higher value of At implies a higher ability to pay.
W = 2 1 + e m
Here, W represents the willingness-to-pay parameter for Wt (also functioning as a calculation parameter), and m reflects the coefficient of the stage of social development. Detailed calculations of m can be obtained from Fu et al. [42]. Therefore, the calculation of the willingness-to-pay coefficient for the study area is calculated using the following formula:
W t = W s W g
where Ws and Wg are the willingness-to-pay parameters for the study area and the national willingness-to-pay parameters, respectively.
A t = G D P m s G D P m
Here, GDPms and GDPm signify the GDP per capita (CNY/person) for the study area and the national GDP per capita (CNY/person), respectively, during year t.

3.3.4. Sensitivity Analysis (CS)

Since uncertainty is related to the value coefficients, additional sensitivity analyses are required to test the percentage change in ESV for a particular percentage change in a value coefficient, that is, to test the dependence of ESV on the value coefficient (VC) of ecosystem services [43]. The credibility of the assessment results may be confirmed through the sensitivity coefficient [44], which is given by the following formula:
C S = E S V j E S V i E S V i V C j k V C i k V C i k
where CS denotes the sensitivity coefficient. When CS > 1, it implies that ESV is elastic relative to the VC, and the results have a low credibility. Conversely, when CS < 1, the ESV is inelastic relative to the VC, and the results are credible. ESVi and ESVj represent the ecosystem services value before and after adjustments, respectively. VCi and VCj refer to the equivalent factor for ecosystem services value coefficients before and after adjustments, respectively. And k denotes the land-use type.
In this study, the sensitivity analysis method shown in Equation (7) was used to adjust the ESV coefficients for each land-use type by ±50% and then calculate the corresponding change in ESV.

3.3.5. Eco-Economic Harmony Modelling (EEH)

There are presently no uniform standards for the harmonious development of ecosystems and economic systems, and the degree of harmonization of ecological and economic systems is a relative indicator. A widely used estimation method is to calculate the rate of change in ESV per unit area and the rate of change in GDP per unit area throughout the study period. This method enables the effective quantification of the coordinated relationship between economic development and ecological changes, enabling a more dynamic comparison of the degree of interaction between ecological changes and economic development throughout the study period [45].
In reference to the related research results, this study adopts the ecological and economic coordination index proposed by Wang et al. [46] to reflect the degree of mutual influence and its coupling and interaction in the process of studying ecological and economic development. It is calculated as follows:
E E H = Δ E S Δ G D P = E S p j E S p i G D P p j G D P p i
where EEH represents the degree of coordination between the ecological and economic systems within the region; ESpi and ESpj denote the value of ecosystem services per unit area at the beginning and end of the study period, respectively; and GDPpi and GDPpj denote the GDP per unit area at the beginning and the end of the study period, respectively.
Based on previous research [45], the EEH was classified as shown in Table 3.

4. Results

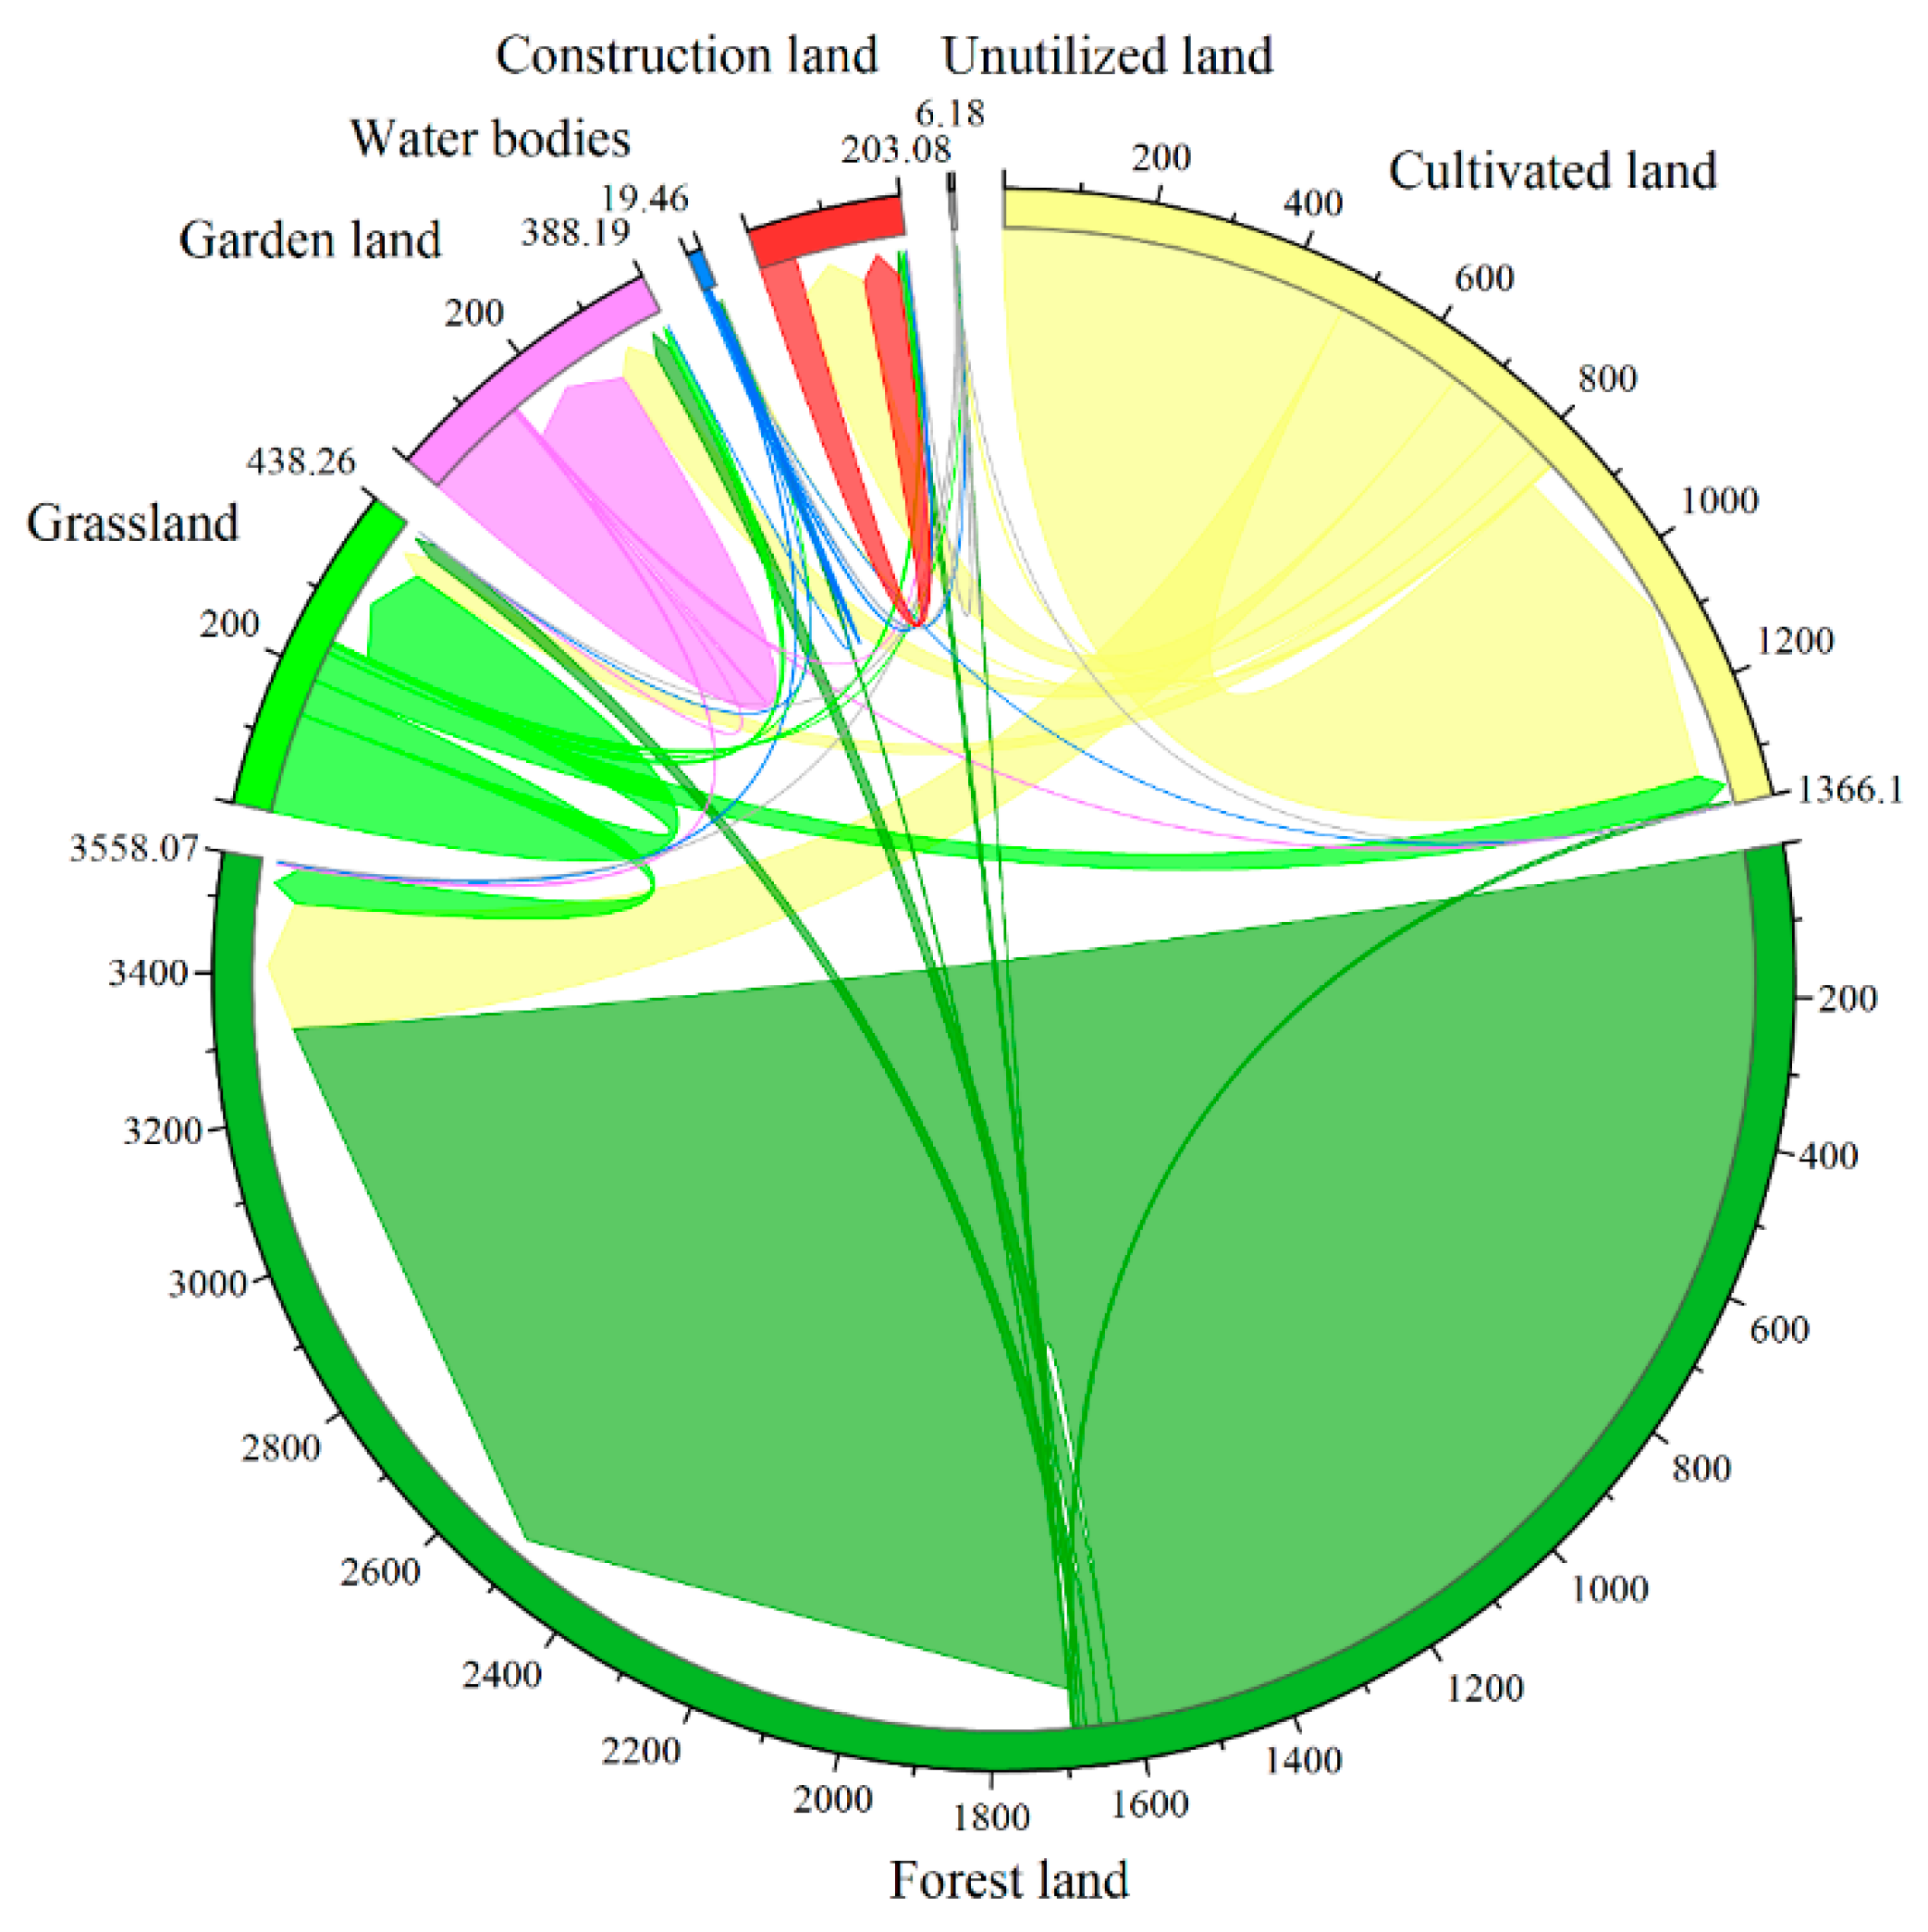
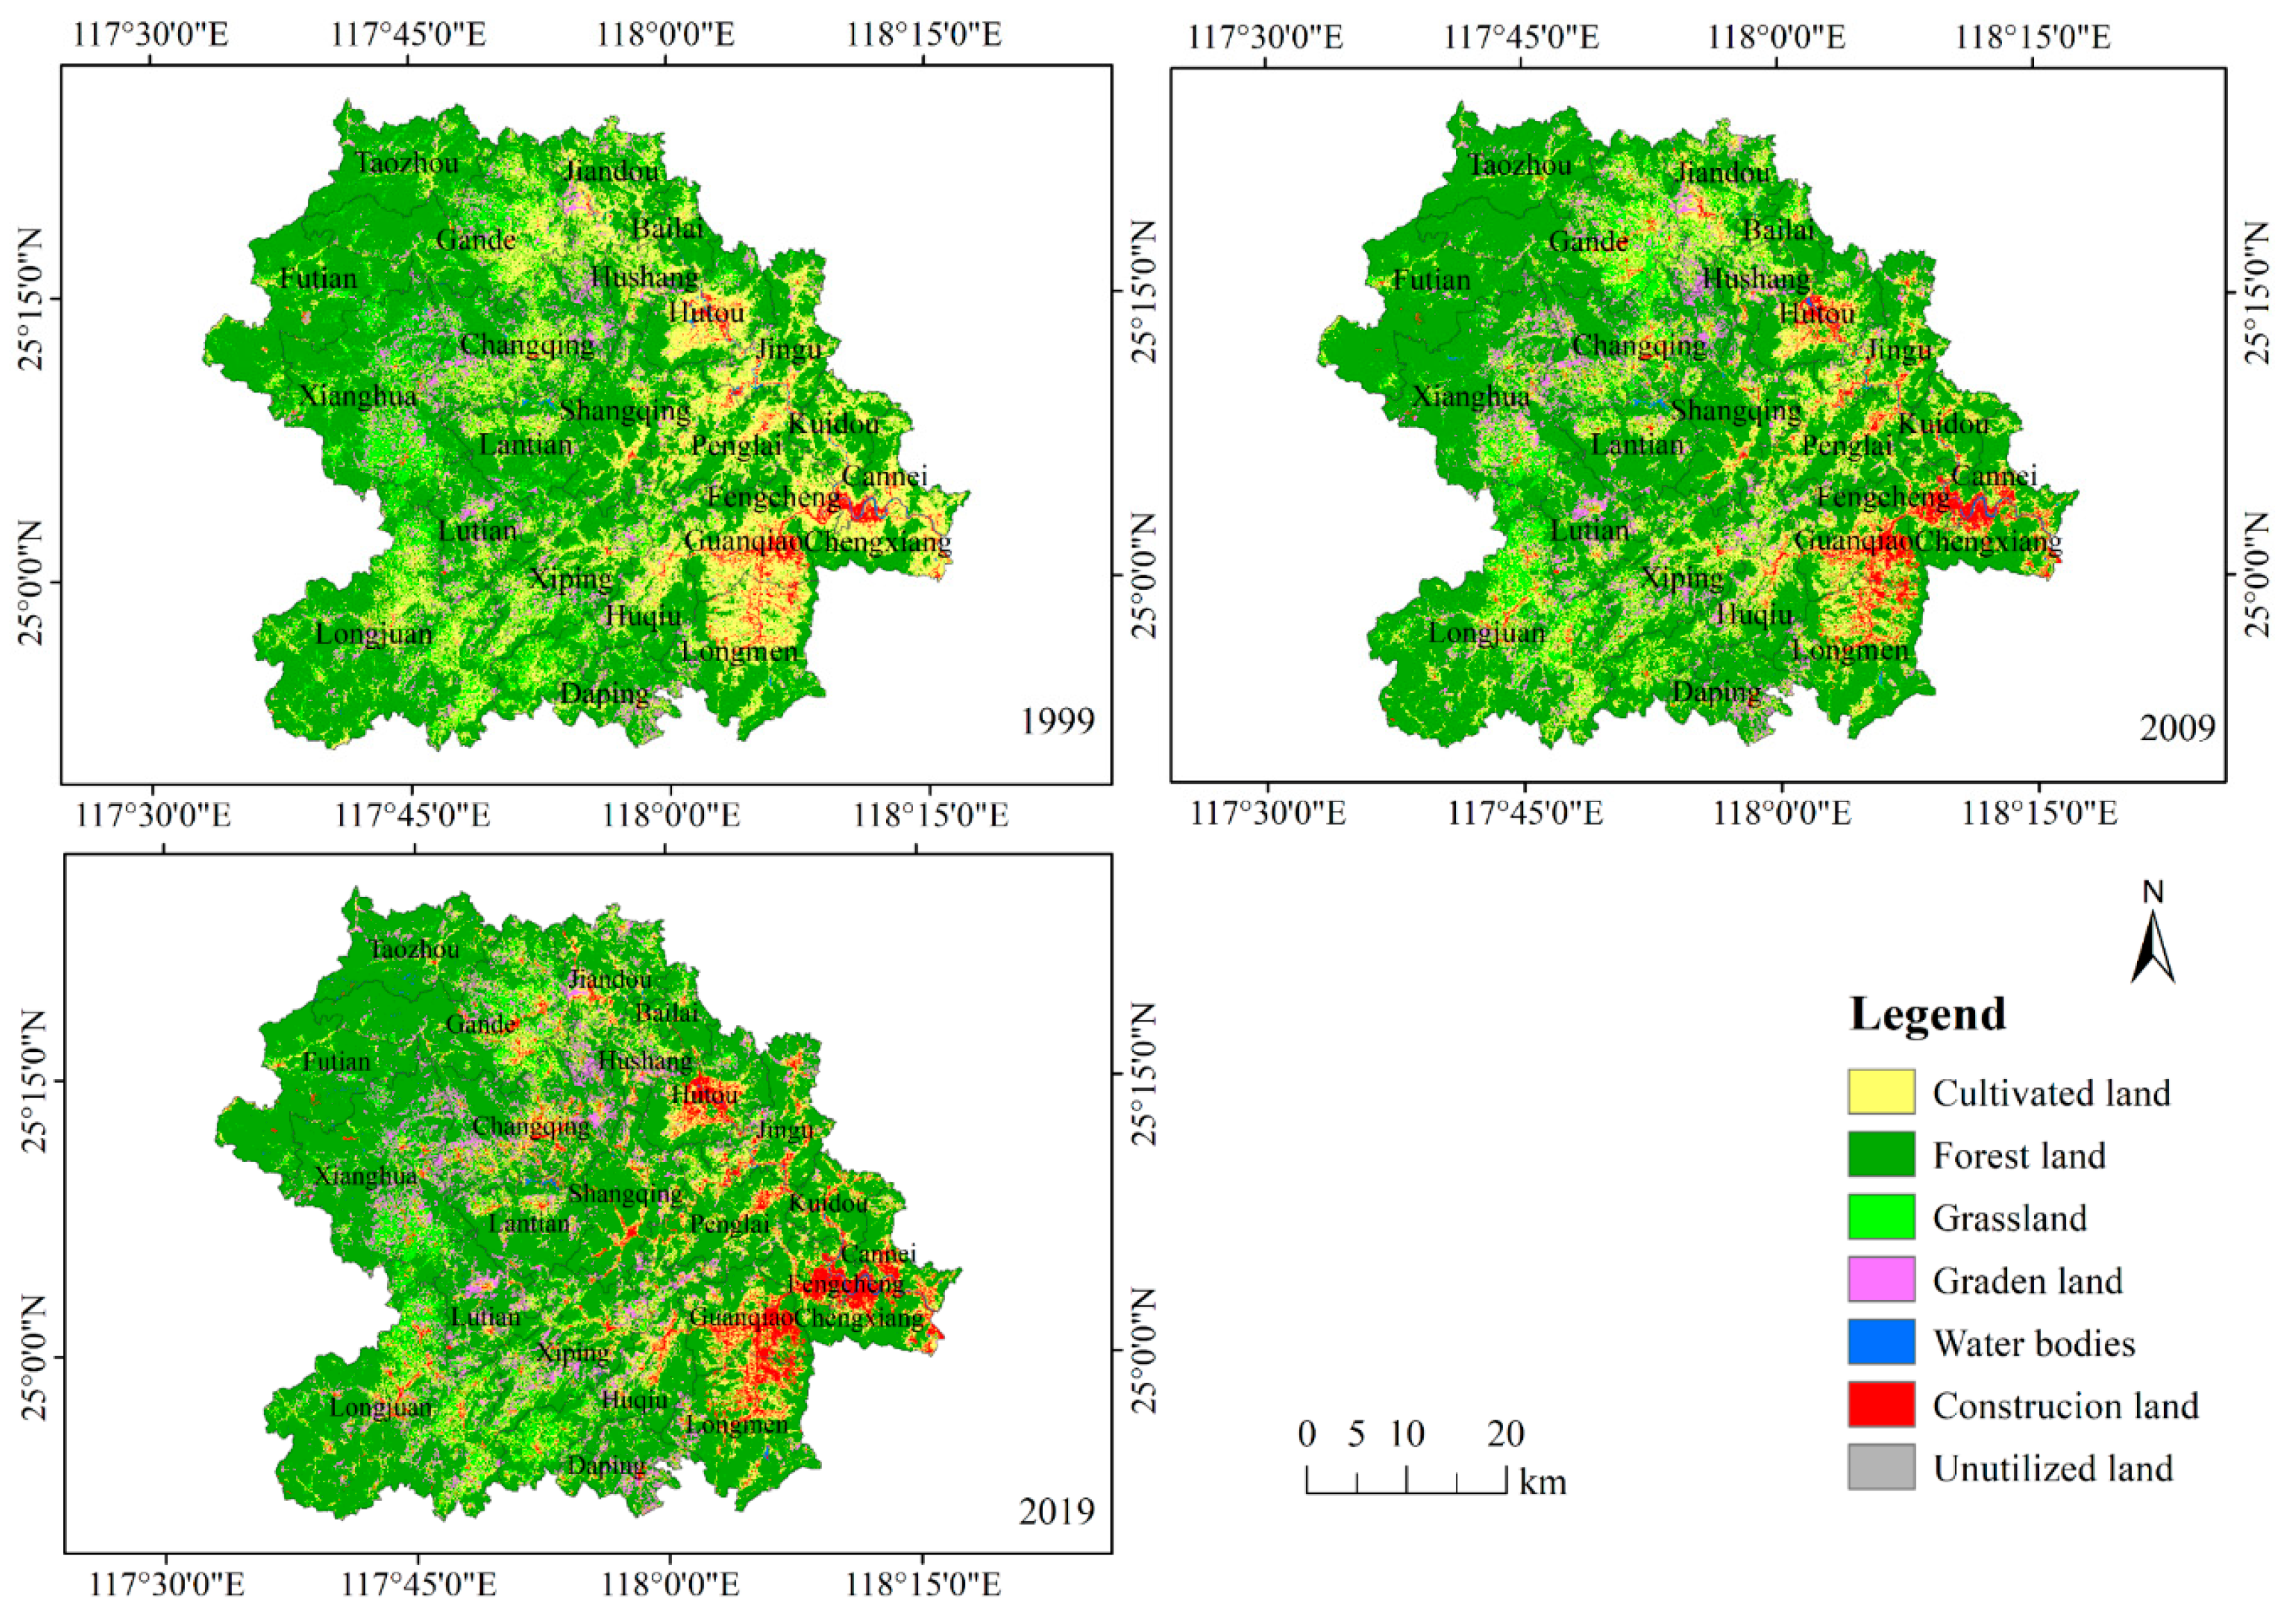
4.1. Characteristics of Land-Use Change

Table 4 shows the main characteristics of the land-use classification area and changes in Anxi County for the years 1999, 2009, and 2019. In 1999, the area of cultivated land in Anxi County accounted for 28.00% of the total area of the county. As shown in Figure 2, the most cultivated land was distributed in Longjuan (9.91%), Longmen (7.50%), Penglai (6.55%), Chengwang (6.40%), and Guanqiao (6.36%). Forest land was the largest land-use type in Anxi County, accounting for 56.57% of the total area, and was mainly distributed in the southwestern part of Anxi County, such as Longjuan (12.99%), Xianghua (8.59%), and Futian (7.85%). Tea-plantation-based gardens were mainly located in the western part of Anxi, an area with a high terrain and a mild climate. The region includes Changqing, Xianghua, and Gande, which are ideal tea-growing areas. Water bodies and unutilized land covered 10.15 km2 and 2.13 km2, respectively, which is relatively small. In 2009, the order and proportion of the area of land-use types in Anxi County remained unchanged, in the following order from largest to smallest: forest land > cultivated land > grassland > garden land > construction land > water bodies > unutilized land. Forest land was always the most dominant land-use type in Anxi County, with its proportion rising to 60.49% in 2019.
In terms of changes in land-use types, the cultivated land in Anxi County continued to decrease during the study period. Specifically, compared to 1999, the area of cultivated land in 2019 decreased by 308.28 km2, a reduction of 36.82%. This made cultivated land the land-use type that decreased in area the most. The grassland area also showed a continuous downward trend, decreasing by nearly 23 percent. On the contrary, there was an increasing trend in the area of forest land, with a total increase of 175.45 km2 or 10.37%. The area of garden land continued to increase, nearly doubling during the study period, from 154.41 km2 in 1999 to 236.79 km2 in 2019, an increase of 85.38 km2, with an average annual rate of change of 2.82%. It can be seen that after two decades of development, the area of garden land, comprising mainly tea gardens, became the top three land types in Anxi County. The area of water bodies and unutilized land did not change much during the study period. It is noteworthy that the area of construction land has continued to rise, tripling after 20 years of construction, with an increase of 206.10%. Further analysis shows that the growth of construction land area is mainly concentrated in the period from 1999 to 2009, reaching 9.50%, while in the second decade (2009–2019), the growth rate slows down but still reaches 5.70%, indicating that the demand for construction land in Anxi County has increased and a large amount of other land has been converted into construction land. Therefore, it is necessary to further analyze the conversion relationship between different land-use types.
To reflect the structural characteristics of land use and the transformation situation and direction of each type and to reveal the information on all types of transfers in and out, this study used the Markov model [47] to construct the transfer matrix of land-use types in Anxi County from 1999 to 2019 and then plotted it as a chordal map of land-type transfers (Figure 3).
According to the land-use transfer matrix, from 1999 to 2019, cultivated land was primarily converted to forest and construction land, with an area of 181.21 km2 and 85.96 km2, respectively, while the area of newly cultivated land was mainly transformed from grassland in Anxi County. The increase in the area of garden land is mainly due to the transformation of cultivated land, forest land, and grassland, which measure 56.81 km2, 23.00 km2, and 11.62 km2, respectively. Overall, the area of garden land converted to other land types is relatively small. The majority of new construction land is sourced from cultivated and forest land, with the former contributing 56.16% and the latter contributing 5.49% to the total area of new construction land.

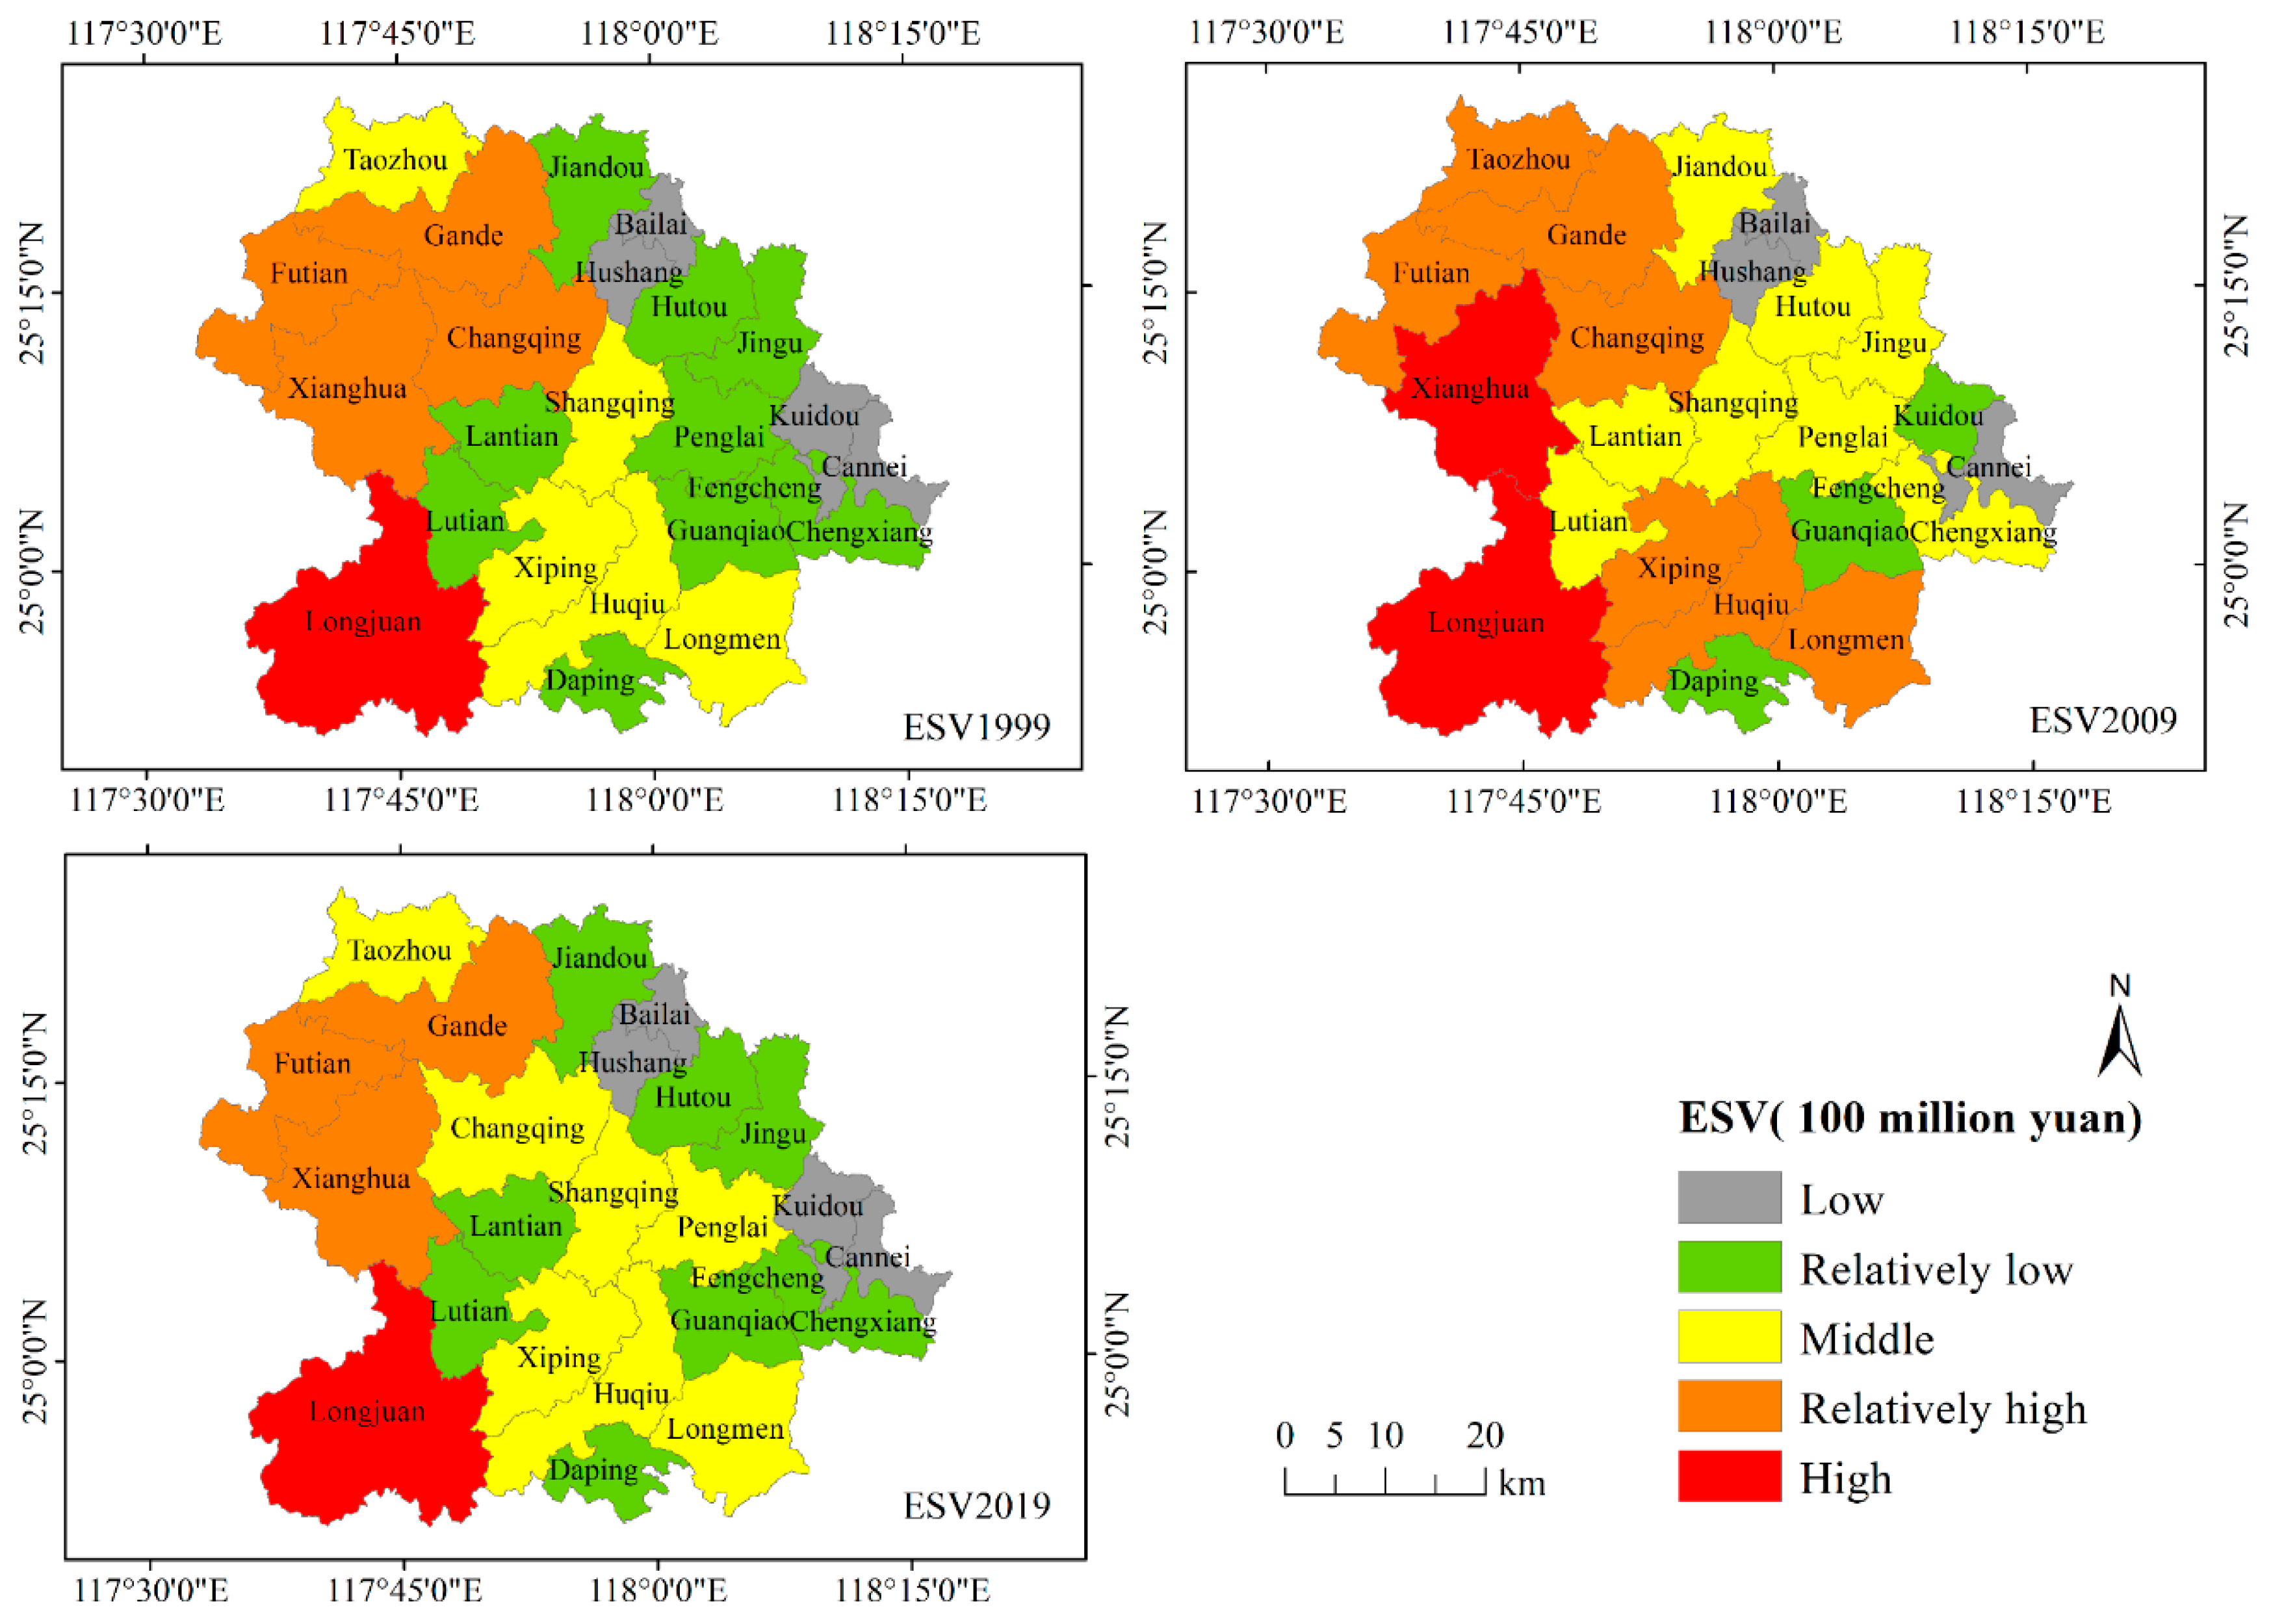
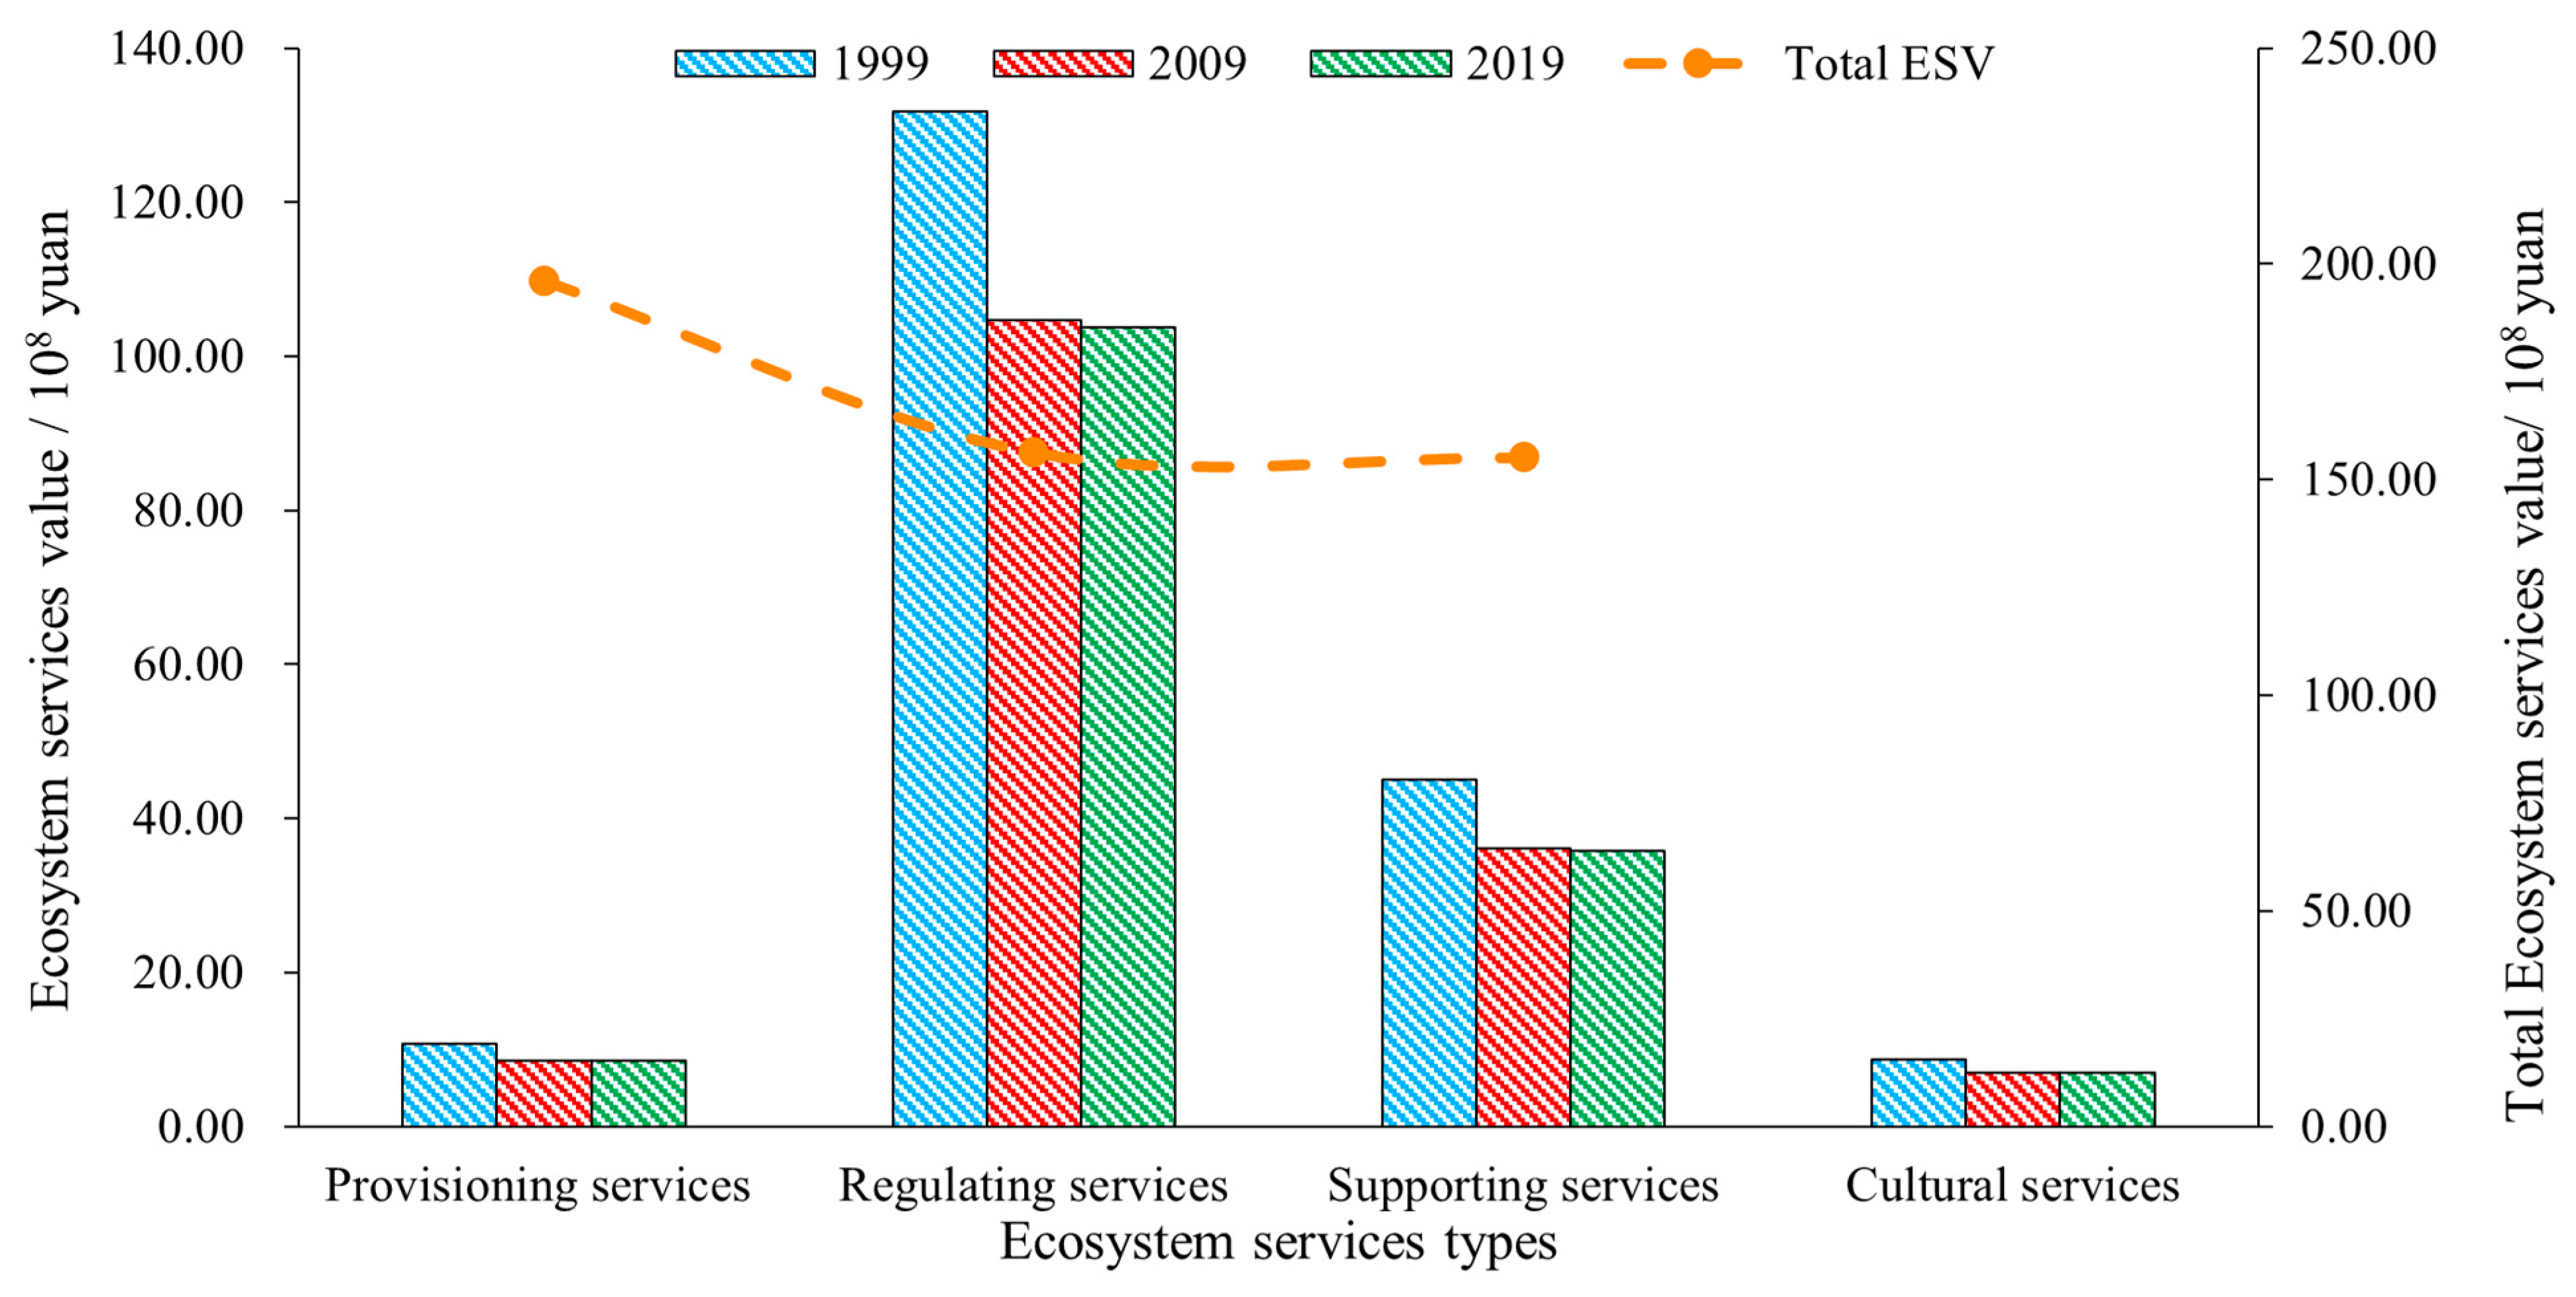
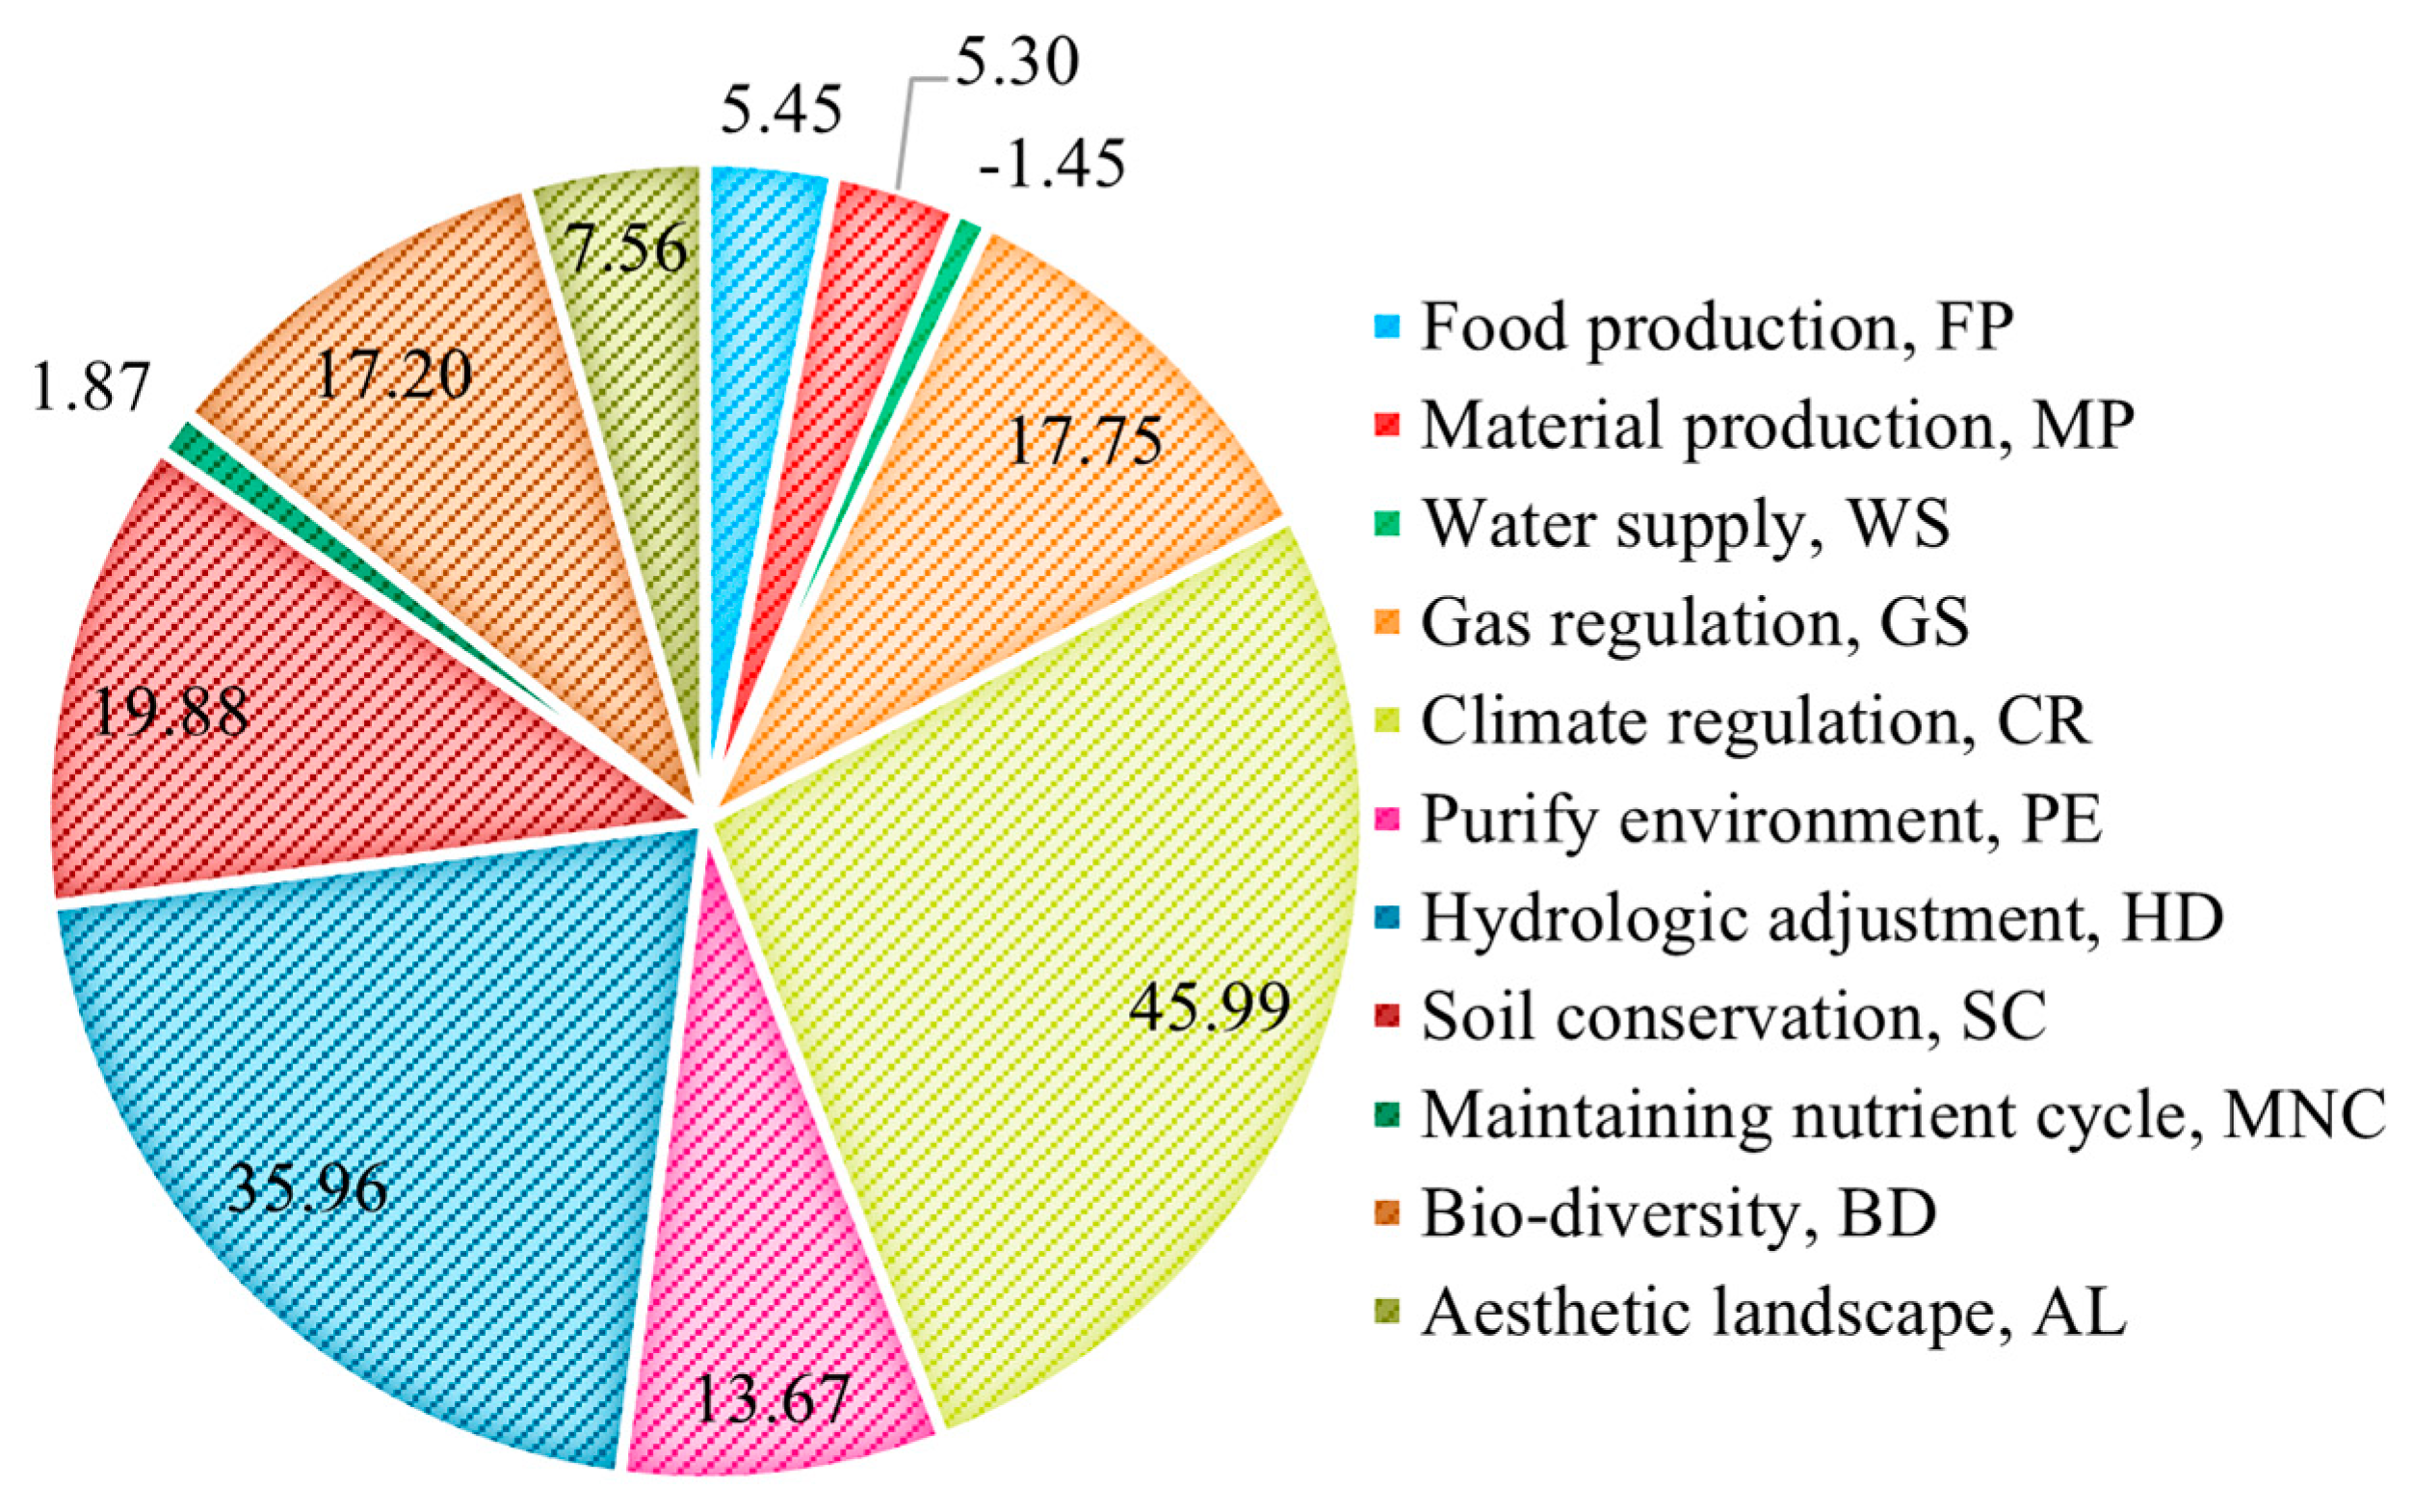
4.2. Changes in Ecosystem Services Value

Using the Formulas (4)–(8), the revised Anxi County ecosystem services value equivalent factor table (Table 5) can be calculated, and the ESV of Anxi County in 1999–2019 is calculated by combining the area of each land-use type. The results are shown in Table 6.
Table 6 presents a declining trend in the total value of ESV in Anxi County. The total value decreased from CNY 19.612 billion in 1999 to CNY 15.510 billion in 2019, resulting in a total loss of CNY 4.102 billion, a decrease of 20.92%. The rate of change is −0.21%, indicating that the ecosystem structure of Anxi County is somewhat vulnerable. Anxi County’s total ecological value declined most significantly between 1999 and 2009, with a loss rate of CNY 3.982 billion in ESV. However, between 2009 and 2019, the decline in ecological value slowed down significantly, decreasing by only CNY 120 million. This can be attributed to the significant growth in the area of garden land. It is worth noting that the land types with dominant ecosystem services in Anxi County are forest land, garden land, and grassland. The share of ESV of these three types in the total value fluctuates between 90.5% and 93.9%, which suggests that these three types play an extremely important role in the ecological functioning of Anxi County. Among them, forest land has the largest ESV value and maintains a dominant position. However, the ESV of forest land showed a general decreasing trend between 1999 and 2019, decreasing from 15,524 million CNY to 12,788 million CNY, a decrease of 17.62%. The ESV of garden land gradually declined between 1999 and 2009, mainly due to the reduction in the area of such land. However, the ESV of garden land rebounded between 2009 and 2019, increasing by a total of CNY 219 million. Additionally, the ESV of cultivated land in Anxi County showed a continuous downward trend, decreasing by CNY 814 million, or 52.85%, which was the largest decrease. This result suggests that changes in the ESV of cropland largely influenced changes in the overall ESV of the county.
In Figure 4, it is shown that the ESV of all townships in Anxi County has decreased over time. Longjuan experienced the largest decrease of CNY 590 million, while Futian had the largest decrease in unit area of 1.8 million CNY/km2. In 1999, most townships had low- or medium-value areas, with high-value areas being confined to the southwestern part of Anxi County. However, by 2009, high-value areas had expanded to nine townships, mainly in the five townships of Futian, Gande, Xianghua, Changqing, and Longjuan. In 2019, the high-value and relatively high-value areas had decreased to just four townships, a 125% decrease from 2009. During the study period, the areas with the largest decrease in ESV were mainly located in the southwestern part of Anxi County, mainly due to the conversion of high-ESV land types to low-ESV land types, such as the conversion of forest land to garden and grassland and the conversion of cultivated land to construction land.
After analyzing Table 7 and Figure 5, it was found that regulating services were the most important function of ecosystem services in Anxi County. The value amounted to CNY 34.009 billion between 1999 to 2019, accounting for 67.01% of the total value of ecosystem services. The supporting services function was next, with a ratio of 23.02%, and the cultural services function had the lowest value, accounting for only 4.47% of the total value. From 1999 to 2019, the value of secondary ecosystem services in Anxi County showed an upward and downward fluctuating and decreasing trend. The different mean values of various types of ecosystem services showed a clear size relationship in the order of CR (CNY 4.599 billion) > HD (CNY 3.596 billion) > SC (CNY 1.988 billion) > GS (CNY 1.775 billion) > BD (CNY 1.720 billion) > PE (CNY 1.367 billion) > AL (CNY 0.756 billion) > FP (CNY 0.545 billion) > MP (CNY 0.530 billion) > MNC (CNY 0.187 billion) > WS (CNY −0.145 billion) (Figure 6). Apart from the water supply, the food production function showed the largest decline of 37.76%, followed by the maintenance of nutrient cycles, with a rate of change of −26.74%. This decrease was mainly related to the decrease in the area of cultivated land. Aesthetic landscapes and biodiversity provided a gradual decline in ESV, while climate regulation had the slowest decline of all ecosystem services, with only a 19.17% decline.

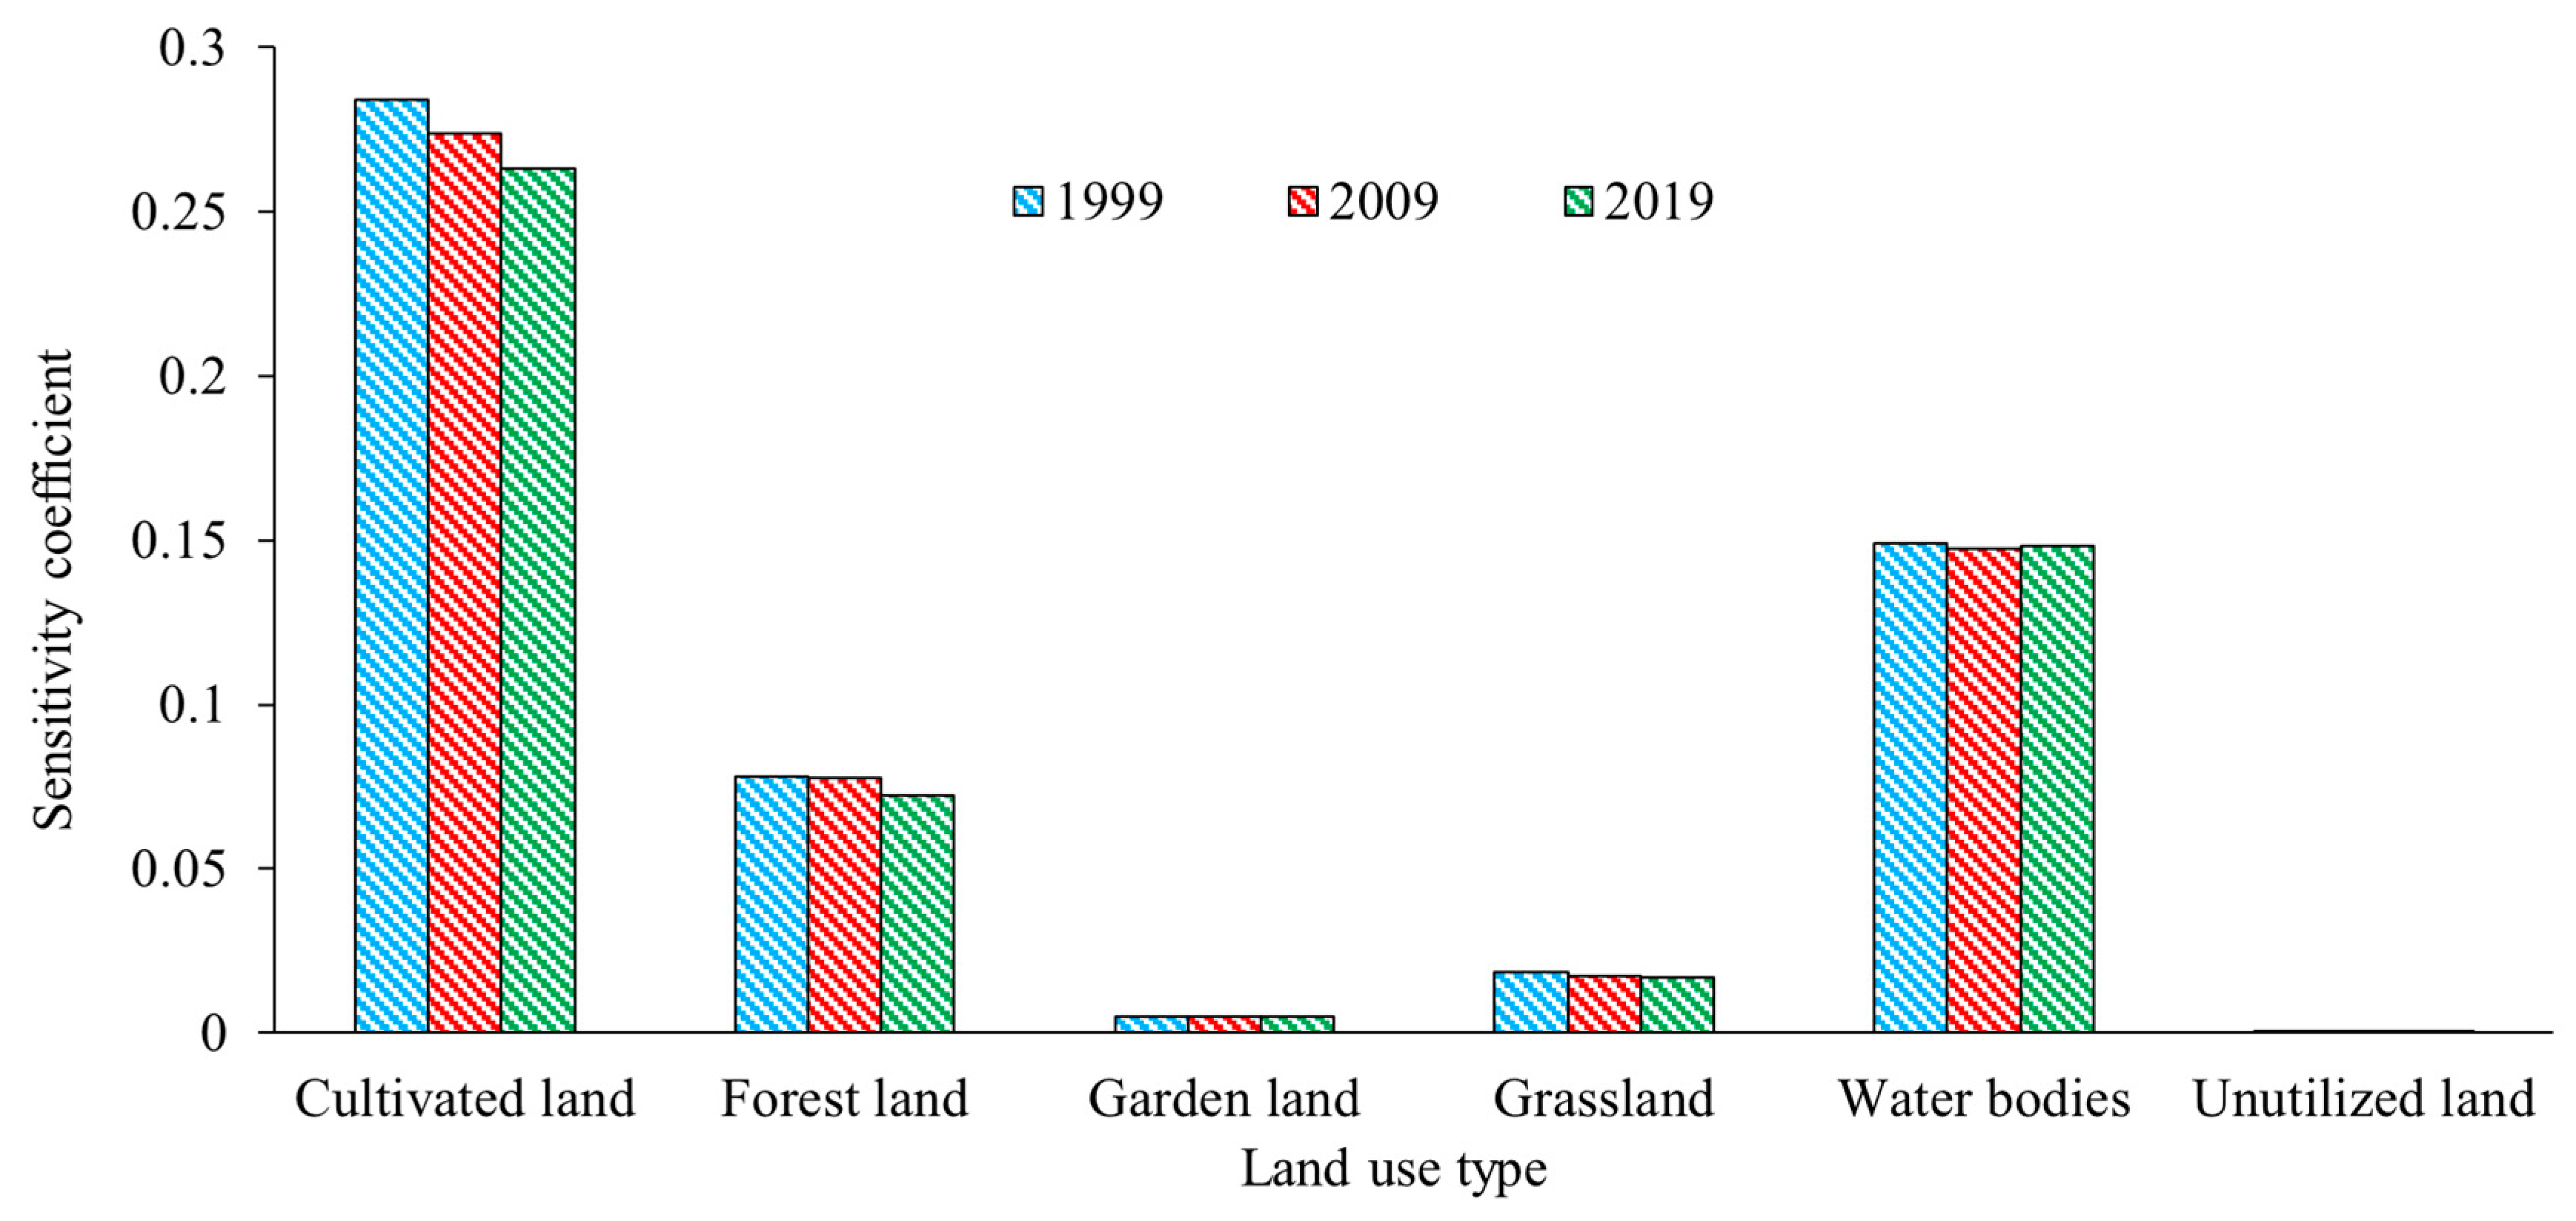
4.3. Sensitivity Analysis

Formula (9) was used to calculate the sensitivity index between 1999 and 2019, as shown in Figure 7. The value of CS during the period is less than 1, and the value of CS remained relatively constant in all stages, indicating that the elasticity of ESV in Anxi County is low with respect to VC. Cultivated land had the highest CS values, while unutilized land had the smallest CS values. Moreover, all land-use types have CS values below 0.1, indicating that changes in their value coefficients have a negligible effect on ESV in Anxi County. This suggests that the VC values used in this study are reliable and better reflect the actual situation in the study area.

4.4. Analysis of EEH

Since EEH manifests itself as the evolution of ecological environment and economic development over the study’s time period [45], this study segregated the period into three segments, 1999–2009, 2009–2019, and 1999–2019, to evaluate the EEH. Based on Equation (8), the EEH values for each time period in Anxi County were calculated as shown in Table 8.
Table 8 displays the EEH value for Anxi County throughout the entire study period (1999–2019) at −0.072, signifying a moderate overall value with an upward trend. This positive trend can be attributed to a lesser decline in ESV per unit and a greater increase in GDP per unit from 2009 to 2019, resulting in a larger EEH value according to Formula (10). The data presented emphasize the prominent presence of forest land and cultivated land in Anxi County. Forest land substantially contributes to regulatory, supportive, and cultural services, while cultivated land provides a high value for provisioning services, particularly in relation to food production. These land types play a pivotal role in upholding the stability of ESV in Anxi County. Especially since 2016, Anxi County, as a national ecological county, has persistently enhanced its regulation of the ecological and economic system. This is evident through efforts to improve the quality of the ecological environment, reduce the tea garden land area, and increase the forest land area on one hand. On the other hand, Anxi County has actively promoted the development of ecological industries, along with the high-quality growth of its GDP. Nevertheless, the rapid urbanization and industrialization associated with tea industry expansion have created a significant demand for land resources, leading to the encroachment of ecological lands, including forests and cultivated land. Therefore, it is imperative for Anxi County to further strengthen its regulation of the ecological and economic system, in order to facilitate the transformation from a transition zone to a coordination zone in terms of ecological and economic system coordination.

5. Discussion

Most of the existing studies cite Costanza’s [32] and Xie et al.’s [17] equivalence factors for ecosystem services value (ESV) evaluation when calculating the EEH index, but these studies do not consider the spatial heterogeneity of the region, coupled with the fact that people’s ability to pay and willingness to pay can affect the final monetary estimation of the ESV. The traditional research model is often biased from reality in small-scale studies, so it is necessary to improve the ESV assessment model. Therefore, this paper comprehensively considered the regional differences and socio-economic development status and regional differences and used the biomass adjustment coefficient and socio-economic adjustment coefficient to correct the ESV evaluation model on the equivalent factor values to obtain accurate ESV evaluation results, which were then used for the evaluation of EEH. The improved evaluation model can better explore the degree of coordination between ecological and economic development in Anxi County.

5.1. Land-Use Change

Land-use types in Anxi County changed significantly; specifically, the area of forest land, garden land, and construction land has increased. However, the area of cultivated land, grassland, water bodies, and unutilized land decreased. Among them, the forest land area experienced the most substantial growth, with an increase of over 175.00 km2 from 1999 to 2019. This growth was mainly in the southwestern region exhibiting a high altitude and a mild climate. This is due to the policies of “returning tea to forest” and “returning farmland to forest” [48]. The construction land area increased at the fastest rate, with an average annual rate of change of 10.31%. The findings match those observed in earlier studies [49]. New construction land was mainly converted from forest land and cultivated land. Similar to previous studies, the conversion of cultivated land to forestland was the most prominent [50].

5.2. Evolution Characteristics of Ecosystem Services Value (ESV)

Land-use change modifies the structure and function of ecosystems, thus impacting the value of local ecosystem services. This study’s findings revealed that ecosystem services of Anxi County generated CNY 19.612 billion, CNY 15.630 billion, and CNY 15.510 billion in 1999, 2009, and 2019, respectively, with an overall decreasing trend, indicating that there is a certain fragility in the ecosystem structure of Anxi County. The decline is primarily attributable to continuous land expansion for construction purposes coupled with reduced cultivated land and grassland areas. For many years, Anxi County has prioritized tea cultivation as a key industry to alleviate poverty among local farmers and improve their economic status. As a result, the most notable trend in land-use change in Anxi County between 1999 and 2019 was the transformation of cultivated land and grassland into garden land. The land-use conversion in Anxi County has had a significant impact on the overall value of ESV. This is primarily because garden land has a lower ESV per unit area compared to forest land and has a higher ESV per unit area compared to cultivated land [51]. Thus, the ongoing expansion of forest and garden land areas is offset by the loss of ESV due to the reduction in cultivated land and grassland areas, resulting in a downward trend in the total ESV. Additionally, it is noteworthy that forest, cultivated land, grassland, and garden land emerge as the most valuable land classes for ESV in Anxi County. However, this study found that the economic value of ecosystem services provided by forest land increased only slightly by 0.37 percent from 2009 to 2019, although forest land had significant growth. This finding is inconsistent with studies in other regions that have concluded that forest land change is the main cause of ESV change [48,49]. A possible explanation for this might be the obstacle of continuous cropping. During the study period, the afforestation area in Anxi County increased significantly, with coniferous forests, fir trees, and Masson pines dominating the forestry ecosystem. Nevertheless, this has led to a problem of continuous cropping obstacles, which in turn can cause a decline in the ecological function of the region [52]. In addition, cultivated land decreased the most over the study period, which is consistent with previous studies [53]. It has been shown that cultivated land performs ecological functions such as the production of organic matter, water conservation, gas regulation, environmental purification, recreation, and cultural education, making it an important ecological landscape and the most important productive resource for human survival [54]. It has been shown that the use of specific policies to influence land-use change increases the expected supply of some ecosystem services at the expense of others and that there are inevitable trade-offs between ecosystem services [55].
Spatially, the ESV of the Longjuan, Xianghua, Gande, Futian, and Changqing townships in the southwest of Anxi County contributed significantly to the county’s total ESV value between 1999 and 2019, accounting for 41.01% of the total value. These areas are highly mountainous regions with high altitudes and are suitable for the growth of tea trees, leading to high forest and garden coverage. This suggests that gardens provide a relatively high level of ecosystem service capacity in tea-producing areas, which is in line with other findings elsewhere [56]. In terms of the types of ecosystem services functions, the regulating services is the dominant function in Anxi County, contributing 67.01% of the total ESV value. The cultural services function has the lowest value due to the inadequate preservation of agricultural heritage.

5.3. Eco-Economic Harmony State and Changes

The eco-economic development of Anxi County as a whole is in a state of disharmony. The results of the study showed that from 1999 to 2019, the eco-economic harmony development in Anxi County shifted from the “relatively low conflict zone” to the “transitional zone”, and although it shifted to a favorable development trend, the overall degree of harmony was on the low side. This indicated that land use in Anxi County hurts regional economic development, and it also showed that the process of economic development has led to irrational use of land resources and the sustainable development of the eco-economic system is still threatened This is consistent with the findings of other studies [42,57].

5.4. Policy Implications

To promote high-quality development, the government must optimize land allocation, restrict the expansion of urban construction land, and consider the tradeoffs between ecosystem services when making land-use decisions [58]. The spatial, structural, and scalar dimensions of industrial and urban development must be rationalized. To ensure the long-term sustainability and stability of ecosystem services, the government must allocate ecological resources judiciously, enhance the ecological compensation system, and heighten public awareness about the paid use of ecological resources. The government should also control traditional tea gardens, increase the number of ecological tea gardens, promote high-quality and ecological models of efficient tea tree cultivation, optimize ecosystem service capacity, increase tea production, and foster ecological economic development [59]. Agricultural heritage is important for local development and sustainable regional development. The government should strengthen the preservation of agro-cultural heritage, which is essential for the current rural revitalization strategy and the enhancement of ecosystem cultural services. Furthermore, new concepts like green GDP can be integrated into the performance evaluation system of administrative organizations [60].

6. Conclusions

This paper used NPP to improve the biomass adjustment factor and used the willingness to pay and ability to pay to construct the socio-economic adjustment factor, which provides a scientific method to measure the change in ESV dynamically. This article proposed a coordination degree index of the eco-economy system based on the ratio of ESV per unit area and GDP per unit area, as well as the ratio of their rates of change. This method is more scientific and practical than traditional static evaluation methods.
Using the above methodology, this paper conducted a study on Anxi County to analyze the regional ESV at the township scale and to analyze the degree of EEH and its spatial evolution. The results showed that the ESV in Anxi County is decreasing, which is mainly due to the increase in construction land and the decrease in cultivated land and grassland. The eco-economic systems in Anxi County were not very harmonious, but there was a positive trend. This suggests that there is an urgent need to pay attention to land-use planning and to gradually increase the value of regional ecosystem services in order to promote the harmony of the ecological and economic systems and the green and high-quality development of the region.
However, the eco-economy system has rich connotations and extensions, and the complexity of its harmonious development issue is further exacerbated by its comprehensiveness and uncertainty. The research on the evaluation method of the eco-economy system coordination degree has not yet formed a unified research paradigm and evaluation system, and there are significant differences in research results between different research methods. Therefore, it is necessary to further strengthen the optimization of relevant parameters in our follow-up research, to optimize the harmony degree index, and then provide a scientific reference for the coordinated and sustainable high-quality development of the regional eco-economy.

Author Contributions

Conceptualization, W.L. and K.S.; methodology, X.H., Q.P. and K.S.; software, X.H., Q.P. and K.S.; investigation, S.F. and R.Z.; data curation, X.H. and Q.P.; writing—original draft preparation, X.H. and Q.P.; writing—review and editing, W.L. and K.S.; visualization, Q.P. and K.S.; supervision, W.L., S.F. and K.S.; project administration, R.Z. and K.S.; funding acquisition, S.F. and K.S. All authors have read and agreed to the published version of the manuscript.

Funding

This research was funded by the Humanity and Social Science Foundation of Ministry of Education of China (Grant No. 23YJCZH192), Natural Science Foundation of Fujian Province (2021J01650), Major Project Funding for Social Science Research Base in Fujian Province Social Science Planning: Ecological Civilization Research Center (Grant No. FJ2022JDZ035), Fujian Province Social Science Planning (Grant No. FJ2021C074), Construction of Modern Agricultural and Industrial Park for Anxi County in Fujian Province, Ministry of Agriculture and Rural Affairs, China (Grant No. KMD18003A), and National Scientific Research Project Cultivation Plan of Anxi College of Tea Science of Fujian Agriculture and Forestry University (Grant No. ACKY2023011).

Institutional Review Board Statement

Not applicable.

Informed Consent Statement

Not applicable.

Data Availability Statement

The data that support the findings of this study are available from the authors upon reasonable request.

Conflicts of Interest

The authors declare no conflicts of interest.

References

  1. Fang, C.L.; Zhou, C.H.; Gu, C.L.; Chen, L.D.; Li, S.C. A Proposal for the Theoretical Analysis of the Interactive Coupled Effects between Urbanization and the Eco-Environment in Mega-Urban Agglomerations. J. Geogr. Sci. 2017, 27, 1431–1449. [Google Scholar] [CrossRef]
  2. Chen, W.X.; Chi, G.Q. Urbanization and Ecosystem Services: The Multi-Scale Spatial Spillover Effects and Spatial Variations. Land Use Policy 2022, 114, 105964. [Google Scholar] [CrossRef]
  3. Wu, Y.Z.; Huang, Z.C.; Han, D.; Qiu, X.L.; Pan, Y.X. Evolution of Urban Ecosystem Service Value and a Scenario Analysis Based on Land Utilization Changes: A Case Study of Hangzhou, China. Sustainability 2023, 15, 8274. [Google Scholar] [CrossRef]
  4. He, J.; Yu, Y.; Sun, L.X.; Zhang, H.Y.; Malik, I.; Wistuba, M.; Yu, R. Spatiotemporal Change in the Land Use and Ecosystem Service Value in the Aral Sea Basin (1993–2018). Environ. Sci. Pollut. Res. 2022, 29, 74416–74427. [Google Scholar] [CrossRef] [PubMed]
  5. Chen, H.Z.; Chen, Y.; Chen, X.S.; Zhang, X.Z.; Wu, H.W.; Li, Z.H. Impacts of Historical Land Use Changes on Ecosystem Services in Guangdong Province, China. Land 2022, 11, 809. [Google Scholar] [CrossRef]
  6. Fu, B.L.; Li, Y.; Zhang, B.; Yin, B.S.; Zhu, H.L.; Xing, Z.F. Dynamic Evaluation of Ecosystem Service Value of the Riparian Zone Based on Remote Sensing from 1986 to 2012. Solid Earth Discuss. 2015, 7, 2151–2184. [Google Scholar]
  7. Costanza, R.; D’arge, R.; De Groot, R.; Farber, S.; Grasso, M.; Hannon, B.; Limburg, K.; Naeem, S.; O’neill, R.V.; Paruelo, J.; et al. The Value of the World’s Ecosystem Services and Natural Capital. Ecol. Econ. 1997, 387, 253–260. [Google Scholar] [CrossRef]
  8. Mamat, Z.; Yimit, H.; Eziz, M.; Ablimit, A. Analysis of the Ecology-Economy Coordination Degree in Yanqi Basin, Xinjiang, China. Asian J. Chem. 2013, 25, 9034–9040. [Google Scholar] [CrossRef]
  9. Jiao, L.; Yang, R.; Zhang, Y.L.; Yin, J.; Huang, J.Y. The Evolution and Determinants of Ecosystem Services in Guizhou—A Typical Karst Mountainous Area in Southwest China. Land 2022, 11, 1164. [Google Scholar] [CrossRef]
  10. Feng, Z.; Jin, X.R.; Chen, T.Q.; Wu, J.S. Understanding Trade-Offs and Synergies of Ecosystem Services to Support the Decision-Making in the Beijing–Tianjin–Hebei Region. Land Use Policy 2021, 106, 105446. [Google Scholar] [CrossRef]
  11. Farley, J.; Costanza, R. Payments for Ecosystem Services: From Local to Global. Ecol. Econ. 2010, 69, 2060–2068. [Google Scholar] [CrossRef]
  12. Ouyang, Z.; Song, C.; Song, C.; Zheng, H.; Zheng, H.; Polasky, S.; Polasky, S.; Xiao, Y.; Xiao, Y.; Bateman, I.J.; et al. Using Gross Ecosystem Product (GEP) to Value Nature in Decision Making. Proc. Natl. Acad. Sci. USA 2020, 117, 14593–14601. [Google Scholar] [CrossRef]
  13. Fu, B.J.; Su, C.H.; Wei, Y.P.; Willett, I.R.; Lü, Y.H.; Liu, G.H. Double Counting in Ecosystem Services Valuation: Causes and Countermeasures. Ecol. Res. 2011, 26, 1–14. [Google Scholar] [CrossRef]
  14. Jiang, W.; Wu, T.; Fu, B.J. The Value of Ecosystem Services in China: A Systematic Review for Twenty Years. Ecosyst. Serv. 2021, 52, 101365. [Google Scholar] [CrossRef]
  15. Xie, G.D.; Li, W.H.; Xiao, Y.; Zhang, B.; Lu, C.X.; An, K.; Wang, J.X.; Xu, K.; Wang, J.Z. Forest Ecosystem Services and Their Values in Beijing. Chin. Geogr. Sci. 2010, 20, 51–58. [Google Scholar] [CrossRef]
  16. Yu, G.; Lu, C.X.; Xie, G.D.; Luo, Z.J.; Yang, L. Grassland Ecosystem Services and Their Economic Evaluation in Qinghai-Tibetan Plateau Based on RS and GIS. Int. Geosci. Remote Sens. Symp. 2005, 4, 2961–2964. [Google Scholar]
  17. Xie, G.D.; Zhang, C.X.; Zhang, L.M.; Chen, W.H.; Li, S.M. Improvement of the Evaluation Method for Ecosystem Service Value Based on Per Unit Area. J. Nat. Resour. 2015, 30, 1243–1254. [Google Scholar]
  18. Xie, G.D.; Zhang, C.X.; Zhen, L.; Zhang, L.M. Dynamic Changes in the Value of China’s Ecosystem Services. Ecosyst. Serv. 2017, 26, 146–154. [Google Scholar] [CrossRef]
  19. Xiong, X.X.; Zhou, T.T.; Cai, T.; Huang, W.; Li, J.; Cui, X.F.; Li, F. Land Use Transition and Effects on Ecosystem Services in Water-Rich Cities under Rapid Urbanization: A Case Study of Wuhan City, China. Land 2022, 11, 1153. [Google Scholar] [CrossRef]
  20. Rodríguez, J.P.; Beard, T.D., Jr.; Bennett, E.M.; Cumming, G.S.; Cork, S.J.; Agard, J.; Dobson, A.P.; Peterson, G.D. Trade-Offs across Space, Time, and Ecosystem Services. Ecol. Soc. 2006, 11, 28. [Google Scholar] [CrossRef]
  21. Chan, K.M.A.; Shaw, M.R.; Cameron, D.R.; Underwood, E.C.; Daily, G.C. Conservation Planning for Ecosystem Services. PLoS Biol. 2006, 4, e379. [Google Scholar] [CrossRef]
  22. Zhang, Z.; Xia, F.; Yang, D.; Huo, J.; Wang, G.; Chen, H. Spatiotemporal Characteristics in Ecosystem Service Value and Its Interaction with Human Activities in Xinjiang, China. Ecol. Indic. 2020, 110, 105826. [Google Scholar] [CrossRef]
  23. Li, F.; Zhang, S.W.; Yang, J.C.; Chang, L.P.; Yang, H.J.; Bu, K. Effects of Land Use Change on Ecosystem Services Value in West Jilin since the Reform and Opening of China. Ecosyst. Serv. 2018, 31, 12–20. [Google Scholar]
  24. Liu, L. A Sustainability Index with Attention to Environmental Justice for Eco-City Classification and Assessment. Ecol. Indic. 2018, 85, 904–914. [Google Scholar] [CrossRef]
  25. Mathewos, M.; Aga, A.O. Evaluation of the Linkages between Ecosystem Services and Land Use/Land Cover Changes in Matenchose Watershed, Rift Valley Basin, Ethiopia. Quaternary 2023, 6, 13. [Google Scholar] [CrossRef]
  26. Ye, Y.Q.; Zhang, J.E.; Wang, T.; Bai, H.; Wang, X.; Zhao, W. Changes in Land-Use and Ecosystem Service Value in Guangdong Province, Southern China, from 1990 to 2018. Land 2021, 10, 426. [Google Scholar] [CrossRef]
  27. Chen, W.X.; Zhao, H.B.; Li, J.F.; Zhu, L.J.; Wang, Z.Y.; Zeng, J. Land Use Transitions and the Associated Impacts on Ecosystem Services in the Middle Reaches of the Yangtze River Economic Belt in China Based on the Geo-Informatic Tupu Method. Sci. Total Environ. 2020, 701, 134690. [Google Scholar] [CrossRef]
  28. Ma, S.; Qiao, Y.P.; Wang, L.J.; Zhang, J.C. Terrain Gradient Variations in Ecosystem Services of Different Vegetation Types in Mountainous Regions: Vegetation Resource Conservation and Sustainable Development. For. Ecol. Manag. 2021, 482, 118856. [Google Scholar] [CrossRef]
  29. Chen, T.; Peng, L.; Wang, Q.; Liu, S. Measuring the Coordinated Development of Ecological and Economic Systems in Hengduan Mountain Area. Sustainability 2017, 9, 1270. [Google Scholar] [CrossRef]
  30. Suh, S. Theory of Materials and Energy Flow Analysis in Ecology and Economics. Ecol. Model. 2005, 189, 251–269. [Google Scholar] [CrossRef]
  31. Common, M.; Perrings, C. Towards an Ecological Economics of Sustainability. Econ. Sustain. 2017, 6, 199–226. [Google Scholar]
  32. Costanza, R.; de Groot, R.; Sutton, P.; van der Ploeg, S.; Anderson, S.J.; Kubiszewski, I.; Farber, S.; Turner, R.K. Changes in the Global Value of Ecosystem Services. Glob. Environ. Chang. 2014, 26, 152–158. [Google Scholar] [CrossRef]
  33. Zhang, Y.; Zhao, D.F.; Lin, J.S.; Jiang, L.; Huang, B.F.; Jiang, F.S.; Wang, M.K.; Ge, H.L.; Huang, Y.H. Impacts of Collapsing Gullies on the Dynamics of Soil Organic Carbon in the Red Soil Hilly Region of Southeast China. Catena 2020, 190, 104547. [Google Scholar] [CrossRef]
  34. Lu, Y.Y.; Xu, X.L.; Zhao, J.H.; Han, F. Spatiotemporal Evolution of Mountainous Ecosystem Services in an Arid Region and Its Influencing Factors: A Case Study of the Tianshan Mountains in Xinjiang. Land 2022, 11, 2164. [Google Scholar] [CrossRef]
  35. Kou, J.; Wang, J.J.; Ding, J.L.; Ge, X.Y. Spatial Simulation and Prediction of Land Use/Land Cover in the Transnational Ili-Balkhash Basin. Remote Sens. 2023, 15, 3059. [Google Scholar] [CrossRef]
  36. GB/T 21010-2017; The Classification of Current Land-Use Situation. Standards Press of China: Beijing, China, 2017.
  37. Liu, W.; Zhan, J.Y.; Zhao, F.; Yan, H.M.; Zhang, F.; Wei, X.Q. Impacts of Urbanization-Induced Land-Use Changes on Ecosystem Services: A Case Study of the Pearl River Delta Metropolitan Region, China. Ecol. Indic. 2019, 98, 228–238. [Google Scholar] [CrossRef]
  38. Redo, D.J.; Aide, T.M.; Clark, M.L.; Andrade-Núñez, M.J. Impacts of Internal and External Policies on Land Change in Uruguay, 2001–2009. Environ. Conserv. 2012, 39, 122–131. [Google Scholar] [CrossRef]
  39. Su, K.; Wei, D.Z.; Lin, W.X. Evaluation of Ecosystem Services Value and Its Implications for Policy Making in China—A Case Study of Fujian Province. Ecol. Indic. 2020, 108, 105752. [Google Scholar] [CrossRef]
  40. Mosammam, H.M.; Nia, J.T.; Khani, H.; Teymouri, A.; Kazemi, M. Monitoring Land Use Change and Measuring Urban Sprawl Based on Its Spatial Forms: The Case of Qom City. Egypt. J. Remote Sens. Space Sci. 2017, 20, 103–116. [Google Scholar]
  41. Wang, M.; Sun, X.F. Potential Impact of Land Use Change on Ecosystem Services in China. Environ. Monit. Assess. 2016, 188, 248. [Google Scholar] [CrossRef]
  42. Fu, J.; Zhang, Q.; Wang, P.; Zhang, L.; Tian, Y.Q.; Li, X.R. Spatio-Temporal Changes in Ecosystem Service Value and Its Coordinated Development with Economy: A Case Study in Hainan Province, China. Remote Sens. 2022, 14, 970. [Google Scholar] [CrossRef]
  43. Zhu, S.C.; Huang, J.L.; Zhao, Y.L. Coupling Coordination Analysis of Ecosystem Services and Urban Development of Resource-Based Cities: A Case Study of Tangshan City. Ecol. Indic. 2022, 136, 108706. [Google Scholar] [CrossRef]
  44. Mamat, A.; Halik, Ü.; Rouzi, A. Variations of Ecosystem Service Value in Response to Land-Use Change in the Kashgar Region, Northwest China. Sustainability 2018, 10, 200. [Google Scholar] [CrossRef]
  45. Cao, S.; Zhai, Q.M. Analysis of Harmonious Development of Eco-Economic System in the Second Green Isolation Area in Beijing. Discret. Dyn. Nat. Soc. 2022, 2022, 7009929. [Google Scholar] [CrossRef]
  46. Wang, X.M.; Xu, M.; Zhang, Y.; Xu, N.Z.; Zhang, Y.H. Evaluation of Eco-Economy Harmony and Spatial Evolution of the Urban Agglomeration Area in the Great Pearl River Delta. IOP Conf. Ser. Earth Environ. Sci. 2018, 153, 062035. [Google Scholar] [CrossRef]
  47. Das, S.; Sarkar, R. Predicting the Land Use and Land Cover Change Using Markov Model: A Catchment Level Analysis of the Bhagirathi-Hugli River. Spat. Inf. Res. 2019, 27, 439–452. [Google Scholar] [CrossRef]
  48. Li, W.; Geng, J.W.; Bao, J.L.; Lin, W.X.; Wu, Z.Y.; Fan, S.S. Spatial and Temporal Evolution Patterns of Habitat Quality under Tea Plantation Expansion and Multi-Scenario Simulation Study: Anxi County as an Example. Land 2023, 12, 1308. [Google Scholar] [CrossRef]
  49. Xin, R.; Skov-Petersen, H.; Zeng, J.; Zhou, J.; Li, K.; Hu, J.; Liu, X.; Kong, J.; Wang, Q. Identifying Key Areas of Imbalanced Supply and Demand of Ecosystem Services at the Urban Agglomeration Scale: A Case Study of the Fujian Delta in China. Sci. Total Environ. 2021, 791, 148173. [Google Scholar] [CrossRef]
  50. Li, S.; Cao, Y.; Liu, J.; Wang, S.; Zhou, W. Assessing Spatiotemporal Dynamics of Land Use and Cover Change and Carbon Storage in China’s Ecological Conservation Pilot Zone: A Case Study in Fujian Province. Remote Sens. 2022, 14, 4111. [Google Scholar] [CrossRef]
  51. Lei, J.C.; Wang, S.; Wang, J.M.; Wu, S.Q.; You, X.B.; Wu, J.; Cui, P.; Ding, H. Effects of Land Use Change on Ecosystem Services Value of Xunwu County. Acta Ecol. Sin. 2019, 39, 3089–3099. [Google Scholar]
  52. Wu, Z.Y.; Li, J.J.; Zheng, J.; Liu, J.F.; Liu, S.Y.; Lin, W.X.; Wu, C.Z. Soil Microbial Community Structure and Catabolic Activity Are Significantly Degenerated in Successive Rotations of Chinese Fir Plantations. Sci. Rep. 2017, 7, 6691. [Google Scholar] [CrossRef]
  53. Quan, B.; Bai, Y.J.; Römkens, M.J.M.; Chang, K.T.; Song, H.; Guo, T.; Lei, S. Urban Land Expansion in Quanzhou City, China, 1995–2010. Habitat Int. 2015, 48, 131–139. [Google Scholar] [CrossRef]
  54. Song, W.; Deng, X.Z. Effects of Urbanization-Induced Cultivated Land Loss on Ecosystem Services in the North China Plain. Energies 2015, 8, 5678–5693. [Google Scholar] [CrossRef]
  55. Polasky, S.; Nelson, E.; Camm, J.; Csuti, B.; Fackler, P.; Lonsdorf, E.; Montgomery, C.; White, D.; Arthur, J.; Garber-Yonts, B.; et al. Where to Put Things? Spatial Land Management to Sustain Biodiversity and Economic Returns. Biol. Conserv. 2008, 141, 1505–1524. [Google Scholar] [CrossRef]
  56. Liu, S.; Yao, X.; Zhao, D.; Lu, L. Evaluation of the Ecological Benefits of Tea Gardens in Meitan County, China, Using the InVEST Model. Environ. Dev. Sustain. 2021, 23, 7140–7155. [Google Scholar] [CrossRef]
  57. Li, W.; Yi, P.; Zhang, D.; Zhou, Y. Assessment of Coordinated Development between Social Economy and Ecological Environment: Case Study of Resource-Based Cities in Northeastern China. Sustain. Cities Soc. 2020, 59, 102208. [Google Scholar] [CrossRef]
  58. Xu, X.; Yang, G.; Tan, Y.; Liu, J.; Hu, H. Ecosystem Services Trade-Offs and Determinants in China’s Yangtze River Economic Belt from 2000 to 2015. Sci. Total Environ. 2018, 634, 1601–1614. [Google Scholar] [CrossRef] [PubMed]
  59. Wang, C.; Zhao, M.; Xu, Y.; Zhao, Y.; Zhang, X. Ecosystem Service Synergies Promote Ecological Tea Gardens: A Case Study in Fuzhou, China. Remote Sens. 2023, 15, 540. [Google Scholar] [CrossRef]
  60. Fisher, B.; Turner, R.K.; Morling, P. Defining and Classifying Ecosystem Services for Decision Making. Ecol. Econ. 2009, 68, 643–653. [Google Scholar] [CrossRef]
Figure 1. Location of the study area.
Sustainability 16 01491 g001
Figure 2. Land-use patterns in Anxi County from 1999 to 2019.
Sustainability 16 01491 g002
Figure 3. Land-use transfer in Anxi County from 1999 to 2019.
Sustainability 16 01491 g003
Figure 4. Spatial changes in ecosystem services value in Anxi County from 1999 to 2019. The five classes of ecosystem services values were based on the five-level natural breaks method in ArcGIS 10.8 software.
Sustainability 16 01491 g004
Figure 5. Ecosystem services value in Anxi County from 1999 to 2019 (by service type).
Sustainability 16 01491 g005
Figure 6. Average value of ecosystem services value in Anxi County from 1999 to 2019.
Sustainability 16 01491 g006
Figure 7. Coefficient of sensitivity of ESV.
Sustainability 16 01491 g007
Table 1. The information on Landsat images.
YearSensorBand SignalCloudageDate
1999TM1190430.39.15
1200420.014.17
1200430.194.17
2009TM1190430.2910.19
1200420.4310.03
1200430.110.03
2019OLI1190430.139.26
1200420.2612.02
1200430.2312.02
Table 2. Social-economic data and natural data.
AreaYearTown Engel CoefficientRural Engel
Coefficient
Urban
Population Proportion (%)
Per Capita GDP
(CNY)
Annual Precipitation (mm)Annual Average Temperature (°C)
Anxi County19990.4350.4690.35776756.00 1841.221.5
20090.3890.4240.478823,555.07 1074.421.9
20190.32090.40830.56760,800.00 1466.921.8
Nationwide19990.4210.5260.3627229.00 629.09.7
20090.3650.410.49926,180.00 591.19.9
20190.2760.30.595870,892.00 645.510.34
Table 3. The classification of eco-economy harmony.
EEHTypeEEHType
0.8 ≤ EEH < 1High coordination zone−0.2 ≤ EEH < 0Transitional zone
0.6 ≤ EEH < 0.8Relatively high coordination zone−0.4 ≤ EEH < −0.2Relatively low conflict zone
0.4 ≤ EEH < 0.5Moderate coordination zone−0.6 ≤ EEH < −0.4Moderate conflict zone
0.2 ≤ EEH < 0.4Relatively low coordination zone−0.8 ≤ EEH < −0.6Relatively high conflict zone
0 ≤ EEH < 0.2Latent crisis areaEEH < −0.8High conflict zone
Table 4. Statistics of land-use change in Anxi County from 1999 to 2019.
Land Use Type199920092019The Degree of Dynamism of Land Use/%
Area
(km2)
Ratios
(%)
Area
(km2)
Ratios
(%)
Area
(km2)
Ratios
(%)
1999–20092009–20191999–2019
Cultivated land837.2028.00662.6322.16528.9217.69−2.09−2.02−1.84
Forest land1691.3156.571808.3760.491866.7662.440.690.320.52
Garden land151.415.06178.365.97236.797.921.783.282.82
Grassland247.498.28228.277.64190.786.38−0.78−2.29−0.82
Water bodies10.150.348.790.299.320.31−1.34−0.82−0.41
Construction land50.011.6797.523.26153.075.129.505.7010.31
Unutilized land2.130.075.750.194.050.1417.05−2.964.52
Table 5. Ecosystem services equivalent value of Anxi County (unit: CNY/hm2·a).
Top Classification of Ecosystem Services (TCES)Secondary Classification of Ecosystem Services (SCES)Cultivated LandForest LandGarden LandGrasslandWater BodiesUnutilized Land
Provisioning services (PS)Food production, FP3157.33 721.47 1939.40 666.71 1142.92 14.29
Material production, MP700.04 1657.24 1178.64 981.01 328.59 42.86
Water supply, WS−3728.79 857.19 −1435.80 542.89 14,929.45 28.57
Regulating services (RS)Gas regulation, GS2543.01 5450.32 3996.66 3447.82 1357.22 185.73
Climate regulation, CR1328.65 16,308.10 8818.38 9114.82 4043.09 142.87
Purify environment, PE385.74 4778.85 2582.29 3009.70 8157.62 585.75
Hydrologic adjustment, HD4271.68 10672.06 7471.87 6676.58 156,252.04 342.88
Supporting services (SS)Soil conservation, SC1485.80 6636.10 4060.95 4200.25 1328.65 214.30
Maintaining nutrient cycle, MNC442.88 507.17 475.03 323.83 100.01 14.29
Bio-diversity, BD485.74 6043.21 3264.48 3819.27 3657.36 200.01
Cultural services (CS)Aesthetic landscape, AL214.30 2650.16 1432.23 1685.81 2828.74 85.72
Note: Because construction land is one of most significant forms of ecosystem disturbance from anthropogenic activities and provides ecosystem services that are generally low and significantly different from those provided by other land types, the ecosystem services provided by construction land were assumed to be zero in this study to assess ecosystem services and are not presented in the text.
Table 6. Ecosystem services value by land-use types in Anxi County from 1999 to 2019 (unit: CNY 108).
YearCultivated LandForest LandGarden LandGrasslandWater BodiesUnutilized LandTotal
ESV199915.41 155.24 8.34 13.91 3.21 0.01 196.12
20099.36 127.40 7.54 9.85 2.14 0.01 156.30
20197.27 127.88 9.74 8.00 2.20 0.01 155.10
Change rate/%1999–2009−0.39 −0.18 −0.10 −0.29 −0.34 1.08 −0.20
2009–2019−0.22 0.00 0.29 −0.19 0.03 −0.32 −0.01
1999–2019−0.53 −0.18 0.17 −0.42 −0.31 0.42 −0.21
Table 7. Changes in ecosystem services value in Anxi County from 1999 to 2019.
Secondary Classification of Ecosystem ServicesEcosystem Services Value (CNY 108)Average
1999200920191999–2019
Food production, FP7.07 4.89 4.40 5.45
Material production, MP6.22 4.88 4.79 5.30
Water supply, WS−2.61 −1.15 −0.57 −1.45
Gas regulation, GS20.91 16.34 15.99 17.75
Climate regulation, CR52.72 42.64 42.61 45.99
Purifying environment, PE15.70 12.67 12.65 13.67
Hydrologic adjustment, HD42.39 33.00 32.48 35.96
Soil conservation, SC23.05 18.38 18.20 19.88
Maintaining nutrient cycle, MNC2.25 1.72 1.65 1.87
Bio-diversity, BD19.74 15.94 15.91 17.20
Aesthetic landscape, AL8.68 7.01 7.00 7.56
Total196.12 156.30 155.10 169.17
Table 8. The EEH value in Anxi County from 1999 to 2019.
1999–20092009–20191999–2019
EEHTypeEEHTypeEEHType
−0.210Relatively low conflict zone−0.003Transitional zone−0.072Transitional zone
Disclaimer/Publisher’s Note: The statements, opinions and data contained in all publications are solely those of the individual author(s) and contributor(s) and not of MDPI and/or the editor(s). MDPI and/or the editor(s) disclaim responsibility for any injury to people or property resulting from any ideas, methods, instructions or products referred to in the content.

