Article

Optimized Wind Environment in Campus Transitional Spaces: A Case Study of Kunming University of Science and Technology Office Building in Moderate Climate

Faculty of Architecture and City Planning, Kunming University of Science and Technology, Kunming 650500, China
*
Author to whom correspondence should be addressed.
Sustainability 2024, 16(4), 1461; https://doi.org/10.3390/su16041461
Submission received: 7 January 2024 / Revised: 6 February 2024 / Accepted: 6 February 2024 / Published: 8 February 2024
(This article belongs to the Section Green Building)

Abstract

:
In the post-epidemic era, there is a growing demand for health-oriented spaces. In moderate climate regions (where the outdoors is warmer in the summer and cooler in the winter, neither to an extreme), external spaces offer a greater potential to create healthy and comfortable environment compared to internal spaces, with extended utilization periods. Transition spaces, a distinctive type of external space, are prevalent in numerous campus architectural designs; however, their utilization remains relatively unexplored. The quality of the physical environment in transition spaces plays a pivotal role in influencing people’s decision to stay or leave. This study, utilizing the office building at Kunming University of Science and Technology (Chenggong Campus) as a case study, focuses on creating a conducive wind environment within the transition space. Employing Computational Fluid Dynamics (CFD) simulation, the study analyzes contributing factors and proposes optimization strategies. The findings aim to serve as a valuable reference for the design of the transition spaces on university campuses in moderate climate regions, aligning with the heightened emphasis on health-conscious spatial planning in the contemporary era.

1. Introduction

In the realm of scientific inquiry and social engagement, universities stand out as the foremost hubs of activity, exerting a profound influence on human endeavors. Prior scholarly investigations have predominantly fixated on outdoor settings within campus edifices or the interstitial spaces between them. However, transitional spaces, integral components bridging the indoor and outdoor domains, play a pivotal role not only in enhancing the spatial configuration of the campus and its structures but also in functioning as a climatic mediator, ensuring a seamless transition between indoor and outdoor realms [1]. A well-designed transitional space, characterized by comfort and aesthetic appeal, possesses the capacity to captivate individuals, encouraging prolonged stays and fostering a congenial, vibrant, and emotionally resonant interaction space for its occupants [2]. This quality is indispensable in the construction of a verdant campus.
The climatic conditions of Kunming, characterized by a moderate climate, highlight the significance of meticulous transitional space design. The imperative lies in crafting environments that not only cater to the climatic demands of the locale but also contribute meaningfully to the overall well-being and engagement of the university community. Consequently, the creation of comfortable and aesthetically pleasing transitional spaces emerges as an imperative facet in the holistic endeavor of constructing a green campus in Kunming.
Scholars such as Yuehong Fan and Yidu Lai have conducted comprehensive analyses of the distinctive spatial interfaces, scales and other characteristics inherent in transitional spaces. Their work delves into the interpretation of the spatial, functional, and aesthetic cultural attributes specific to the transitional spaces within Lingnan modern architecture. A notable outcome of their investigations is the elucidation of the core tenets underpinning the “humanistic” design principles governing transitional spaces in Lingnan architecture [3].
In a parallel vein, Xianfeng Huang employed the Relative Warmth Index (RWI) as a tool for evaluating the thermal comfort within the transition space of the Qilou. Additionally, Computational Fluid Dynamics (CFD) was leveraged to meticulously scrutinize the impact of various Qilou configurations on the wind environment [4].
Turning attention to the pivotal role of green facades in modulating the thermal environment of transitional spaces, Hankun Lin and Yiqiang Xiao conducted empirical measurements and analyses on exterior corridor buildings enveloped by green facades. Employing a dynamic measurement toolkit, they systematically conducted measurements in both sheltered and non-sheltered intervals, comparing the resulting changes in thermal environments. Their research contributes valuable strategies for the placement and arrangement of green facades to regulate the physical environment of transitional spaces [5,6,7].
In a simulation-based approach, Jiuhong Zhang and Ruiqi Wang utilized airpak software to model and simulate the temperature and wind speed dynamics within transition space. Their methodology involved the division of space into different temperatures zones, creating a temperature gradient across the layout of the building space. Subsequently, they proposed measures to enhance thermal comfort based on their simulation outcomes [8].
In summary, the prevailing body of research on transition spaces is predominantly concentrated within urban settings characterized by high building density [9,10,11]. Notably, a discernible gap exists in the scholarly exploration of transition space creation within the context of low-density campus buildings. Furthermore, the investigations conducted by these scholars are primarily oriented towards transition spaces situated in hot summer and warm winter climate areas, thereby displaying a pronounced emphasis on overall thermal comfort [12,13,14,15]. In contrast, mild climate regions with more temperate climates offer considerable potential for the utilization of transitional spaces, yet the extant literature reveals a scarcity of studies in comparison to their hot summer and warm winter counterparts. It is noteworthy that in areas with milder climates, the magnitude of wind speed assumes heightened significance in influencing human comfort.
While the current corpus of research predominantly employs physical measurement methods and Computational Fluid Dynamics (CFD) simulations to scrutinize prevailing wind speed conditions within transitional spaces, the emphasis has been placed on elucidating key factors impacting the thermal comfort. Tse and Jones investigated the transition spaces of three study case buildings in Cardiff by using questionnaire surveys and physical measurements, and the important influence of indoor operative temperature and clothing values on thermal comfort in transitional spaces was finally determined [16]. Kwon and Lee investigated the effects of transmissivity of the canopy material and orientation of school buildings on thermal comfort in transitional spaces in three different cities through CFD simulations. It was concluded that different transmittance rates should be adopted for building canopy materials under different climatic conditions, and recommended values were given [17]. Other such articles have examined the relationship between microclimate and transition spaces [18,19,20], the effects of changes in wind speed due to fans [21], the rate of change of skin temperature on thermal comfort in transitional spaces [22], and so on [23,24]. However, a notable lacuna persists in terms of comprehensive multi-program comparisons and the judicious selection of appropriate scales to enhance the overall quality of the physical environment. Addressing this shortfall would contribute substantially to refining our understanding of transitional space dynamics and optimizing the design considerations for improved environmental quality.
This study focuses on the office building situated at Kunming University of Science and Technology’s Chenggong Campus, employing the Computational Fluid Dynamics (CFD) simulation software Butterfly. Through rigorous simulations, the transition space at the entrance of this building is systematically evaluated. The analysis undertaken identifies and elucidates the underlying issues within the prevailing wind environment of the existing transitional space. Subsequently, an optimization strategy is proposed as a remedial measure. The findings and optimization strategies presented in this research offer valuable insights and serve as a reference for the design of transition spaces within a university campus situated in mild climatic regions.

2. Research Methodology

2.1. Selection of Simulation Software

Butterfly, a wind simulation plug-in integrated with Grasshopper, is employed in this study. This tool facilitates the rapid exportation of geometry to OpenFOAM, and boasts notable advantages including heightened flexibility, computational accuracy, and robust visualization capabilities [25]. The butterfly is now widely used in architectural design and research. Scholars such as Kabosova and Chronis blended the newly developed AI-driven simulation prediction models of InFraReD, ladybug and butterfly with the Galapagos optimization within Grasshopper to investigate the relationship between architectural intention and weather influences to get the optimal design solution for the urban configuration and architectural shape [26,27]. Kamel studied the relationship between urban microclimate, building energy usage, and thermal comfort outdoors of two regions of Egypt by using Ladybug, Honeybee and Butterfly plugins across Grasshopper [28]. The selection of Butterfly for CFD wind simulation in this investigation allows for a quantitative analysis and evaluation of the wind environment within the transition space of the office building at Kunming University of Science and Technology. The utilization of Butterfly ensures a comprehensive and precise examination of the wind dynamics in the designated area.

2.2. Establishment of Simulation Parameters

2.2.1. Meteorological Overview of Kunming: A Moderate Climate Perspective

The research site is situated in the southeastern sector of the University Park of Chenggong New Town, Kunming. This region is characterized as a moderate climatic zone in accordance with the Building Climate Zoning Standard (GB 50178-93) [29]. Kunming, located within the low-latitude plateau area, is influenced by warm and humid airflow originating from the southwest of the Indian Ocean. The region experiences prolonged sunshine, boasting an average annual temperature of 16.5 °C, approximately 2200 h of annual sunshine, and a total horizontal radiant illuminance at 409 W/m2. The climate in Kunming is moderate, devoid of scorching summer heat and severe cold winter; all four seasons exhibit spring-like conditions, contributing to a pleasant overall climate. The annual precipitation stands at 1035 mm, emblematic of a temperate climate.
In the summer season, the prevailing wind direction in Kunming is WSW, with an average wind speed of 2.14 m/s in this direction. Conversely, during the winter season, the primary wind direction remains WSW, accompanied by an average wind speed of 2.21 m/s in this specific direction. These climatic parameters are visually depicted in Figure 1.

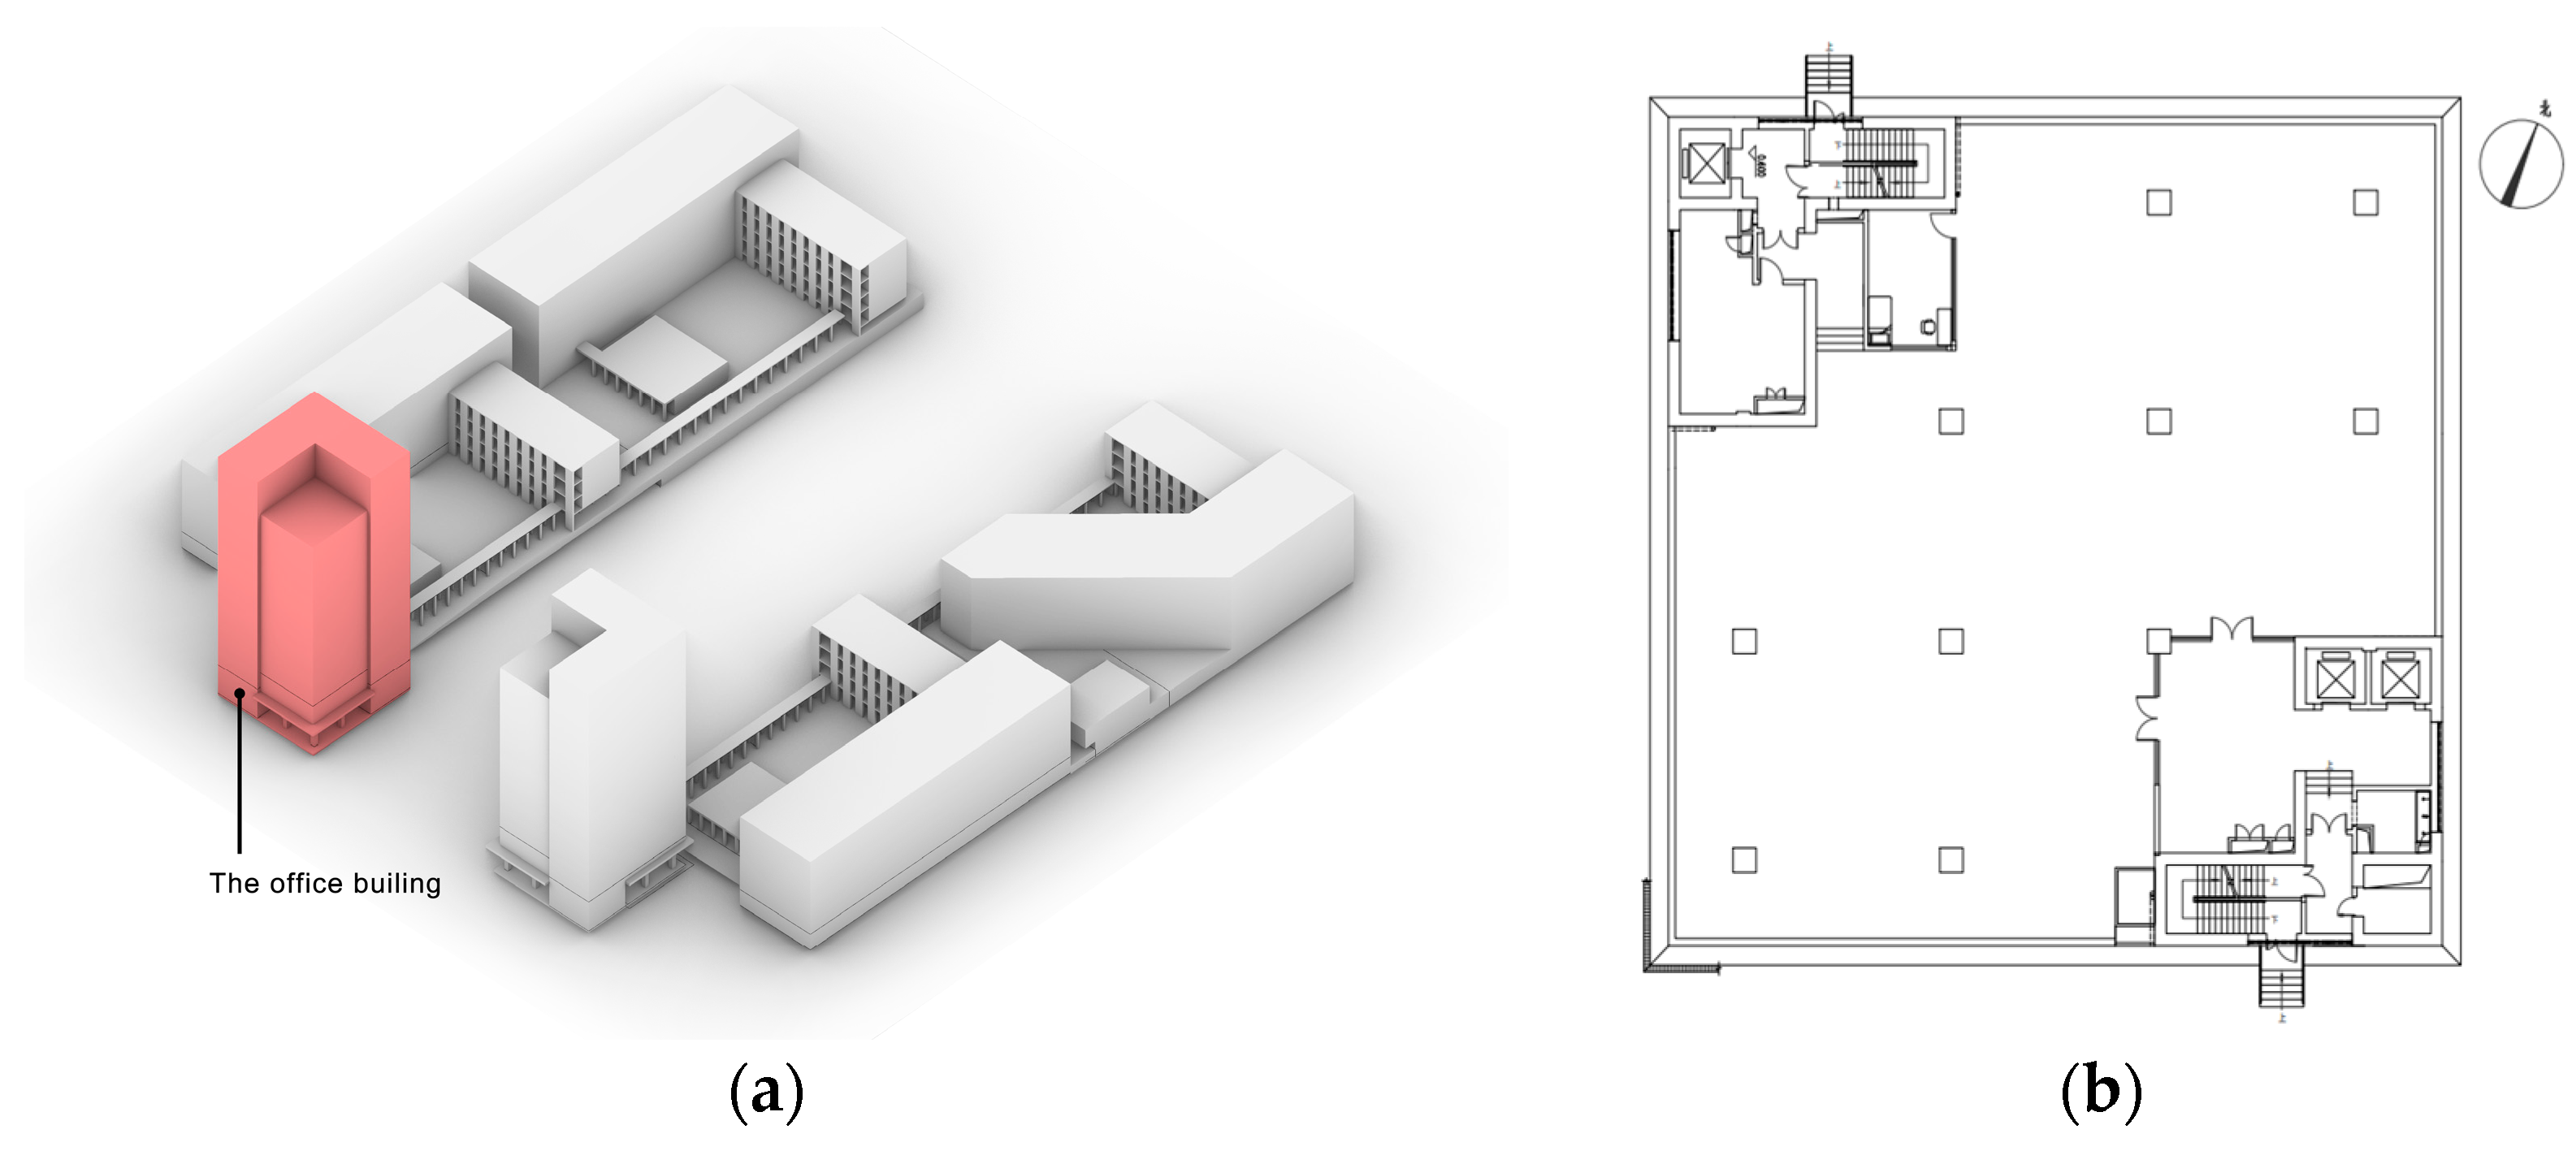
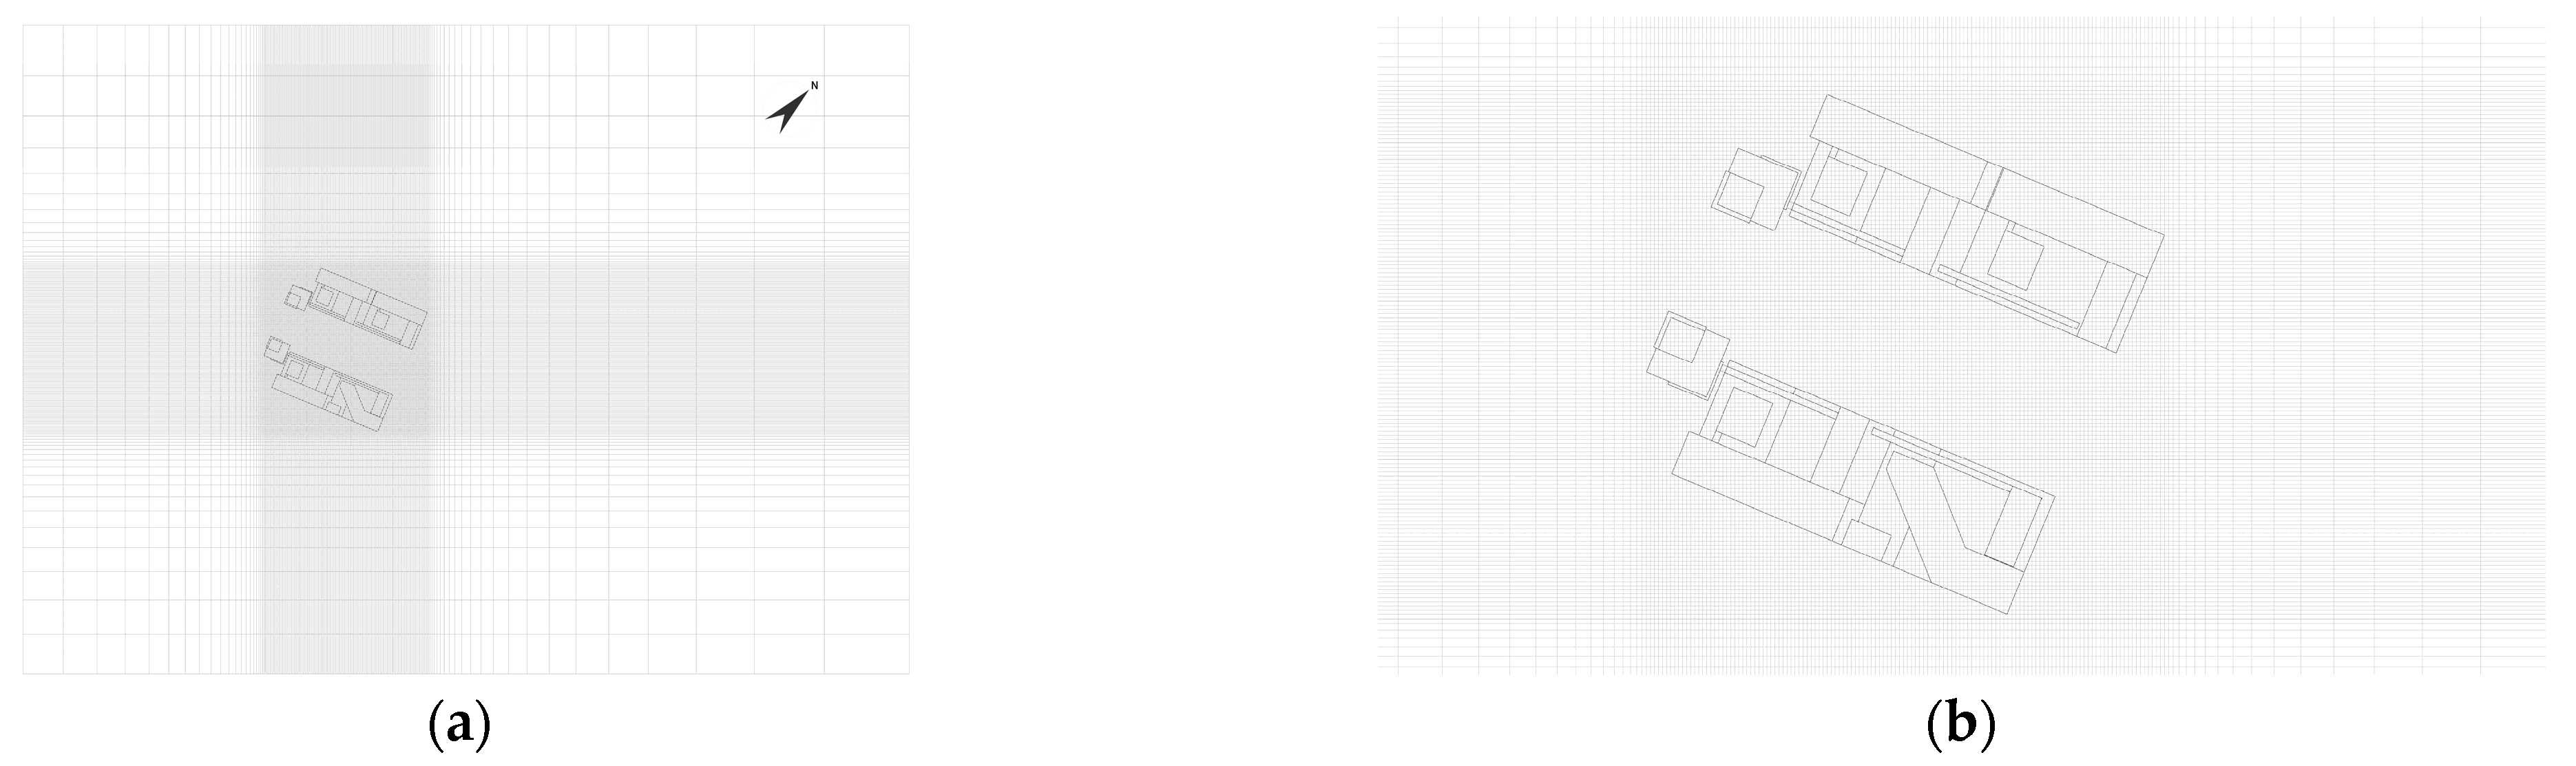
2.2.2. Model Construction and Configuration of Simulation Parameters

For the purpose of this investigation, a laser range finder was employed to meticulously map the study subject. Additionally, open-source spatial geographic data from Google Maps was utilized to construct the foundational block model and floor plan of the building under scrutiny. These representations are visually delineated in Figure 2.
Following the “Green Performance Calculation Standard for Civil Buildings”, this study undertakes the physical modelling and grid construction necessary for simulating the outdoor wind environment. The predominant wind direction during summer, identified as WSW, with an average wind speed of 2.6 m/s, and the corresponding winter conditions with a dominant wind direction also at WSW, featuring an average wind speed of 3.7 m/s, have been chosen as the key outdoor meteorological calculation parameters specific to Kunming region.
Centering the investigation around the office building, the simulation domain is delineated in Figure 3 with dimensions X (1400 m) × Y (1000 m) × Z (380 m). Within the central area, the grid dimensions are defined as (x1) 2 m × (y1) 2 m × (z1) 0.5m, cell to cell expansion ratio is 1.2, resulting in a total grid count of 1,684,568. Notably, the grid density increases proportionally closer to the building, leading to a denser grid division in proximity to the structure and a reduction in grid density with increasing distance from the building.
In the context of vertical wind speed distribution analysis, the wind speed at a height of 10m above ground level is designated as the standard height wind speed. To streamline calculations, the near-ground wind speed remains constant, and a uniform roughness index α of 0.16 is adopted throughout the calculation. Employing the standard k-ε turbulence model and the wall function method for velocity boundary conditions, iterative calculations and solutions are executed. Diverse wind conditions corresponding to distinct time periods in Kunming are incorporated and numerical simulations are conducted at the pedestrian height within the transition space of the office building (1.5 m), separately for both summer and winter seasons.

3. Simulation

3.1. Summer Environmental Conditions

Examining the horizontal cross-sectional wind speed distribution illustrated in Figure 4, it is observed that the wind speed within the designated generally ranges within 5 m/s. In accordance with the “Green Building Evaluation Standard”, the wind speed in outdoor resting areas is recommended to be below 2 m/s. Notably, an abrupt intensification of wind speed is discerned at the west entrance of the plaza enclosed by the building, a phenomenon that may potentially induce discomfort to individuals. It is noteworthy that the subject of this research, the transition space of the office building, is precisely situated in the westward direction of the wind entrance.
Examining the vertical cross-sectional wind speed distribution presented in Figure 5, it is evident that the wind speed of the prevailing southwest wind diminishes upon reaching the west side of the office building. However, upon entering the transition space, there is a substantial increase in wind speed, resulting in an uneven distribution. This pattern aligns coherently with the empirical experience of actual physical sensations in the studied environment.

3.2. Winter Environmental Conditions

Given the consistent dominance of wind direction in both summer and winter seasons in Kunming, an examination of the winter conditions depicted in Figure 6 and Figure 7 reveals a wind speed exceeding 2 m/s. Remarkably, the wind direction and speed distribution remain largely unchanged compared to the summer conditions. Although there is a noticeable escalation in wind speed within the transition space, causing non-uniform distribution, this increase is localized in comparison to summer wind speeds. Nevertheless, it is crucial to note that the reduction in air temperature during winter exacerbates the discomfort associated with the elevated wind speed.

3.3. Discussion

Upon scrutinizing the wind speed distribution and wind direction within the transition space of the office building, we can find wind speeds above the optimal comfort zone in both the summer and winter transition spaces, and in winter the discomfort caused is even stronger due to lower temperatures and higher. The following factors are posited as explanatory contributors to the observed phenomena.
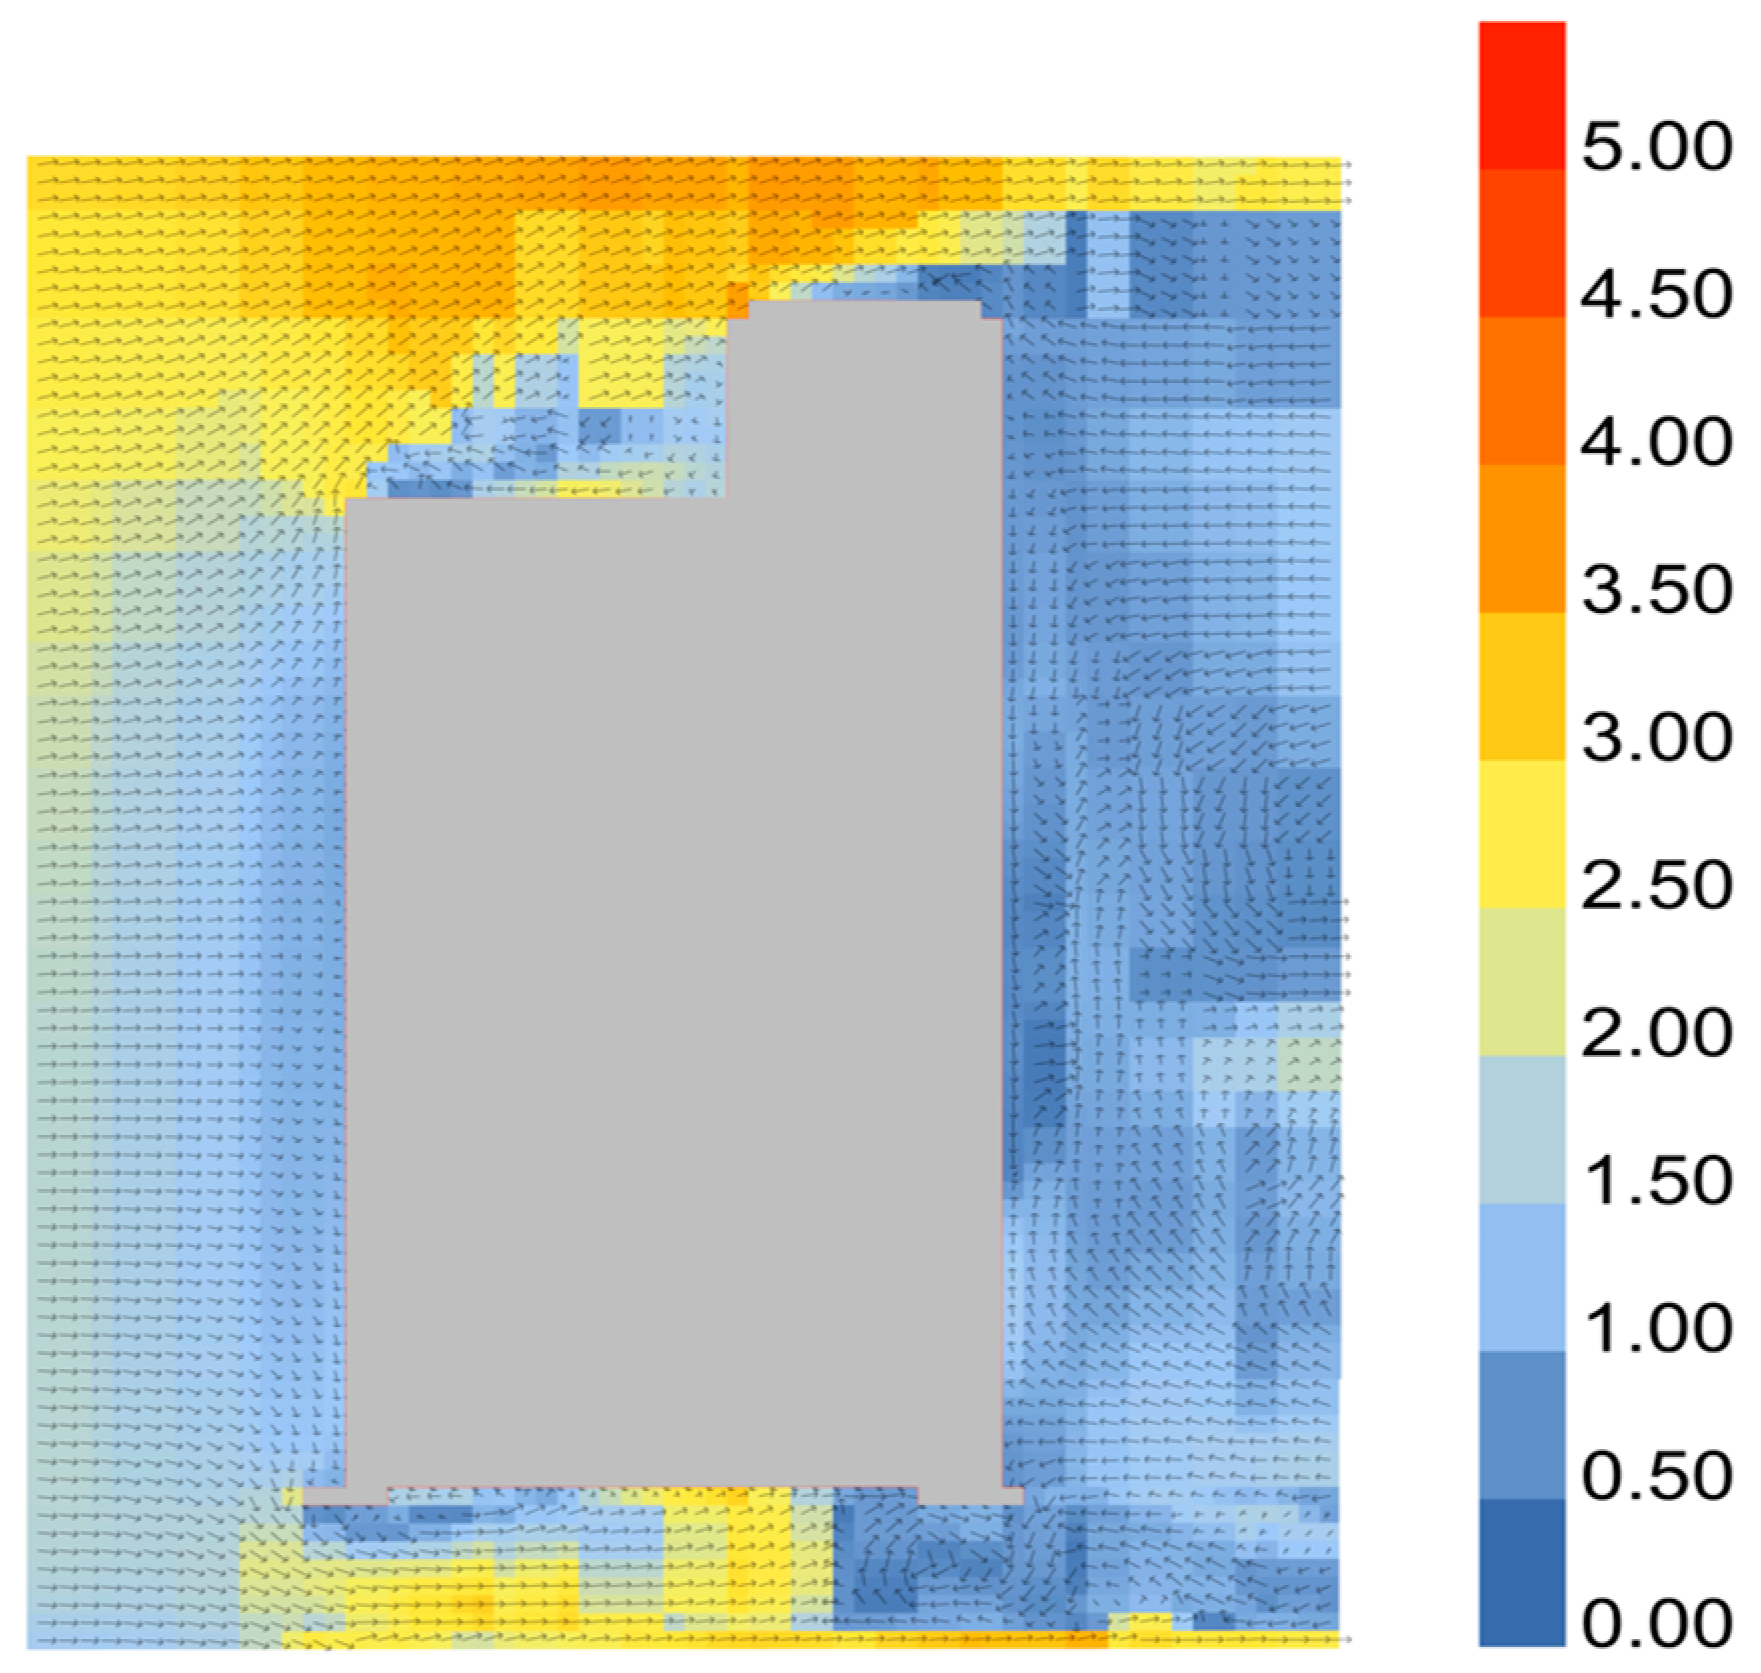
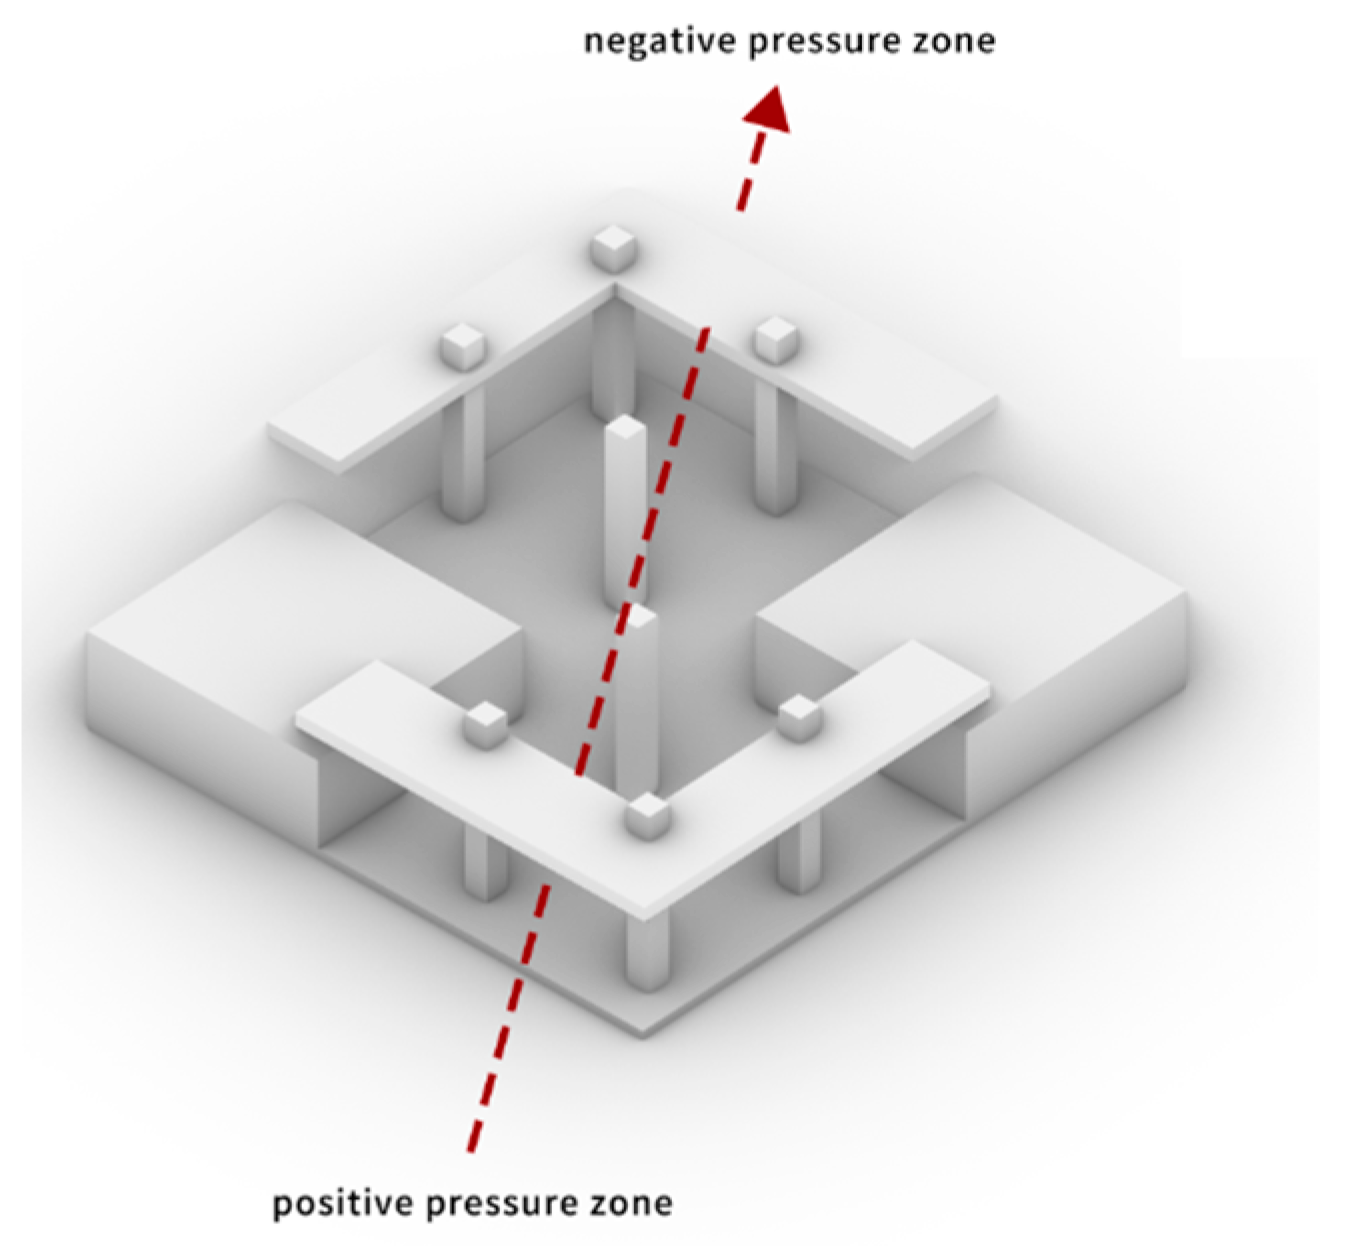
  • As depicted in Figure 8, the obstruction created by the office building disrupts the near-ground wind flow, resulting in disparate wind pressure across different sections. On the windward surface, airflow obstruction induces a reduction in speed, leading to an increased pressure exceeding atmospheric levels, thereby generating positive pressure. Conversely, on the leeward and crosswind side (roof and sides), the air experiences thinning due to the winding process of the airflow, resulting in pressure lower than atmospheric conditions and the formation of negative pressure. The interplay of these two pressure differences engenders accelerated airflow and the manifestation of high-rise winds.
2.
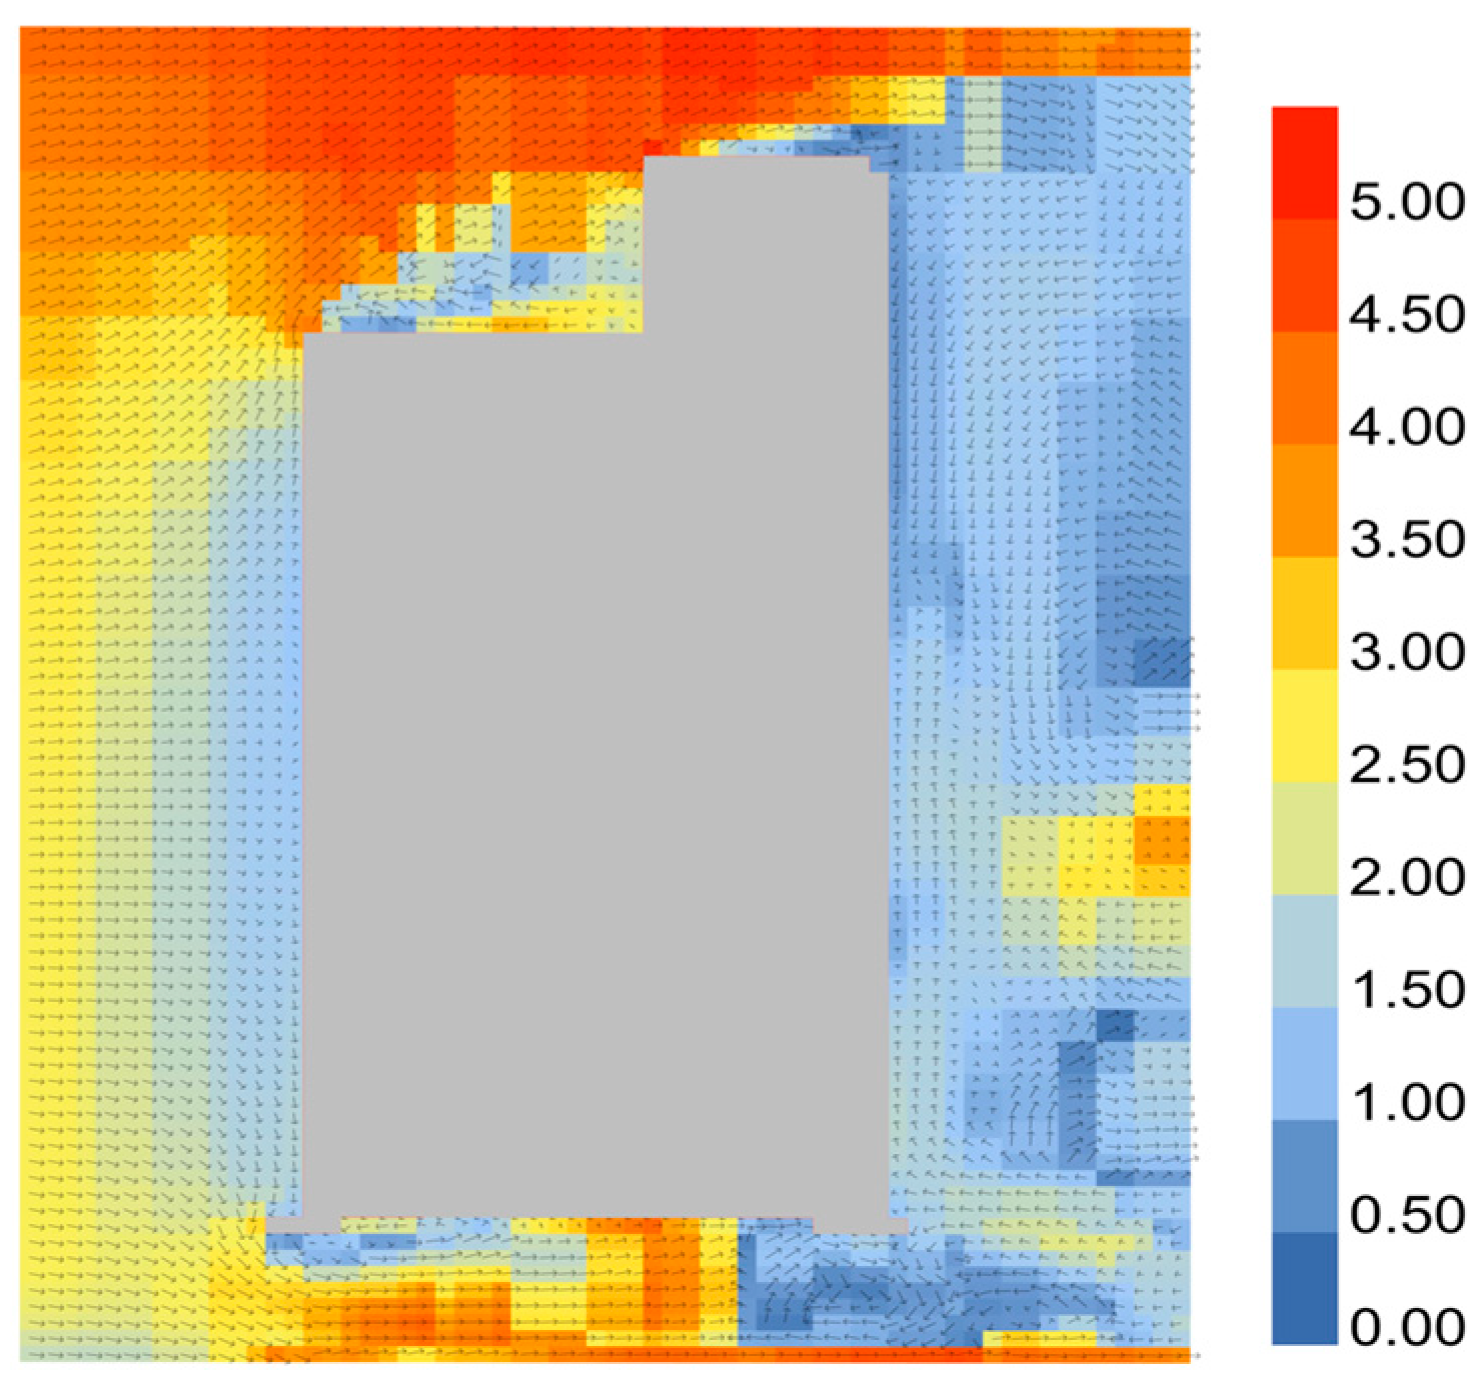
Illustrated in Figure 9, a wind corridor is established by connecting the first floor of the building through the central portion of the plan. The pressure differential between the east and west, induced by the wind from the tall structures of the office building, facilitates the rapid passage of incoming wind through this corridor. Consequently, this process accelerates the wind speed within the transition space.
3.
As evident from the vertical section wind speed profiles in Figure 5 and Figure 7, encounter with the obstacle (office building) induces a redirection and convergence of the wind direction downwards. This alteration amplifies the wind pressure entering the transition space, consequently leading to an acceleration of wind speed.
4.
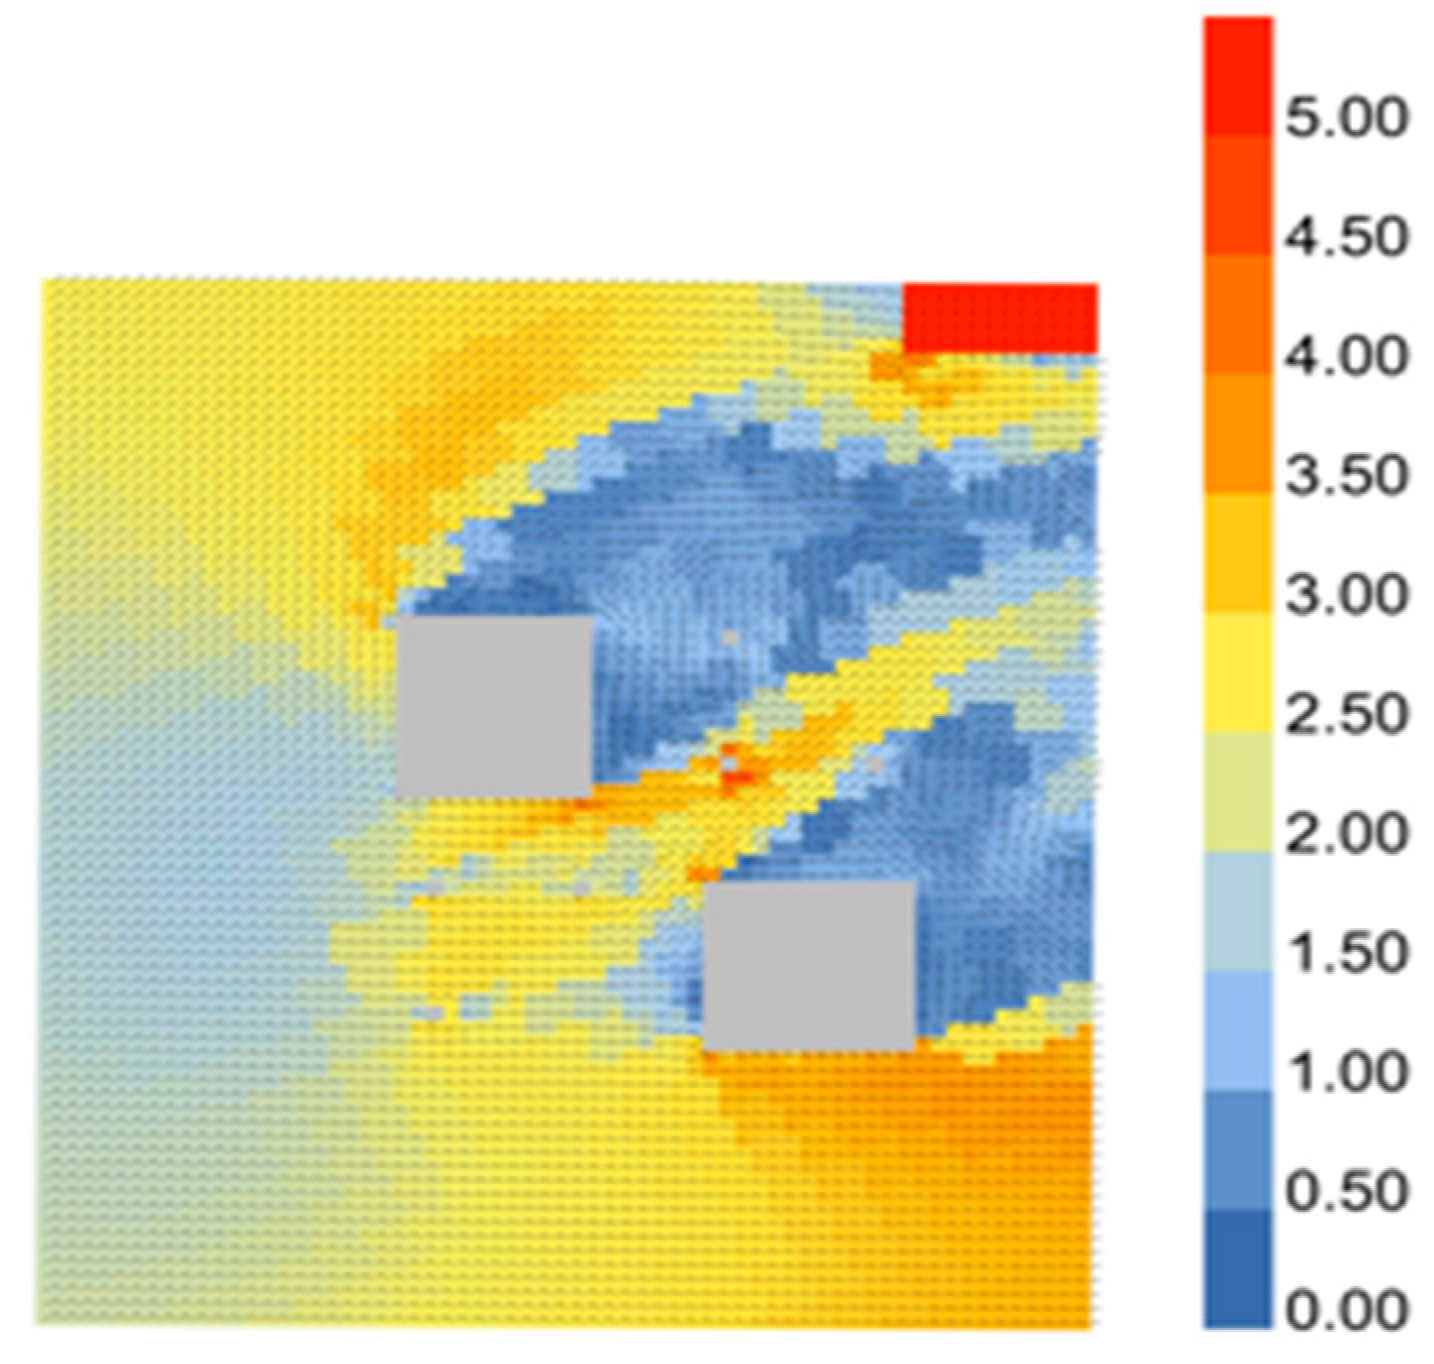
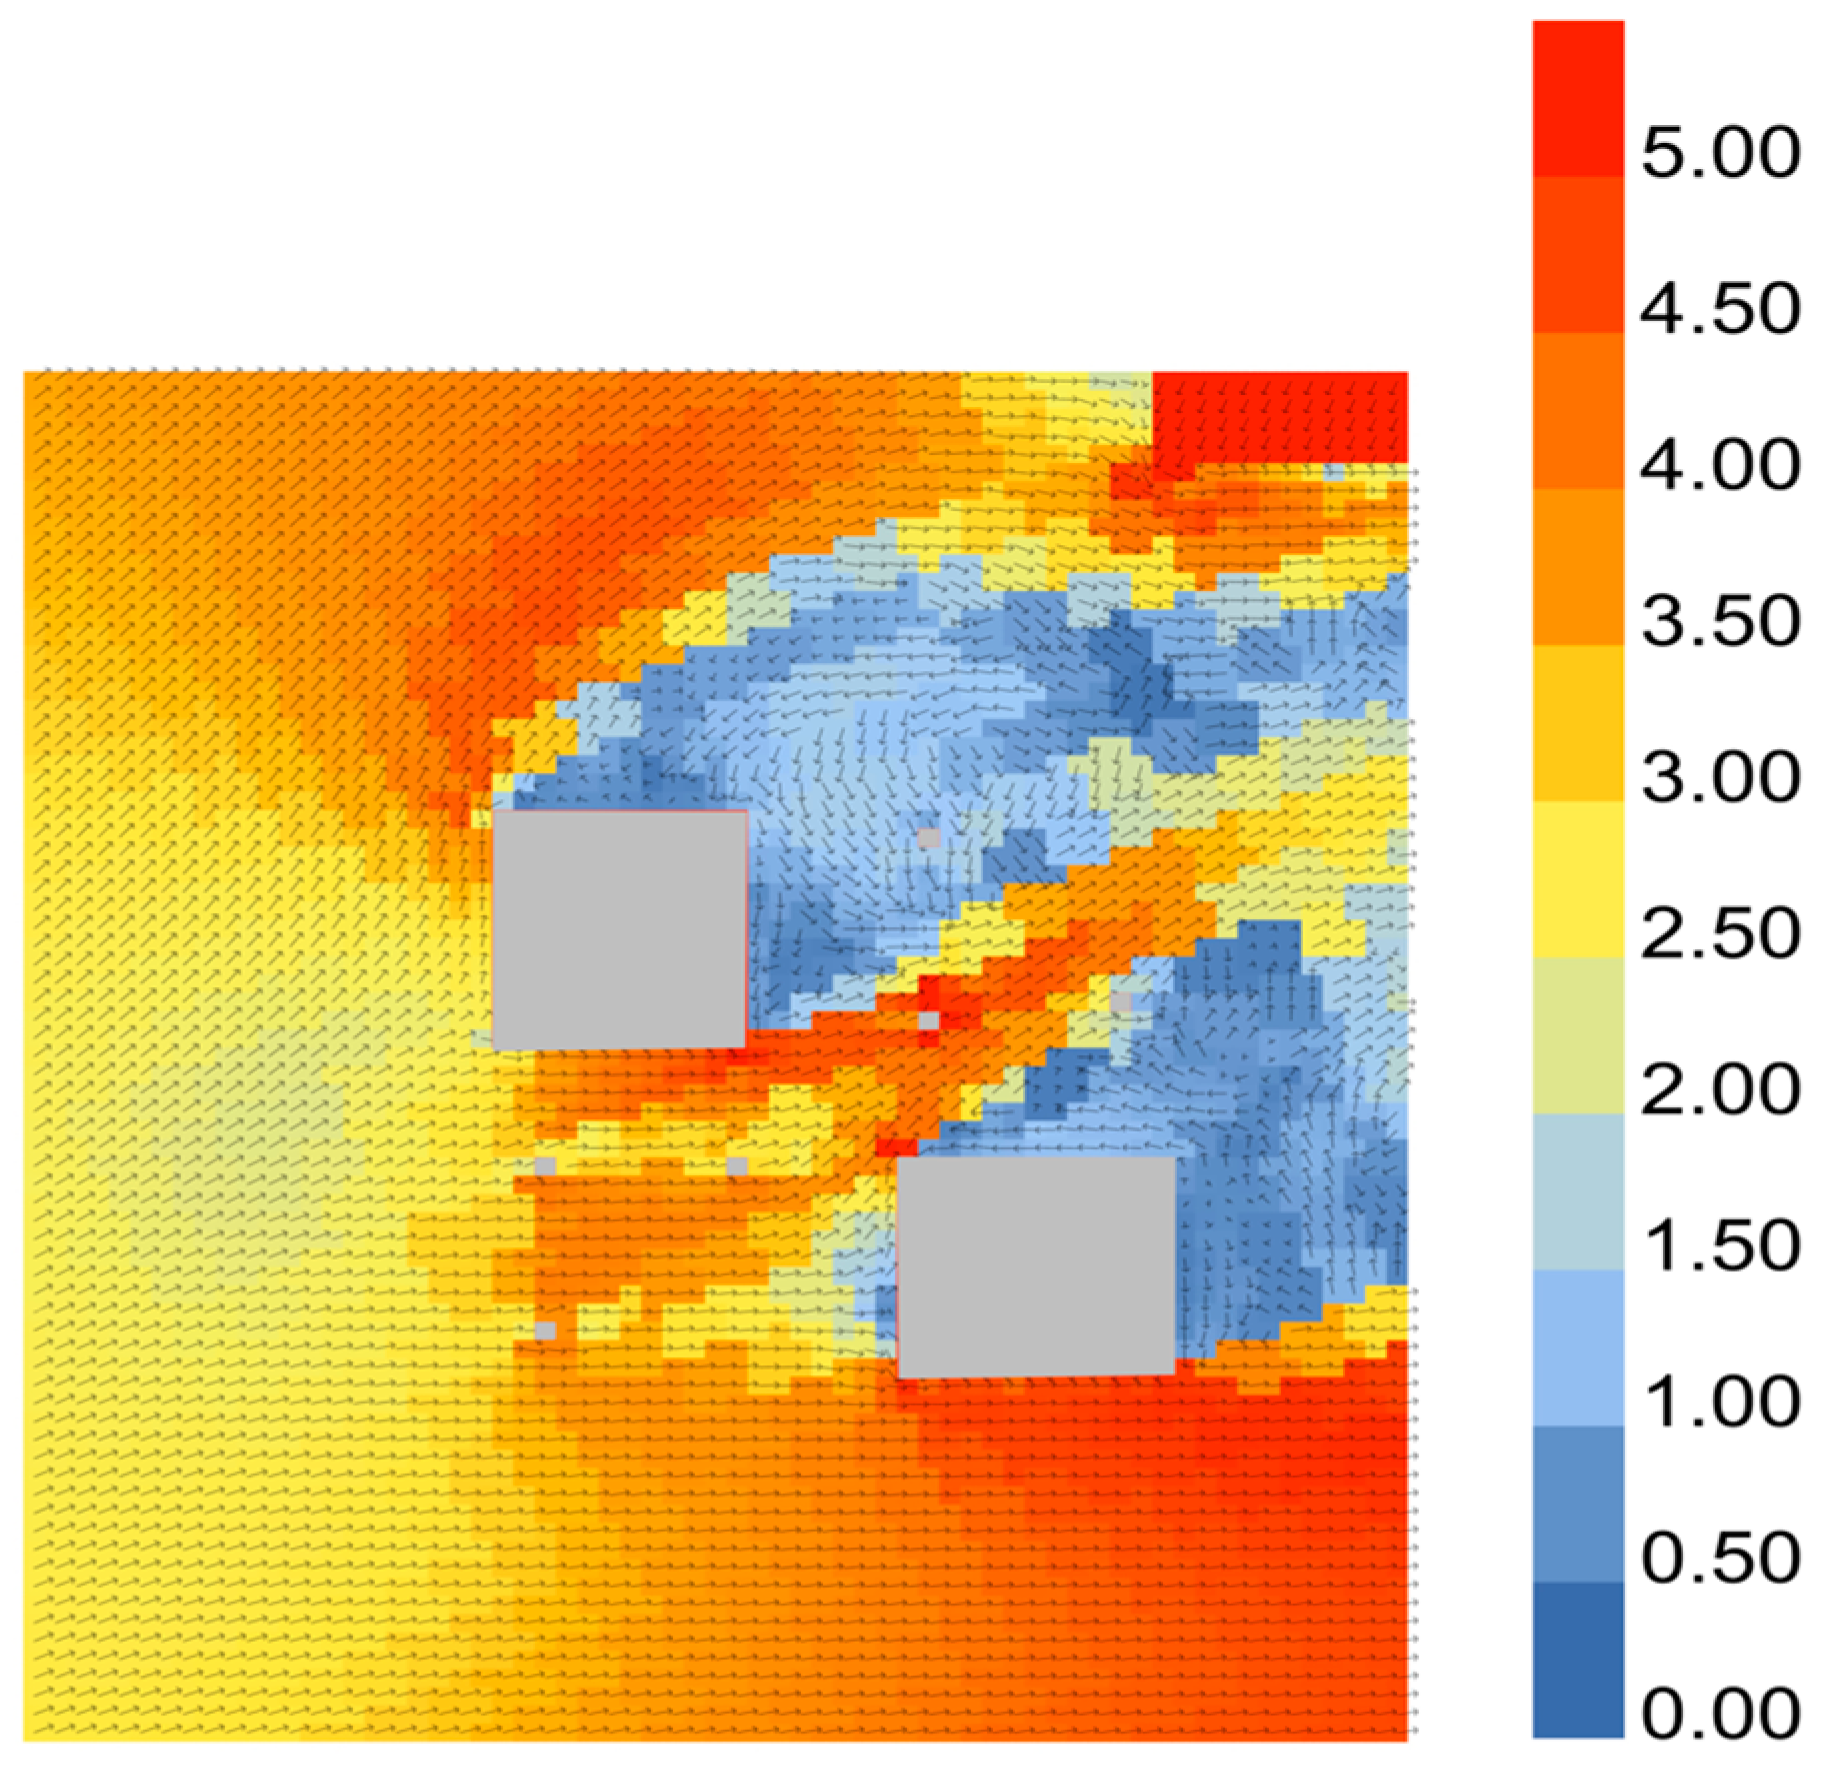
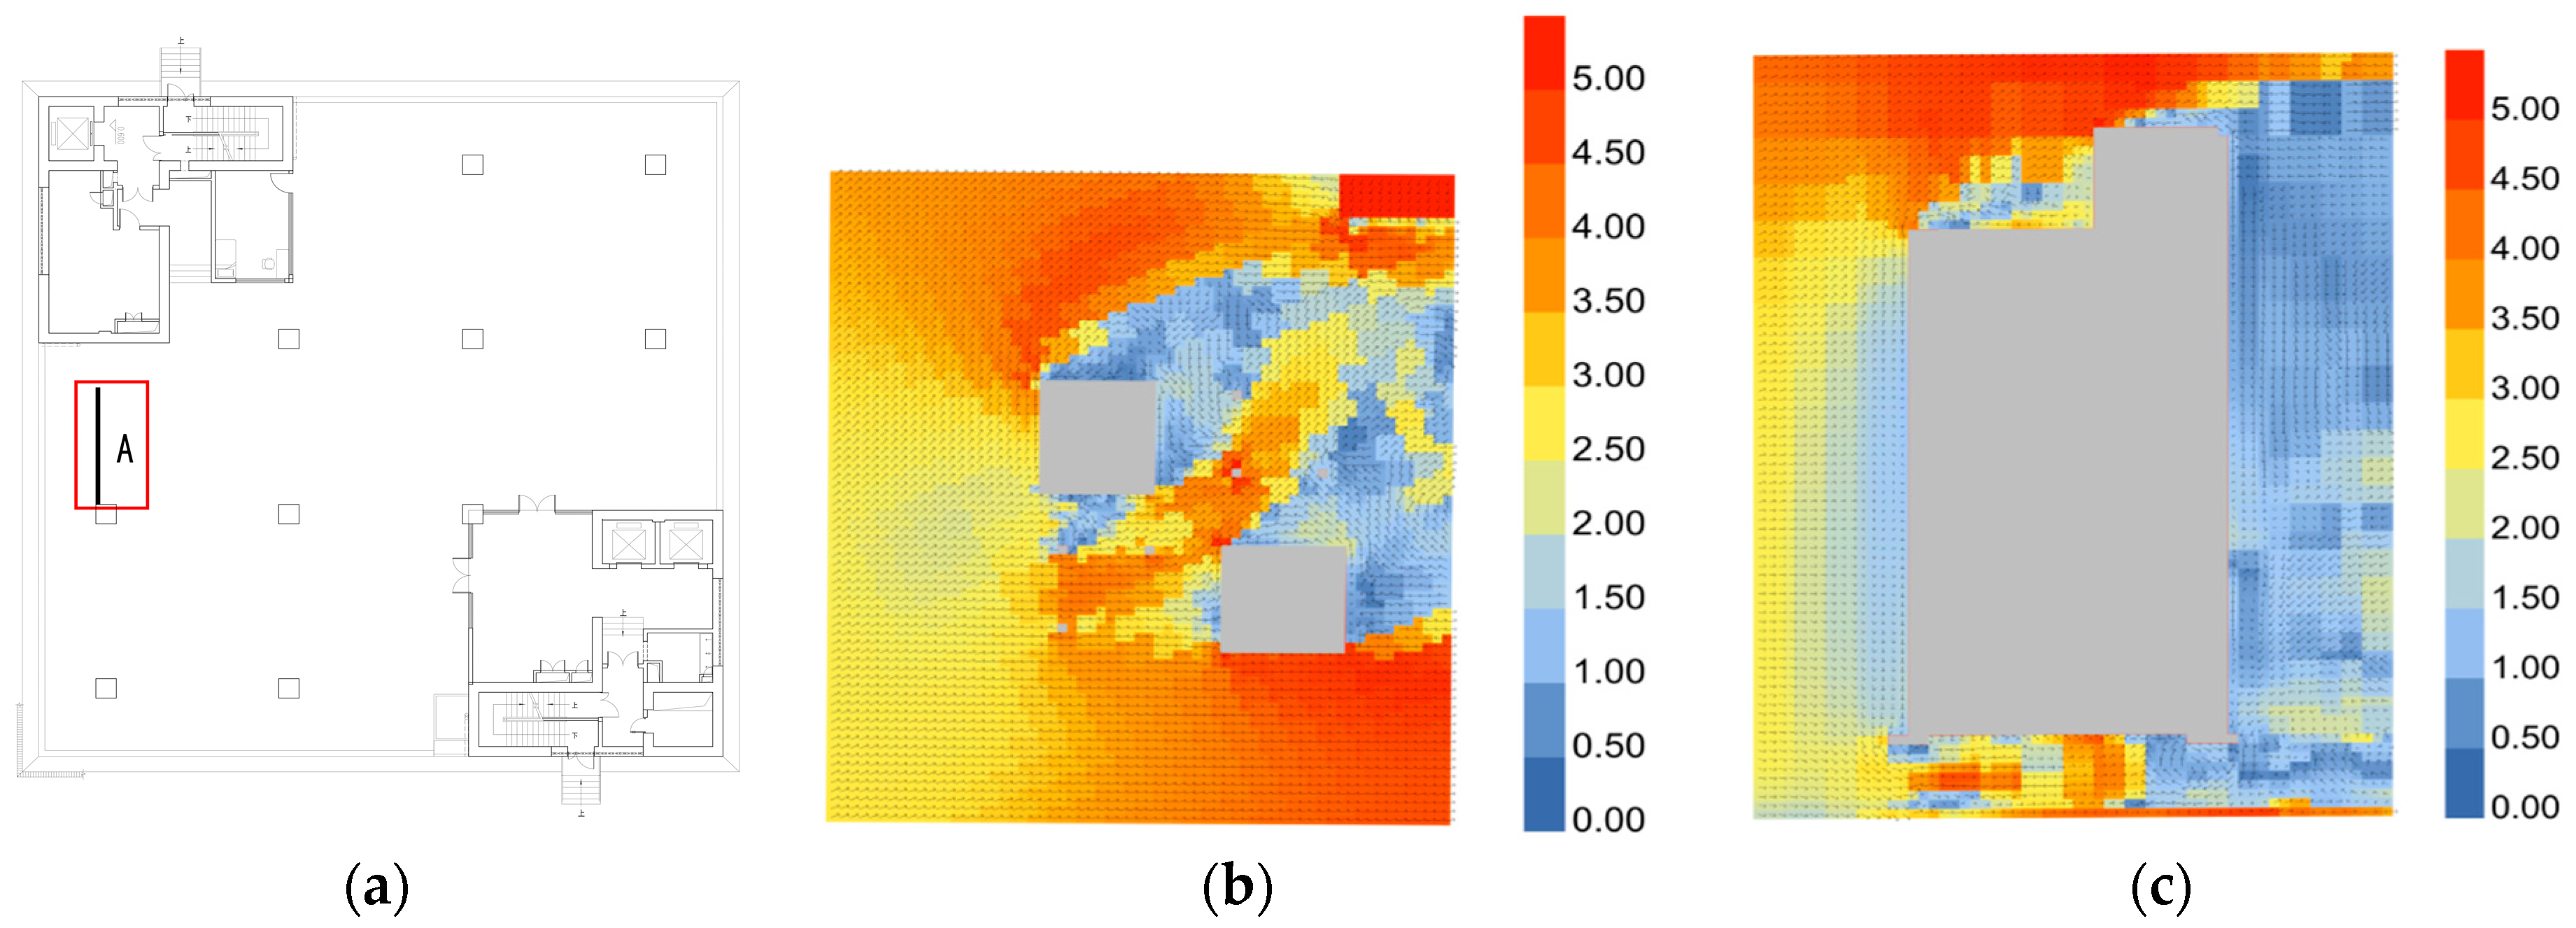
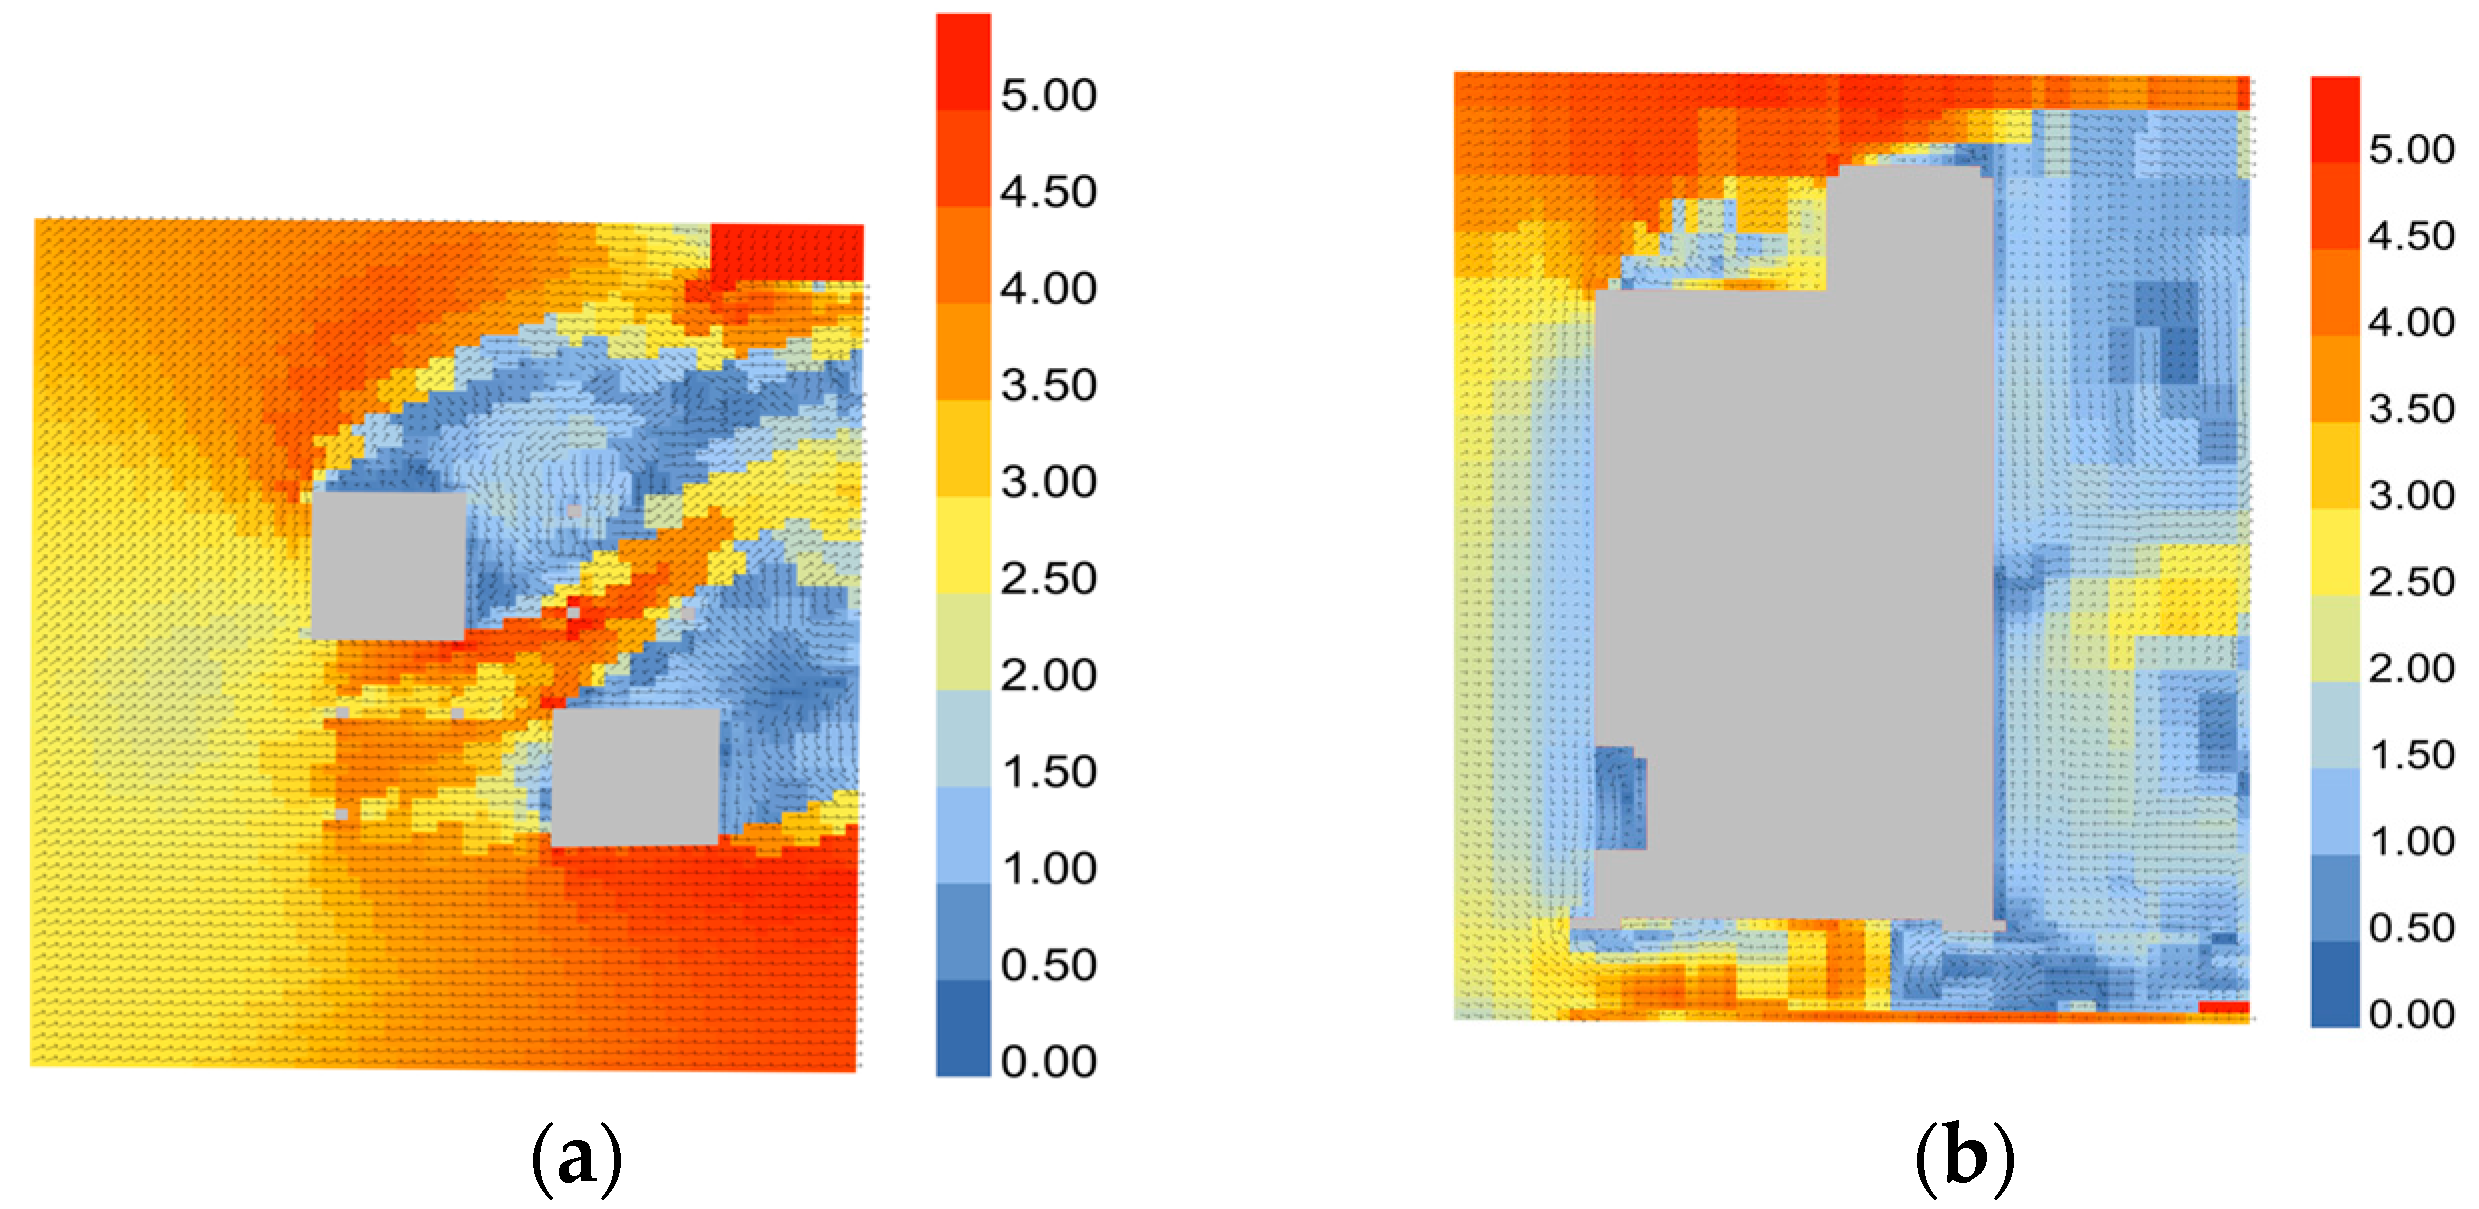
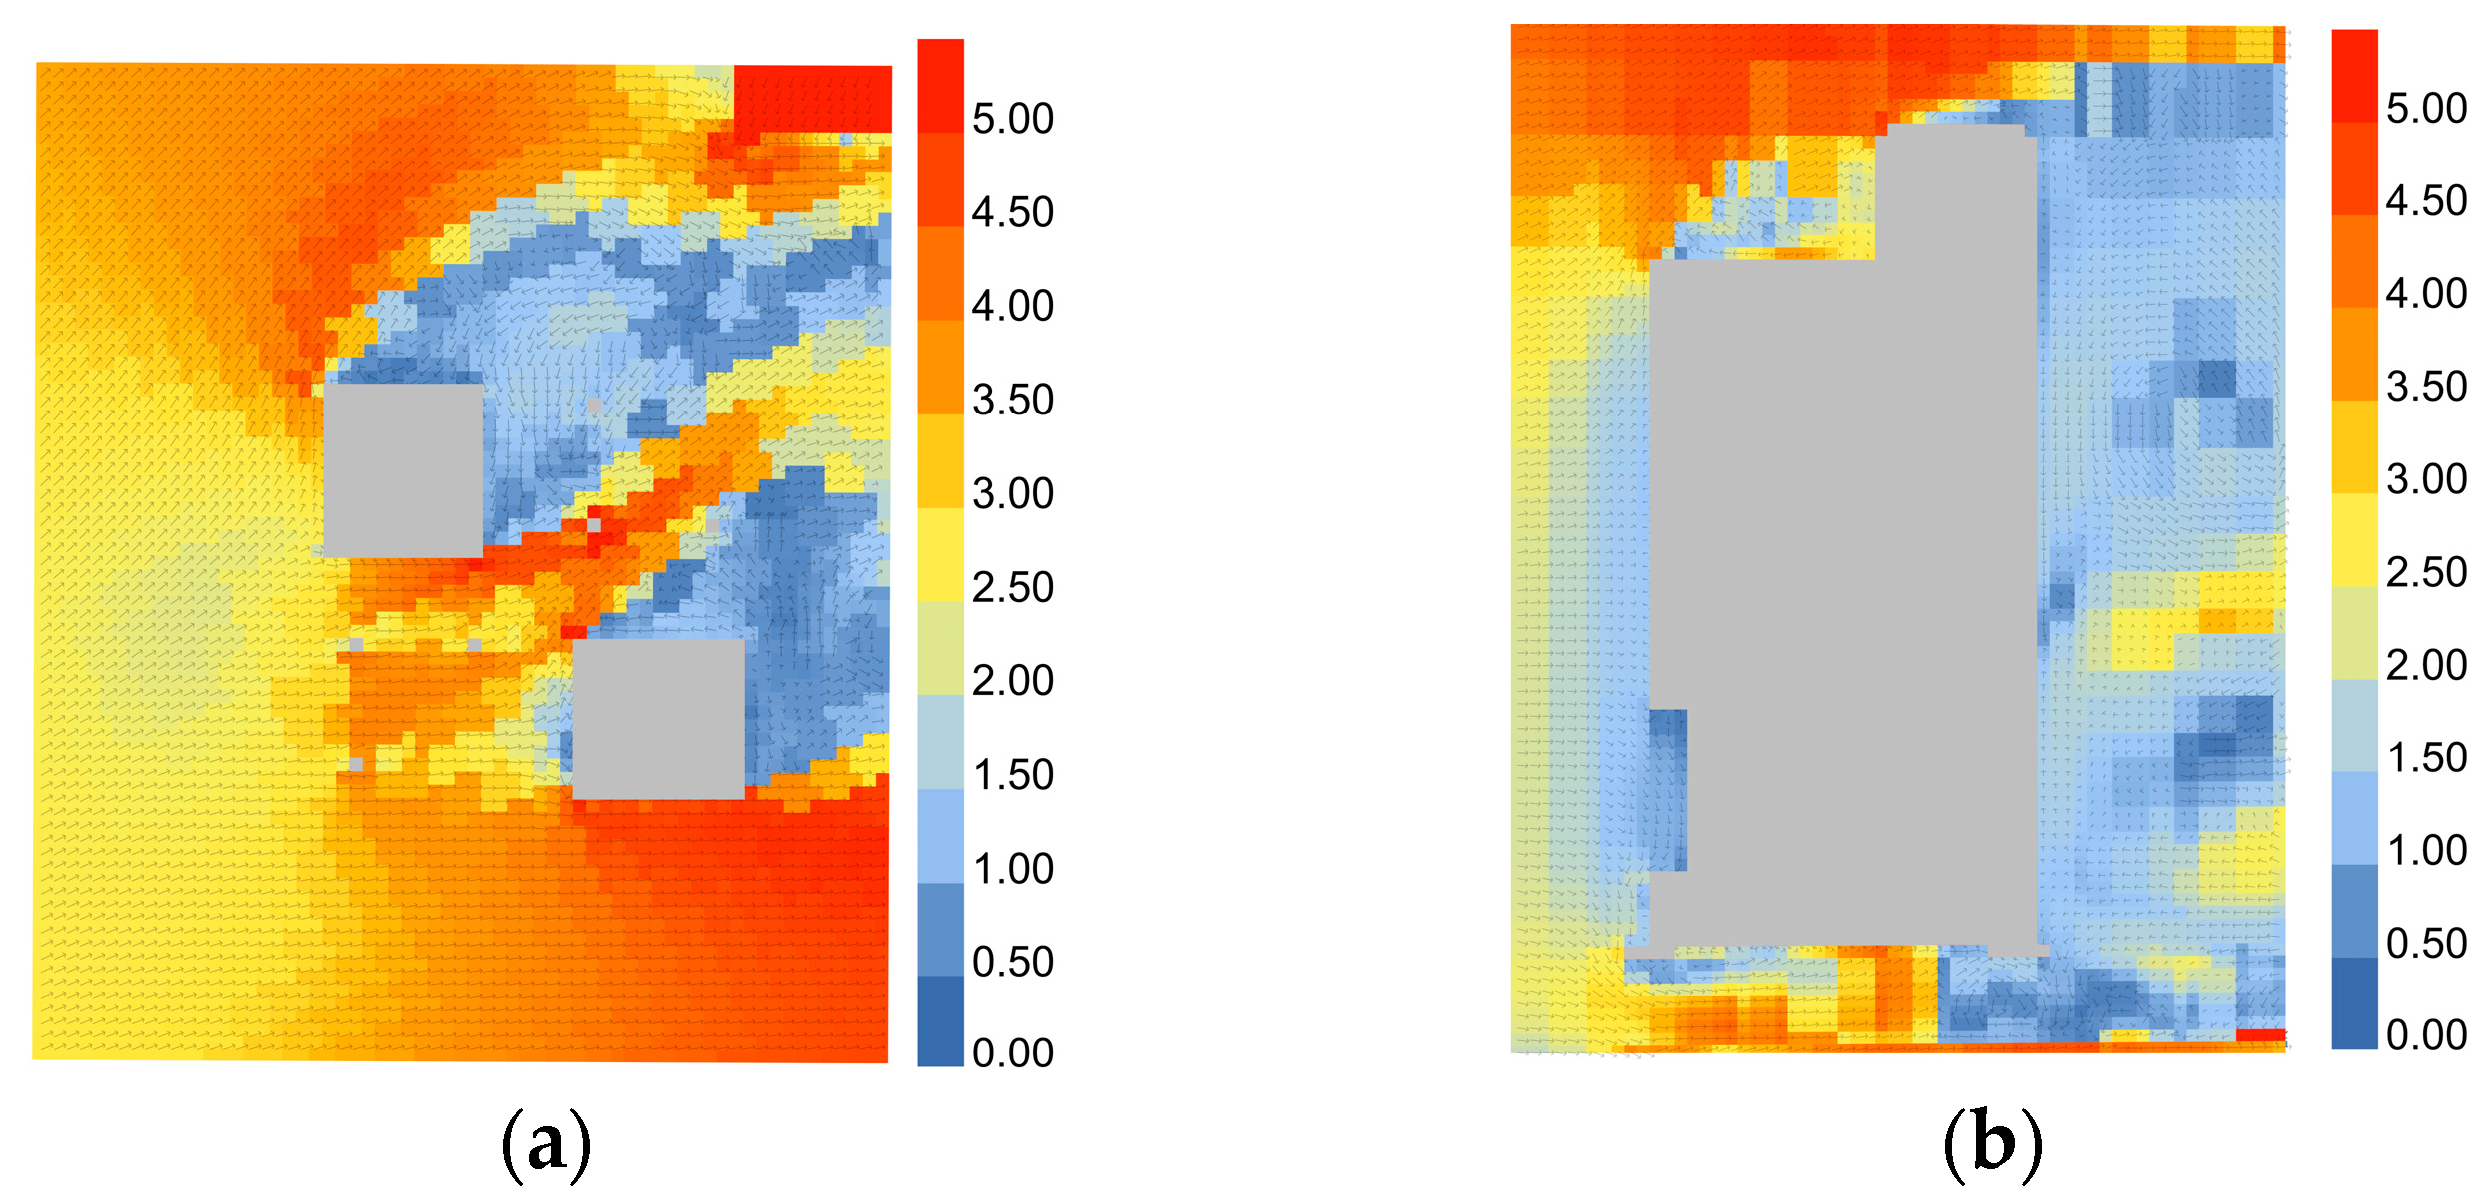
As depicted in Figure 10, given the prevailing southwest wind direction in Kunming, the entry of wind into the transition space prompts a reduction in the width of the interface on both sides. As the confined airflow traverses the diminished cross-sectional area, fluid velocity intensifies, giving rise to the Venturi effect. Consequently, the wind speed is notably heightened, as evident in Figure 4 and Figure 6, particularly as the wind courses between the two volumes on the first floor of the office building.

4. Optimizing the Wind Environment in Transitional Spaces: Implementation Measures

Based on the causal analysis, optimization of the wind environment entails strategies to attenuate incoming winds and obstruct the formation of the “wind corridor”. Given the consistent dominance of winds in Kunming during both winter and summer, subsequent simulations and analyses are conducted based on the wind speed distribution observed in winter.

4.1. Mitigation of Incoming Winds

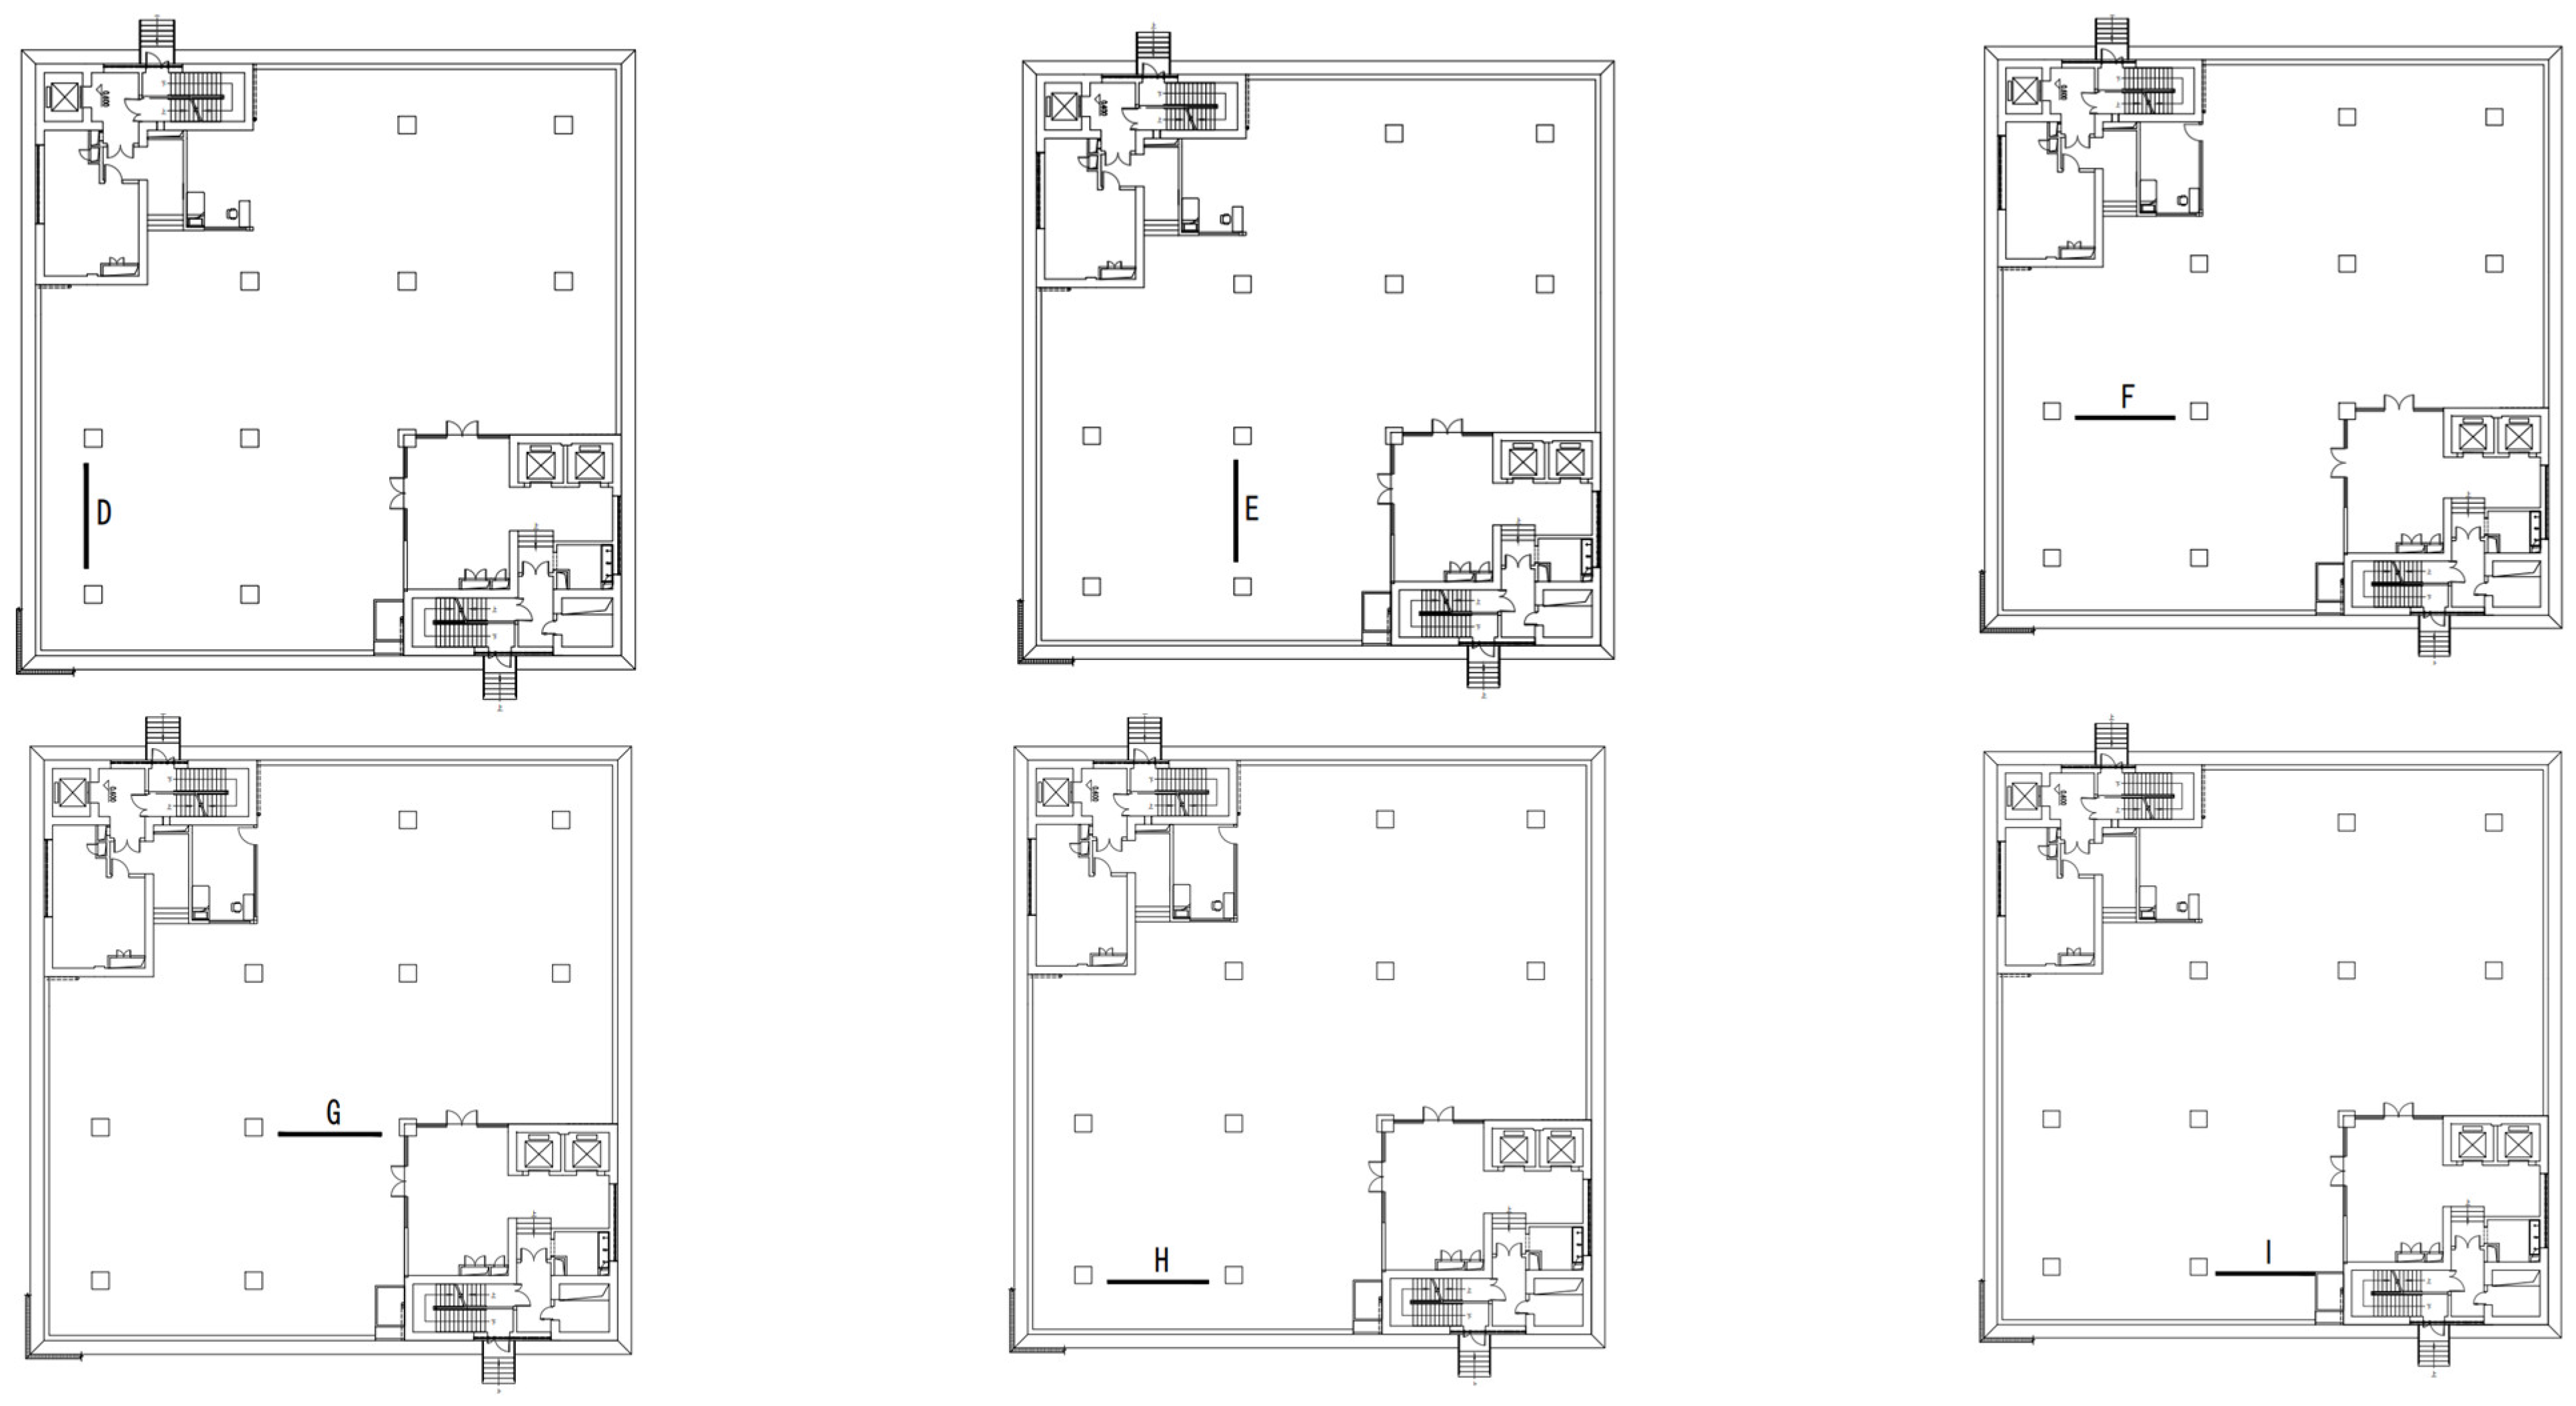
4.1.1. Strategy 1: Installation of Landscape Wall for Wind Mitigation

The building in consideration serves as an office building, and in the establishment of the landscape wall, due consideration is given to the functional use of the space and the overall spatial experience. Consequently, it is recommended to implement a simulated view wall with a height of 1.8 m and a length of 6 m, as illustrated in the red rectangle in Figure 11.
As depicted in Figure 11, the horizontal wind speed distribution at the location of the view wall registers between 0.5 m/s and 1.5 m/s, indicating a noticeable attenuation of wind speed. However, despite this mitigation, the persistence of the “wind corridor” and the Venturi effect suggests that challenges persist in the wind environment within the transition space. An analysis of wind speed distribution in the vertical section reveals no conspicuous alterations in wind speed and direction.

4.1.2. Strategy 2: Reduced Convergence of Upper-Level Winds

A more convenient approach involves modifying the non-load-bearing walls of the frame structure. This modification allows for the creation of recessed platforms on the windward side of specific floors above the transition space of the office building. These recessed platforms serve to buffer the incoming wind gathered from the upper regions, effectively mitigating wind pressure enhancements within the transition space.
The interface between the third floor of the office building has been adjusted inward by 3m and subjected to simulation. Examination of Figure 12 reveals minimal alterations in both horizontal vertical wind speeds within the control group. As we gradually increase the number of layers of the interface change upwards, the wind speed in the transition space still does not change significantly compared to when it is not optimized, which is shown in Figure 13 and Figure 14. However, contrary to the initial assumption, a substantial deviation is observed, indicating that wind buffering is not effectively achieved at the retreat stage.
Considering that this approach would reduce a lot of interior use space, when changing the number of floors, the use of the building can be greatly affected, so this strategy will not be analyzed further.

4.2. Strategy 3: Obstruction of the “Wind Corridor”

Illustrated in Figure 15, the implementation of walls serves to entirely obstruct the “wind corridor” within the ground floor transition space of the office building. This alteration integrates the walls as integral components of the indoor space, effectively eliminating the direct impact of incoming wind from the positive pressure area to the negative pressure area and precluding the occurrence of the Venturi effect.
As evidenced by the wind speed distribution on the horizontal and vertical planes in Figure 15, a notable reduction in overall wind speed is discerned within the transition space. The previously observed local wind speed fluctuations at the juncture between the transition space and outdoor space have been mitigated, addressing the discomfort arising from abrupt changes in wind speed at human height. Moreover, the wind speed within a substantial area adjacent to the new wall corner is lowered to below 2 m/s, resulting in the formation of a localized windless zone at the at the building entrance, thereby diminishing the intrusion of cold air during winter. However, it is pertinent to acknowledge that this improvement measure has discernible repercussions on spatial permeability and route organization.

5. In-Depth Exploration of Optimization Measures

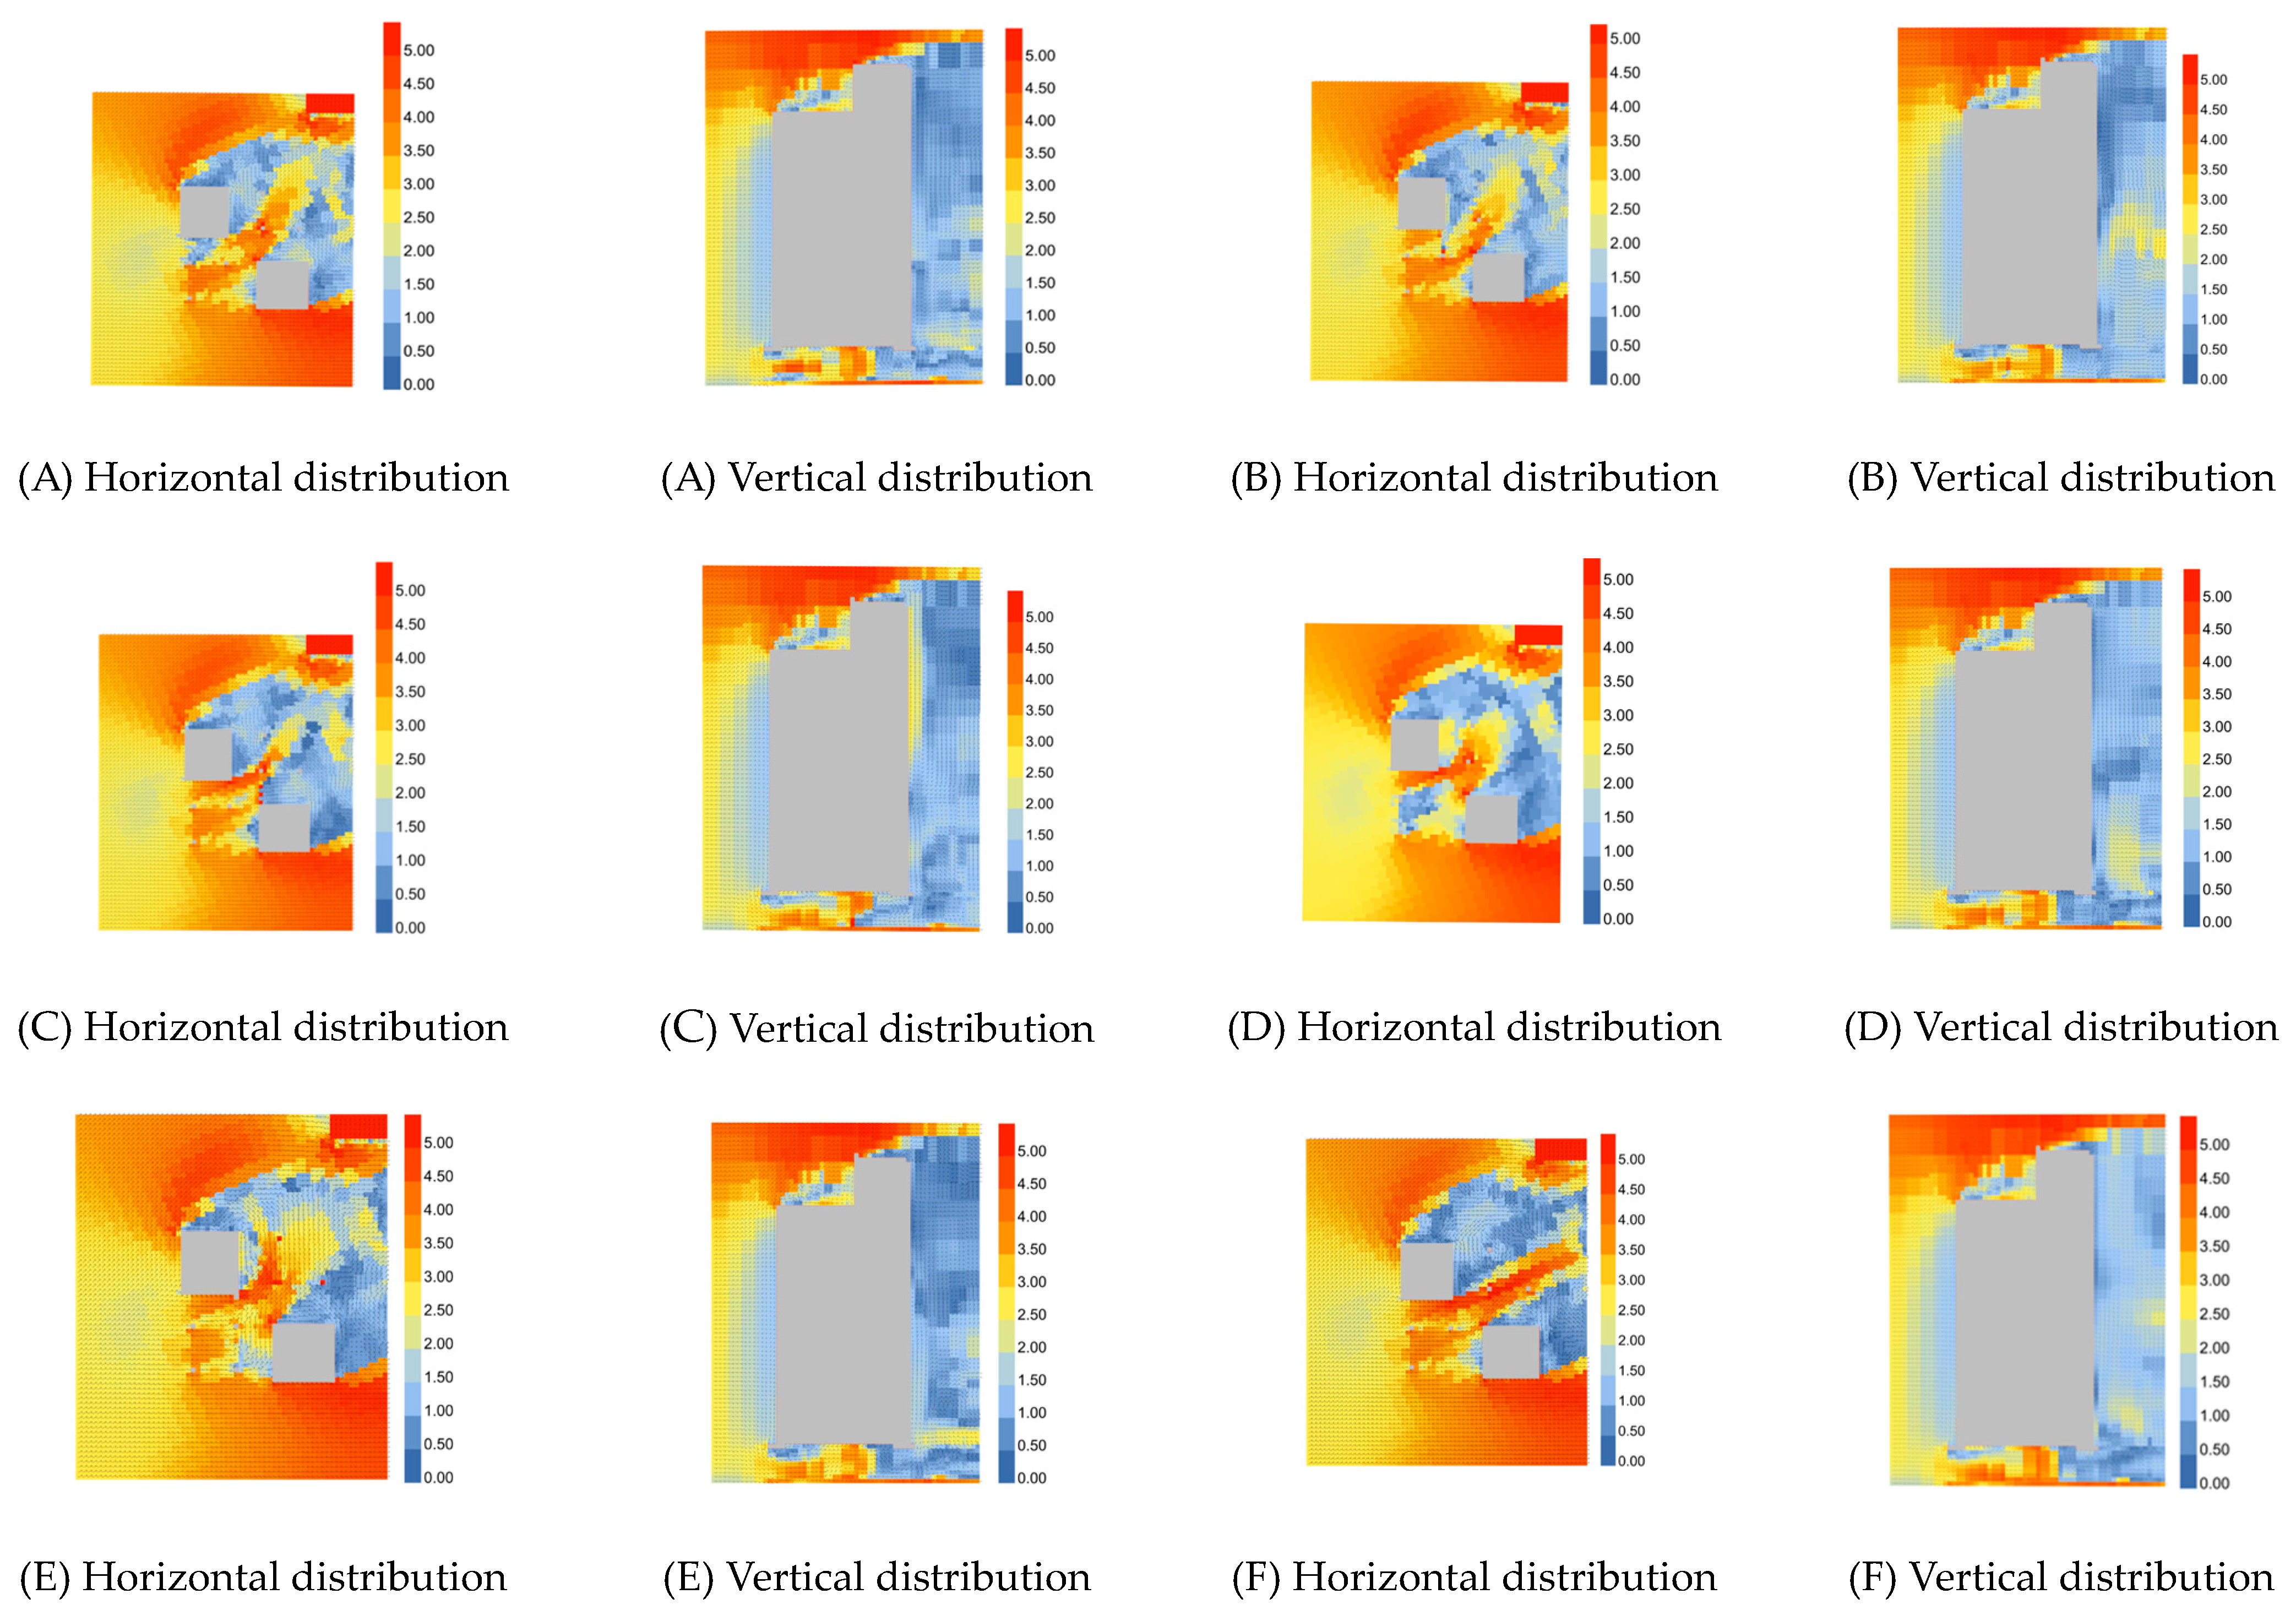
5.1. Optimal Placement of Landscape Wall

Optimization Measure 1 possesses several merits, including more effective reduction of wind speed in localized regions, minimal alterations to the original design, and enhanced spatial complexity. To further enhance the creation of a comfortable wind environment within the first-floor transition space of the office building, a more detailed investigation into the placement of the landscape wall associated with Optimization Measure 1 is undertaken.
In accordance with the dimensions of the transition space, the simulated landscape wall is set to a height of 1.8 m and a length of 6m. The specific positions of the nine sets of landscape walls (A–I) are determined by considering the original column network configuration. These placements are visually represented in Figure 16. Notably, the horizontal angle between A–E and the dominant wind direction is 112.5°, while the corresponding angle between F–I and the dominant wind direction is 157.5°.
Analyzing the horizontal wind speed distribution presented in Figure 17, it is observed that the introduction of walls at positions B and C does not produce a substantial alteration in wind speed within the transition space. Conversely, the placement of walls at positions A and D results in a notable reduction in wind speed within the localized area. Specifically, the configuration at position D weakens the inflowing wind within the “wind corridor”. With the exception of regions influenced by the Venturi effect, wind speed is sustained at elevated levels solely on the north side of the wall, fostering a more even wind speed distribution across a broader expanse. However, for scenic walls F, G, H and I, localized wind speed reductions are confined to the southeast corner of the transition space, without achieving an overarching improvement in the uniformity of the wind environment.
Considering the substantial clear height of the transition space and the negligible impact of the view wall installation on cross-sectional wind speed at pedestrian height, the subsequent analyses focus exclusively on the horizontal plane wind speed distribution, as depicted in Figure 17.

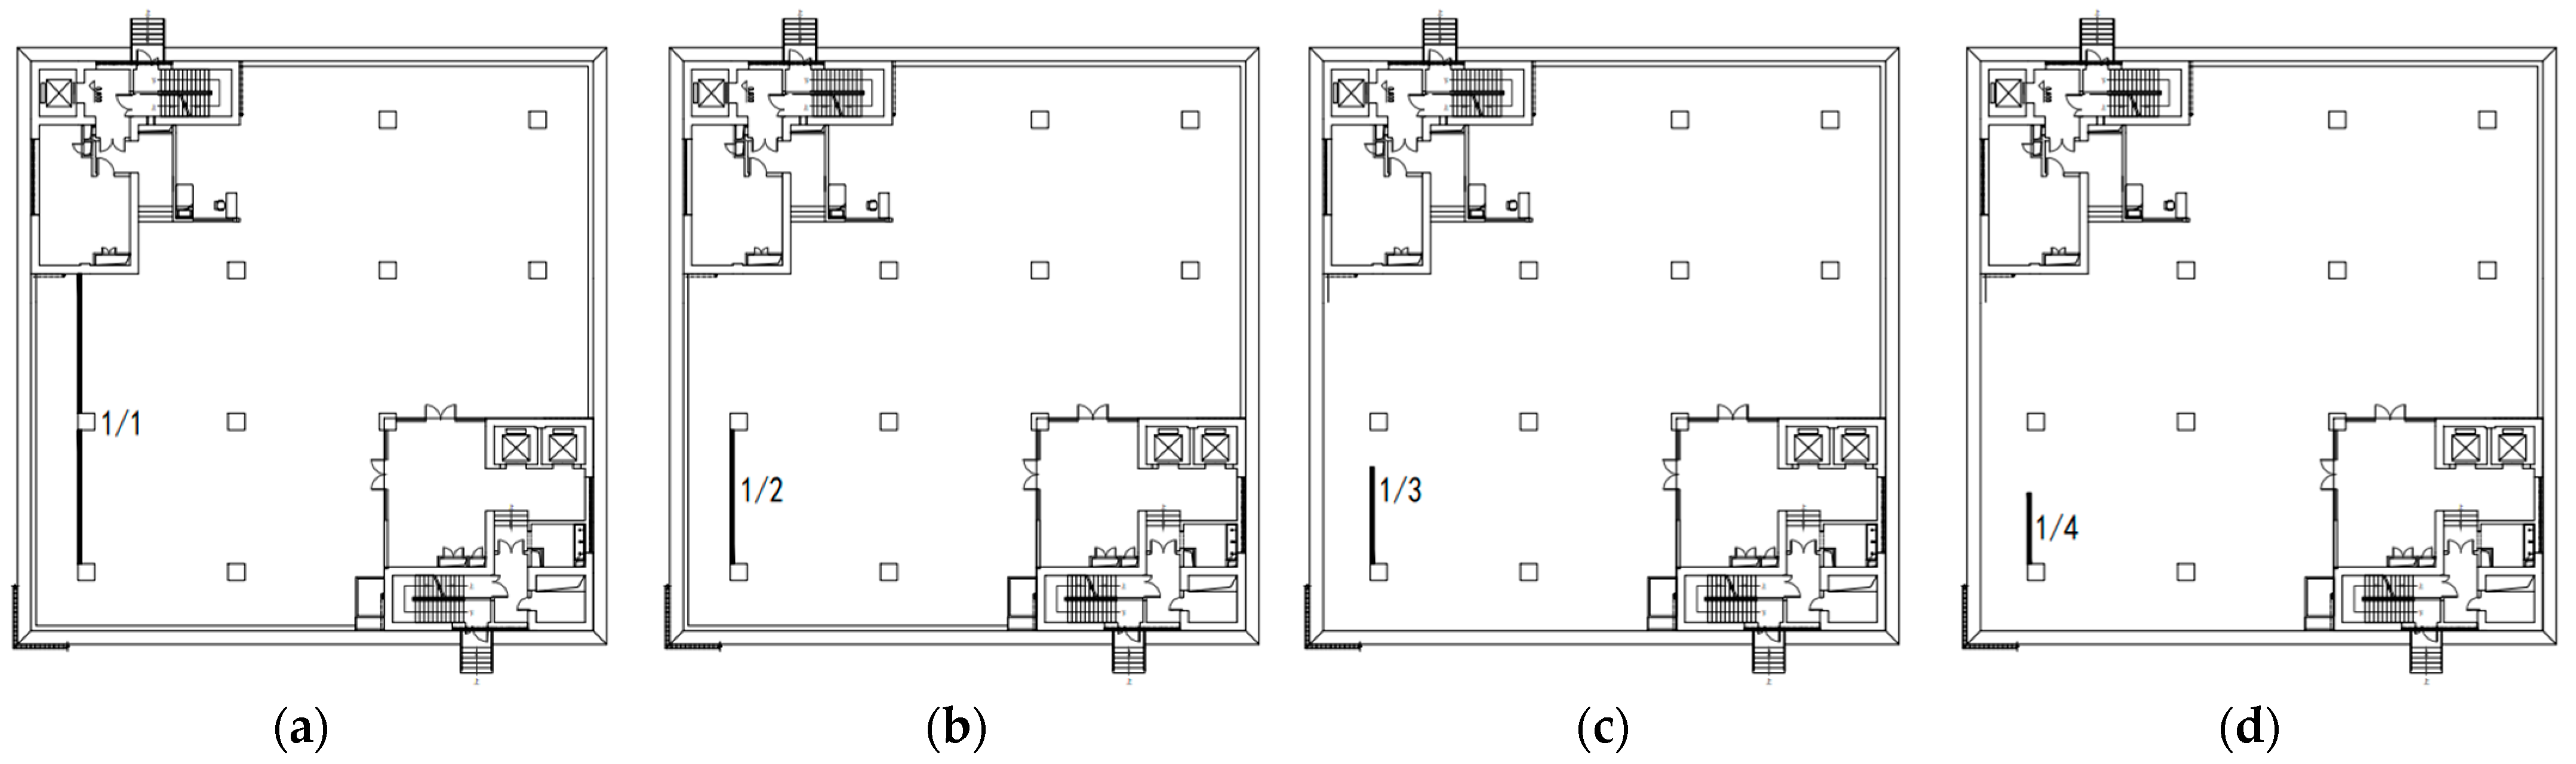
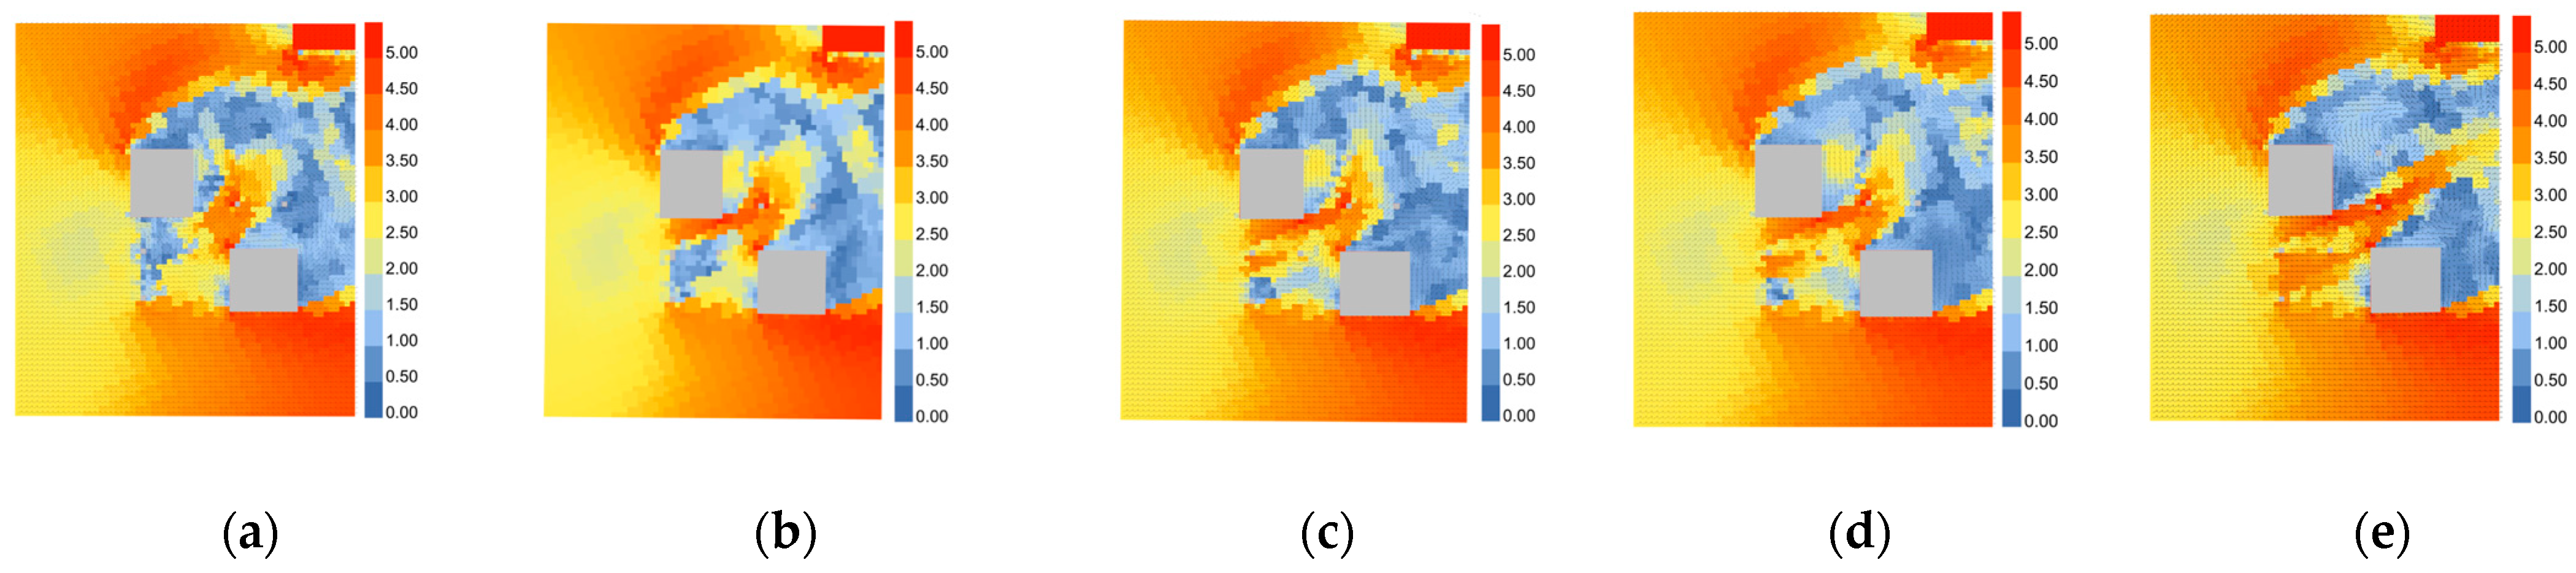
5.2. Determining Landscape Wall Length

Upon thorough analysis, it is concluded that point D is the optimal location for positioning the view wall. Subsequently, four simulation schemes are devised varying the proportion of the view wall to the windward face. Specifically, the lengths of the view wall are set to 1/1, 1/2, 1/3 and 1/4 of the windward face length, respectively. These schemes are presented in Figure 18, aiming to investigate the influence of the length on the view wall length on the wind environment within the transition space.
As illustrated in Figure 19, when the length of the landscape wall matches the length of the windward side, it exerts the most significant influence on the wind environment within the transition space. During this configuration, wind speeds within the transition space closely approximate those of the external environment, avoiding sudden increases in wind speed. In scenarios where the length of the landscape wall is 1/2 of the windward side length, localized wind speed augmentation is observed near the building wall, yet the primary pedestrian areas maintain relatively uniform wind speeds ranging between 0.5 m/s and 2 m/s, conducive for resting and lingering. In instances where the landscape wall length is 1/3 and 1/4 of the windward face length, an abrupt enhancement in wind speed occurs within the main pedestrian areas. However, it is noteworthy that, despite this enhancement, more uniform wind speeds are still achieved in specific localities compared to scenarios without the landscape wall.

6. Conclusions

Through rigorous simulation, causal analysis, and optimization measure examination of the wind environment within the transition space of the office building at Kunming University of Science and Technology campus, the following conclusions are drawn:
  • The design of transition spaces in moderate climate should endeavor to minimize direct exposure to the prevailing wind direction. When such exposure is inevitable, strategic interventions at the junction of the windward side and the transition space, such as tree planting and the installation of landscape walls, should be employed to create a certain degree of shelter. The angle between the view wall and the prevailing wind direction is recommended to fall within the range of 45–135°. For those aiming to diminish overall wind speeds within the transition space, an appropriate approach involves setting the length of the wall to be between 1/3 and 1/2 of the length of the windward side.
  • The architectural interface surrounding the transition space should be designed to avoid significant reductions in cross-sectional scale in this area which has high wind speeds, low air humidity, and moderate temperatures, thereby mitigating the potential occurrence of the Venturi effect.
  • In high-rise building transition spaces in this area, efforts should be made to circumvent the direct alignment of windward and leeward surfaces, thereby preventing the generation of high-rise winds.

Author Contributions

Conceptualization, G.H. and L.T.; Methodology, G.H. and L.T.; Software, G.H.; Validation, X.G.; Formal analysis, X.G. and L.T.; Investigation, G.H. and X.G.; Resources, X.G. and L.T.; Data curation, G.H.; Writing—original draft, G.H.; Writing—review & editing, L.T.; Visualization, G.H.; Supervision, X.G. and L.T.; Project administration, L.T.; Funding acquisition, L.T. All authors have read and agreed to the published version of the manuscript.

Funding

This research was funded by [National Key R&D Program] grant number [2022YFC3802700] And The APC was funded by [National Key R&D Program].

Institutional Review Board Statement

Not applicable.

Informed Consent Statement

Not applicable.

Data Availability Statement

The data that support the findings of this study are available from the corresponding author, L.T., upon reasonable request.

Conflicts of Interest

The authors declare no conflict of interest.

References

  1. Chun, C.; Kwok, A.; Tamura, A. Thermal Comfort in Transitional Spaces—Basic Concepts: Literature Review and Trial Measurement. Build. Environ. 2004, 39, 1187–1192. [Google Scholar] [CrossRef]
  2. Pitts, A.; Saleh, J.B. Potential for Energy Saving in Building Transition Spaces. Energy Build. 2007, 39, 815–822. [Google Scholar] [CrossRef]
  3. Fan, Y.; Lai, Y.; Li, Z. Research on the Characteristics of Transitional Spaces of Modern Architecture: A case study based on Lingnan modern Architecture. S. Archit. 2021, 2, 132–139. (In Chinese) [Google Scholar]
  4. Huang, X.; Lu, Z.; Zhuang, Z. Analysis of the Wind Environment to Improve the Thermal Comfort in the Colonnade Space of a Qilou Street Based on the Relative Warmth Index. Sustainability 2019, 11, 4402. [Google Scholar] [CrossRef]
  5. Lin, H.; Xiao, Y.; Musso, F.; Lu, Y. Green Façade Effects on Thermal Environment in Transitional Space: Field Measurement Studies and Computational Fluid Dynamics Simulations. Sustainability 2019, 11, 5691. [Google Scholar] [CrossRef]
  6. Lin, H.; Ni, H.; Xiao, Y.; Zhu, X. Couple Simulations with CFD and Ladybug + Honeybee Tools for Green Façade Optimizing the Thermal Comfort in a Transitional Space in Hot-Humid Climate. J. Asian Archit. Build. Eng. 2023, 22, 1317–1342. [Google Scholar] [CrossRef]
  7. Lin, H.; Xiao, Y. Effects of Green Facade on Thermal Comfort in Transitional Spaces. West. J. Habitat 2020, 35, 69–76. (In Chinese) [Google Scholar]
  8. Zhang, J.; Wang, R.; Ma, M.; Xu, C. Passive Design Method of Transition Space Based on Temperature Buffer Gradient. J. Shenyang Jianzhu Univ. 2020, 36, 140–147. [Google Scholar]
  9. Avantaggiato, M.; Belleri, A.; Oberegger, U.F.; Pasut, W. Unlocking Thermal Comfort in Transitional Spaces: A Field Study in Three Italian Shopping Centres. Build. Environ. 2021, 188, 107428. [Google Scholar] [CrossRef]
  10. Jiao, Y.; Yu, Y.; Yu, H.; Wang, F. The Impact of Thermal Environment of Transition Spaces in Elderly-Care Buildings on Thermal Adaptation and Thermal Behavior of the Elderly. Build. Environ. 2023, 228, 109871. [Google Scholar] [CrossRef]
  11. Zhang, Y.; Jia, H.; Qiao, L.; Wang, Y.; Yao, Z.; Li, X. Numerical Simulation and Analysis of Outdoor Wind Environment in a High-Rise Community with Matrix Layout Model Based on Computational Fluid Dynamics. Arab. J. Geosci. 2021, 14, 141. [Google Scholar] [CrossRef]
  12. Zhang, Z.; Zhang, Y.; Jin, L. Thermal Comfort in Interior and Semi-Open Spaces of Rural Folk Houses in Hot-Humid Areas. Build. Environ. 2018, 128, 336–347. [Google Scholar] [CrossRef]
  13. Xie, X.; Liao, H.; Wang, R.; Gou, Z. Thermal Comfort in the Overhead Public Space in Hot and Humid Climates: A Study in Shenzhen. Buildings 2022, 12, 1454. [Google Scholar] [CrossRef]
  14. Monteiro, L.M.; Alucci, M.P. Transitional Spaces in São Paulo, Brazil: Mathematical Modeling and Empirical Calibration for Thermal Comfort Assessment. Proc. Build. Simul. 2007, 737–744. [Google Scholar]
  15. Makaremi, N.; Salleh, E.; Jaafar, M.Z.; GhaffarianHoseini, A. Thermal Comfort Conditions of Shaded Outdoor Spaces in Hot and Humid Climate of Malaysia. Build. Environ. 2012, 48, 7–14. [Google Scholar] [CrossRef]
  16. Tse, J.M.Y.; Jones, P. Evaluation of Thermal Comfort in Building Transitional Spaces—Field Studies in Cardiff, UK. Build. Environ. 2019, 156, 191–202. [Google Scholar] [CrossRef]
  17. Kwon, C.W.; Lee, K.J. Outdoor Thermal Comfort in a Transitional Space of Canopy in Schools in the UK. Sustainability 2017, 9, 1753. [Google Scholar] [CrossRef]
  18. Taib, N.; Abdullah, A.; Ali, Z.; Fadzil, S.F.S.; Yeok, F.S. Trends in the Air Temperature of Transitional Spaces of a High-Rise Office Building: The Effects of Season and Location. Indoor Built Environ. 2014, 23, 1117–1128. [Google Scholar] [CrossRef]
  19. Kwon, C.W.; Lee, K.J. Investigation of the Environmental Performance of a Transitional Space in a UK Nursery School. Int. J. Sustain. Build. Technol. Urban Dev. 2016, 7, 153–164. [Google Scholar] [CrossRef]
  20. Prihatmanti, R.; Taib, N. Improving Thermal Comfort through Vertical Greeneries in Transitional Spaces for the Tropical Climate: A Review. GSTF J. Eng. Technol. 2017, 4, 116–123. [Google Scholar]
  21. Chen, Y.; Li, N. Experimental Study on the Influence of Air Flow on Thermal Comfort in Transitional Space. Build. Sci. 2022, 38, 67–75. (In Chinese) [Google Scholar]
  22. Yang, Z.; Han, J. Field Study on Thermal Sensation Variation Characteristics in the Process of Different Transition Space Conversion. Build. Sci. 2015, 31, 15–22. (In Chinese) [Google Scholar]
  23. Ramawangsa, P.A.; Prihatiningrum, A.; Seftyarizki, D. Thermal Comfort of The Outdoor Transition Space In the Dean’s Office Building. IOP Conf. Ser. Earth Environ. Sci. 2021, 738, 012002. [Google Scholar] [CrossRef]
  24. Zhang, Y.; Liu, J.; Zheng, Z.; Fang, Z.; Zhang, X.; Gao, Y.; Xie, Y. Analysis of Thermal Comfort during Movement in a Semi-Open Transition Space. Energy Build. 2020, 225, 110312. [Google Scholar] [CrossRef]
  25. Roudsari, M.S.; Pak, M. Ladybug: A Parametric Environmental Plugin for Grasshopper to Help Designers Create an Environmentally-Conscious Design. In Proceedings of the 13th Conference of International Building Performance Simulation Association, Chambéry, France, 26–28 August 2013. [Google Scholar]
  26. Kabošová, L.; Chronis, A.; Galanos, T. Fast Wind Prediction Incorporated in Urban City Planning. Int. J. Archit. Comput. 2022, 20, 511–527. [Google Scholar] [CrossRef]
  27. Kabosova, L.; Chronis, A.; Galanos, T.; Kmeť, S.; Katunský, D. Shape Optimization of Urban and Architectural Designs for Improving Climate in Cities. Build. Environ. 2022, 226, 109668. [Google Scholar]
  28. Kamel, T.M. A New Comprehensive Workflow for Modelling Outdoor Thermal Comfort in Egypt. Sol. Energy 2021, 225, 162–172. [Google Scholar] [CrossRef]
  29. GB 50178-93; Building Climate Zoning Standard. China Planning Press: Beijing, China, 1994.
Figure 1. Average summer and winter wind speeds and wind directions in Kunming. (a) Summer wind speeds and wind directions. (b) Winter wind speeds and wind directions.
Sustainability 16 01461 g001
Figure 2. Modelling and transitional space plan drawing. (a) 3D models of office building and surrounding structures. (b) Transition space plan of the office building, “上” means “up”, “下” means “down”, and “北” means “north”.
Sustainability 16 01461 g002
Figure 3. Grid construction. (a) Integral grid. (b) Detail of the mesh.
Sustainability 16 01461 g003
Figure 4. Summer horizontal wind speed distribution.
Sustainability 16 01461 g004
Figure 5. Vertical wind speed distribution.
Sustainability 16 01461 g005
Figure 6. Winter horizontal wind speed distribution.
Sustainability 16 01461 g006
Figure 7. Winter vertical wind speed distribution.
Sustainability 16 01461 g007
Figure 8. The formation of a high-rise.
Sustainability 16 01461 g008
Figure 9. Transitional space “wind corridor”.
Sustainability 16 01461 g009
Figure 10. Venturi effect (scientific phenomenon). (a) Diagram of the Venturi. “上” means “up”, “下” means “down”. (b) Venturi effect wind speed distribution map.
Sustainability 16 01461 g010
Figure 11. Optimization Measure 1 and its wind speed distribution: (a) Optimization Measure 1. “上” means “up”, “下” means “down”. (b) Horizontal wind speed distribution. (c) Vertical wind speed distribution.
Sustainability 16 01461 g011
Figure 12. Optimization Measure 4.1.2 (1) wind speed distribution: (a) Horizontal wind speed distribution. (b) Vertical wind speed distribution.
Sustainability 16 01461 g012
Figure 13. Optimization Measure 4.1.2 (2) wind speed distribution: (a) Horizontal wind speed distribution. (b) Vertical wind speed distribution.
Sustainability 16 01461 g013
Figure 14. Optimization Measure 4.1.2 (3) wind speed distribution: (a) Horizontal wind speed distribution. (b) Vertical wind speed distribution.
Sustainability 16 01461 g014
Figure 15. Optimization Measure 3 and its wind speed distribution: (a) Optimization Measure 3. “上” means “up”, “下” means “down”. (b) Horizontal wind speed distribution. (c) Vertical wind speed distribution.
Sustainability 16 01461 g015
Figure 16. Different landscape wall setup locations. “上” means “up”, “下” means “down”.
Sustainability 16 01461 g016aSustainability 16 01461 g016b
Figure 17. Horizontal and vertical wind speed distribution at different locations of the landscape wall.
Sustainability 16 01461 g017aSustainability 16 01461 g017b
Figure 18. Different landscape wall length. (a) 1/1. (b) 1/2. (c) 1/3. (d) 1/4. “上” means “up”, “下” means “down”.
Sustainability 16 01461 g018
Figure 19. Horizontal wind environment of transition space under different landscape wall lengths. (a) Wind speed of 1/1 length of windward. (b) Wind speed of 1/12 length of windward. (c) Wind speed of 1/3 length of windward. (d) Wind speed of 1/4 length of windward. (e) Wind speed without landscape wall.
Sustainability 16 01461 g019
Disclaimer/Publisher’s Note: The statements, opinions and data contained in all publications are solely those of the individual author(s) and contributor(s) and not of MDPI and/or the editor(s). MDPI and/or the editor(s) disclaim responsibility for any injury to people or property resulting from any ideas, methods, instructions or products referred to in the content.

