1. Introduction
The world is suffering from a series of urgent problems dominated by biodiversity loss and climate change [
1]. The United Nations General Assembly declared 2021–2030 the UN Decade for Ecosystem Restoration [
2]. Furthermore, the Convention on Biological Diversity (CBD) COP15 proposed a target to enable at least 30% of areas to be effectively conserved and managed by 2030 [
3], and the United Nations Framework Convention on Climate Change (UNFCCC) called for limiting global warming to well below 2 °C at COP27 [
4]. There is consensus that all of these challenges are deeply interconnected [
5]. The joint Intergovernmental Science-Policy Platform on Biodiversity and Ecosystem Services (IPBES) and the Intergovernmental Panel on Climate Change (IPCC) highlight the mutually beneficial relationships among biodiversity conservation, ecosystem services and measures to mitigate climate change [
1]. Considering that one approach in isolation may inadvertently worsen another, it is necessary to consider these approaches together [
6,
7].
The primary cause of these issues is the change in land use patterns as a result of human activities [
8]. Various international organizations have acknowledged the enormous impact of humans on natural systems [
9]. Research indicates that direct human activity has altered 60% of the world’s land area [
5]. Cities are the main areas of human activity and are the areas where humans have changed the land the most. Evidence increasingly indicates that biodiversity is abundant in many cities [
10], even though a natural region with a healthy ecosystem is typically the first place that comes to mind when discussing biodiversity and ecosystem conservation [
11]. In contrast to other ecosystems, urban systems are not places where biodiversity exists spontaneously [
12]. In fact, due to the development of grey infrastructure, cities frequently experience a decline in environmental services and a loss of biodiversity [
13]. Consequently, species frequently live in “unconventional habitats” inside the fragmented natural landscapes of urban areas [
14]. The Sixth Assessment Synthesis Report of the IPCC notes that urban systems play an important role in advancing climate-resilient development [
15].
However, urbanization is an irreversible process, and there are costs associated with conservation actions in the landscape. To achieve sustainable economic, social and environmental development, conservation programs must be adopted that can address multiple environmental problems in a synergistic manner [
16,
17,
18]. Traditional studies tend to prioritize the protection of specific species and delineate the boundaries of PAs in a point-like manner, but few studies have combined biodiversity and ecosystem services in spatial conservation planning [
19]. While there are areas of shared spatial benefits between the two, this is not always the case [
20]; there are also irreplaceable priority areas between them [
16]. An increasing emphasis on the economic benefits of ecosystem services could be detrimental to biodiversity [
21]. Furthermore, considering only biodiversity when constructing green‒blue infrastructure for built-up urban areas may result in the spatial fragmentation of important ecosystem services [
22]. Plantation forests generated solely based on carbon storage capacity will also result in a loss of biodiversity [
23]. Misalignment between priority areas for biodiversity conservation and high-impact areas for climate change mitigation can make it difficult to implement policies for action and achieve conservation and development goals [
24,
25,
26].
Spatial conservation prioritization (SCP) is a tool used to prioritize conservation by integrating data on assessment indicators such as biodiversity, ecosystem services (ES), and costs to provide a framework for integrated analysis [
27]. Zonation software has been used extensively for SCP analysis in previous studies [
28,
29]. The latest Zonation 5 software provides further optimization of the methodology. New marginal loss rules show good performance when considering the trade-off between mean coverage and performance in the lower tail of the coverage distribution [
11], thus providing major improvements in real-world planning capacity.
China’s nature reserve network has a relatively high representation of mammals and birds but not plants, reptiles, amphibians, or key ecosystem services [
24,
30]. China has established an overall strategic direction at the national level [
27]. Beijing, the capital city of China, covers an area of 16,410 km
2, 39.02% of which is plains. Beijing has become one of the most biodiverse metropolises in the world and is home to 596 species of wild vertebrates and 2088 species of vascular plants. In recent decades, the city has successively carried out a series of ecological protection and restoration measures, such as Afforestation of a Million Acres, and wetland protection. However, Beijing faces challenges in maintaining and improving its biodiversity. One of the key challenges is the impact of urbanization and climate change, which can lead to biodiversity loss and alterations in ecological functions. In recent years, Beijing’s urban expansion has been significant, reflecting its status as a major global city. The years from 2012 to 2023 were the warmest decade in history over the past 70 years, and in June 2023, temperatures reached or exceeded 40° C for three consecutive days. In July 2023, extraordinarily heavy rains in Beijing caused severe damage in Mentougou and other districts. The same problem occurred in megacities such as Mexico City, London, Paris, and Atlanta [
31,
32,
33], all of which are at risk from climate change. These risks require responses to improve the resilience of cities. Our research provides cities suffering from such dilemmas with ideas for solutions. Therefore, our study attempts to determine how spatial conservation prioritization (SCP) can be effectively applied in urban megacities to address the dual challenges of climate change and biodiversity loss. It examines the identification and evaluation of priority areas for conservation that accommodate both the ecosystem services required for climate governance and the protection of biodiversity.
2. Materials and Methods
2.1. General Framework
We used Zonation 5 software to develop a spatial conservation prioritization framework for Beijing that includes three main steps: (1) the evaluation of ecosystem services in Beijing included six separate services, and the results were superimposed to produce an overall assessment map of five ecosystem services; (2) the evaluation of the distribution of biodiversity included 64 species in four taxonomic groups; the distribution was modeled using point data and related environmental data, and the resulting predictions were superimposed in a GIS10.8 software program to obtain a map of suitable biodiversity in Beijing; and (3) finally, Zonation software was used to integrate the above two findings into a spatial prioritization assessment, and the optimal analysis for the minimum coverage of all elements was obtained to classify the priority areas for conservation in area classification.
2.2. Ecosystem Services Considered Climate Change Risk
Ecosystem services (ES) represent the benefits people receive from nature. Their value corresponds to the relative contribution of ecosystems to the social environment. Ecosystem services are valuable concepts that can help decision-makers conserve ecosystems [
34]. To address climate change in a multifaceted manner [
35], five ecosystem services required for climate governance were selected: net primary productivity (NPP), leaf area index (LAI), land surface temperature (LST), carbon storage and sequestration, and urban flood risk mitigation.
Net primary productivity (NPP) refers to the net amount of carbon fixed by plants in an ecosystem during photosynthesis and is an important expression of the ability of plants in an ecosystem to respond and adapt to the environment. NPP represents the quantitative scale and qualitative level of green plants and is used to represent the supporting services that influence climate change.
In this study, the Carnegie–Ames–Stanford Approach (CASA) was used to estimate the NPP of ecosystems with the following formula [
36]:
where
NPP is the net primary production at location x at time t, APAR is the incident solar radiation absorbed by the canopy (MJ/m
2), and the
ε parameter is the light utilization efficiency of
APAR (g.C/MJ
1). Data from the geographic remote sensing ecological network platform (
www.gisrs.cn (accessed on 1 July 2023)) was used by us.
The leaf area index (LAI) refers to the sum of plant leaf area per unit of land area. This parameter is an important indicator of plant community productivity and ecosystem function and is used as a regulating service for air quality regulation and climate maintenance. The LAI is calculated using an empirical formula method that calculates correlations between easily measured parameters such as plant diameter at breast height, tree height, sapwood area, and crown spread and leaf area to establish empirical formulas. We used data from the National Earth System Science Data Center (
http://www.geodata.cn (accessed on 1 July 2023)) [
37].
Land surface temperature (LST) is an important indicator of the urban heat island effect, climate change, ecosystem services, etc. This study is based on the algorithm of the split-window inversion method for inverting LST using infrared channels from satellite-borne sensors. The formula is as follows:
where T
S is the surface temperature and A
31, A
32, B
31, B
32, C
31, C
32, D
31, and D
32 are parameters determined by the atmospheric transmittance, surface reentry, specific emissivity, and brightness temperature factors, respectively. Data from the National Earth System Science Data Center (
http://www.geodata.cn (accessed on 5 August 2023)) were used by us [
38].
With regard to carbon storage, we used the InVEST carbon storage and sequestration model [
39], which includes four types of carbon pools: aboveground biogenic carbon pools, belowground biogenic carbon pools, dead organic matter carbon pools and soil organic matter carbon pools [
40]. These can be found in
Table S1.
The model employs land use data and carbon density data as the assessment units, calculates ecosystem carbon stocks by raster overlay, and then calculates ecosystem carbon stocks based on carbon intensity and land use data for each pixel:
where
Ci = the carbon density of species i;
Ci_above = the carbon density of aboveground organisms of pixel i;
Ci_below = the carbon density of belowground organisms of pixel i;
Ci_dead = the carbon density of dead organic matter of pixel i;
Ci_soil = the carbon density of soil organic matter of pixel i;
Ci_total = the total carbon stock of pixel i in the region;
Ci = the carbon density of pixel i;
Ai = the area of pixel i.
Urban floods: The variable of urban floods mainly considers urban flooding caused by heavy rainfall events [
39,
41]. Natural environmental facilities such as grasslands and woodlands in cities can effectively reduce the surface runoff caused by heavy rainfall and slow the flow rate. The model can quantitatively assess this mitigation ability, with input data including land use data, watershed extent, extreme precipitation depth, and the soil hydrological group biophysical coefficient table, as shown in
Table S2. The main formulas are listed below:
where Q
P,i is the amount of flow production, P is the amount of precipitation, and λ is the infiltration coefficient of the soil. S
max,i denotes the maximum retention rate of the grid before the production of the flow, and its value is related to the value of NC
i (curve number) used by the grid.
2.3. Biodiversity Analysis
Biodiversity (BIO) refers to the variability of biological life at various scales, from genes to species and landscapes [
13]. The perimeters of existing PAs or broad natural areas are sometimes used to represent biodiversity but remain rough estimates of the distribution of diversity in an area. The use of a wide range of species proxies and diversity indicators help to illustrate multiple aspects of biodiversity.
To model species distribution relatively accurately, we selected Maxent, a machine learning method with the principle of maximum entropy as a criterion to model the biodiversity distribution in Beijing [
42,
43]. The results of the distribution model conform to the maximum entropy in the datasets of environmental variables and species points.
In this study, the list of wildlife in Beijing was obtained from the “List of Wild Plants under Key Protection of Beijing Municipality” and the “List of Beijing Terrestrial Wildlife (2021)”, which include 159 species under national or Beijing municipal protection. The observed point data were obtained from
https://www.gbif.org (accessed on 1 July 2023) to identify protected species in the Beijing domain after removing duplicate data. After removing duplicates, we selected species with ≥10 points of data within the Beijing area for analysis [
44] as current research considers fewer than 10 data points unable to obtain good results. Ultimately, we obtained 15 plant species, 7 amphibian species, 23 vertebrate animal species and 19 bird species for a total of 64 species, which can be found in
Table S3.
According to previous studies, a total of 25 environmental factors in 7 categories were selected for model and prediction in Maxent software 3.4.3 (
Table S4) [
45]. For each species, 75% of the data points were randomly selected for analysis, and the remaining 25% of the occurrence points were used for model verification [
46]. The spatial distribution of the habitat suitability of the 64 species was obtained. The Maxent model predicts the probability of a species being present in the study area with values ranging from 0 to 1. The study refers to the threshold classification method in the IPCC Fourth Assessment Report [
47]. A probability value >0.66 is set as the “suitable area”, and the rest of the probability values are set as the “unsuitable area”, i.e., 0 means that the site is unsuitable for the species and 1 means that it is suitable for the species. This information was binarized to take only the optimal distribution areas for each species to represent the most important spaces for species conservation, and the distribution maps for these species were used as a separate input layer for the SCP analysis.
The accuracy of the model was evaluated after the model predictions were made. In this study, the Maxent model was evaluated by receiver operating characteristic (ROC) curve analysis. The area enclosed by the ROC curve and the horizontal coordinate is the area under the curve (AUC), which ranges from 0 to 1 and is used to assess the model’s accuracy. The larger the values are, the more accurately the environmental variables predict species distributions compared to random variables (AUC = 0.5). The area under the curve (AUC) values for 64 species can be found in
Table S3. Species modelling that satisfied AUC > 0.7 was employed in subsequent analyses.
2.4. Spatial Conservation Priority Analysis
To determine our priority areas, we chose Zonation 5 software for our analysis. This software generates hierarchical priorities for the landscape based on input factors and an iterative pixel removal rule that allows only the pixels that contribute the most to a particular conservation objective to be retained [
48]. Each feature in Zonation 5 is assigned a weight, which represents the priority of each feature. The higher the weight is, the more important the feature is, and different weight distributions affect the analysis results. For this reason, we used the distribution maps of 64 species and maps of 5 ecosystem services that considered climate change as input features. All the features in this study were divided into two groups, ecosystem services (ES) and biodiversity (BIO), and each group was assigned the same weight, which meant assigning similar importance for ES and BIO [
49]. In the BIO group, since the selected species were all from the list of key protected species in Beijing, we assigned the same weight to each species [
50]. In the ES group, each of the indicators represented climate change-related services from a different perspective, so we gave them the same weight.
Zonation provides a variety of analysis options to define how the balance between features is achieved when prioritizing. We chose the Core Area Zonation 2 (CAZ2) option, which creates a balance between high-occurrence areas and average coverage [
48]; this was appropriate for our study goals. We also included the hierarchic mask and cost layer settings in the subsequent analysis for the different scenarios. The hierarchic mask describes the hierarchy of land use in the landscape. In this study, this hierarchy consists of two levels, 1 for present PAs and 0 for the rest of the landscape of Beijing. The cost layer can be interpreted as the cost of implementing a conservation action. In this study, we used normalized nighttime light images to represent the magnitude of the cost in different spaces. Therefore, we set up four conservation scenarios and added different conditions to plan the spatial distribution of priorities under different objectives or strategic plans.
Scenario A (ecological integrity as a priority): The purpose of this scenario was to determine priority areas only according to the relevant indicators of the current natural conditions (the current situation of biodiversity and the potential of ecosystem services) without adding restrictions. This scenario allowed us to obtain the spatial protection scenario with the maximum conservation effectiveness.
Scenario B (prioritization of existing PAs): In this scenario, we added a hierarchic mask (2 for the core protection area in existing PAs, 1 for the general protection area in existing PAs and 0 for the remaining landscape of Beijing) for Zonation to analyze so that the highest ranks went to the present PAs.
Scenario C (prioritization of socioeconomic cost involved in iterative assessment): In this scenario, we forcibly prioritized the human activity area by adding the nighttime light map as a cost layer and prioritizing areas that cost less to protect to reduce conservation costs. We used the nighttime light impact to represent the human activity area. Areas outside the active areas were considered less expensive to protect. Therefore, these darker areas were prioritized in the identification of PAs.
Scenario D (real-world situation): In combination with scenarios B and C, we incorporated the hierarchic mask and cost layer into the analysis process simultaneously. This scenario was regarded as the conservation effectiveness planning scenario that was closest to real-world conditions.
2.5. Data Analysis
Through zonation analysis, we obtained the results for four scenarios: the distribution of priority areas considering only ES, the distribution of priority areas considering only BIO, and the distribution of priority areas considering both BIO and ES together.
We first compared the distribution results of ES and BIO priority areas (
Figures S2 and S3). With reference to the UN’s establishment of protection targets, we defined the area with the top 30% priority as high, the top 30–60% as medium, and the bottom 40% as low [
47]. Subsequently, we used a raster calculator in the GIS to calculate the spatial correlation (
Table 1) and spatial distribution (
Figure 1) of the priority areas of each class in space when only the BIO and only the ES were considered.
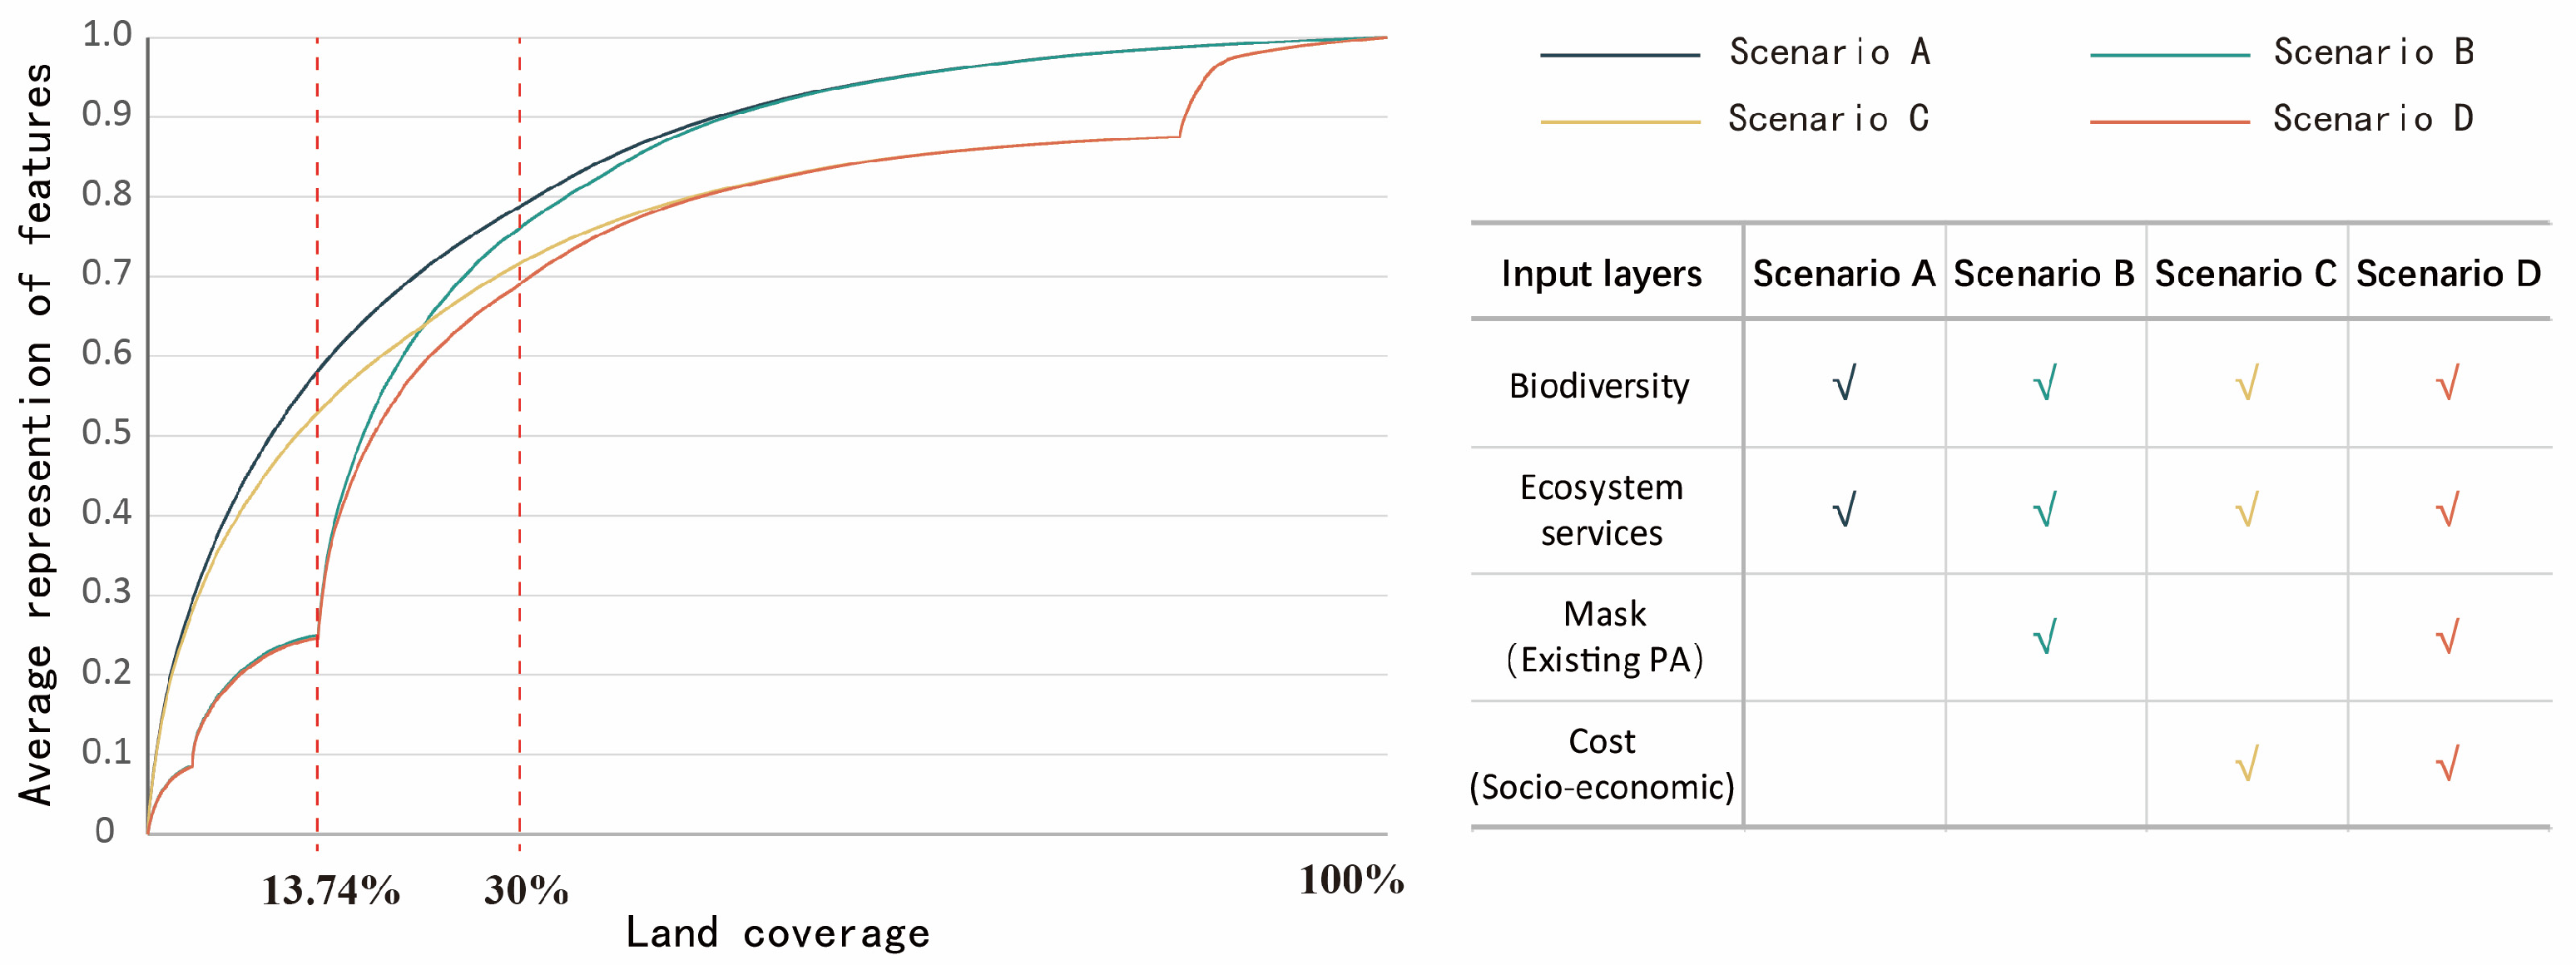
Zonation software generates a map for each priority scenario, and each pixel in the map has a value between 0 and 1 representing its priority. A graph was also generated, with the horizontal axis representing the proportion of the area prioritized for protection of the study area and the numerical axis representing the average optimal proportion of the input feature covered under that area [
51]. In this way, the conservation effectiveness of a fixed number of priority areas is represented, which can also be understood as the optimal representation of the input features within a fixed amount of land. To compare the distribution of priority areas and the conservation effectiveness of the four protection scenarios, we referred to the classification of related studies and reclassified the results of the priority values into six thresholds, as shown in
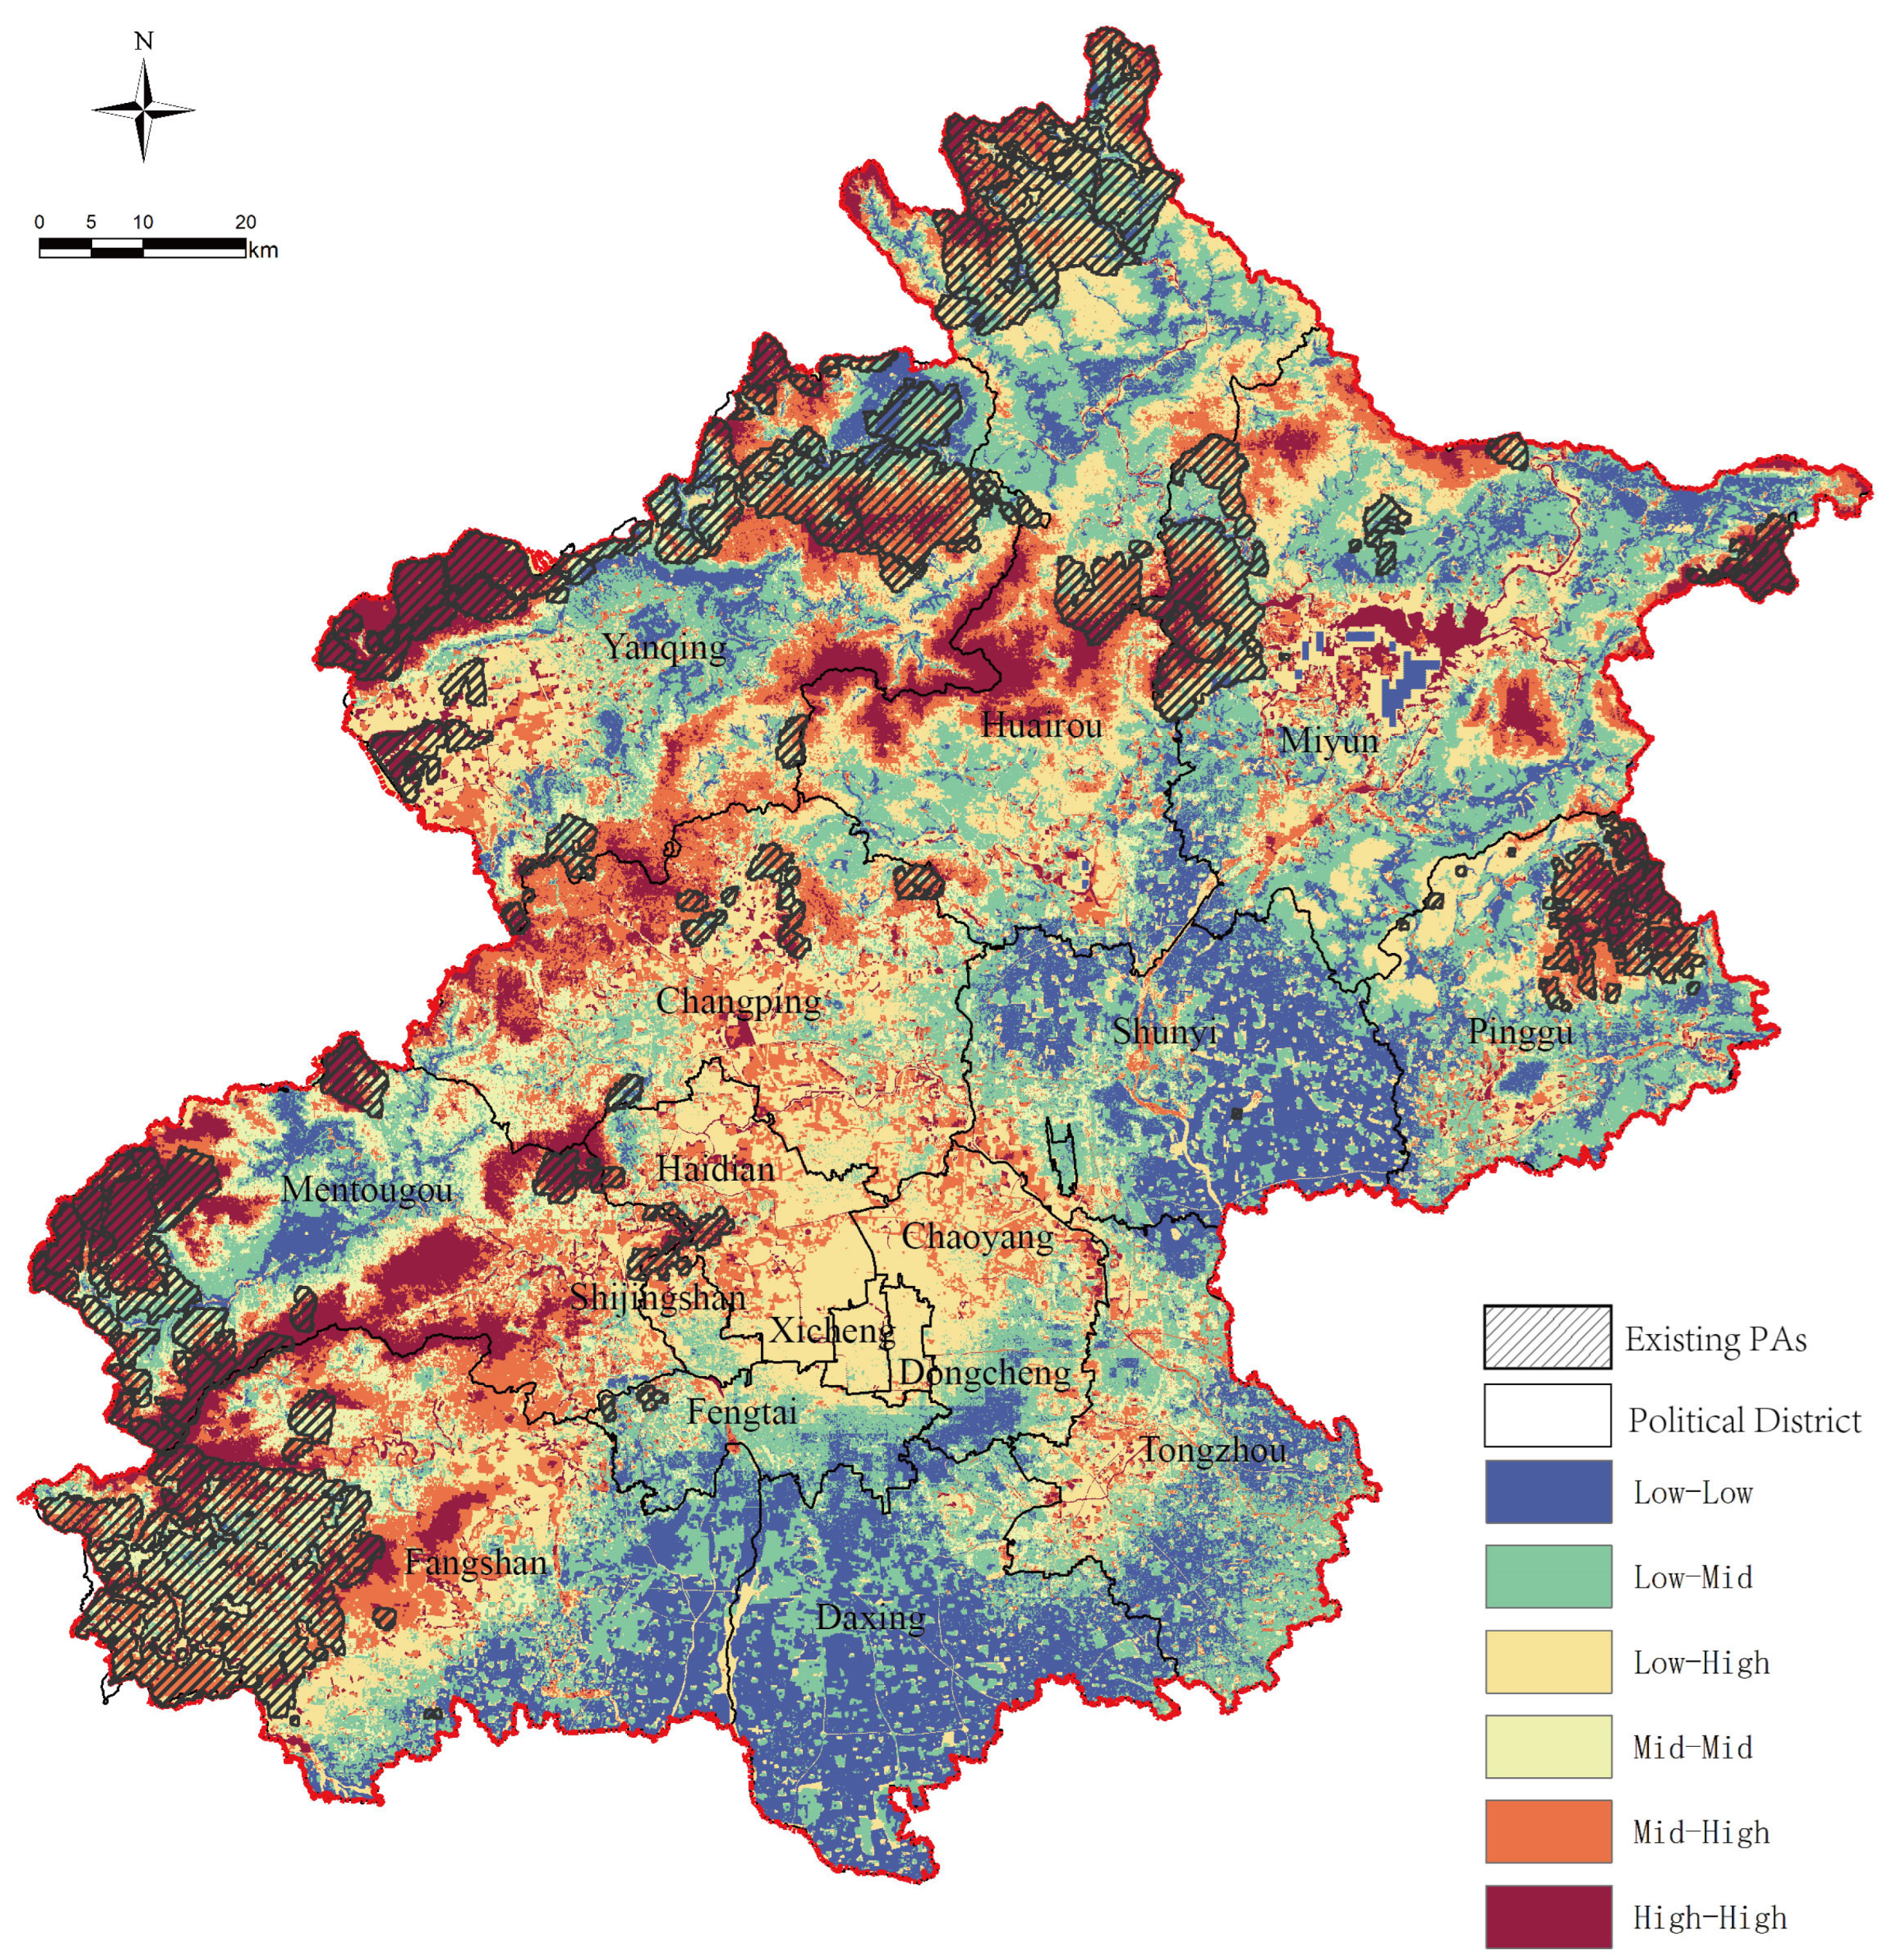
Figure 2. Moreover, the performance curves were combined to complete the gap analysis of the spatial and conservation effectiveness of the existing PAs. The top 13.74% corresponds to existing PAs, and the top 30% corresponds to the target area of land protection proposed by the United Nations
3. Results
3.1. GAP Analysis of Biodiversity and Ecosystem Services
The spatial distributions of ES and BIO did not coincide (
Figure 1). The spatial distribution of the high-value regions of both overlapped by only 10.74% (
Table 1).
The analysis of the five main support services showed that the area with high ES values (
Figure S1), which accounted for 30% of the total area of Beijing, was widely distributed in cool and wet mountainous areas in the northwest, while the others occurred mainly in river wetlands and reservoir shore areas. The central plain had a lower capacity to provide ES. The area with a high ES value covered a wide range of land uses, including forest, grassland, and cropland, with forested land accounting for as much as 78.16% of the area. The central, built-up urban area was less distributed, accounting for only 11.50%.
The areas with high BIO values were mainly distributed in the Yanqing Plain, wetlands, and central areas, which are important for urban development (
Figure S2). The land use in these places are dominated by forestland, watersheds, grasslands, and cultivated land. Forestland has the largest distribution, accounting for 49.80%, and there is a small amount of distribution of land use for urban construction, accounting for 26.10%.
3.2. Priority Patterns in the Four Scenarios
By 2023, Beijing established 17 nature reserves with a total area of 2254.92 km
2, accounting for 13.74% of the area of Beijing. Among them, the core protection area accounts for 3.59%, and the general protection area accounts for 10.15%.
Figure 2 shows the distribution of spatial priorities in the four scenarios. The color gradient represents the least to most valuable expansion areas.
In Scenario A, the top 10% of the prioritized areas are distributed in both the mountainous and flat areas of Beijing. The flat portion is concentrated in the Haidian and Chaoyang districts of the main urban area, where large parks such as the Olympic Forest Park, Yuanmingyuan Garden, and the Summer Palace are distributed. The Liangshui River Basin is in the suburban area. The mountainous part contains the eastern Miyun Reservoir, Song Mountain and Yudu Mountain Reserve in Yanqing District in the northwest, and the Ling, Baihua Mountain, Tianmen Mountain and Shangfang Mountain parts in the southwest. The top 30% of the prioritized areas were added near the original distribution of the top 13.74% of the areas, with the additions covering almost the entire main urban area.
In Scenario B, the top 13.74% of the prioritized areas represent the current PAs, all of which are distributed in mountainous areas. In addition to increasing in mountainous areas such as the Miyun Reservoir in the northwest, Tianmen Mountain in the southwest, and Shanghang Mountain, the top 30% of the prioritized areas increase in large numbers in the flatlands.
In Scenario C, the top 13.74% of the prioritized areas are located in mountainous areas and in the countryside on the plains, which is consistent with the distribution of the mountainous portion in Scenario A. The top 30% of the prioritized areas are also in the mountains and countryside adjacent to the previous region.
In Scenario D, the spatial distribution of the top 13.74% is consistent with that in Scenario B for existing PAs. The top 30% of the prioritized areas are added to the mountainous areas of Miyun Reservoir in the northwest, Tianmen Mountain in the southwest, and Shanghang Mountain.
3.3. Conservation Effectiveness Analysis
As shown in
Figure 3, the performance curves are valuable for assessing the effectiveness of the four conservation planning scenarios. Performance curves were produced by Zonation software; they correspond to the same priority ranking and show the mean conservation coverage of all features that can be achieved by the top-priority areas in the priority rank maps. The figure illustrates the proportion of occurrences remaining for input features (threatened species and ecosystem services) throughout the priority ranking process. To protect an area equivalent to the existing protected areas (PAs), we prioritized the top 13.74% of the landscape. Scenario A (priority scenario in terms of ecological integrity) and Scenario C (cost-involved scenario) performed better than the prioritization of existing PAs in Scenario B and Scenario D. The current PA network harbors 24.99% of the current distribution of the included species and ecosystem services, as shown in the curves for Scenario B and Scenario D in
Figure 3, which is not satisfactory. In particular, the conservation effectiveness of the existing core PAs is 8%, while that of the existing general PAs is 12%. In contrast, without any restrictions, optimally placed priority areas could harbor 58.99% of species’ distributions and ecosystem services. The conservation effectiveness of Scenario C is twice that of Scenario B and is only 5.05% lower than that of Scenario A. In the top 13.74% of priority areas, woodlands are the main priority in Scenarios A, B and C. Urban and rural construction areas account for 23% in Scenario A, only 0.78% in Scenario B, and 12.08% in Scenario C (
Table 2). There is a small gap in land use classification among the scenarios. However, the spatial distributions of the priority areas under the three scenarios are very different. Therefore, in the top 13.74% of priority areas, the main factor that affects conservation efficiency is the different spatial protection of woodlands.
As the priority area (the UN conservation target) rises from the top 13.74% to top 30%, the conservation effectiveness of the PA network would increase to 78.75% in Scenario A and 71.61% in Scenario C. In Scenario B, the performance value initially rises rapidly, reaching 76.07% when 30% of the landscape is protected. The performance value of Scenario D increases more slowly than that in Scenario B, reaching 69.01% with 30% of the study area protected. The curves indicate that prioritization under the scenarios of socioeconomic cost iteration performs worse than Scenarios A and B. This non-linear response reflects how initial increments in protection can be expected to yield rapid gains in biodiversity protection but with smaller increases once higher levels of protection are achieved and only low-quality locations remain. However, incorporating considerations of the socioeconomic impact in Scenarios C and D significantly alters the distribution of high-priority units, giving greater priority to planning units with lower land costs. When the proportion of landscape degradation exceeds approximately 13% under Scenarios C and D, the proportions of remaining habitats and ecosystem services show a sharp decline. This is due to adjustments in distributions after applying the land cost layer. The inclusion of construction land costs results in a 13.5% reduction in the potential habitats and ES distributions available for protection at the beginning of prioritization (
Table 3).
4. Discussion
This work reveals at least three aspects that are worth exploring. Judging from the current status of PAs in Beijing, the average coverage of biodiversity and ecosystem services in these areas is only 24.99%, so these areas do not cover the priority areas of both areas. The protected land types are mainly forestland and cultivated land concentrated in mountainous areas with higher altitudes in the northwest [
52]. With the further expansion of protection, the conservation effectiveness of the distant protected woodlands in the mountains is already close to saturation. As construction land has a more proportional increase in the top 30% of priority areas, protection of this land use type will provide better protection for the same amount of area. When comparing the results of this study with the existing PAs, only a small proportion of the existing PAs are located within the top 30% of the study area in Scenario A (priority in terms of ecological integrity), and most of the protection vacancies are located in parts of the urban built-up areas.
Our analysis found that ecosystem services and biodiversity conservation are not isolated systems and that there are synergies and trade-offs between them. The high-value areas (the top 30% priority value of area) of the two overlap by only 10.74% when only BIO and only ES are considered. This means that only a small part of the important areas of the two overlap spatially and that the high-value areas of the ES are mostly distributed in the mountainous areas of the northern Huairou region, whereas the high-value areas of the ES are mostly distributed in the mountainous areas of the northern Huairou region and in the central urban construction region. The high-value ES is mostly distributed in the mountainous areas of Huairou in the north, while the high-value biodiversity is mainly distributed in the mountainous areas of Fangshan and Mentougou in the southwest as well as in the central urban construction area. Therefore, we believe that it is far from enough to consider only biodiversity or ecosystem services in the previous models constructing PAs.
Our research revealed that, unlike regional protection, the conservation of woodland types in megacities currently has difficulty achieving the desired results [
53]. Moreover, we find that there is spatial consistency between conservation priority areas and human activity areas. Therefore, after many years of restoration measures, the efficiency of ecological protection has reached a bottleneck. The conservation effectiveness of existing protected area pairs is only 24.99%, while the highest conservation effectiveness can reach 58.20% for the same area. The best conservation effectiveness in the four scenarios reached 78.75%, while the lowest reached 69.01% when we expanded the protected area to 30%. Urban areas are the key areas where protection bottlenecks can be overcome to improve the efficiency of protection. Only by treating urban and natural ecosystems as a unified whole can we fully realize the potential of nature while promoting biodiversity conservation and mitigating climate change, which is in line with the current global research findings [
19,
54,
55,
56].
Our research highlights the need for increased focus on species habitats within urban areas. With respect to the protection threshold of 30% of the area, the conservation effectiveness for amphibians was quite good in Scenario A, with only
Rhabdophis tigrinus not fully protected. However, upon incorporating the land cost layer in Scenario C, the representativeness of
Pelophylax nigromaculatus and
Elaphe anomnala decreased by approximately 45%. The protection of bird species was comparatively more successful than that of other species. Only two species,
Aquila nipalensis and
Clanga clanga, were not fully protected, with a remarkable 90.5% of bird species achieving complete conservation of ecological integrity as a priority (Scenario A). Nearly 47.37% of bird habitats experienced an average decrease in representativeness of 48.08% following the inclusion of cost in the analysis. Plant conservation closely followed that of amphibians and birds. Five plant types were not fully protected:
Begonia grandis subsp.,
Cynanchum bungei Decne,
Anemarrhena asphodeloides Bunge,
Polygonatum sibiricum Redouté, and
Lilium pumilum Redouté. However, 67.7% of plant species were successfully conserved in Scenario A. The representativeness of mammals and ES, however, has not achieved complete protection, with species such as Panthera pardus and other feline animals showing better conservation outcomes than rodent species. Our study demonstrated that habitats situated within urban landscapes are vital for addressing the dual challenges of climate change and biodiversity loss in megacities. Neglecting these urban habitats could result in unresolved climate issues and further degradation of biodiversity [
52].
When contrasting the effectiveness of the conservation planning system with and without the incorporation of the construction land cost layer, there are noticeable disparities in the spatial allocation of conservation priorities. The analyses consistently identified regions in the southeastern Liangshui River Basin and the Second Green Belt as significant for ecosystem carbon storage and biodiversity. These areas, as depicted in
Figure 1 and
Figure 2, also conveniently circumvent conflicts with urban development. Consequently, they emerge as potentially suitable locations for establishing urban wilderness reserves within Beijing. Minimizing human intervention within urban wilderness reserves fosters natural succession and enhances the wilderness quality of the region. This improvement in the habitat for wildlife not only augments biodiversity but also advances the ecosystem towards a state of self-sustenance and natural evolution within specific urban areas. Ultimately, this approach is instrumental in achieving the goals of megacity biodiversity conservation and climate governance.
5. Conclusions
In this study, by taking biodiversity and ecosystem services into account, we provide a way to plan PAs. We compare the changes in spatial requirements of these land use types and identify their differences in spatial distribution, which can help to efficiently apply land in subsequent planning and promote sustainable land use in modern urban areas. In addition, this framework is not static. Based on this framework, the evaluation indicators can be further adjusted according to different policies and needs, and priority protection areas can be constructed according to local conditions.
Beijing is one of the most biodiverse metropolises in the world. Several ecological restoration initiatives have been undertaken recently, but it continues to regularly experience extreme weather events caused by global warming. Beijing is thus used as the research object in this study. This study identified and evaluated priority locations for spatial preservation while taking into account the ecosystem services of climate governance and biodiversity protection.
The results of this study are based on the distribution of priority areas for the conservation of biodiversity and climate-related ecosystem services. In the future, policy-makers can work closely with stakeholders to make accurate predictions based on specific future goals and add appropriate facilities under the framework of this study. Moreover, since this study can only determine the distribution of priority areas, policy-makers should also propose effective restoration and management measures to ensure the function of protected areas.


