Abstract
Household food waste is a significant problem in America that can only be addressed through accurate measurement. However, there are many different measurement methods that each have advantages and disadvantages: subjective measures (i.e., recall, visual estimation) are easier to implement via surveys but can be biased, and objective measures (i.e., scales) can be precise but logistically burdensome. In this study, we collected survey and daily diary data on household food waste from 257 individuals to evaluate the extent to which a survey-based subjective recall measure, a diary-based objective scale measure, and a diary-based subjective estimation measure demonstrate convergent validity or concordance. We found evidence of substantial overlap across measures (r = 0.41 to 0.70), suggesting that there is convergent validity across these household food waste measures. Furthermore, we found that a substantial portion of variance in household food waste is attributable to within-household sources over time, demonstrating the as-of-yet overlooked need to examine predictors of food waste at between- (stable) and within-household (dynamic) levels. We discuss the further implications of these results and future research directions.
1. Introduction
One-third of all food in America is wasted, contributing to global climate change and representing a significant financial loss [1]. The environmental impact of food waste is massive, comprising up to 10% of all greenhouse gas emissions, 14% of all water use, 18% of all cropland use, and 24% of all landfill content [2,3,4,5,6,7]. As such, reducing food waste is one of the top three strategies to reduce greenhouse emissions. If 50% of food waste is reduced by 2050, avoided emissions could be equal to 26.2 gigatons of carbon dioxide [8]. Moreover, food waste cost the U.S. an estimated $310 billion in 2021 (the most recent year for which this data was available) [9]. The majority of this toll falls on consumers [9], with the average family of four spending approximately $1500 annually on wasted food [10].
Many countries, including the U.S., have pledged to halve per capita food waste at the retail and consumer levels by 2030 [11]. The Sustainable Development Agenda of the United Nations [12] is to “work together to secure the rights and well-being of everyone on a healthy, thriving planet”, and food waste reduction is intrinsically connected to this goal due to its drastic environmental impact. To realize this ambition, it is important to measure food loss and waste to provide an evidence-based foundation for prioritizing interventions and tracking progress toward targets [13]. Indeed, sustainable development policy requires some form of assessment of progress, making accurate measurement a key step to further sustainability in society.
Although food waste is generated at all points of the supply chain, about half of the food loss and waste in the developed world results from household consumption habits [14,15], highlighting the importance of measuring household food waste in particular. In comparison, approximately 17% of food waste occurs on farms, 15% occurs during manufacturing, and 20% is wasted at consumer-facing businesses such as restaurants or grocery stores [9].
Despite the importance of accurate measurement to food waste reduction efforts, many countries, cities, companies, and other entities currently lack sufficient insight into how much, why, and where food is removed from the food supply chain [16]. This makes it difficult to develop strategies and prioritize actions to prevent food waste and identify the most effective ways to reuse/recycle food [16]. Accurate measurement can provide these insights, but measuring household food waste is hardly straightforward—especially compared to waste generated in some other parts of the supply chain. According to the United Nations Environment Program [11], only 9% of the global population lives in a country where household food waste can be estimated with high confidence. Household food waste measurement is costly and requires time and input from households and/or waste management organizations.
In this study, we contribute to efforts for robust measures of household food waste by comparing different food waste measurement methods and examining the concordance between subjective and objective measures collected in surveys and in daily diaries. Additionally, we compare two different subjective measures to understand the possible bias introduced by survey methods. Specifically, the three measures we compare to one another are a subjective diary-based measure—volume of food waste as estimated by participants each time food is disposed of; a subjective survey-based measure—estimated volume of weekly food waste as recalled by participants; and an objective diary-based measure—weight of food waste as measured by kitchen scale each time food is disposed of. Currently, these are the most commonly employed measures of household food waste in the literature [17], but a significant concern is not only whether each can reliably estimate food waste but whether each estimate is compatible with another. In other words, there are extant questions regarding the degree to which different measures of food waste exhibit convergent validity. Therefore, deriving these benchmarks may provide much-needed information regarding how to measure household food waste most accurately.
An additional challenge in measuring household food waste is that waste varies within households over time, not only between households. Although some households may waste more than others on average, within each household, waste may be higher or lower on any given day of the week or year, and accurate measurement requires that all those sources of variation are captured. In this regard, scholars have begun to recognize the multilevel nature of household food waste [18], but there has yet to be a methodological integration of the dynamic, within-household aspect of food waste into research designs. Specifically, it is unclear whether the fact that food waste is dynamic over time may play a role in making one measure of food waste non-equivalent with another measure of food waste (e.g., a diary measure versus a survey measure). Accordingly, the second contribution of our work is documenting the degree of dynamism, or within-household variance, in household food waste to supplement the (traditional) static, or between-household, perspective.
A final contribution of our work is the development of a food waste tracker mobile application that can be used by anyone with access to a smartphone or tablet. This app allows individuals to track their household’s food waste over time, capturing important information that can lead to better decision-making and financial stewardship of household food resources.
2. Literature Review: Measuring Household Food Waste in America
The quest to quantify household food waste has involved many different measurement methods, such as physically collecting and sorting waste via curbside collection [17], photographic analysis of wasted food [1], and the installation of food waste scales in households [19], to name a few. But the two most commonly used measures are certainly subjective measures, in which people are asked to estimate how much food was wasted in their household (e.g., via surveys, daily diaries, and interviews), and objective measures, where the exact weight of household food waste is collected (e.g., via scales; [20,21]). For subjective measures, respondents are typically asked to visually estimate how many cups and/or tablespoons of food they dispose of, or they may be asked to estimate (in cups and tablespoons) how much food they wasted in the past day or week. Additionally, according to van Herpen et al.’s [22] comparison of food waste measurement methods, these two methods seem to share the strongest overlap.
No measurement method is perfect. Indeed, there are advantages and disadvantages to each method that influence the reliability of measurement and the validity of inferences drawn from them. Here, we discuss these aspects of subjective and objective measures of household food waste, concluding with the need to establish convergent validity (or a lack thereof) between them.
2.1. Subjective Measures of Food Waste
Importantly, subjective measures of household food waste tend to be less expensive and relatively easy to administer in many households. Moreover, their accuracy may be easily improved through study design features, such as pre-study communication [22]. Although subjective measures generally lack precision (as will be discussed shortly), they can be well-suited to capturing an aggregate food waste amount over several different time periods rather than focusing on weighing individual wasted items over a given time. Such an aggregate derived from simple subjective reports may be especially useful for policy purposes and more generalizable, as it is easier to administer and assess across multiple time periods due to the lower cost and effort involved. In contrast, objective approaches may be more impacted by the specific time of measurement, such that estimates are less representative of a household’s average waste [23]. Furthermore, obtaining an aggregate via a single subjective report is likely to be easier from a logistical (survey administration) perspective than computing an aggregate via many objective reports.
However, subjective measures involve several important and well-known limitations. First, while subjective estimates can be flexibly used to capture household food waste over various time frames (e.g., “in general”, “over the past week”, “over a typical week”, “over the past month”), it is likely that estimates become increasingly inaccurate as the time frame increases and/or becomes more abstract [24]. Relatedly, subjective measures rely entirely on human judgment, which is systematically biased. Social science research has determined that humans are more likely to recall certain aspects of past experiences, such as the most salient moments or the most recent experiences, rather than thoroughly considering all aspects of experiences [25]. Combined with the likelihood that food disposal is routine and habitual, this recall bias can present an extra challenge in accurately recalling and reporting instances of food waste [26]. Furthermore, food waste causes many to feel guilt [27], and therefore social desirability may downwardly bias subjective estimates of household food waste [28].
Finally, because there are various established definitions of food waste [29], there are likely to be even more idiosyncratic definitions in the general population that render subjective estimates difficult to compare across households. For instance, the USDAs Economic Research Service defines food loss as the amount of postharvest edible food that is available for human consumption but is not consumed for any reason. The Federal Interagency Collaboration to Reduce Food Loss and Waste notes that food waste is sometimes stretched to include parts of foods non-edible by humans (e.g., banana peels, bones, and eggshells; [30]).
2.2. Objective Measures of Food Waste
The most obvious advantage of objective measurement is that of precision: the exact weight of household food waste can be easily captured, both at the level of individually wasted food items and at the aggregate level. This aspect of objective measurement is especially important when an accurate quantification of household food waste is required, such as for policy goals that specify a percent reduction in waste [20]. Objective measures eliminate sources of recall bias and the limitations of human cognition that may otherwise limit the reliability of household food waste estimates [31].
Despite these advantages of objective measurement, there are clear disadvantages as well. First, objective measures require that households utilize scales, which can be costly and logistically complex to provide to participants from a study design perspective. As such, objective measurement seems easier to implement in cafeteria or restaurant waste cases [19,32]. Second, objective measures also require that households manually sort and weigh all wasted food, which is especially burdensome for multi-person households or families and in other cases where measurements are frequent and time-consuming. Even well-intentioned participants may simply forget or not have time to accurately weigh food each time it is wasted. And participants can incorrectly report amounts captured by the scales or forget to tare scales, introducing other measurement error sources. These aspects of intensive research can reduce data quality and quantity, leading to attrition, underreporting, and/or inaccurate and hurried measurement [33,34]. Furthermore, there is a concern in intensive measurement for self-selection bias, or, as stated succinctly by Scollon et al. [35], “Who volunteers for such intrusive studies and who completes them?" "Who provides the most data?” (p. 14). Thus, objective measurement can threaten the external validity of findings regarding household food waste if those who participate are systematically unique within the general population. Third, simply participating in such an intensive study can exert a disruptive influence and demand characteristics on normal routines and patterns [36], meaning that estimates of food waste could be inaccurate. For example, if wasting food is a socially undesirable behavior and repeated measurement raises a person’s awareness of their wasting behavior, then that person may strive to waste less food during the study. And, simply, the act of measuring food waste makes individuals more aware and can motivate them to change their behavior during study participation.
2.3. The Need for Convergent Validation
In summary, there are advantages and disadvantages to subjective and objective measures, and to some extent, the advantages of one are the disadvantages of the other. Therefore, when it comes to capturing a criterion for measuring household food waste, which is preferable? This question has been empirically examined by several recent research projects [17,22] and is a perennial question in this literature. We propose two research questions aimed at examining the convergent validity between these measures to determine whether they are substitutable measures of the same construct.
Demonstrating convergent validity between measures would suggest that, although each is imperfect, both measures essentially capture the same phenomenon and are interchangeable. Specifically, “a strong correlation between proxies suggests convergent validity—the two measures capture the same information and will act the same when used in research designs” ([37], p. 20). But if there is little overlap between measures, then it may be unclear which measure is superior, as stated by Carlson and Herdman ([37], p. 20): “When convergent validity is weak, one or both variables do not capture the intended construct well. Consequently, evidence of weak convergent validity introduces ambiguity into the meaning of research results.” Low concordance rates would introduce the need for further validation studies to determine whether one form of measurement better represents food waste and what accounts for the observed differences in measures.
Here, we examine the degree to which a survey-based subjective measure of food waste volume over one week converges with a diary-based objective measure of food waste mass over one week. Furthermore, we examine the degree of convergence between the total estimates of food waste and the estimates at the level of each individual food category, reasoning that convergence may be higher when the “what” is held constant across measures (e.g., [38]). Additionally, we examine the degree to which a diary-based subjective measure of food waste volume over one week converges with a diary-based objective measure of food waste mass over one week, reasoning that these two methods may exhibit stronger convergence due to the elimination of recall bias and increased ecological validity of the diary-based subjective measures [36,39]. Finding that these latter measures are convergent may suggest that subjective measures can be reliably used to measure food waste as long as procedural steps are taken (i.e., in the study design and measurement tool) to minimize recall biases and maximize ecological validity.
Thus, we present the following research question:
Question 1.
What is the degree of convergent validity (as indexed via correlations) between subjective (survey, diary) and objective (scale) measures of food waste, both at the total food waste level and at the individual food category level?
2.4. Literature Review: The Overlooked Importance of Levels of Analysis
Researchers have argued that household food waste is a multilevel problem in that it is influenced by and emerges from a complex web of system-, household-, and individual-level factors and interactions [18,40]. However, there has been little consideration of time as a dimension of the food waste measurement problem. Specifically, research has generally adopted a between-household (or between-person) perspective to identify whether Household A wastes more food than Household B over a particular period of time (e.g., the past week, a typical week, in general). In contrast, a within-household (or within-person) perspective approaches the matter of food waste as one of change over time for the same household: Household A’s waste on Monday versus Tuesday, one week versus the next, or on a normal day versus a holiday, and so forth.
Much has been written on the dangers of assuming that findings at one level of analysis can be transported to a different level of analysis (e.g., [41]), but there are also unique insights that can be provided by adopting a within-household perspective to the study of household food waste. We explore two here: level of aggregation and within- and between-household variance.
2.4.1. Level of Aggregation
To estimate the mean food waste for a given household, there are two primary options: ask individuals to self-report their mean waste for a given time period or ask individuals to report their waste at several time points and then aggregate those reports to compute a mean. This former method is cross-sectional, whereas this latter method is akin to the density distribution approach (For instance, Fleeson proposes that comprehensive personality descriptions require the simultaneous consideration of traits and states, where traits are density distributions of the frequency with which states are expressed in a certain intensity) [42] and offers a more reliable, stable estimate [43]. With cross-sectional measurement, all aggregation is cognitively performed by the participant, but the density distribution approach offers the researcher different options for aggregation: retain the data at the occasion level (i.e., disaggregated) or aggregate to a higher level, such as for the day or week as a whole (e.g., [44]).
Here, the strongest convergence between a self-reported diary measure of food waste and an objectively reported scale measure of food waste may be at the disaggregated level of the occasion, or for each individual item of wasted food. In this case, a person can record their estimate of its volume based on physical and visual observation of the item. This process is likely to be imperfect. Overlap will likely decrease as the researcher increasingly aggregates individual reports for higher levels of analysis.
Therefore, we present the following research question:
Question 2.
Does the degree of convergent validity (as indexed via correlations) between diary (subjective) and scale (objective) measures of food waste change depending on the level of aggregation (i.e., occasion-level, day-level, and week-level)?
2.4.2. Within- and Between-Household Variance
A within-household perspective casts food waste as a household-specific criterion rather than one that is only studied at the level of the general population [45]. The between-household perspective treats food waste as static (i.e., waste is consistently higher for some households and lower for other households), whereas the within-household perspective treats food waste as dynamic (i.e., waste may be high at times and low at other times), “emphasizing that individuals [or households] are not static entities but, rather, that their states, behaviors, and environments change over days, hours, or even from one minute to the next” ([46], p. 2).
Treating food waste as a dynamic phenomenon, via the within-household perspective, implies that variance in food waste is both within-household and between-household. These two sources of variance must be examined separately and as orthogonal, rather than via a single approach that conflates within- and between-source variance (e.g., [47]). Thus, there may be novel predictors at one level of analysis that do not function at the other level of analysis, and there may be predictors that function at both levels but more effectively at one versus the other [46].
The level of analysis also has implications for measurement accuracy and waste-reducing interventions. First, the within-household approach better aligns with individuals’ lived experiences as they unfold over time [48]. As such, food waste can be accurately and reliably measured when tracked over time due to fluctuations between high and low levels at certain times within a household [39]. Moreover, lived experience is episodic in nature and segmented as such in memory [49], meaning that measurement designs that better adhere to the episodic unfolding of people’s lives will result in more accurate reporting of those experiences, rather than asking individuals to recall instances in a way that does not match their encoding [36]. Second, the within-household perspective suggests a different substantive set of interventions than the between-household perspective. Specifically, a between-household perspective identifies which households waste more food in general, but a within-household perspective identifies when waste is going to be higher. This means that interventions should target certain households more than others (between-household perspective), but also that interventions may be especially useful/timely at certain times of the year or week (within-household perspective). Thus, the combination of both perspectives can ensure that interventions are personalized for high-waste households and for high-waste occasions, being “just-in-time” in nature [50].
In this study, we examine both between- and within-household food waste over a single week via daily diary entries and a subjective survey. We explore the degree to which variance in food waste is attributable to static, between-household factors versus dynamic, within-household factors. If we find that within-household variance is particularly high, meaning that between-household variance is particularly low, this may suggest that there is a limit on the possible efficacy of between-household interventions.
Therefore, we present the following research question:
Question 3.
How much of the variance (as indexed by two-level intra-class correlations computed via multilevel modeling) in food waste is attributable to within-household sources (Level-1) versus between-household sources (Level-2)?
3. Method
The data for this study is drawn from the MITRE Gallup State of Food Waste in America survey [51], which was conducted between 21 June 2023 and 23 August 2023. The survey included two separate portions: a nationally representative cross-sectional survey and a daily diary to collect daily waste data for seven consecutive days via the MITRE Food Waste Tracking Application. A subset of these participants was provided with a Bluetooth-enabled scale to automatically sync their food waste weight directly to the app.
In this study, we only include individuals who completed both the survey and the daily diaries, as our interest is in examining convergence between measures of food waste for the same households (i.e., to facilitate a within-household approach). Additional details about the research methodology are provided in the sections below.
3.1. Participants
Participants were drawn from the Gallup Panel, a probability-based panel of U.S. adults that is representative of the U.S. adult population. For this study, a stratified random sample of U.S. adults, ages 18 and older, was drawn from the Gallup Panel (More information is provided regarding sampling procedures in a publicly available report, which can be found here: https://sites.mitre.org/household-food-waste/study/). This study used state-level geographic balancing.
Of the total number of participants who participated in the cross-sectional survey, 620 consented to participate in the daily diary portion of the study. In total, 261 participants who completed the National Food Waste Survey also completed at least one food waste entry during the daily diary portion of the study. We excluded from all analyses four outlier waste entries due to having unlikely volume estimates (i.e., 222 cups of wasted vegetables, 32 cups/120 g of wasted meat, 25 cups/19 g of wasted milk, and 25 cups/176 g of wasted non-dairy). Finally, we only retained data pertaining to food that was disposed of in the household, rather than at a restaurant (=219), at a cafeteria (=28), or elsewhere (=157), as our interest in this study is in household food waste.
Thus, the final sample included 257 participants (response rate = 17% of total survey invites) who completed both the survey and the daily diary, of whom 143 were assigned to the scale condition (asked to measure their food waste using a blue tooth-enabled scale) and 114 were assigned to the volume-only condition (asked to visually estimate their amount of food waste). At the end of data collection and cleaning (described above), our final sample included 2839 food waste entries from these individuals. Across the entire study, each individual completed a mean of 11.05 entries across seven days (SD = 9.19). Participants were compensated $5.00 for completing the survey, $5.00 for each day that they completed app diary entries, and a $5.00 bonus for completing app diary entries for the entire seven-day study duration. Thus, the total possible compensation was $45.00.
In terms of demographic characteristics, the mean age of the final sample was 50.1 years old (SD = 15.48), and 56% of participants were female. Seventy-three percent of participants indicated their race as White, 10% as Hispanic, 9% as Black, 4% as Asian, and 4% as Other. The mean household size was 2.56 people (SD = 1.32), and 35% of participants had at least one child at home. Sixty-nine percent of participants were employed full- or part-time, 28% were out of the labor force (e.g., retired, homemaker, student), and 2% were unemployed. The median education level was a four-year bachelor’s degree, and the median household income was in the range of $90,000 to $119,999.
3.2. Procedure
3.2.1. Cognitive Interviews
Prior to the main data collection, we conducted cognitive interviews with 22 participants of the Gallup Panel (45% female, 55% 41 years of age or older, 68% White, and 59% at least had a bachelor’s degree) who completed the survey. Out of the 22 cognitive interview participants, 9 commented on the clarity of the food waste estimation questions in the survey, and 13 commented on the clarity of the food waste estimation questions in the daily dairy app. In line with the main survey design, a week before their scheduled interview, the nine participants who would comment on the survey questions were sent an email asking them to monitor their food waste (types and amounts) over the next seven days. The email also indicated that participants should be keeping track of food waste for their entire household and recommended they communicate about food waste with their other household members during this time.
The cognitive interviews focusing on the survey included questions on participants’ food waste estimates, such as follow-up questions to understand how estimates were reached, confidence in estimates, and factors that may have affected the estimates. Participants were also asked questions about their perceptions of and compliance with the pre-interview instructions and asked for their feedback on a subset of additional proposed survey questions. Aggregated responses were used to refine recruitment materials and the survey instrument.
Turning to the cognitive interviews for the daily diary app food waste estimation, cognitive testing for 13 participants assessed the ease of accessing the app, user experience with app features, and comprehension of app content and procedures. Participant feedback was incorporated via minor updates to the application features, explanatory resources embedded in the application, and instructions for using the application provided in participant recruitment processes. Additionally, researchers in the field of food waste as well as individuals working at non-profits targeting food waste issues beta-tested the app prior to this study.
3.2.2. Data Collection
To avoid a possible order effect biasing food waste estimation, participants were randomly assigned to either complete the survey first and the diary second, or vice versa. Furthermore, in the daily diary, participants were randomly assigned to either the scale condition (i.e., to measure waste in mass with a Bluetooth scale and in volume via visual estimation) or the volume-only condition (i.e., to measure waste in only volume via visual estimation).
Approximately one week before receiving an invitation to complete the survey, participants were informed about the upcoming survey and asked to pay attention to their food waste and the food waste of other household members (types and amounts) for the next seven days in preparation for answering the survey questions. It was recommended that they keep notes to help them remember what they disposed of.
The daily diary portion of this study was conducted for a period of seven consecutive days. Prior to beginning the daily diary, participants read descriptions of the daily diary procedures, duration, timing, and requirements for the use of the MITRE Food Waste Tracking App. Reminders were sent to encourage participants to download and try using the app before the official study period, as well as to remind participants when their seven-day study period began. Participants were also sent daily email reminders to encourage them to be consistent in entering any and all food waste into the app during the seven days of the daily diary study (Note that reminders were originally set up to be delivered each morning of the seven-day period, but mid-afternoon reminders were added as well).
3.3. Measures
3.3.1. National Food Waste Survey
In the survey, participants estimated the approximate volume of food their household disposed of over the past seven days (week) in cups and in tablespoons. For reference, participants were told that one cup is about the size of their closed fist and one tablespoon is about the size of their thumb. This question was asked about fruit, vegetables, grains, protein, dairy, mixed foods, scraps, and oils/fast/sugars, and examples of each were provided. Participants additionally responded to survey questions about food waste attitudes, knowledge, and behavior, which are not further evaluated in this paper but can be further explored in Aitken et al. (2023) [51].
3.3.2. MITRE Food Waste Tracker App
The MITRE Food Waste Tracker app is designed to allow users to track their food waste, including the food waste amount, source of the food, type of food, reason for disposal, and location of disposal.
Of focal interest, participants estimated the amount of food wasted for each individually logged entry. Participants in the scale condition were provided with a Bluetooth-enabled kitchen scale that connected to the MITRE Food Waste Tracker app to automatically input food waste mass (in grams) when waste items were placed on the kitchen scale. If the Bluetooth scale was not functioning properly and did not log an item’s mass, participants also had the option of manually inputting mass (i.e., by reading the mass value on the scale and typing that value into the app).
Participants in both the scale condition and the volume-only condition estimated the approximate volume of food waste in cups and tablespoons. A visual guide was provided for every entry occasion, reminding participants that a cup is about the size of a person’s closed fist and that a tablespoon is about the size of a person’s thumb (see Figure 1 below).
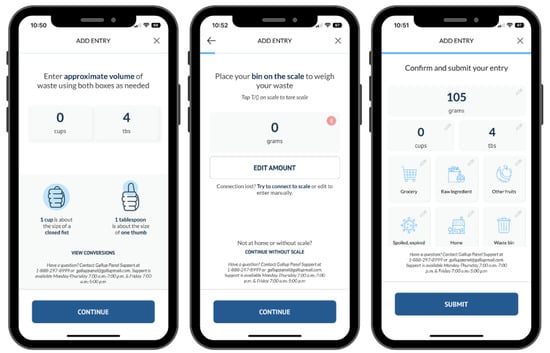
Figure 1.
Visual Summary of the Food Waste Mass/Volume Diary Estimation.
Participants also classified food waste into one of eight categories, based on the United States Department of Agriculture’s [52] MyPlate Food Guidance System. More information about MyPlate can be found at https://www.myplate.gov/. Furthermore, within five of the eight main food categories, participants were asked to provide additional information about the food type at a sub-category level. For instance, after selecting “Fruits”, participants were provided options to specify the type of fruit: berries, melons, fruit juice, or other fruits. The sub-type categories were also found in the USDAs MyPlate Food Guidance System.
Finally, participants reported several other characteristics of the wasted food item (for descriptive purposes). Participants indicated whether the food was originally from a grocery store, restaurant, home garden, gifted food, or meal kit; whether the food was plate waste, raw ingredient, or stored leftovers; participants indicated whether the food was disposed of due to: dislike taste, spoiled/expired/rotten, excess, inedible, or other; whether food was disposed of at home, restaurant, cafeteria, or other; and whether food was disposed of via a waste bin, drain, compost, or animal feed.
3.3.3. Data Analysis
To test Question 1, we computed correlations between the subjectively estimated volume of food waste over a given week in the survey, the objectively estimated mass of food waste in the diary (aggregated to the week-level), and the subjectively estimated volume of food waste in the diary (aggregated to the week-level). We computed both between- and within-household correlations for the two diary measures. Correlations were computed both at the level of overall food waste and for waste at the level of each individual food category. The extent to which correlations are large would indicate that there is substantial overlap (or convergence) between food waste measures. Specifically, we employ the following criteria to evaluate convergent validity: First, we interpret correlations of 0.70 or higher as indicative of substitutable convergence [37], whereas correlations below 0.70 may indicate that there is only some degree of convergence. To interpret the magnitude of correlations below 0.70, we utilize Cohen’s [53] benchmarks of 0.10 as a small correlation, 0.30 as a medium correlation, and 0.50 as a large correlation. Thus, small correlations may indicate little convergence, medium correlations may indicate some convergence, and large correlations (that are still below 0.70) may indicate considerable, though not substitutable, convergence.
To test Question 2, we computed correlations for food waste measures at the occasion-level (i.e., not aggregated), aggregated to the day-level, and aggregated to the week-level. The extent to which correlations exhibit similar magnitudes across levels of aggregation would suggest that there is little difference in variability when assessing food waste over different periods of time.
Finally, to test Question 3, we utilized multilevel modeling to compute intra-class correlations (ICCs) for diary-based food waste measures. ICCs document the amount of variance in a variable that is attributable to a grouping structure—in this case, attributable to between-household sources (relative to within-household sources). The extent to which ICC values are large would suggest that most of the variance in food waste is stable rather than dynamic.
We use R [54] for all analyses. Furthermore, we utilize the psych package [55] to compute correlations and the lme4 package [56] to compute ICCs. The raw survey and app data used for these analyses can be found at the following website: https://sites.mitre.org/household-food-waste/study/.
4. Results
Prior to testing research questions, we began our analyses by examining descriptive statistics for the amount and characteristics of reported food waste across the daily diary. Based on 2839 completed food waste entries from 257 participants (scale and volume-only conditions), 3487.81 cups (SD = 1.63) of food were wasted across the entire duration of the study. In the scale condition, based on 1847 completed food waste entries from 143 participants, 301,569 g (SD = 330.84) of food were wasted across the entire duration of the study. Table 1 shows further information about the amount and type of food that was wasted.

Table 1.
Descriptive Statistics Regarding Amount of Wasted Food.
We further examined the characteristics of reported food waste across a few variables. Table 2 shows the number of food entries that were indicated as being from a particular food source (food source: grocery, restaurant, garden, gifted, or meal kit), of a particular condition (food condition: raw ingredient, plate waste, or stored leftovers), disposed for a particular reason (disposal reason: inedible, spoiled/expired/rotten, excess, little left, other, or dislike), and disposed of via a particular method (disposal method: waste bin, compost, drain, or animal feed).
Table 2.
Characteristics of Wasted Food.
We now proceed to formal tests of the research questions.
4.1. Convergent Validation
In Question 1, we asked what degree of convergent validity existed between subjective (survey, diary) and objective (scale) measures of food waste.
First, in the scale condition of the daily diary (N = 143 households), we assessed the degree of overlap between the subjectively estimated volume of food waste over a given week in the survey (M = 9.13 cups, SD = 12.00 cups) and the objectively estimated mass of food waste aggregated to the week-level (M = 1714.78 g, SD = 2201.35 g). The correlation demonstrated significant convergence between measures of food waste (r = 0.45, p < 0.001). As a robustness check, we reran this correlation including scraps in the total estimates for survey-volume (M = 12.61, SD = 13.82) and diary-mass (M = 2108.87, SD = 2796.85) and found little difference in the estimate: r = 0.44, p < 0.001. Furthermore, we also reran the correlation (excluding scraps) only for individuals who had indicated in the survey that their household waste from the past week was “about the same as usual” (N = 106) and found little difference in the estimate (r = 0.46, p < 0.001). This correlation falls below the benchmark for substitutability but does indicate that there is at least moderate convergence between these measures of food waste.
Second, we assessed the degree of overlap between the subjectively estimated volume of a given item of food waste and the objectively estimated mass of that same item of food waste in the scale condition of the daily diary (N = 143 households). The between- and within-household correlations demonstrated a substitutable level of convergence between measures, r = 0.70 (p < 0.001) and r = 0.68 (p < 0.001), respectively.
Finally, in the full sample of the daily diary (N = 257 households), we assessed the degree of overlap between the subjectively estimated volume of food waste over a given week in the survey (M = 7.93 cups, SD = 10.34 cups) and the subjectively estimated volume of food waste aggregated to the week-level (M = 11.39 cups, SD = 11.59 cups). The correlation demonstrated significant convergence between measures of food waste (r = 0.41, p < 0.001). This correlation falls below the benchmark for substitutability but does indicate that there is at least moderate convergence between these measures of food waste.
To test the aspect of Question 1, wherein we asked whether convergence differs across individual food categories, we computed correlations between food waste measures for each food category rather than at the level of total food waste. As can be seen in Table 3, the pattern of correlations varied across food categories, indicating that the degree of overlap between food waste measures changes depending on the type of food being assessed.
Table 3.
Correlations between Food Waste Measures for Individual Food Categories.
In summary, these findings demonstrate that there is moderate evidence for convergent validity across measures of food waste, but there is only limited evidence that these measures are substitutable. Thus, any of these measures may be likely to distinguish high- and low-wasting households, but certain measures capture different aspects of information related to food waste.
4.2. Level of Aggregation
In Question 2, we asked whether the degree of convergent validity between diary (subjective) and scale (objective) measures of food waste changed depending on the level of aggregation (i.e., occasion-level, day-level, and week-level). Thus, we computed multilevel (within-household and between-household) correlations for each food waste measure at the occasion-, day-, and week-level. We report these correlations in Table 4.
Table 4.
Correlations between Diary-Volume and Diary-Mass Estimates at Different Levels of Aggregation.
4.3. Within-Household Variation
In Question 3, we asked how much of the variance in food waste is attributable to within-versus-between-household sources, and we computed two-level intra-class correlations to document the amount of variance at each level of analysis. As can be seen in Table 5, there was a substantial portion of variance attributable to within-household sources, meaning that food waste is an extremely dynamic outcome and varies to a great extent from day-to-day.
Table 5.
Intra-Class Correlations for Food Waste Measures.
5. Discussion
Sustainable development in our society necessitates a reduction of the amount of food wasted in households, and achieving reduction goals necessitates that household food waste be accurately measured. There are advantages and disadvantages to most household food waste measurement methods. Our study utilized several of these methods to determine the extent to which they exhibited convergent validity.
In general, we found substantial overlap across measures of food waste. In answer to Question 1, we found medium to large correlations across a measure of the subjectively estimated volume of food waste over a given week in the survey, a measure of the objectively estimated mass of food waste aggregated to the week-level, and a measure of the subjectively estimated volume of food waste aggregated to the week-level. Second, in answer to Question 2 (and Question 1), we also found that correlations changed across both the type of food being measured as well as across varying levels of analysis or time frames (i.e., occasions, days, weeks). Finally, in answer to Question 3, there was an extremely sizable variance in food waste attributable to within-person sources, indicating that household food waste is an extremely dynamic variable that needs to be studied as varying over time rather than assuming it is stable.
Although these correlations are generally smaller than benchmarks for substitutability (e.g., [37]), it must be noted that survey and diary measures of food waste were made for different weeks rather than for the same week. This temporal separation between measures may be an attenuating factor in the relationship between measures, casting the current study as a conservative test of measure convergence (i.e., compared to a test where measures are used for the same period of time). This temporal separation also minimizes the possibility of common method bias [57].
Finally, another strength of the current research design is that food waste measures are captured for the same person rather than for different groups. For example, a weaker test of convergence would involve a comparison between two separate samples, potentially comparing apples to oranges. Here, all measures of food waste are compared for the same participants, meaning that each measure is applied to the same household’s food waste situation.
In summary, although surveys and diaries and subjective reports and objective reports do not perfectly converge, our findings demonstrate that there is a substantial degree of overlap across measures of household food waste. One method may be better than another depending on the goal of the researcher or policymaker, but there is at least convergent validity across measures that can grant some confidence that the same fundamental construct is being captured regardless of the method.
However, the mean waste estimates produced by the survey-based self-report measure and the diary-based self-report measure are quite different: 7.93 cups according to the former measure and 11.39 cups according to the latter estimate. This difference indicates that, though the measures do overlap to the extent that a high-wasting household would report higher waste across any measure, the absolute level of waste changes as a function of the estimation method. These results may indicate that survey estimates wherein a person recalls how much food was wasted over a given time period produce underestimates relative to an item-by-item diary-based waste report method. Thus, it would appear that any food waste estimation method can be utilized to differentiate who wastes more or less food, but diary-based measures are superior to recall-based (survey) measures if the primary interest is in producing a precise estimate of the absolute levels of food being wasted.
Finally, the degree of convergent validity across food waste measures suggests that any measure can differentiate high- and low-wasting households, but the degree of variance in food waste over time (within-households) suggests that accuracy will be maximized by methods that align to that level of dynamism (i.e., track food waste over time). Recall-based methods (via surveys) may perform well in capturing aggregate food waste trends and representing a household’s average, but real-time methods (via daily diaries) can provide more dynamic, ecologically valid information regarding household food waste trends.
5.1. Limitations
There are several limitations to our work that must be discussed. First, as is often the case in burdensome diary research [36], it is likely that some level of selection bias is present in our study, as participation was entirely voluntary. Specifically, certain households may have been less likely to participate in this research study, meaning that our results may not be fully generalizable to all households. Furthermore, another concern in daily diary research is that the simple act of repeated measurement may exert a demand effect and result in altered response patterns relative to a normal week without measurement (e.g., [58]). These issues are endemic to intensive research designs but should be considered when interpreting findings.
Second, although the sample for this study was drawn from the nationally representative Gallup Panel, it is possible that this sample does not represent the entire population of households in the U.S. This is especially likely due to the sampling effects described in the previous paragraph. However, research has yet to determine whether individuals from certain demographics are more or less likely to participate in diary research, meaning that the extent to which this sample is not representative of certain demographics cannot be known. There are other, similar aspects that may make the present sample not fully representative. For example, as brought up by one anonymous reviewer, food waste trends (e.g., disposal, sourcing, etc.) may differ as a function of rurality, such that rural households and urban households may produce different levels and types of food waste. We cannot investigate this possibility in the current sample, as we did not capture rurality, but this is an important caveat to our findings and point of investigation for future research. In general, therefore, these findings should be cautiously interpreted when generalizing to the U.S. population, and further studies are required to test whether these relationships are consistent across other samples of varying demographics.
Third, we captured food waste over the course of one week in both the survey and in the daily diary, but it may be that household food waste for a given week was higher or lower relative to the rest of the year (see [23] for a discussion of cyclicity in diary studies). However, our study design did capture two separate weeks of food waste data, which some researchers have suggested is a sufficiently generalizable time frame for people’s general lives [59]. But future research should investigate food waste, especially on occasions when it is particularly high, such as during holidays.
Fourth, our focus on convergent validity lends itself well to investigating the relative differences between measures of household food waste, meaning that our focus is on correlations, but an argument can be made that it is also important to test for absolute differences between measures. In other words, the relative standpoint documents whether high- or low-waste households report similar levels of waste across measures, whereas the absolute standpoint documents whether waste estimates are similar across measures (see also [60]). Here, we found that households maintain similar rank-order in terms of waste when measured across methods, meaning that any measure will differentiate which households are higher or lower in waste (i.e., limited relative differences). However, the waste estimates themselves do vary across methods, meaning that there may be less overlap between measures if comparing mean estimates (i.e., absolute differences). For example, we found that reported waste was much lower according to survey-based subjective recall (M = 7.93 cups, SD = 10.34 cups) versus diary-based visual estimation (M = 11.39 cups, SD = 11.59 cups), indicating that rank-order household waste may be similar across measures (i.e., due to the medium size correlation between measures) but that overall waste estimates may be underreported via surveys.
Finally, the present work is methodological in nature, as we sought to evaluate the convergent validity across measures of food waste using two different research designs, and there are no direct theoretical or public-facing contributions to our work. This is a limitation to the scope of our work, but such contributions may be generated through future research and policy that utilizes the methodological insights provided by our work.
5.2. Future Research Directions
A key finding of our research is that specificity is key: food waste should be measured as close to the time of wasting as possible, should be measured via clearly defined categories, and should be measured over a discrete and specific period of time. In doing so, the researcher may construct an aggregate of food waste themselves, rather than relying on human recall and subjective aggregation to construct those aggregates. These steps can ensure that future research captures food waste as accurately as possible.
A second research direction is improving recall across household food waste methods. For example, although we found that survey measures overlap with diary measures, surveys still involve a number of disadvantages that need to be mitigated. Future research can explore the extent to which recall can be improved by integrating methods from diary studies. For example, researchers could integrate methods that have survey respondents engage in memory reconstruction to reduce recall bias and improve specificity [36]. In this regard, the Day Reconstruction Method seems promising for integration into the household food waste measurement literature [61], possibly allowing researchers to measure food waste for specific occasions such as breakfast, lunch, and dinner. Furthermore, pre-survey communication has been noted as a vital tool for survey research on household food waste [1]. These methods should be investigated as possibly increasing the accuracy and reliability of food waste measurement methods.
Finally, our findings suggest that there is a high degree of within-household variability in food waste over time, meaning that typically explored between-household predictors (e.g., demographics, individual differences) are only capturing a limited portion of variance in food waste. Therefore, future research should explore within-household predictors that vary over time, such as the characteristics and qualities of each wasted food item (e.g., bad smell, leftovers vs. freshly prepared meal) and even how a person is feeling (e.g., a good or bad mood). Such investigations can highlight situations and times when food waste may be at its highest or lowest, providing extremely valuable insights to policymakers above and beyond insights regarding stable, between-household variables.
6. Conclusions
In this study, we found that there is substantial convergence across measures of household food waste. These findings provide crucial insight for researchers and policymakers intending to measure and reduce food waste in American households.
Author Contributions
J.A.A.: Conceptualization, Methodology, Formal analysis, Investigation, Data curation, Writing—original draft, Writing—review and editing. A.S.: Conceptualization, Methodology, Supervision, Project Administration, Funding acquisition, Investigation, Resources, Writing—original draft, Writing—review and editing. B.A.: Conceptualization, Methodology, Project administration. G.M.: Software, Validation, Resources. H.H.: Validation, Resources. L.L.: Supervision, Funding acquisition. E.M.: Investigation, Data curation. T.D.: Validation, Investigation. All authors have read and agreed to the published version of the manuscript.
Funding
This research was funded by The MITRE Corporation Independent Research and Development Program.
Institutional Review Board Statement
The study was conducted in accordance with the Declaration of Helsinki and approved by the Institutional Review Board of Gallup (protocol code 2023-04-07 and 22 May 2023) and the Institutional Review Board of The MITRE Corporation (protocol code 2023-035 and 23 May 2023).
Informed Consent Statement
Informed consent was obtained from all subjects involved in the study.
Data Availability Statement
The data presented in this study are publicly available and can be downloaded from this site: https://sites.mitre.org/household-food-waste/study/.
Acknowledgments
The authors thank Emery Stratman, Jared Viani, Joe Hunt, Marge Britt, Alex Giyaur, Jill Petrowsky, and Dominic Tancredi for their support in the development of the daily diary mobile application. The authors thank Lance Stevens, Rebecca Dover, Ilana Ron-Levey, Kristjan Archer, Chris Miljanich, Luke Natzke, Annie Speer, Dan Foy, Jenny Marlar, and Ying Han for their feedback on the study methodology. The authors thank Jay Schnitzer, Sanith Wijesinghe, Bev Wood, Tracy Schario, Todd Porter, Beth Meinert, Frannie Lang, Matthijs Broer, and Priscila Benitez for beta testing the daily diary mobile application.
Conflicts of Interest
Authors John Aitken, Amber Sprenger, Balca Alaybek, Grace Mika, Halene Hartman, and Laura Leets were employed by The MITRE Corporation, and authors Ellyn Maese and Telli Davoodi were employed by Gallup. The authors declare that this study received funding from The MITRE Corporation’s Independent Research and Development (IR&D) Program. All authors declare that the research was conducted in the absence of any commercial or financial relationships that could be construed as a potential conflict of interest, as MITRE is a not-for-profit working in the public interest, and its IR&D program neither fits under the commercial umbrella nor has any conflicts of interest in the study’s results.
References
- van Herpen, E.; van der Lans, I. A picture says it all? The validity of photograph coding to assess household food waste. Food Qual. Prefer. 2019, 75, 71–77. [Google Scholar] [CrossRef]
- Beretta, C.; Stoessel, F.; Baier, U.; Hellweg, S. Quantifying food losses and the potential for reduction in Switzerland. Waste Manag. 2012, 33, 764–773. [Google Scholar] [CrossRef] [PubMed]
- Garrone, P.; Melacini, M.; Perego, A. Opening the black box of food waste reduction. Food Policy 2014, 46, 129–139. [Google Scholar] [CrossRef]
- Lundqvist, J.; de Fraiture, C.; Molden, D. Saving Water: From Field to Fork—Curbing Losses and Wastage in the Food Chain; SIWI Policy Brief; SIWI: Stockholm, Sweden, 2008. [Google Scholar]
- Venkat, K. The Climate Change and Economic Impacts of Food Waste in the United States. CleanMetrics Corp. 2011, 2, 431–446. [Google Scholar] [CrossRef]
- WRAP. The Food We Waste; WRAP: Banbury, UK, 2008. [Google Scholar]
- WRAP. Household Food and Drink Waste in the UK; WRAP: Banbury, UK, 2009. [Google Scholar]
- Hawken, P. Drawdown: The Most Comprehensive Plan Ever Proposed to Reverse Global Warming; Penguin Books: New York, NY, USA, 2017. [Google Scholar]
- ReFED. Food Waste: The Problem. Available online: https://refed.org/food-waste/the-problem (accessed on 10 October 2023).
- Environmental Protection Agency. Preventing Food Waste at Home. Available online: https://www.epa.gov/recycle/preventing-wasted-food-home#planning (accessed on 10 October 2023).
- United Nations Environment Programme. UNEP Food Waste Index Report 2021. 2021. Available online: https://www.unep.org/resources/report/unep-food-waste-index-report-2021 (accessed on 10 October 2023).
- United Nations. Sustainable Development Goals. 2017. Available online: http://www.un.org/sustainabledevelopment/sustainable-development-goals (accessed on 10 October 2023).
- Flanagan, K.; Robertson, K.; Hanson, C. Reducing Food Loss and Waste: Setting a Global Action Agenda. World Resources Institute. 2019. Available online: https://files.wri.org/d8/s3fs-public/reducing-food-loss-waste-global-action-agenda_1.pdf (accessed on 10 October 2023).
- Jörissne, J.; Preifer, C.; Bräutigam, K.R. Food waste generation at household level: Results of a survey among employees of two European research centers in Italy and Germany. Sustainability 2015, 7, 2695–2715. [Google Scholar] [CrossRef]
- Lipinski, B. SDG Target 12.3 on Food Loss and Waste: 2021 Progress Report; Champions 12.3: Washington, DC, USA, 2021. [Google Scholar]
- Food Loss + Waste Protocol. Overcoming Resistance to the Measurement of Food Loss and Waste. 2019. Available online: https://flwprotocol.org/wp-content/uploads/2019/12/Overcoming-resistance-to-food-loss-and-waste-measurement_2019-Dec-17.pdf (accessed on 10 October 2023).
- Elimelech, E.; Ayalon, O.; Ert, E. What gets measured gets managed: A new method of measuring household food waste. Waste Manag. 2018, 76, 68–81. [Google Scholar] [CrossRef] [PubMed]
- Boulet, M.; Hoek, A.C.; Raven, R. Towards a multi-level framework of household food waste and consumer behaviour: Untangling spaghetti soup. Appetite 2020, 156, 104856. [Google Scholar] [CrossRef]
- Bernstad, A. Household food waste separation behavior and the importance of convenience. Waste Manag. 2014, 34, 1317–1323. [Google Scholar] [CrossRef]
- Elimelech, E.; Ert, E.; Ayalon, O. Bridging the gap between self-assessments and measured household food waste: A hybrid valuation approach. Waste Manag. 2019, 95, 259–270. [Google Scholar] [CrossRef]
- Withanage, S.V.; Dias, G.M.; Habib, K. Review of household food waste quantification methods: Focus on composition analysis. J. Clean. Prod. 2020, 279, 123722. [Google Scholar] [CrossRef]
- van Herpen, E.; van der Lans, I.A.; Holthuysen, N.; Vries, M.N.-D.; Quested, T.E. Comparing wasted apples and oranges: An assessment of methods to measure household food waste. Waste Manag. 2019, 88, 71–84. [Google Scholar] [CrossRef] [PubMed]
- Beal, D.J.; Weiss, H.M. Methods of Ecological Momentary Assessment in Organizational Research. Organ. Res. Methods 2003, 6, 440–464. [Google Scholar] [CrossRef]
- Robinson, M.D.; Clore, G.L. Episodic and semantic knowledge in emotional self-report: Evidence for two judgment processes. J. Pers. Soc. Psychol. 2002, 83, 198–215. [Google Scholar] [CrossRef]
- Alaybek, B.; Dalal, R.S.; Fyffe, S.; Aitken, J.A.; Zhou, Y.; Qu, X.; Roman, A.; Baines, J.I. All’s well that ends (and peaks) well? A meta-analysis of the peak-end rule and duration neglect. Organ. Behav. Hum. Decis. Process. 2022, 170, 104149. [Google Scholar] [CrossRef]
- Gardner, B.; Tang, V. Reflecting on non-reflective action: An exploratory think-aloud study of self-report habit measures. Br. J. Health Psychol. 2013, 19, 258–273. [Google Scholar] [CrossRef] [PubMed]
- Qi, D.; Roe, B.E. Household Food Waste: Multivariate Regression and Principal Components Analyses of Awareness and Attitudes among U.S. Consumers. PLoS ONE 2016, 11, e0159250. [Google Scholar] [CrossRef] [PubMed]
- Shu, Y.; Roe, B.E.; Bender, K. Adapting, refining and expanding a validated questionnaire to measure food waste in U.S. households. MethodsX 2021, 8, 101377. [Google Scholar] [CrossRef]
- Ponis, S.T.; Papanikolaou, P.-A.; Katimertzoglou, P.; Ntalla, A.C.; Xenos, K.I. Household food waste in Greece: A questionnaire survey. J. Clean. Prod. 2017, 149, 1268–1277. [Google Scholar] [CrossRef]
- U.S. Department of Agriculture. Food Loss and Waste: The Impact of Food Waste. Available online: https://www.usda.gov/foodlossandwaste (accessed on 10 October 2023).
- Tourangeau, R.; Rips, L.J.; Rasinski, K.A. The Psychology of Survey Response; Cambridge University Press: Cambridge, UK, 2000; pp. 1–22. [Google Scholar]
- Cook, N.; Collins, J.; Goodwin, D.; Porter, J. A systematic review of food waste audit methods in hospital foodservices: Development of a consensus pathway food waste audit tool. J. Hum. Nutr. Diet. 2021, 35, 68–80. [Google Scholar] [CrossRef]
- Eisele, G.; Vachon, H.; Lafit, G.; Kuppens, P.; Houben, M.; Myin-Germeys, I.; Viechtbauer, W. The Effects of Sampling Frequency and Questionnaire Length on Perceived Burden, Compliance, and Careless Responding in Experience Sampling Data in a Student Population. Assessment 2020, 29, 136–151. [Google Scholar] [CrossRef]
- Hasselhorn, K.; Ottenstein, C.; Lischetzke, T. The effects of assessment intensity on participant burden, compliance, within-person variance, and within-person relationships in ambulatory assessment. Behav. Res. Methods 2021, 54, 1541–1558. [Google Scholar] [CrossRef]
- Scollon, C.N.; Kim-Prieto, C. Experience Sampling: Promises and Pitfalls, Strengths and Weaknesses. J. Happiness Stud. 2003, 4, 5–34. [Google Scholar] [CrossRef]
- Beal, D.J. ESM 2.0: State of the Art and Future Potential of Experience Sampling Methods in Organizational Research. Annu. Rev. Organ. Psychol. Organ. Behav. 2015, 2, 383–407. [Google Scholar] [CrossRef]
- Carlson, K.D.; Herdman, A.O. Understanding the Impact of Convergent Validity on Research Results. Organ. Res. Methods 2010, 15, 17–32. [Google Scholar] [CrossRef]
- Bommer, W.H.; Johnson, J.L.; Rich, G.A.; Podsakoff, P.M.; Mackenzie, S.B. On the Interchangeability of Objective and Subjective Measures of Employee Performance: A Meta-Analysis. Pers. Psychol. 1995, 48, 587–605. [Google Scholar] [CrossRef]
- Bolger, N.; Davis, A.; Rafaeli, E. Diary Methods: Capturing Life as it is Lived. Annu. Rev. Psychol. 2003, 54, 579–616. [Google Scholar] [CrossRef]
- Quested, T.; Marsh, E.; Stunell, D.; Parry, A. Spaghetti soup: The complex world of food waste behaviours. Resour. Conserv. Recycl. 2013, 79, 43–51. [Google Scholar] [CrossRef]
- Robinson, W.S. Ecological Correlations and the Behavior of Individuals. Am. Sociol. Rev. 1950, 15, 351. [Google Scholar] [CrossRef]
- Fleeson, W. Toward a structure- and process-integrated view of personality: Traits as density distributions of states. J. Pers. Soc. Psychol. 2001, 80, 1011–1027. [Google Scholar] [CrossRef] [PubMed]
- Sliwinski, M.J. Measurement-Burst Designs for Social Health Research. Soc. Pers. Psychol. Compass 2008, 2, 245–261. [Google Scholar] [CrossRef]
- Newman, D.B.; Schwarz, N.; Stone, A.A. Global reports of well-being overestimate aggregated daily states of well-being. J. Posit. Psychol. 2020, 16, 407–416. [Google Scholar] [CrossRef] [PubMed]
- Molenaar, P.C.; Campbell, C.G. The New Person-Specific Paradigm in Psychology. Curr. Dir. Psychol. Sci. 2009, 18, 112–117. [Google Scholar] [CrossRef]
- McCormick, B.W.; Reeves, C.J.; Downes, P.E.; Li, N.; Ilies, R. Scientific Contributions of Within-Person Research in Management: Making the Juice Worth the Squeeze. J. Manag. 2018, 46, 321–350. [Google Scholar] [CrossRef]
- Preacher, K.J.; Zyphur, M.J.; Zhang, Z. A general multilevel SEM framework for assessing multilevel mediation. Psychol. Methods 2010, 15, 209–233. [Google Scholar] [CrossRef]
- Hormuth, S.E. The sampling of experiences in situ. J. Pers. 1986, 54, 262–293. [Google Scholar] [CrossRef]
- Beal, D.J.; Weiss, H.M. The Episodic Structure of Life at Work. In A Day in the Life of a Happy Worker; Bakker, A.B., Daniels, K., Eds.; Psychology Press: London, UK, 2013; pp. 8–24. [Google Scholar]
- Nahum-Shani, I.; Smith, S.N.; Spring, B.J.; Collins, L.M.; Witkiewitz, K.; Tewari, A.; Murphy, S.A. Just-in-Time Adaptive Interventions (JITAIs) in Mobile Health: Key Components and Design Principles for Ongoing Health Behavior Support. Ann. Behav. Med. 2016, 52, 446–462. [Google Scholar] [CrossRef]
- Aitken, J.; Alaybek, B.; Hartman, H.; Leets, L.; Mika, G.; Rao, D.; Sprenger, A.; Viani, D.; Archer, K.; Davoodi, T.; et al. The State of Food Waste in America. 2023. Available online: https://sites.mitre.org/household-food-waste/ (accessed on 10 October 2023).
- U.S. Department of Agriculture. What Is MyPlate? Available online: https://www.myplate.gov/eat-healthy/what-is-myplate (accessed on 10 October 2023).
- Cohen, J. A power primer. Psychol. Bull. 1992, 112, 155–159. [Google Scholar] [CrossRef]
- R Core Team. R: A Language and Environment for Statistical Computing; R Foundation for Statistical Computing: Vienna, Austria, 2023; Available online: https://www.R-project.org/ (accessed on 7 February 2021).
- Revelle, W. Psych: Procedures for Psychological, Psychometric, and Personality Research, R Package Version 2.1.9; Northwestern University: Evanston, IL, USA, 2018; Available online: https://CRAN.R-project.org/package=psych (accessed on 1 December 2022).
- Bates, D.; Mächler, M.; Bolker, B.; Walker, S. Fitting Linear Mixed-Effects Models Using lme4. J. Stat. Softw. 2015, 67, 48. [Google Scholar] [CrossRef]
- Podsakoff, P.M.; MacKenzie, S.B.; Podsakoff, N.P. Sources of method bias in social science research and recommendations on how to control it. Annu. Rev. Psychol. 2012, 63, 539–569. [Google Scholar] [CrossRef]
- Eisele, G.; Vachon, H.; Lafit, G.; Tuyaerts, D.; Houben, M.; Kuppens, P.; Myin-Germeys, I.; Viechtbauer, W. A mixed-method investigation into measurement reactivity to the experience sampling method: The role of sampling protocol and individual characteristics. Psychol. Assess. 2023, 35, 68–81. [Google Scholar] [CrossRef]
- Wheeler, L.; Reis, H.T. Self-Recording of Everyday Life Events: Origins, Types, and Uses. J. Pers. 1991, 59, 339–354. [Google Scholar] [CrossRef]
- Mathieu, M.T.; Gosling, S.D. The accuracy or inaccuracy of affective forecasts depends on how accuracy is indexed: A meta-analysis of past studies. Psychol. Sci. 2012, 23, 161–162. [Google Scholar] [CrossRef]
- Kahneman, D.; Krueger, A.B.; Schkade, D.A.; Schwarz, N.; Stone, A.A. A Survey Method for Characterizing Daily Life Experience: The Day Reconstruction Method. Science 2004, 306, 1776–1780. [Google Scholar] [CrossRef]
Disclaimer/Publisher’s Note: The statements, opinions and data contained in all publications are solely those of the individual author(s) and contributor(s) and not of MDPI and/or the editor(s). MDPI and/or the editor(s) disclaim responsibility for any injury to people or property resulting from any ideas, methods, instructions or products referred to in the content. |
© 2024 by the authors. Licensee MDPI, Basel, Switzerland. This article is an open access article distributed under the terms and conditions of the Creative Commons Attribution (CC BY) license (https://creativecommons.org/licenses/by/4.0/).