Article

Drivers and Barriers for the Adoption of Circular Economy Principles towards Efficient Resource Utilisation

1
The Academy of Applied Technical Studies Belgrade, 11000 Belgrade, Serbia
2
Faculty of Mechanical Engineering, University of Maribor, 2000 Maribor, Slovenia
*
Author to whom correspondence should be addressed.
Sustainability 2024, 16(3), 1317; https://doi.org/10.3390/su16031317
Submission received: 12 December 2023 / Revised: 29 January 2024 / Accepted: 1 February 2024 / Published: 4 February 2024

Abstract

:
Contemporary societies, whether they have reached advanced levels of economic and social development or are still developing, need to prioritise the implementation of circular economy practices. This will facilitate the shift towards regenerative, sustainable, and closed-loop industrial systems. For now, there are some efforts to encourage patterns of production and consumption through changes in economic trends, development of institutional frameworks, harmonising regulations in the field of environmental protection, and raising the level of social awareness to achieve, above all, greater efficiency of resources. Extensive literature that deals with monitoring the implementation of the circular economy already indicates the existence of numerous barriers in this process but also notices some incentives for raising the degree of circularity of the observed systems. In this paper, the question of whether a single value can represent the level of circularity of the chosen material/product chain is researched. An overview of barriers and drivers for implementing circular economy strategies is given to structure a proper metric framework in correlation to the research question. The objective was to simplify the monitoring of circularity by developing a unique index for comparing material/product chains in similar systems. This was accomplished by using the circular material use (CMU) rate introduced in the European Union and modifying it for financial data calculation. As a result, the circular economy index, which covers all 9R strategies (CEIR), is obtained. The practical verification of model applicability was shown by determining the degree of circularity achieved for passenger cars in the four observed EU countries.

1. Introduction

One of the first scientific warnings about the environmental and climate consequences of the current growth model, which is not sustainable, was the Club of Rome’s Report, The Limits of Growth (in 1972) [1]. The current prognosis says that by 2050, the global population will reach 9 billion people, 55% of which will live in cities with at least 50,000 inhabitants [2,3]. The pressure on natural resources will be multiplied while new services and infrastructure will be needed [2,3]. The economic concept that emphasises a more rational use of resources and is a logical response to the “linear” model’s approach, with its “take, make, waste” focus, is the circular economy concept, a sustainable approach to resource management and waste reduction.
To obtain a common understanding of what it means to be “circular” in an economy, revisiting the essence of a circular economy (hereafter ‘CE’) is important, as this concept is trending and thus tends to diffuse in interpretations.
Going back to 2002, in the publication “Cradle to Cradle: Remaking the Way We Make Things”, authors Braungart and McDonough [4] advanced the notion that “eco-efficiency” is good, but that “eco-effectiveness” is better, or through the eyes of the author of “Waste to Wealth”, and “The Circular Economy Handbook”, Peter Lacy, to drive economic development and to think it is important, “doing more good”, instead of “doing less harm” [4,5]. This logical approach was incorporated by the Ellen MacArthur Foundation (hereafter ‘EMF’) in 2013, within biological and technological cycles of “the butterfly diagram”, which aims to keep products, components, and materials at their highest utilisation level and value at all times [6,7]. In the technical cycle, products are reused, repaired, remanufactured, and recycled; in the biological cycle, biodegradable materials are transformed by composting and anaerobic digestion [7]. After the butterfly diagram, the EMF developed its CE principles: “eliminate waste and pollution; circulate products and materials (at their highest value); regenerate nature” [8]. Today’s framework still correlates with these core principles, popularised within CE studies by the EMF.
Developing a modern framework for enforcing CE requires a multidisciplinary approach that incorporates the current economic, ecological, and social pillars of sustainable development. To effectively implement this concept, it is necessary to examine various factors that impact it and determine their extent and influence.
The paper aims to (1) identify the key factors that can help accelerate the establishment of circularity in the observed environment through coordinated and joint action, emphasise the significance of creating systematic indicator sets, and give propositions to measure them in a new approach; (2) analyse 9R circularity strategies in detail; (3) study and upgrade the circular material use (CMU) rate introduced in the European Union and, based on material data calculation, obtain a modified formula based on financial data; and (4) perform analysis of the proposed new equation using publicly available statistical data.

Literature Review

As the CE is an umbrella concept [9,10], different actors have distinct interpretations of what it could or should depict [10] according to the criteria based on observed system characteristics [11,12]. A deep understanding of the obstacles related to leaving the linear economy model and creative thinking about overcoming them gives a chance for a successful application of CE principles. To achieve this, it is necessary to evaluate the existing circularity metrics available for measuring circularity at the product, service, or enterprise level. Any gaps or weaknesses in each option should be identified and addressed accordingly [13].
The basic assumption within the CE concept consists of designing ways of removing waste and pollution from the economic system, avoiding poor use of materials through implementing closed material loops by recycling and remanufacturing, slowing loops by increasing the in-use lifetime of goods and products, and narrowing loops by using natural resources and goods more efficiently within the existing systems [9,14].
A meta-analysis of CE definitions, based on a detailed literature review, incorporating 221 definitions given by Kirchherr et al. [15], indicates that the foundation of CE is built on the least possible extraction of virgin materials, energy efficiency towards a low-carbon economy, economic prosperity, and social equity for current and future generations [12,15]. However, it is acknowledged that a final definition may never be agreed upon due to the constantly changing technology, environmental conditions, and socio-political and economic contexts [15].
The analysis also showed consensus on the core principles of CE, as the “reuse” and “recycle” of materials stand out within 70–80 percent of analysed articles [15].
The 3R Initiative, which first tried to promote the global reduction, reuse, and recycling of materials to build a “sound-material-cycle society” through the effective use of resources and materials, is almost two decades old [16]. By 2017, this concept was transformed into a 9R framework, which was already identified as contributing to circularity [17,18]. This framework [18,19] is designed from strategies that look at the concept of CE in a narrower or broader sense (only the technical aspect or related technical, business, economic, and social aspects). The R framework’s characteristic is the hierarchy between the involved R strategies (following the sequence R0 to R9, the priority of observed strategies is less desirable). But even today, if the circular economy studies go beyond recycling, which is still closely related to the linear economy [18], more desirable options in the waste management hierarchy are rarely part of those studies [20].
Perhaps the reason for the rare attempts to consider circularity based on higher levels of the waste management hierarchy is the very complexity of the tasks.

2. Materials and Methods

Despite increasing interest in and support for CE, global production systems remain linear [21]. This perpetuation of linearity is partly due to barriers (bottlenecks) obstructing CE transitions. According to the EMF, several factors indicate that the linear model is increasingly challenged by the context within which it operates, and that is necessary for a more profound change in the operating economy system [8]. Several obstacles need to be addressed to create a more sustainable economy. These include the current wasteful value-creation model, which results in economic and structural losses. The linear system also increases companies’ exposure to price and supply risks. Additionally, the degradation of natural systems, regulatory trends, and technological advances impact sustainability efforts. However, alternative business models are becoming more accepted, and urbanisation can provide benefits such as simpler logistics and greater appeal and scale for service providers [8].
Even with the loosening of the shackles of the linear economy, many influential factors related to existing producer–consumer relations may slow down the transition to CE. There are limited established regulations and conformity procedures for CE activities.
Since the concept’s spread, the researchers have faced challenges in identifying and addressing factors that can improve the chances of success related to implementing CE principles. Modification of supply chains and business models of small–medium enterprises, involvement of the local community or region, and legislation changes are some of the elements that can directly or indirectly impact the transition to CE. Not less important is the understanding of consumer behaviour by examining consumer perceptions of “waste” and consumer preferences for product durability. For instance, comparing the value of a product that lasts five years to one that lasts ten years can provide insights into this subject. It is also essential to explore how consumers prioritise sustainability and how it affects their willingness to pay for a product. On the other side of the production–consumption line, there is limited attention to material transformation processes and production phases, use, and end-of-life phases in product design. The concerns around achieving end-of-waste status and managing costs at the company level may also pose obstacles [22]. “The circular economy is a multi-level resource use system that stipulates the complete closure of all resource loops”, as stated within the study of CE definitions by Figge et al. [23], so every obstacle needs to be observed within wider contacts.
The literature presents different understandings of barriers according to their influence on accepting circular economic principles.
Kirchhnerr et al. (2018) found that among categories of cultural, market, regulatory, and technological, cultural barriers, such as lack of consumer interest and faltering company culture, are significant obstacles to the transition to a CE, while technological barriers have minor importance [24]. The study also noted possible chain reaction mechanisms that can lead to failure in developing an environment that supports CE (suppose the companies have to practice a CE approach in the low-cost raw material market, which can lead to consumer disinterest in CE products and reluctance by the same companies to adopt circular business models further) [24].
On the other hand, “the transactions that may be market mediated in which no transfer of ownership takes place” or, in other words [25], access-based consumption (hereafter ABS) can also influence the implementation of the CE [25]. Sopjani et al. tried to unlock these influences in different contexts, including CE, but also incorporated sharing economy, collaborative consumption, and product–service systems [26]. Arekrans et al. analysed the barriers by looking at them as hierarchical relations between consumers, businesses, and governments, where consumers require businesses and governments to create an environment that facilitates ABC, focusing on increasing understanding and enhancing user experience. At the same time, businesses need governments to provide a background to support ABC, including reducing risks and increasing incentives [27].
When considering potential factors that could encourage or prevent the implementation of CE, it is essential to be guided by the characteristics of the area where the principles of the CE are implemented.
Analysing sector-specific relationships among stakeholders can help overcome circularity implementation barriers, and the next step could be determining the protocols proposed to fit and standardise the data for further analysis of the existing system.
According to the 2018 Circularity Gap Report, the world’s circularity was 9.1% due to increased material extraction and the rise of materials in stocks [28]. It has since fallen to 7.2%, measured for 2023 [29]. The CE transition needs additional support [21].
In the concept of CE, it is essential to increase the useful lifetime of materials by reducing, reusing, recycling, and recovering them, approaches already widely accepted as the foundations of CE [11]. The goal is to keep materials and resources active in the economy for as long as possible and minimise waste [11,21].
Collaboration at an international level is vital to achieve a successful transition towards a CE [11]. Circular trade has the potential to promote a global CE, but regulatory and technical challenges hinder its progress. To advance in circular trade, it is also important to establish transparency and traceability in supply chains [30]. Transparency refers to a clear view of the supply chain, while traceability focuses on specific batch or product-level data [31]. These critical elements are necessary to avoid illegal trade practices; at the same time, establishing these approaches can facilitate border checks, and transaction costs can be reduced for importers and exporters involved in circular trade flows [30].
To comprehend the factors that hinder or promote the adoption of CE, it is also vital to develop effective policies. The process of change can be lengthy and is often met with resistance from many economic agents [11].
In general, tackling barriers to the CE is obtainable by overcoming capacity and resource limitations, securing political support, measuring circularity, and thinking circularly in a linear system (the circular transition needs to overcome the linear production approach) [32]. Scientific and professional papers dealing with the reasons for the limited application of CE are usually based on limited sample sizes, monitoring from sector to sector or business model to business model [33].
The primary challenge is that the metrics are not yet satisfactorily developed to follow the CE transformation process. One of the first issues is whether the results on the level of circularity achieved in material resource management can be simplified into a single numerical value. The goal should be to enable a more direct comparison of the realised level of circularity of systems of the same rank.
One single number should represent the circularity of material resource management within the observed system.

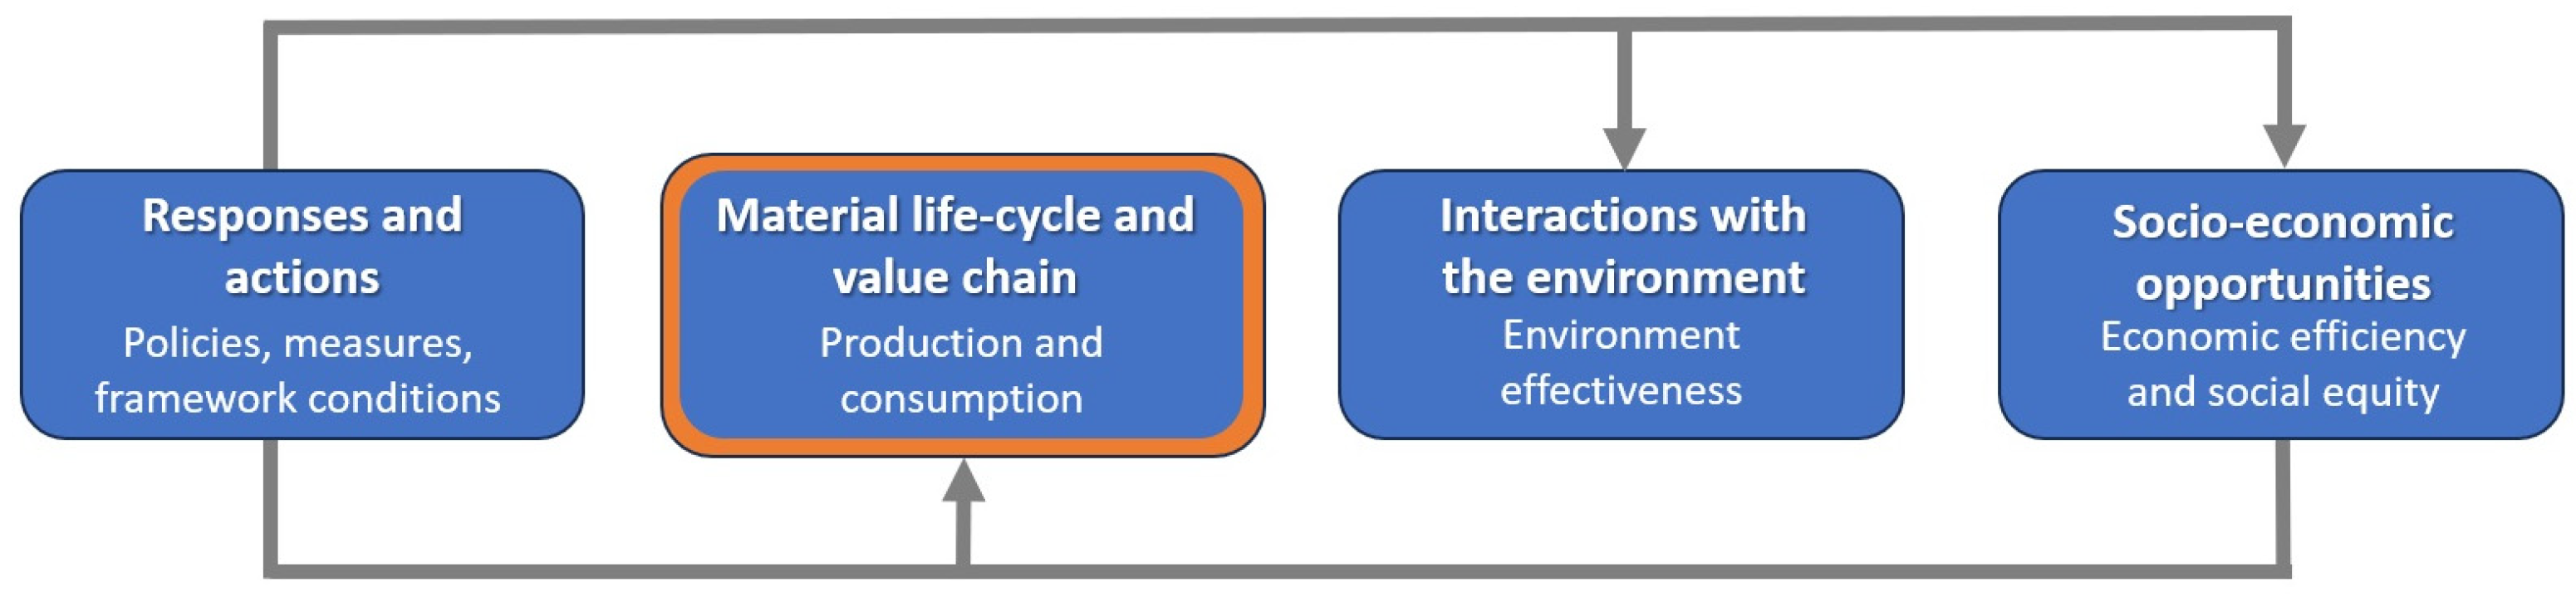
2.1. Structure of the Indicator Framework

A CE indicator is a variable (parameter) or a function of variables to provide information about circularity (technological cycles) or its effects (cause-and-effect modelling). Additionally, an indicator may result from the composite information on quantitative and qualitative data [34].
UNECE/OECD Guidelines for Measuring Circular Economy (CE), a draft document currently (2023) under discussion, gives a harmonised indicator framework based on the main principles of policy relevance, analytical soundness, and measurability; it pinpoints 23 core indicators and additional complementary and contextual indicators that are coherent with SDG indicators and Bellagio principles [17].
The new European Commission monitoring framework (2023) aims to provide a comprehensive overview by measuring the direct and indirect benefits of increasing circularity and includes 11 indicators grouped into five dimensions: I—production and consumption; II—waste management; III—secondary raw materials; IV—competitiveness and innovation; V—global sustainability and resilience [33]. These indicators are based on existing official statistics from Eurostat [33]. The classification of the proposed indicators contains sub-indicators. For example, the waste management indicator incorporates the following elements [33]:
  • Overall recycling rates: recycling rates for (a) municipal waste (%) and (b) all waste excluding major mineral waste (%);
  • Recycling rates for specific waste streams: recycling rates for (a) packaging, (b) plastic packaging waste (%), and (c) electrical and electronic equipment waste that is separately collected (%).
Furthermore, the secondary raw materials indicator includes the following [33]:
  • Contribution of recycled materials to demand for raw materials: (a) circular material use rate (%) and (b) end-of-life recycling input rates (%);
  • Trade in recyclable raw materials: (a) imports from outside the EU, (b) exports outside the EU, and intra-EU trade (all three in tonnes).
Eurostat has taken a constructive step towards promoting reporting on the CE. The organisation regularly updates its CE monitoring framework on the website [34].

2.2. Measuring Circularity

Measuring circularity through the development of circular metrics can be a powerful way to bring visibility to different elements of observed systems.
Several circularity reporting tools and metric frameworks have been developed to date. Companies across diverse sectors have begun using the ‘Circular Transition Indicators’ (CTIs) of the World Business Council for Sustainable Development (WBCSD) and the ‘Circulytics’ of the Ellen MacArthur Foundation (EMF) to benchmark their performance on circular material flows, circular revenue, water and energy circularity, and product recovery to drive internal decision making and continuous improvement, as well as ‘CIRCelligence’ by Boston Consulting Group (BCG), which helps companies become circular businesses and drive more value from fewer raw material inputs [35].
After examining the present circular metric scenarios, some critical insights can be identified:
  • Operationalising circular strategies involves various actors and activities across the value chain (from suppliers and manufacturers to service providers and reverse logistics partners). In order to identify areas for improvement, it is necessary to measure and attribute the collective and individual impacts at both the product and company levels [36].
  • Various factors directly influence circularity. These factors should be considered when measuring circular metrics. Some are servisation (i.e., provision of a service rather than ownership); digitalisation; and product design for modularity, repairability, disassembly, and reuse [36]. However, determining the appropriate boundaries for measurement can take time due to the involvement of multiple actors and factors in the value chain.
To fully capture the multidimensional nature of circularity, metric frameworks must standardise terminology and definitions, set quantifiable baselines for relative comparisons, and find practical solutions to improve data availability and quality. Maturing frameworks will require collaboration among companies and developers to develop key indicators and standardise definitions. In order to simplify processes, frameworks should enable measurement at the product group or category level.
The building blocks of the concept for monitoring the principles that need to be applied are as follows: (i) overall coverage of a CE’s main dimensions and features; (ii) identifying main aspects for which indicators are needed; (iii) a structure and indicators that could be used at different levels (multilevel monitoring) [17].
A draft version of the joint UNECE/OECD Guidelines for Measuring Circular Economy (2023) combines a CE framework with accounting principles and the pressure–state–response model for assessment and environmental reporting [17]. Components that revolve around the material lifecycle are economic production–consumption relations, environmental interactions, policy actions, and the derived socio-economic opportunities, (Figure 1). Within this framework, the block ‘Material lifecycle and value chain’ includes the materials used from production to final consumption through the R9 concept [17].
Related indicators show how materials enter the economy, flow within it, and (eventually) leave it. These indicators can be structured on the material basis and productivity of the economy, the efficiency of managing materials and waste, the circularity of material flows, including R strategies (where applicable), and the impact of trade and globalisation on the CE [17].

3. Results

The concept of a sustainable CE introduces a fresh economic model that prioritises “multidimensional progress” rather than solely focusing on GDP growth. This model seeks to improve the environment, enhance human well-being, and promote economic prosperity for present and future generations.
With this complex subject, it is evident that robust policies created by public authorities are imperative to a CE transition but that companies mostly take the circular change in pursuit of better data and rigid public policy [37]. Solid policies will only help properly guide further transition with reliable data flows.
Using circular metric frameworks is a powerful way to identify opportunities for improvement at the product or company level [38]. These frameworks provide visibility into the most significant impacts and where they occur in the value chain. Nevertheless, as even the most complex project usually depends on the success of the smallest (“the devil is in the details”—the details can sometimes cause problems), the standardisation of definitions for different fields of application of circular principles is of great importance. In a perfectly circular economy, all resource loops would be entirely closed, but due to system imperfections, some use of new resources is unavoidable [23]. It is important to add that all definitions important for the practical implementation of CE principles; for example, descriptions of secondary materials and secondary raw materials, as well as by-products and end-of-waste criteria, must be unambiguous and must not require additional interpretations to avoid unnecessary losses of raw materials in different processes resulting from misinterpretation.
A set of rules or criteria called a standard for circularity should be used to measure how circular the system is (such as a product, process, organisation, or region) [39]. Many CE indicators have already been developed [40], covering various aspects of circularity, such as material flows, waste generation, recycling rates, resource efficiency, environmental impacts, economic benefits, and social outcomes. A circularity indicator, either a quantitative or qualitative measure, is used to reflect a system’s circularity performance.
Already established metrics based on material flow should be kept in place. Additionally, circularity should be assessed through indirect metrics. It is interesting to calibrate indirect metrics of CE in areas where direct methods based on material flow are impossible.
The easiest part is to monitor the material flow, but even this part needs to be completely covered and secured in terms of accurate results. A problem is metrics that assess the CE accomplishment in areas without material flow. The authors of this work propose a metric system based on direct data already made available by statistics offices based on financial flow.
CE calculations are usually based on material volume [41]. They are maturely developed and cover material recycling very well. The European Commission introduced a framework in 2018 [33,41] to track progress towards achieving a CE, including an indicator that focuses on monitoring the progress made regarding secondary raw materials—the circular material use (CMU) rate. The CMU rate, Equation (1), is defined as the ratio of “the circular use of materials (U) to an indicator of the overall material use (M)” [41,42]:
C M U = U M
It helps track the percentage of material that has been recovered and reintroduced into the economy, therefore reducing the need to extract virgin materials.
Equation (1) has been further developed to utilise more available data from Eurostat. Thus, M has been translated using the domestic material consumption (DMC) and circular use of materials (U), Equation (2), to ensure the CMU rate does not exceed 1 (or 100%) [41]:
M = D M C + U
U has further been defined as recovery–recycling (RCV_R), with the subtraction of the amount of imported waste bound for recovery (IMPW) and the addition of the amount of exported waste bound for recovery (EXPW). The final equation, Equation (3), is as follows [41]:
C M U = U D M C + U = R C V _ R I M P W + E X P W D M C + ( R C V _ R I M P W + E X P W )
The European Environment Agency is already calculating the circular material use rate, and an analysis is available [42]. The rate of CMU is slightly increasing in the EU.
In order to also assess the circularity for non-material flows, it is proposed to transform Equation (1). After the transformation, the equation should produce the same results as those already adopted by the EU for material flows and based on available statistical data. The reason for the transformation is to be able to make the calculations based on financial data available for most CE approaches. Based on that, it is possible to produce a joint value of utilised CE approaches.
Equation (1) shall be transformed using new unknown–unrecyclable materials (NU), like in Equation (4):
N U = M U
By including this in Equation (1), Equation (5) is obtained:
C M U = M N U M = 1 N U M = 1 D M C D M C + U = 1 D M C D M C + ( R C V _ R I M P W + E X P W )
Equation (5) still produces the same results as Equation (3) and is based on the same material flow data.
In order to be able to transform Equation (5) into an equation that can be based on financial data, additional modifications and agreements must be made. The direct use of Equation (5) with financial data is problematic if materials have different market prices, which would change the CMU value. Thus, only the value of DMC should be used, and the U should be calculated as the share of DMC and multiplied by the value of DMC. If all the needed statistical data are available, then it will produce the same results. In order to obtain comparable data between more CE indicators, the majority material value should be exact, and this will produce the most accurate results when using the proposed formula. To determine the financial value of U, the following equation is proposed:
V U = U D M C · V D M C
where the following definitions hold:
V U —the financial value of recycled materials based on the domestic material consumption price V D M C and mass share of recycled materials compared to fresh domestic materials;
V D M C —the financial value of domestic material consumption.
When this is put into Equation (5), the equation based on financial data becomes
C M U = 1 V D M C V D M C + V U = 1 V D M C V D M C + U D M C · V D M C = 1 1 1 + U D M C
Equation (7) combines the financial value of material flow with material flow itself, and Equation (7) produces the same results as Equation (1) or Equation (3), which are based on material flows only. This equation allows utilising the financial values if the material flow is not known. The only limitation is the same or at least comparable price of fresh and recycled materials per mass.
This approach to switching from material flows to financial data allows calculating CE ratings and evaluating CE approaches that can only be assessed financially.
Circularity affects the economy directly and indirectly and can be assessed using indirect indicators when data are unavailable [18,43]. Having in mind the 9R CE strategies, it can be concluded that most of Rs cannot be measured through material flow. Thus, a different approach is needed.
Most, if not all Rs can be assessed financially, either directly or indirectly. The smarter product use and manufacturing strategies (R0 to R2) could be easily monitored. R0 has already been put in place not only by taxation but also by a ban in the EU, for example, on vacuum cleaners above a certain electrical motor power level. In general, circular taxation must be rethought to address transition challenges since levels of taxation alone are often insufficient to change behaviour. Rather than a product-by-product approach, circular taxation requires rethinking critical building blocks of current taxation systems [44].
The strategies (R3–R7) related to the extended lifespan of the product and its parts are reuse, repair, refurbish, remanufacture, and repurpose. The strategies sometimes overlap in real life, but the only thing important is not to include the same strategy more than once in an index calculation.
The strategies R8 and R9—beneficial use of materials—are monitored quite well by official statistics for waste treatment. To accurately track the flow of materials, improved statistics should be made to reflect the amount of waste sent to recycling or recovery and the material flow resulting from these processes. This is not the case today, and those flows need to be monitored in terms of mass or finance. All of the R strategies are shown in Table 1 with more detailed descriptions.
When combining more indicators, like in the case of 9R, they should be put on the same denominator and can be added together. This approach is only possible with the money value as a unit. All other units do not cover all principles of CE. Even with keeping track of the financial flow, some CE solutions will have to be financially assessed indirectly.
Equation (8) is based on 9R. The CEIR is designed to be between 0% and 100%. Although, in some years, due to large production and commercial or social instabilities, it can be over 100%, it does not stay at this level for longer periods. If some Rs are not applicable for the specific product calculation, they are put in the equation as 0.
C E I R % = i = 0 10 R i   P r o d u c t   t u r n o v e r   × 100
In order to include all Rs in Equation (8), it is crucial to follow the instructions on calculating the amount of money intended for each R in the past year. Only direct expenditures for the product can be included to avoid multiple circularity effects in the production value chain. Also, expenditures utilised for one R cannot be used for another R.
The Rs should be calculated as follows:
R0—Turnover with a radically different product for the same function with the addition of last year’s turnover product that was abandoned.
R1—Turnover with products designed for sharing or multi-functional use.
R2—Money saved on increased efficiency and saved natural products and materials. Also, the money is spent on secondary raw materials instead of natural materials.
R3—The “new value” of reused products.
R4—The turnover of the repair (service and spare parts). It should include authorised and unauthorised services and parts.
R5—Money saved by restoration compared to a “new product”.
R6—The volume of sales/purchase of remanufactured parts.
R7—The volume of sales/purchase of repurposed parts.
R8—The volume of sales/purchase of recycled materials.
R9—The value of recovered energy.
The “product” in Equation (8) is either a material product or service.
The proposed approach, implemented only for nine R strategies, can be broadened to complete the system.
Some areas of circularity, like the flow of materials, waste production and recycling rates, resource efficiency, environmental effects, economic advantages, and social outcomes, lack data and information and thus have to be monitored indirectly or assessed. Collecting and reporting data can be challenging, time-consuming, and expensive, particularly for small and medium-sized enterprises (SMEs) [45]; thus, a model needs to be simple, efficient, and rigid.
There is a trade-off between the simplicity and accuracy of the circularity indicators. More clear indicators may be easier to communicate and understand but may not capture circularity’s full complexity and diversity. More accurate indicators may require more data and assumptions, but they may be more challenging to communicate and understand. Ultimately, policymakers will decide on the necessary complexity of data for official measurements of CE.
Measuring circularity is currently not standardised across society or industries due to differing definitions, scopes, methods, and data sources used for circularity indicators, so it is challenging to maintain consistency, comparability, and transparency of measurement data [46]. In order to ensure that CE is adequately understood and its performance can be accurately measured, the development of new standards is imperative. These standards will harmonise the knowledge surrounding CE, making it easier for stakeholders to succeed in this field. However, organisations must also acknowledge diverse reasons for participating in the CE besides setting standards. This entails providing eco-friendly and economical options, enhancing relationships with stakeholders, optimising compliance with regulations, addressing the risks of limited resources, and advancing environmental, social, and economic sustainability while meeting human requirements.
There is a risk of unintended consequences or rebound effects of circularity. When measuring circularity, it is essential to consider the system lifecycle and its interactions with other systems. For instance, increasing the recycling rate of a material may lower its environmental impact. However, it could also raise its demand and price, resulting in more primary resource extraction.

4. Discussion

To apply the proposed Equation (8), it was decided to use the data on passenger cars in selected EU countries. Unfortunately, not all data for all states were available. The decision was still to perform calculations for one large EU country, one of the wealthiest countries of the EU, one middle-income EU country, and one below-average-income EU country. The EU countries that have been selected for further calculation are Germany, Ireland, Slovenia, and Croatia.
Most of the Rs are applicable to passenger cars. R6 (Remanufacture) and R7 (Repurpose) were not considered since both are not applicable to passenger cars on the EU market due to strict traffic rules for their use on public roads.
R0 (Refuse) is considered based on the reduced travel distance of passenger cars [47]. The years 2015 and 2020 were compared. The reduced mileage was converted to money resources using data on official mileage reimbursement in selected countries [48].
R1 (Rethink) is based on the turnover of car-sharing, taxis, ride-hailing, and car rentals in selected countries [49].
R2 (Reduce) is based on three aspects: the reduced number of new cars sold [47] multiplied by the average price of a new passenger car in the selected country [49], the number of new zero-emission passenger cars sold [47] multiplied by the average price of a new passenger car in the selected country [49], and reduced emissions of CO2 by the complete passenger car fleet [47] multiplied by the EU carbon permit price [50].
R3 (Reuse) is estimated using the number of passenger cars over 10 years old [47] and multiplied by the average price of a new passenger car in the selected country [49]. Passenger cars more than 10 years old are in most cases second-hand cars. If not, they can be considered as extended ownership and utilisation, which is also the CE approach.
R4 (Repair) is estimated using the turnover of passenger car service companies and spare parts sold. In low-income countries, service, especially on older cars, is not performed by service companies and thus is not included in unofficial statistics and can be only assessed through sales of spare parts.
R5 (Refurbish) is estimated based on passenger cars over 20 years old. Cars of such age generally need refurbishment to be safe for utilisation and in line with the legislative demands of the selected countries in the EU. The value of refurbishment is calculated by multiplying the number of passenger cars [1] by the average price of a new passenger car in the selected country [49].
R8 (Recycle) is assessed based on the hypothetical value of scrap metal sold for recycling. The value is calculated based on the mass of end-of-life vehicles [47], the share of scrap metal in cars [51], and the current market value of scrap metal in the EU [52].
R9 (Recovery) is assessed based on the hypothetical value of heat energy sold that is produced by waste-to-energy conversion of combustible parts of cars. The value is calculated based on the mass of end-of-life vehicles [47] and the share of combustible materials in cars [51], and the produced heat value is estimated as 80% of the current natural gas market price [53].
The denominator for the calculation is the value of the passenger car fleet of the selected country calculated by multiplying the number of passenger cars of the selected country [47] by the average value of a new passenger car in the selected country [49].
The calculated values of R9 are presented in Table 2.
Figure 2 shows the results of the utilisation of Equation (8) based on statistical data from several selected EU countries for passenger cars. The complete data were available for three countries; for Ireland, data on passenger cars over 20 years old are missing, and this element has not been added to the CEIR. Since the R5 for all other countries is around 10%, the total CEIR for Ireland would be also over 50% if data were available.
The results show that the most influential approaches for passenger cars are reduction, reuse, repair, and refurbishment. A comparison among the countries shows that they can be further enhanced in countries with relatively lower percentages. Some approaches like car-sharing are still developing in terms of volume but offer great opportunities.
Equation (8) for CEIR calculation is based on some assumptions that were needed to establish the financial volume of a single CE approach for passenger cars. These assumptions will be further improved, and that will make CEIR results different. But now it already is possible to compare countries, making the richest countries in comparison the worst performing.

5. Conclusions

Dwindling resources, inefficient use of energy and materials, and a growing consumer population emphasise the necessity for implementing the circular principle, which would pave the way to sustainable development and improve social well-being. In recent years, the scientific and professional community has undertaken numerous analyses to understand the introduction of circularity principles, monitor and measure the circularity progress of the new approaches, and determine the conditions that encourage, slow down, or prevent the establishment of sustainable producer–consumer relations.
The CE is a powerful concept that links resource use, waste, and emissions, integrating environmental and economic policies. Numerous definitions of the CE and various drivers and barriers observed on the way to the establishment of circularity speak in favour of the complexity of the concept.
The research results indicate the following:
  • The upgraded CMU rate formula on financial data produces the same results as the original one based on material data. This formula was the basis for the proposed CEIR equation covering all 9R strategies.
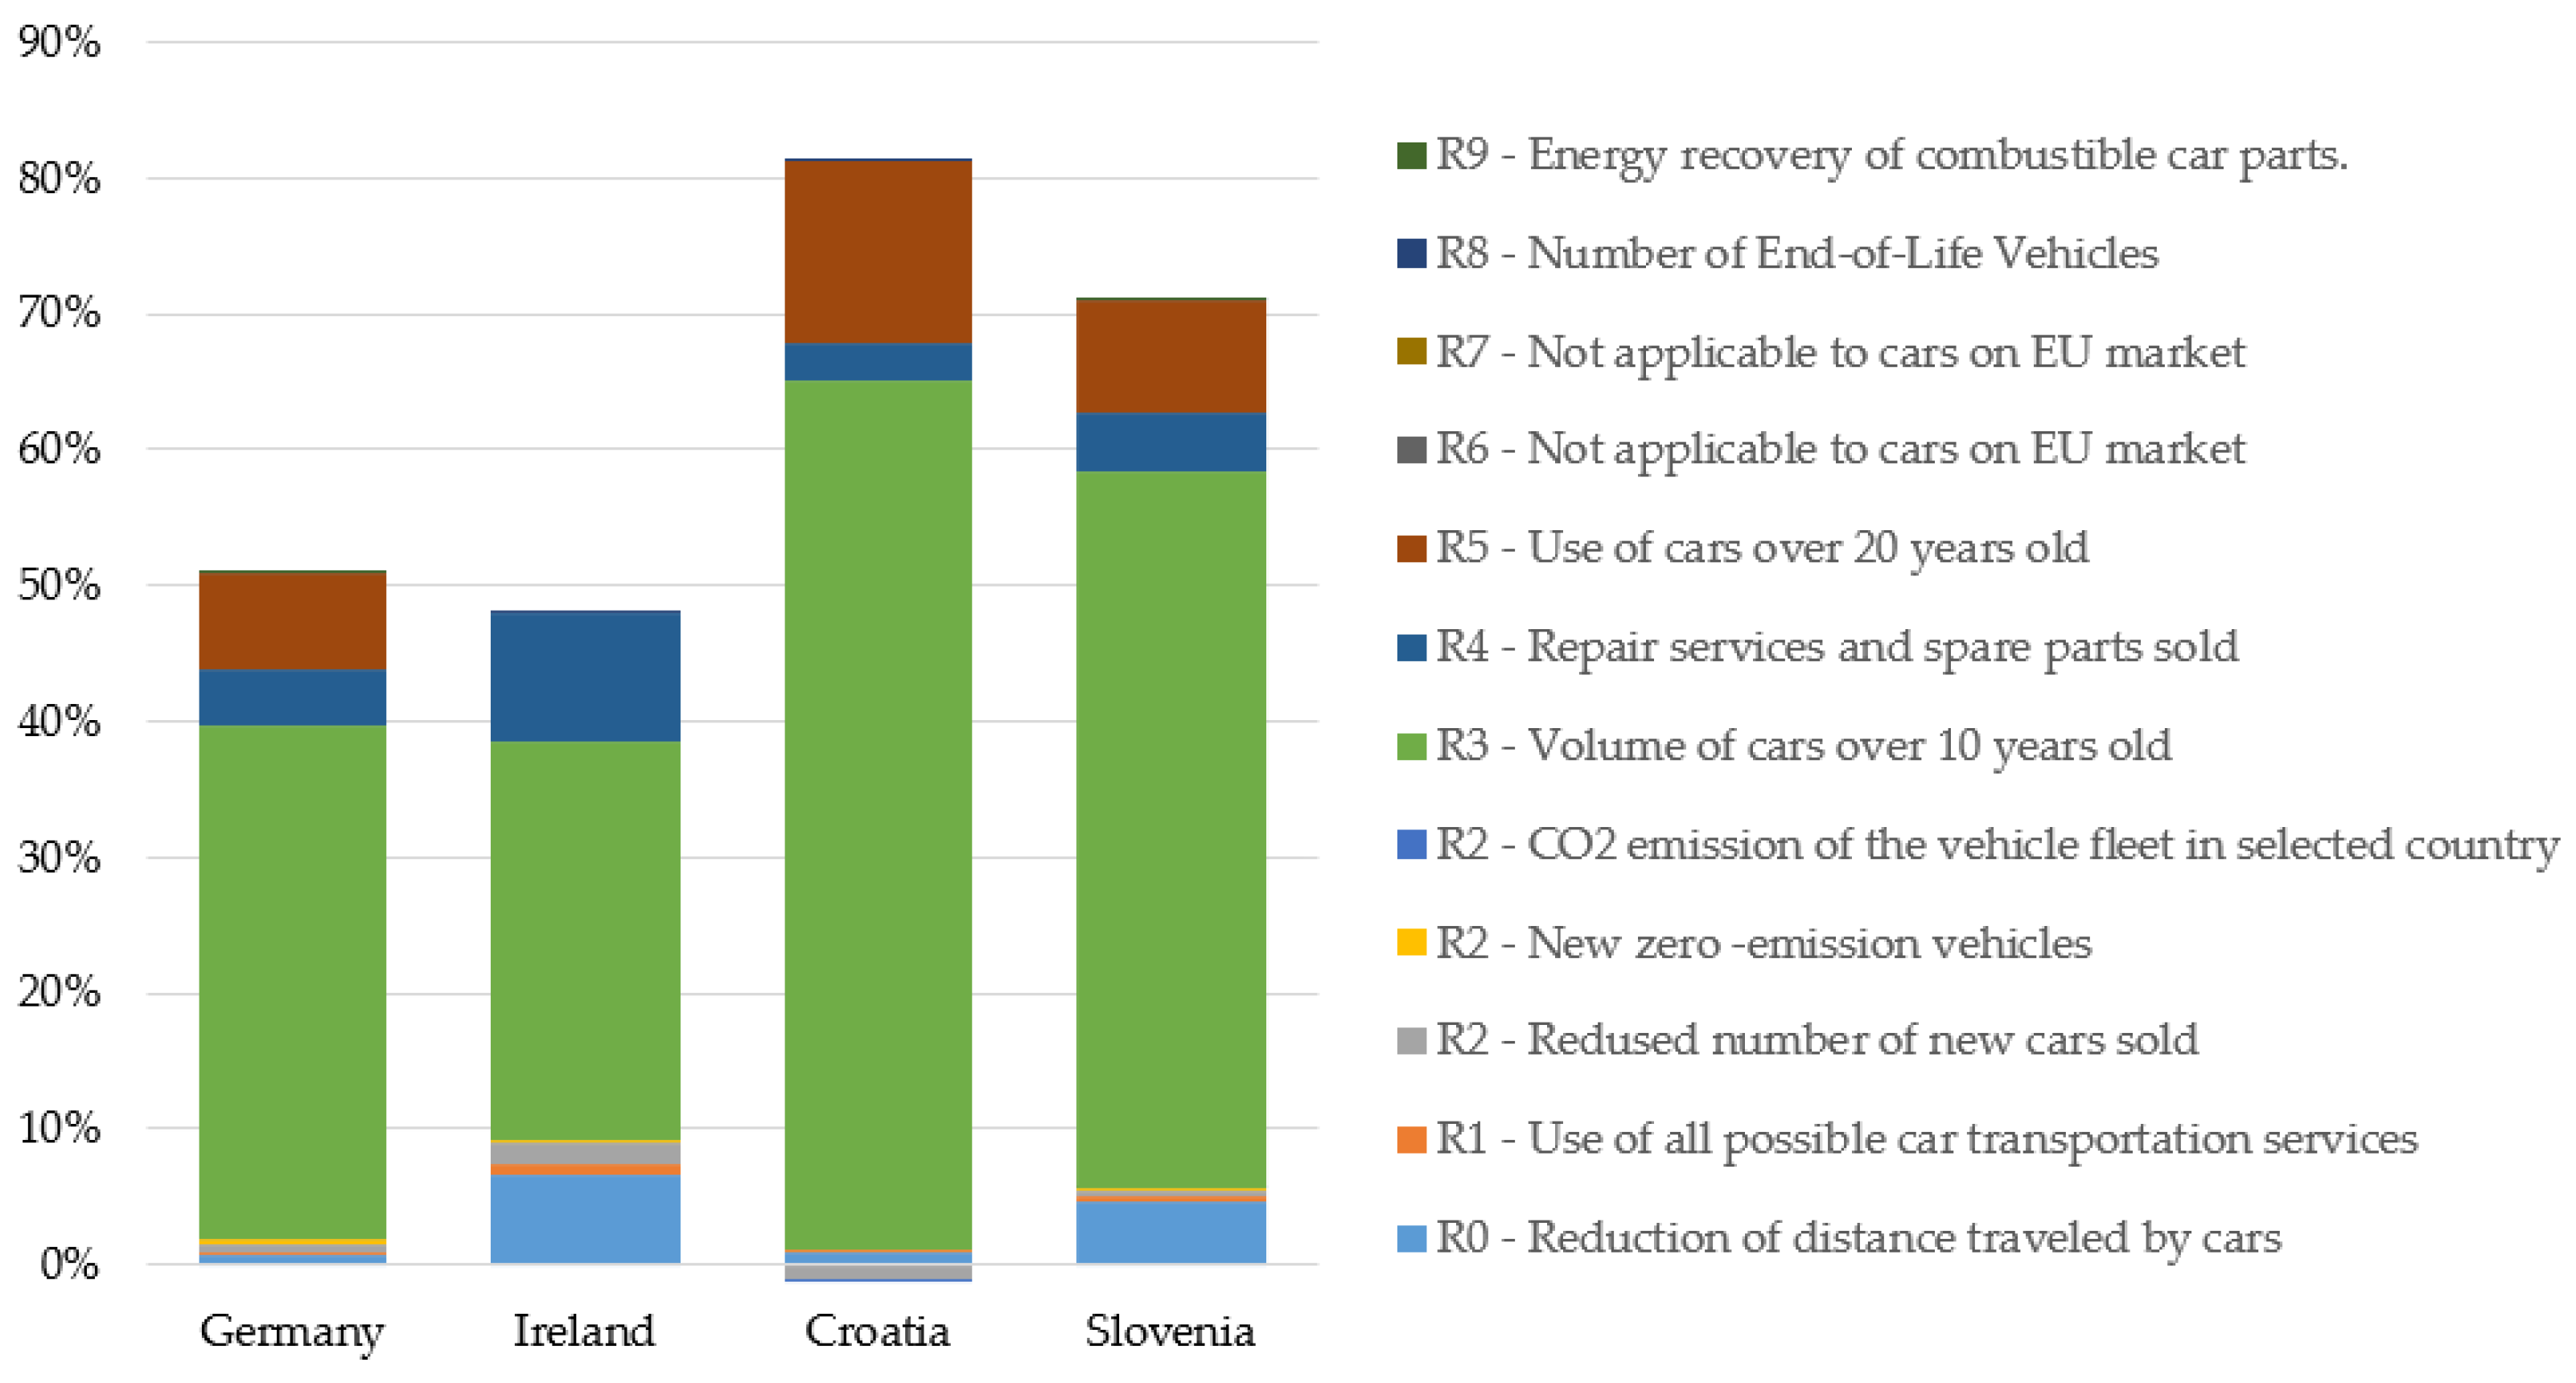
  • The proposed model for monitoring the achieved degree of circularity based on the 9R framework gives a unique output, which can be used to compare the accomplished degree of circularity of systems of the same type. The practical verification of model applicability was shown by determining the degree of circularity achieved by passenger vehicles in the four observed EU countries.
  • The proposed model equation is robust and open to various approaches. It covers products and services separately or combined, as shown in this paper.
  • The model results are best discussed by comparing the results between different products or services, always using the same methodology for every R.
Proposals that can be given after this research are as follows:
  • It is necessary to expand the existing database of statistical data in order to better support 9R calculations based on the proposed model.
  • Comparisons of calculation results should be the basis for incentives for further promotion of circular economy by individuals, society, businesses, investors, and the public sector.
  • Better tracking of the obtained level of the circularity transition for products and services on the company, municipality, or state level could lead to a faster move away from a linear economic model.
  • In general, a regulatory framework must be established to assist 9R strategies that aim to move away from traditional linear business models and to provide the necessary statistical data to measure this transition.

Author Contributions

Conceptualization, V.A.; Methodology, V.A. and F.K.; Writing—original draft, V.A. and F.K.; Writing—review & editing, V.A. and F.K. All authors have read and agreed to the published version of the manuscript.

Funding

This research received no external funding.

Institutional Review Board Statement

Not applicable.

Informed Consent Statement

Not applicable.

Data Availability Statement

Data is contained within the article.

Conflicts of Interest

The authors declare no conflicts of interest.

References

  1. European Commission. Measuring Progress towards Circular Economy in the European Union—Key Indicators for a Revised Monitoring Framework Accompanying the Document, Communication on a Revised Monitoring Framework for the Circular Economy. 2023. Available online: https://eur-lex.europa.eu/legal-content/EN/TXT/PDF/?uri=CELEX:52023DC0306 (accessed on 15 June 2023).
  2. OECD European Commission. Cities in the World: A New Perspective on Urbanisation; Report OECD Urban Studies; OECD Publishing: Paris, France, 2020; Available online: https://read.oecd.org/10.1787/d0efcbda-en?format=pdf (accessed on 15 February 2023).
  3. OECD. The Circular Economy in Cities and Regions: Synthesis Report, towards a Circular Economy: Key Drivers, Report. 2020. Available online: https://read.oecd.org/10.1787/10ac6ae4-en?format=pdf (accessed on 17 January 2023).
  4. McDonough, W.; Braungart, M. Cradle to Cradle: Remaking the Way We Make Things; North Point Press: Berkeley, CA, USA, 2002; pp. 157–187. [Google Scholar]
  5. Lacy, P.; Long, J.; Spindler, W. The Circular Economy Handbook—Realising the Circular Advantage; Palgrave Macmillan: London, UK, 2020; pp. 35–50. [Google Scholar]
  6. Lacy, P.; Rutqvist, J. The Roots of the Circular Economy. In Waste to Wealth; Palgrave Macmillan: London, UK, 2015; p. 21. [Google Scholar]
  7. Ellen MacArthur Foundation. Towards the Circular Economy Vol. 1: An Economic and Business Rationale for an Accelerated Transition. 2013. Available online: https://www.ellenmacarthurfoundation.org/towards-the-circular-economy-vol-1-an-economic-and-business-rationale-for-an (accessed on 18 January 2023).
  8. Ellen MacArthur Foundation. Towards a Circular Economy: Business Rationale for an Accelerated Transition. 2015. Available online: https://www.ellenmacarthurfoundation.org/towards-a-circular-economy-business-rationale-for-an-accelerated-transition (accessed on 18 January 2023).
  9. McCarthy, A.; Dellink, R.; Bibas, R. The Macroeconomics of the Circular Economy Transition: A Critical Review of Modelling Approaches; OECD Environment Working Papers, No. 130; OECD Publishing: Paris, France, 2018; Available online: https://www.oecd-ilibrary.org/environment/the-macroeconomics-of-the-circular-economy-transition_af983f9a-en (accessed on 18 January 2023).
  10. Blomsma, F.; Brennan, G. The emergence of circular economy: A new framing around prolonging resource productivity. J. Ind. Ecol. 2017, 21, 603–614. [Google Scholar] [CrossRef]
  11. Neves, S.A.; Marques, A.C. Drivers and barriers in the transition from a linear economy to a circular economy. J. Clean. Prod. 2022, 341, 130865. [Google Scholar] [CrossRef]
  12. Kirchherr, J.; Reike, D.; Hekkert, M. Conceptualising the circular economy: An analysis of 114 definitions. Resour. Conserv. Recycl. 2017, 127, 221–232. [Google Scholar] [CrossRef]
  13. Fassio, F.; Chirilli, C. The Circular Economy and the Food System: A Review of Principal Measuring Tools. Sustainability 2023, 15, 10179. [Google Scholar] [CrossRef]
  14. Stahel, W.R. The Utilisation Focused Service Economy: Resource Efficiency, the Greening of Industrial Ecosystems; National Academy Press: Washington, DC, USA, 1994; pp. 178–190. [Google Scholar]
  15. Kirchherr, J.; Yang, N.H.N.; Schulze-Spüntrup, F.; Heerink, M.J.; Hartley, K. Conceptualizing the Circular Economy (Revisited): An Analysis of 221 Definitions. Resour. Conserv. Recycl. 2023, 194, 107001. [Google Scholar] [CrossRef]
  16. The 3R Initiative. Available online: https://www.env.go.jp/recycle/3r/en/outline.html (accessed on 20 February 2023).
  17. UN Economic and Social Council. Joint United Nations Economic Commission for Europe/Organisation for Economic Cooperation and Development Guidelines for Measuring Circular Economy Part A: Conceptual Framework, Statistical Framework and Indicators; ECE/CES/2023/3. 2023. Available online: https://unece.org/statistics/documents/2023/04/informal-documents/joint-uneceoecd-guidelines-measuring-circular (accessed on 18 January 2023).
  18. Potting, J.; Hekkert, M.; Worrell, E.; Hanemaaijer, A. Circular Economy: Measuring Innovation in the Product Chain; Policy Report; ©PBL Netherlands Environmental Assessment Agency: The Hague, The Netherlands, 2017. [Google Scholar]
  19. Van Buren, N.; Demmers, M.; Van der Heijden, R.; Witlox, F. Towards a Circular Economy: The Role of Dutch Logistics Industries and Governments. Sustainability 2016, 8, 647. [Google Scholar] [CrossRef]
  20. Hartley, K.; Baldassarre, B.; Kirchherr, J. Circular economy as crisis response: A primer. J. Clean. Prod. 2024, 434, 140140. [Google Scholar] [CrossRef]
  21. Hartley, K.; Schülzchen, S.; Bakker, C.A.; Kirchherr, J. A policy framework for the circular economy: Lessons from the EU. J. Clean. Prod. 2023, 412, 137176. [Google Scholar] [CrossRef]
  22. Johansson, N.; Forsgren, C. Is this the end of end-of-waste? Uncovering the space between waste and products. Resour. Conserv. Recycl. 2019, 155, 104656. [Google Scholar] [CrossRef]
  23. Figge, F.; Stevenson Thorpe, A.; Gutberlet, M. Definitions of the circular economy: Circularity matters. Ecol. Econ. 2023, 208, 107823. [Google Scholar] [CrossRef]
  24. Kirchherr, J.; Piscicelli, L.; Bour, R.; Kostense-Smit, E.; Muller, J.; Huibrechtse-Truijens, A.; Hekkert, M. Barriers to the circular economy: Evidence from the European Union (EU). Ecol. Econ. 2018, 150, 264–272. [Google Scholar] [CrossRef]
  25. Bardhi, F.; Eckhardt, G.M. Access-Based Consumption: The Case of Car Sharing. J. Consum. Res. 2012, 39, 881–898. [Google Scholar] [CrossRef]
  26. Sopjani, L.; Arekrans, J.; Laurenti, R.; Ritzén, S. Unlocking the Linear Lock-In: Mapping Research on Barriers to Transition. Sustainability 2020, 12, 1034. [Google Scholar] [CrossRef]
  27. Arekrans, J.; Sopjani, L.; Laurenti, R.; Ritzén, S. Barriers to access-based consumption in the circular transition: A systematic review. Resour. Conserv. Recycl. 2022, 184, 106364. [Google Scholar] [CrossRef]
  28. Wit, M.; Hoogzaad, J.; Ramkumar, S.; Friedl, H.; Douma, A. The Circularity Gap Report: An Analysis of the Circular State of the Global Economy, Circle Economy. 2018. Available online: https://www.circularity-gap.world/2018 (accessed on 11 December 2023).
  29. Circle Economy. The Circularity Gap Report 2023; Circle Economy: Amsterdam, The Netherlands, 2023; pp. 1–64. Available online: https://www.circularity-gap.world/2023#current-state (accessed on 11 December 2023).
  30. Barrie, J.; Latifahaida, A.L.; Manuel, A.; Ieva, B.; Alexey, K.; Amelia, K.; Nanno, M.; Melissa, M.; Antoine, O.; Patrick, S. Trade for an Inclusive Circular Economy: A Framework for Collective Action; Recommendations from a Global Expert Working Group; Royal Institute of International Affairs: London, UK, 2022; Available online: https://chathamhouse.soutron.net/Portal/Public/en-GB/RecordView/Index/191157 (accessed on 11 December 2023).
  31. Deloitte. The Power of Blockchain in Revolutionising the Food Industry. Available online: https://www.deloitte.com/za/en/Industries/consumer-products/perspectives/the-power-of-blockchain-in-revolutionising-the-food-industry.html (accessed on 10 November 2023).
  32. ICLEI Europe. Circular Cities Declaration Report 2022, Report. 2022. Available online: https://circularcitiesdeclaration.eu/about/ccd-report (accessed on 5 March 2023).
  33. European Commission. A Monitoring Framework for the Circular Economy, Communication from the Commission to the European Parliament, the Council, the European Economic and Social Committee and the Committee of the Regions; European Commission: Brussels, Belgium, 2018; Available online: https://eur-lex.europa.eu/legal-content/EN/TXT/?uri=COM%3A2018%3A29%3AFIN (accessed on 5 March 2023).
  34. Eurostat. Circular Economy. Available online: https://ec.europa.eu/eurostat/web/circular-economy (accessed on 9 March 2023).
  35. BCG. Circelligence by BCG. Available online: https://www.bcg.com/zh-cn/capabilities/climate-change-sustainability/circular-economy-circelligence (accessed on 5 March 2023).
  36. CEC. Measuring Circularity for Capital Equipment—Gaps, Challenges and Recommendations for an Evolving Metrics Landscape; Metrics Whitepaper—Report, Version 1.0. 2022. Available online: https://drive.google.com/file/d/1VvW7ckX8Dp-XigGEE5iXOcTaxTZy2wnh/view?usp=sharing (accessed on 5 March 2023).
  37. Rietveld, E.; Stegeman, H.; Tukker, A.; Keijzer, E.; Hauck, M.; Poliakov, E.; Bastein, T. Following-Up on Opportunities for a Circular Economy Better Data for Robust Policy Making; Report; TNO: Den Haag, The Netherlands, 2019; TNO-2019-R11712. [Google Scholar]
  38. Circular Metrics for Business—Introduction to the Circelligence Indicators Framework. Available online: https://assets.website-files.com/ (accessed on 10 December 2023).
  39. ISO/DIS 59020; Circular Economy—Measuring and Assessing Circularity. ISO: Geneva, Switzerland, 2022. Available online: https://www.iso.org/obp/ui/en/#iso:std:iso:59020:dis:ed-1:v1:en (accessed on 5 March 2023).
  40. Jerome, A.; Helander, H.; Ljunggren, M.; Janssen, M. Mapping and testing circular economy product-level indicators: A critical review. Resour. Conserv. Recycl. 2022, 178, 106080. [Google Scholar] [CrossRef]
  41. Eurostat. Circular Material Use Rate, Calculation Method, 2018 ed.; Publications Office of the European Union: Luxembourg, 2018; Available online: https://ec.europa.eu/eurostat/documents/3859598/9407565/KS-FT-18-009-EN-N.pdf/b8efd42b-b1b8-41ea-aaa0-45e127ad2e3f?t=1543310039000 (accessed on 15 March 2023). [CrossRef]
  42. Christis, M.; Vercalsteren, A.; Nuss, P.; Campanale, R.M.; Steger, S. Analysis of the Circular Material Use Rate and the Doubling Target, ETC CE Report 2023/6, European Environment Agency, European Topic Centre on Circular Economy and Resource Use. 2023. Available online: https://www.eionet.europa.eu/etcs/etc-ce/products/etc-ce-report-2023-6-analysis-of-the-circular-material-use-rate-and-the-doubling-target (accessed on 12 May 2023).
  43. Moraga, M.; Huysveld, S.; Mathieux, F.; Blengini, G.A.; Alaerts, L.; Acker, K.V.; De Meester, S.; Dewulf, J. Circular economy indicators: What do they measure? Resour. Conserv. Recycl. 2019, 146, 452–461. [Google Scholar] [CrossRef] [PubMed]
  44. Milos, L. Towards a Circular Economy Taxation Framework: Expectations and Challenges of Implementation. Circ. Econ. Sustain. 2021, 1, 477–498. [Google Scholar] [CrossRef]
  45. The World Bank. Squaring the Circle: Policies from Europe’s Circular Economy Transition © World Bank. 2022. Available online: https://www.worldbank.org/en/region/eca/publication/squaring-circle-europe-circular-economy-transition (accessed on 3 March 2023).
  46. Vogiantzi, C.; Tserpes, K. On the Definition, Assessment, and Enhancement of Circular Economy across Various Industrial Sectors: A Literature Review and Recent Findings. Sustainability 2023, 15, 16532. [Google Scholar] [CrossRef]
  47. Eurostat. Data Browser. Available online: https://ec.europa.eu/eurostat/databrowser/explore/all/all_themes (accessed on 9 January 2024).
  48. EuroDev. Mileage Reimbursement in Europe. Available online: https://www.eurodev.com/blog/mileage-reimbursement-in-europe (accessed on 12 January 2024).
  49. Statista. Available online: https://www.statista.com/ (accessed on 9 January 2024).
  50. Trading Economics. Available online: https://tradingeconomics.com/commodity/carbon (accessed on 15 January 2024).
  51. Petronijević, V.; Đorđević, A.; Stefanović, M.; Arsovski, S.; Krivokapić, Z.; Mišić, M. Energy Recovery through End-of-Life Vehicles Recycling in Developing Countries. Sustainability 2020, 12, 8764. [Google Scholar] [CrossRef]
  52. Schrott24. Available online: https://en.schrott24.de/scrap-prices/ (accessed on 15 January 2024).
  53. Central European Gas Hub AG. Market Data. Available online: https://www.cegh.at/en/exchange-market/market-data/ (accessed on 15 January 2024).
Figure 1. Conceptual framework—building blocks (adapted from [17]).
Sustainability 16 01317 g001
Figure 2. Chart of circular economy index for passenger cars in selected EU countries.
Sustainability 16 01317 g002
Table 1. Monitoring options for the circularity of a product and its parts using the 9R framework.
StrategyDescription
R0
Refuse
Can be assessed by monitoring through the tax policy for redundant products.
R1
Rethink
It can be assessed by monitoring a specific number of items sold per capita and the volume of services provided.
R2
Reduce
It can be estimated by tracking individual consumption through all production sectors.
R3
Reuse
This is already monitored by volume in mass, but it could also be monitored in terms of new items sold per capita and GDP. Some reuse bypasses the waste management system and thus is not recorded by weight in a waste management system. This is especially true in low-income societies. Thus, it is indirectly seen in the reduced purchase of new items.
R4
Repair
It should be measured through the number of repair services and the financial flow of those services. Additionally, the sale of spare parts must be monitored in low-income countries, keeping in mind that people sometimes repair for themselves outside an official system that is included in state statistics. Repair is also indirectly visible through extended utilisation of products—the average age of products in use.
R5
Refurbish
This strategy is quite similar to R4 and can be monitored similarly. Refurbishment or its quality could be monitored through new specific consumption of refurbished items. Not all sectors can be monitored to differentiate between repair and refurbishment, but CE strategies consider both. If metrics include both, there is no need to differentiate between R4 and R5.
R6
Remanufacture
This should be monitored through separate statistics that would have to be reported to the state statistics office. Maybe the state should change the VAT to a reduced level for remanufactured products, making them more desired and easily monitored. However, remanufacture should mean that most of the product in the material sense (mass) should consist of old parts or products.
R7
Repurpose
This strategy can be monitored the same way as proposed for R6, except the amount of all parts or products included in a new product should be set at lower levels.
R8
Recycle
Material recycling is monitored, and statistical data are available.
R9
Recover
Energy recovery of nonrecyclable materials with high calorific value is covered by statistical data on refuse-derived fuels.
Table 2. Results of calculated Rs in EUR million for circular economy index (CEIR) for passenger cars in selected EU countries.
R No.MeasureMeasure DescriptionGermanyIrelandCroatiaSloveniaRemark
R0RefuseReduction in distance travelled by cars12,893.914673.20440.481405.89Based on the difference between the years 2015 and 2020
R1RethinkUse of all possible car transportation services5616.10529.8074.3877.65Turnover of car-sharing, taxis, ride-hailing and car rentals
R2ReduceReduced number of new cars sold8874.401123.11−459.39156.76Based on the difference between the years 2015 and 2020
R2ReduceNew zero-emission passenger cars 7293.55124.2713.4243.30Value of new zero-emission passenger cars based on the average price of new cars in the selected country
R2ReduceCO2 emission of the vehicle fleet in a selected country93.9810.03−1.272.48Hypothetical value of the saved amount of money based on the difference between 2015 and 2020 fleet CO2 emissions and the EU carbon permit price
R3ReuseVolume of cars over 10 years old684,582.9420,485.9328,098.9315,554.31Value of cars over 10 years old calculated by the number of vehicles over 10 years old and multiplied by the average price of new cars in the selected country
R4RepairRepair services and spare parts sold74,170.806532.301183.101269.80Turnover of car service companies and sale of spare car parts
R5RefurbishUse of cars over 20 years old129,846.46-5933.052398.77Cars over 20 years old already need refurbishing to be safe and street-legal today. Value of cars over 20 years old calculated by the number of vehicles over 20 years old and multiplied by the average price of new cars in the selected country
R6RemanufactureNot applicable to cars in the EU market0.000.000.000.00Remanufacturing cars is not possible due to strict EU legislation for cars to be used on public roads
R7RepurposeNot applicable to cars in the EU market0.000.000.000.00The possibilities to repurpose cars or car parts are relatively small in the EU and cannot be assessed based on statistics available
R8RecycleNumber of end-of-life vehicles93.0726.194.331.48Hypothetical value of scrap metal sold for recycling
R9RecoveryEnergy recovery of combustible car parts4.740.000.000.06Hypothetical value of heat energy sold generated with combustible car parts in waste-to-energy plants
9R Total923,469.9633,504.8435,287.0220,910.50
Denominator 1,809,514.8969,892.7143,964.4729,473.29
CEIR [%]51.0347.9480.2670.95
Disclaimer/Publisher’s Note: The statements, opinions and data contained in all publications are solely those of the individual author(s) and contributor(s) and not of MDPI and/or the editor(s). MDPI and/or the editor(s) disclaim responsibility for any injury to people or property resulting from any ideas, methods, instructions or products referred to in the content.

