Abstract
Suwon, the capital and largest city of Gyeonggi-do, South Korea, was designated as a non-point source management area in 2010. The management period ended in 2020, so follow-up measures are needed. In this study, we investigated several projects implemented in Suwon for urban water cycle improvement and non-point source pollution reduction, and the long-term management effects were analyzed to suggest policy directions such as the revision of designation notices. During the 10-year management period in Suwon, the population and lot area continued to increase, and the non-point source-based annual Biochemical Oxygen Demand (BOD) discharge loads also increased by approximately 25% at the half sub-basins Hwangguji-cheon and Woncheonri-cheon in 2020 compared to 2010. Even under these conditions, statistical analyses show that the Biochemical Oxygen Demand (BOD) and Total Phosphorus (TP) concentrations monitored at the outlet of basin were decreased due to the promotion of a large-scale sewer management project as well as non-point source pollution reduction projects. Also, the field monitoring data-based Load Duration Curve (LDC) analysis results indicate that the loads decreased in the high-flow period of 2020 compared to 2015. Also, the Normalized Difference Vegetation Index (NDVI) values calculated using satellite images since 2017 tended to increase slightly during the period when the impervious area estimated using the land registration map increased. It is assumed that using the current calculation method for impervious areas has limitations regarding its ability to reflect changes in the small-scale Low-Impact Development (LID) facility and in ecological/landscape areas. On the other hand, the annual variation in direct runoff estimated at the outlet using three hydrograph separation methods did not show any improvement with regard to storm water retention during the management period. These results reveal that the effects on urban water cycle improvement, such as peak flow reduction and base flow increase, may not be noticeable despite some progress in reducing non-point source pollution and increasing green area. Therefore, additional efforts directed towards non-point source pollution management focused on water cycle improvement are required in the city, especially in the sub-basins with higher pollution loads such as Hwangguji-cheon and Seoho-cheon.
1. Introduction
The impervious area in Korea represented only 3% in 1970, but it increased by 2.63 times to 7.9% in 2012 [1]. It distorts the water cycle system, thereby causing urban flooding during heavy rainfall due to the increase in peak discharge, groundwater and streamflow depletion due to reduced infiltration, and environmental problems due to increased non-point pollutant emissions, including river pollution, mass fish deaths, and urban heat islands [2,3,4]. Impervious area management and non-point source improvement are also important for the response to abnormal climates, which have frequently occurred recently.
In Korea, the low-impact development (LID) technique has been applied to impervious surfaces for water cycle improvement since 2012 [5]. With the revision of the Water Environment Conservation Act in 2018, national water cycle management goals were set in the comprehensive measures for non-point source management so that the implementation details could be inspected [2].
In previous studies, the runoff reduction effect [6,7,8] of applying the LID technique to cities for water cycle improvement was analyzed through rainfall monitoring before and after the application, and the runoff improvement effect was analyzed using watershed models [9,10,11,12].
For water cycle improvement, however, research on watershed-oriented non-point source reduction and water cycle improvement for the discharge and water quality released from watersheds to rivers is required, in addition to research on runoff reduction for the drainage area with facilities. To this end, the LID element technology must be applied first to areas in need of non-point source reduction and water cycle improvement.
To improve the water cycle of urban non-point sources, Suwon City was selected as the target area in this study. The city was designated as an area that requires non-point source management in 2009, and has a population of approximately 1.1 million. The non-point source management area designation system, which has been implemented since 2007, is a policy to designate and manage areas where the rainfall runoff caused by non-point sources has caused or is likely to cause serious hazards to rivers, lakes, humans, or natural ecosystems [13,14,15]. One out of four cities was designated when the system was first introduced, but 8 (approximately 31%) out of 23 areas were designated as urban areas with a high impervious area ratio and managed for non-point sources in 2023.
Suwon City was recognized as an area in need of non-point source management and designated as the fifth non-point source management area because the ratio of the Biochemical Oxygen Demand (BOD) non-point source emission load was as high as 62.8% and the three-year average (2007 to 2009) BOD and Chemical Oxygen Demand (COD) concentrations at the end of the watershed (14.6 and 15.8 mg/L, respectively) exceeded the target water quality (normal) BOD of 5 mg/L or less for the corresponding central region. The city’s non-point source management goal was set to reduce the ratio of the pollutants emitted from non-point sources (based on BOD) to pollutant emissions to 52.4% or less by 2020 or reduce emissions by 250 tons/year compared to 2009 [16].
Measures to reduce non-point sources and improve the water cycle were planned and implemented to achieve the management goal, and non-point management plans were applied to three watersheds where non-point sources, including runoff, may occur [16]. For the management period of the last ten years (2010 to 2020), it is possible to evaluate the management measures and effects of the project for non-point source reduction and water cycle improvement. Effect analysis techniques include calculation through numerical modeling, spatial information analysis, and the convergence of remote sensing data and artificial intelligence technology [17,18,19,20,21]. The use of numerical models, such as watershed models, makes it possible to quantitatively simulate discharge and water quality changes before and after LID and GI application [22,23,24]. The water cycle improvement effect can be evaluated through the analysis of spatial information, such as cadastral maps and land use maps. Recently, studies have been conducted to comprehensively analyze the changes in green areas extracted from satellite images and the effects of the LID project on discharge and water quality [17,18,19,20,21]. With the development of science and technology as well as the expansion of data productivity, studies on the analysis of impervious areas have been conducted using satellite images, such as Landsat [25,26] and Sentinel [27,28], and machine learning.
Therefore, in this study, Suwon City was selected as the target area to investigate the status of the watershed before and after being designated as a management area (e.g., pollution sources, water quality, and impervious area), investigate the management measures performed to improve non-point sources and the water cycle, present improvement effects using statistics, satellite images, and modeling methods based on long-term monitoring data, and evaluate non-point source management and water cycle effects for future non-point source management in the city.
2. Research Contents and Methods
2.1. Target Area
Suwon City, with an area of 141.0 km2, was designated as a non-point source management area in 2010. The city consists of four streams (Hwangguji, Suwon, Seoho, and Woncheonli Streams), as shown in Figure 1. Figure 1 with left is an area designated as a non-point source management area, and Figure 1 with right is Suwon-city, the area subject to the management described in this study. Suwon city lies on the Han River with the Daekwon Station, and its administrative district is included in Gyeonggi-do. The city’s population had increased by 11.2% in 2020 compared to 2009, and the land area also shows a linearly increasing tendency. The land area in 2020 was 59.37 km2. It represented approximately 49% of the total area, indicating an approximately 16.8% increase compared to 49.44 km2 in 2009. Suwon City has the characteristics of urban areas that require continuous management due to the rapid discharge of non-point sources during rainfall. The period for non-point source reduction was ten years from 2010 to 2020, and BOD was designated as the main management target during rainfall [16].
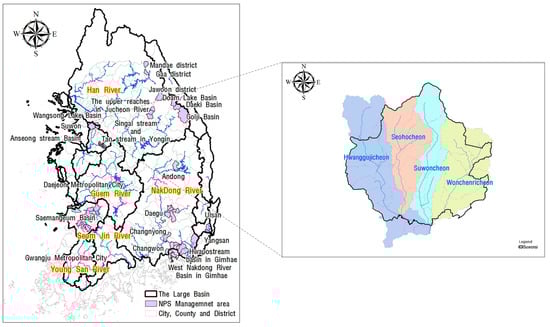
Figure 1.
Target area.
2.2. Analysis of Non-point Source Reduction and Water Cycle Improvement Effects
The watershed status of the target area and the performance of the non-point source and water cycle management were investigated. The non-point source improvement and water cycle effects of the target area were analyzed by investigating ten-year (2010 to 2020) data [29,30,31,32,33] and using a model. In addition, the trends in policy effect analysis research that has used long-term monitoring data [34,35], satellite images (e.g., Landsat [5,26] and Sentinel [27,28]), and machine learning were analyzed and utilized for research (Figure 2).
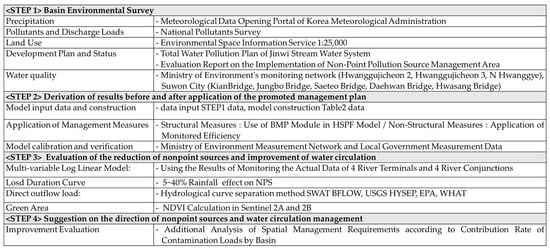
Figure 2.
Method used for analysis of non-point source reduction and water cycle improvement effects.
2.2.1. Status Survey for the Target Area
To analyze the rainfall runoff of the target area, weather data (e.g., total rainfall) were surveyed using the weather data open portal. As for pollution sources and emission loads, yearly characteristics were presented using the national pollution source survey data [30]. In particular, the land use map was analyzed using the Environmental Spatial Information Service 1:25,000 data for urban non-point source management [31]. The land use map analysis was presented using ArcMap 10.7.1. Based on this, the impervious area, including the land area, was presented. Since the impervious area varies depending on the regional development plan, the Jinwicheon water system total maximum daily load (TMDL) plan and the non-point source management area evaluation report [33] were referred to for the annual development plan [32] and status. All of the monitoring network of the Ministry of Environment (ME) [34] and local government data were used [35] to examine the water quality trends in the watershed, and the water quality trends of Suwon City were analyzed using the water quality measurement data of the four streams in the city.
2.2.2. Analysis of Non-Point Source Reduction and Water Cycle Improvement Effects Using a Model (HSPF)
To analyze the improvement effect for the non-point source management of Suwon City, topography and weather data were collected (Table 1) and the HSPF model was constructed, as shown in Figure 3 [35]. The numbers shown in the Figure 3 are the watersheds separated by the use of the model and are the sub-basin numbers used in this study. The runoff and the pollution loads of BOD and Total Phosphorus (TP) were simulated for each space by reflecting the implemented structural and non-structural management measures. The improvement effect was analyzed through the analysis of scenarios using the BMP module. To this end, structural measures were reflected using the BMP module, and the previously applied efficiency [36] was applied for road cleaning and eco-friendly fertilizers among the non-structural measures.

Table 1.
Watershed model (HSPF) input data.
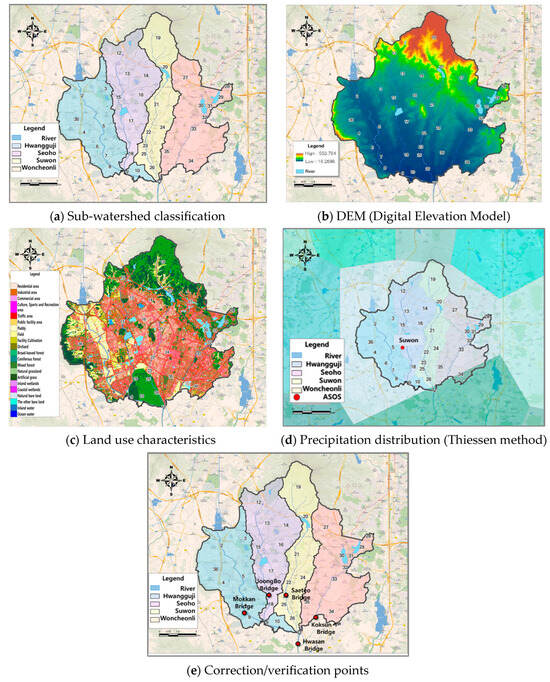
Figure 3.
Input data and configuration of the Suwon City watershed model (Hydrological Simulation Program Fortran, HSPF).
The correction and verification of the model were performed based on the discharge at the N-Hwanggye point in the non-point source monitoring network at the end of Suwon City as well as the water level/discharge data and rainfall monitoring results [35] at the Hwasan bridge point. The discharge data at the N-Hwanggye point from May to December 2020 were used for discharge correction, and the discharge was corrected using the water level and the discharge data at the Hwasan bridge point from 2015 to 2020 [34]. The water quality was verified and corrected using the water quality data of a water quality monitoring network (Hwangguji Stream 3) and local government measurement points (Gian, Jungbo, Saeteo, Daehwang, and Hwasan bridges) from 2015 to 2020. Based on these results [35], research was conducted on the non-point source improvement effect of Suwon City.
All measures that can be quantified by the model were reflected, and the reduction efficiency of the device type, natural type, artificial wetland, and LID was applied to the efficiency of the model BMP according to the manual. Efficiency was applied to the non-structural measures using previously studied results according to the area promoted [37]. The area and facility capacity promoted are shown in Table 2. The project was presented by dividing it into structural and non-structural projects.
Table 2.
Application method for management plan.
From the results of the corrected model, daily flow data during the management period were extracted at the Giang Bridge point in Hwangguji Stream, Jungbo Bridge point in Seoho Stream, Saeto Bridge point in Suwon Stream, Daehwan Bridge point in Woncheon Stream, and Hwasan Bridge point at the end of the basin. These results were evaluated for the degree of non-point pollution source reduction and water circulation improvement through a total of four analyses, including a multivariate log linear model, load duration curve, direct outflow load, and satellite.
2.2.3. Analysis of Non-Point Source Improvement Effects through Statistics and Image Analysis
Since changes in river water quality and discharge are affected by watershed management effects (e.g., non-point source reduction) as well as seasonal and temporal impacts, such influence factors must be divided for evaluation [38]. In this study, the factors that affect water quality were analyzed using the multivariate log-linear model. The log-linear model has been widely used by the US Geological Survey (USGS) and the US Environmental Protection Agency (USEPA) for long-term water quality and load evaluation [39]. The log-linear model is a multivariate regression analysis formula. If the F-test result is statistically significant, it means that the water quality concentration is affected by time (β3) and discharge (β1). For example, when the time coefficient has a statistically significant negative value, a reduction in water quality concentration as a result of implementing various water quality improvement projects is evaluated. In this study, the log-linear model was applied to the four streams that flow through Suwon City to evaluate the water quality improvement effect.
where C = water quality concentration, Q = discharge (CMS), T = time (Year), Q, T = centering variable for discharge and time, β1∼β2 = discharge regression coefficients, β3∼β4 = time regression coefficients, β5∼β6 = seasonal regression coefficients, and ε = error.
For the evaluation of the non-point source improvement effect, the load change for each discharge section was analyzed using the load duration curve (LDC) technique at the Hwasan bridge point where the four streams join. In particular, the pollution load change in the discharge section (5 to 40%) affected by rainfall is significantly related to the evaluation of the non-point source improvement effect [40]. Finally, the changes in direct runoff and green areas caused by impervious area management, including LID, were analyzed. The hydrological curve separation for direct runoff calculation used the web-based SWAT BFLOWS [41], USGS HYSEP [42], and EPA WHAT [43] methods. To calculate the time-series green area, the Normalized Difference Vegetation Index (NDVI) [44,45,46] of Sentinel 2A&2B of the European Space Agency, which has been captured since 2017, was used. The 8 spatial resolution of Band2 used for NDVI calculation is 10 m. The utilization cycle is 5 to 10 days and up to 6 images per month can be obtained. After calculating 75 NDVIs from April to October considering the growth period of plants, the change in green area was analyzed using the monthly maximum values (Figure 4).
Figure 4.
NDVI calculation using Sentinel satellite images.
The satellite used to calculate the vegetation index in this paper is the Sentinel-2 optical satellite operated by the ESA (European Space Agency). Optical satellite refers to multispectral remote sensing. Spectroscopy refers to the division of light into bands of various colors depending on the difference in wavelength. Figure 4 shows the order of calculating the NDVI in Suwon City as (a) to (c). After downloading the Sentinel 2A and 2B satellite images, Band 2 (Red) and Band 8 (NIR) band areas were used to calculate the vegetation index (NDVI). The formula used is as follows.
NDVI = (NIR − RED)/(NIR + RED)
Band 2 (Red) and Band 8 (NIR)
Band 2 (Red) and Band 8 (NIR)
As shown in Figure 4, the NDVI index of Suwon City was derived.
2.3. Presentation of Directions for Non-Point Source and Water Cycle Management
To evaluate the non-point source and impervious area management effects according to the watershed using measurement data, the results analyzed through long-term monitoring data were comprehensively presented. Changes in key indicators, such as water quality, discharge, and green area, were analyzed according to the pollution source and load trends of the target area, as well as the management project contents. In addition, follow-up measures for the areas at the end of the management period were proposed according to the water quality by stream, a comparison with nearby watersheds, whether the middle area target is exceeded, and the concentration change during rainfall. Proper management areas were presented by further analyzing the required spatial management range according to the pollution load contribution rate of each watershed, and future considerations were presented for evaluating urban non-point source management areas and water cycle policies.
3. Research Results and Discussion
3.1. Analysis of the Watershed Status in the Target Area
3.1.1. Weather Characteristics
Non-point sources refer to pollution sources that occur in unspecified places during rainfall, and precipitation is a major consideration for non-point source analysis. The Precipitation ASOS (Automatic Synoptic Observing Station) meteorological observatory data from the Meteorological Data Open Portal accessed on 31 December 2020 (www.data.kma.go.kr) were used. ASOS refers to the spatial size and lifespan of the normal, high or low pressure expressed in weather maps. It mainly refers to daily weather phenomena and ground observations conducted at the same time at all observatories. Since the subject of this study is Suwon-si, Gyeonggi-do, the annual precipitation from 2000 to 2020 was analyzed at the “Suwon” observatory located in Gwonseon-gu, Suwon-si, Gyeonggi-do, among ASOS. Figure 5a presents the total rainfall by year from 2000 to 2020. In addition, the standard deviation of the average value of total rainfall over 20 years is presented. It shows that the largest standard deviation was found for the 2011 average. Figure 5b is divided into rainy and dry seasons, and the total rainfall by year from 2000 to 2020 is presented. In addition, standard deviations are presented for the average value of each total rainfall in the rainy and dry seasons. In the case of the rainy season, the average standard deviation is the largest in 2015, and in the case of the dry season, the standard deviation is the largest in 2011.
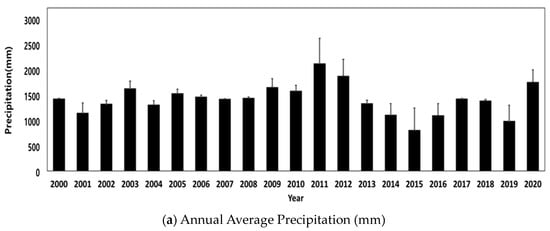
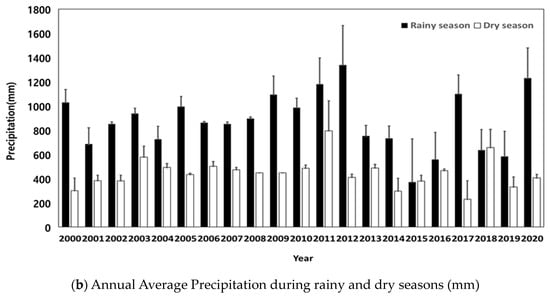
Figure 5.
Changes in precipitation by year in Suwon.
Suwon City performed intensive non-point source management from 2015 to 2020. During the period, the annual precipitation was lowest (751.1 mm) in 2015 and highest (1975 mm) in 2011. There was no significant difference in the average precipitation compared to the period (2000 to 2010) immediately before the management period. The annual and rainy season (July to October) precipitations slightly decreased compared to the previous ten years, but the dry season precipitation showed a tendency to slightly increase. It is noteworthy that the difference in precipitation by year during the management period (2011 to 2020) was generally large compared to the period between 2000 and 2010, as shown in Figure 5.
3.1.2. Pollution Source and Land Use Characteristics
Among the factors affecting the pollution load, the population and land area tended to continuously increase. Figure 6a shows the population data. Suwon City’s population had increased by 11.2% in 2020 compared to 2009, and the land area also showed a linearly increasing tendency. The land area in 2020 was 59.37 km2. It represented approximately 49% of the total area, which was approximately 16.8% higher compared to 2009 (49.44 km2). On the other hand, the number of livestock heads tended to decrease despite some large annual fluctuations. The areas of farmland and forests decreased by 35.7 and 15.3%, respectively, as shown in Figure 6b.
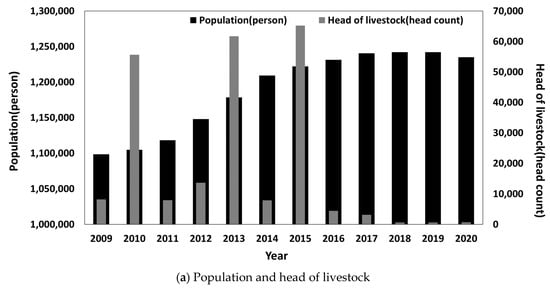
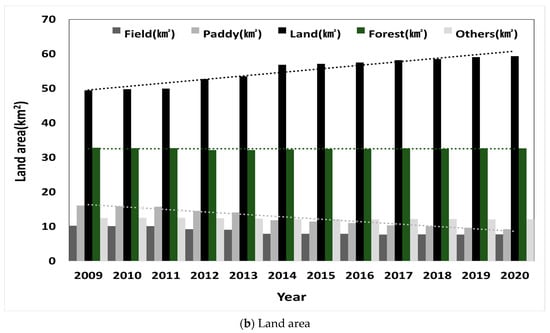
Figure 6.
Changes in population and land area in Suwon.
Figure 7 shows the topography and land use characteristics of Suwon City. The average elevation is 5.7 m above sea level, and approximately 67.3% of the total area shows flat terrain characteristics with a slope of 0 to 5 degrees. In addition, a large land area is located in the center of the city, causing concerns over the non-point pollution caused by urbanization [47,48].
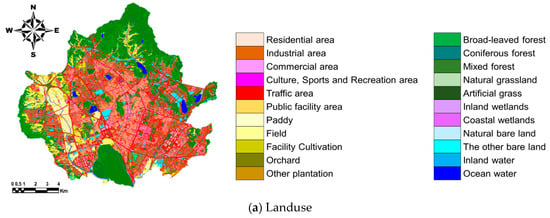
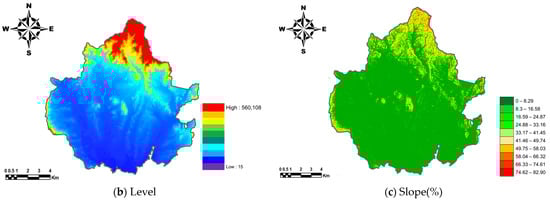
Figure 7.
Topography and landuse characteristics of Suwon City.
3.1.3. Emission Load Characteristics
The BOD emission load (kg/d), which is classified as non-point pollution, had decreased by 367.6 kg/d in 2020 compared to 2010. The non-point emission load BOD (kg/d) had increased in 2020 compared to 2010. It decreased by 24.6 and 25.3%, respectively, in the Hwangguji and Woncheonli Streams during the same period, but increased by 9.95 and 0.2% in the Seoho and Suwon Streams, respectively. It had clearly increased or decreased in the downstream areas of the Hwangguji, Seoho, and Suwon Streams in 2020 compared to 2013. It had decreased by up to 18.4% in the Hwangguji Stream in 2014 compared to the previous year and by up to 12.9% in the Woncheonli Stream in 2013 during the period between 2010 and 2020.
3.1.4. Impervious Area Ratio
As of 2020, the impervious area ratio was 47.7%, which was 3.8 times higher than the average of Gyeonggi-do (12.5%) and approximately twice as high as the average of the Jinwicheon water system (23.6%). In general, if the impervious area ratio exceeds 25%, it is known to be harmful in terms of water quality and ecological health [49]. As shown in Table 3, the impervious area ratio of Suwon City continued to increase for six years.
Table 3.
Changes in impervious area in Suwon City by year (2015 to 2020).
These results are associated with the development plan of Suwon City. From 2011 to 2020, 13.9 km2 (41.8%) out of the planned area (33.3 km2) was developed. The planned non-point emission load was 1359.42 kg/day, but the load according to the completed development project decreased by approximately 86.5% to 183.29 kg/day. The developed area was largest in the sub-watershed of the Woncheonli Stream.
According to the Jinwicheon water system plan [50], 30 development projects in 2022 generate non-point sources of 13.37 kg/day, and 49 development projects in 2030 will significantly increase non-point sources to 184.7 kg/day, indicating that proper management is required.
3.1.5. Management Measures to Reduce Non-Point Sources
Non-point source reduction projects are divided into structural and non-structural management measures. Structural measures include the installation of natural and filtration-type facilities (e.g., LID), while non-structural management measures include governance and road cleaning. Suwon City faithfully implemented the management measures presented in the implementation plan, and performed additional projects, such as green rainwater infrastructure construction. Various facilities, such as the storage type, filtration type, and infiltration planter, were applied as non-point source reduction plans according to the large-scale housing site development project [50]. As shown in Table 4, 22 structural management measures (53.7%) were completed in 2020 out of the planned 43 measures. Device-type facilities, including filtration facilities, had the largest application area, followed by natural facilities, such as bioretention. LID facilities were installed in the Woncheonli Stream watershed with government offices, according to the development plan. Figure 8a shows the completed facilities. For LID facilities, infiltration trenches exhibited the largest application area, followed by tree well filters [35]. Non-structural measures, such as road cleaning and governance, were also implemented beyond the goal.
Table 4.
Structural and non-structural non-point source management measures in Suwon City (2011 to 2020).
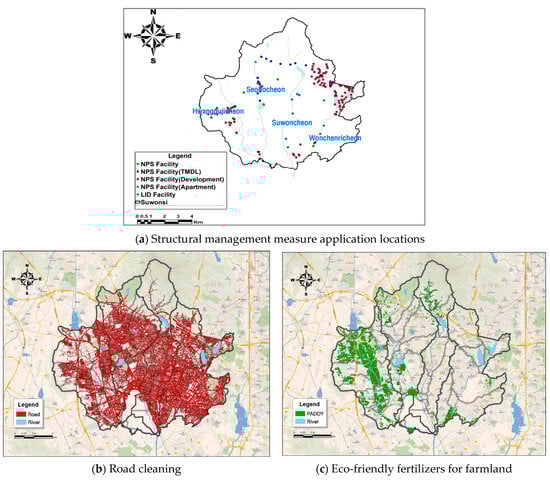
Figure 8.
Non-structural management measures for non-point source reduction.
For an area of 5.09 km2, more road cleaning (2707.8 km/year) was performed every year than the plan (953.7 km/year). Eco-friendly slow-release fertilizers were applied to 18.22 km2 due to continuous support, management, and reinforced regulations in the upstream area of the Suwon Stream and the Hwangguji Stream watershed, which include the water source protection area [35]. The applied ranges are shown in Figure 8b,c. In addition, deicing agents that acquired an eco-friendly certification mark were used at a ratio of more than 20%, and governance activities, such as sub-watershed meetings, were actively performed. Moreover, in accordance with the first stage of the sewer maintenance plan (until 2020), combined sewer leakage and overflow reduction projects were performed through separate sewer system maintenance.
3.2. Analysis of the Non-Point Source Improvement Effect
3.2.1. Analysis of the Non-Point Source Improvement Effect Using a Model (HSPF)
The flow rate correction of the watershed model was carried out using flow data at the N Hwanggye (Hwanggye Bridge) point of the non-point pollutant measurement network located at the end of Suwon City and using flow data at the Hwasan Bridge point of the water level-flow station (2015–2020). As a result of the correlation analysis between the observed data and simulated data for the flow rate of the N Hwanggye point, the observed average flow rate was 9.509 m3/s, the simulated average flow rate was 8.683 m3/s, and the RMSE was 5.79, with a %difference of 8.68. As a result of the correlation analysis between the observed and simulated data on the flow rate of the volcanic bridge point, the observed average flow rate was 4.423 m3/s, the simulated average flow rate was 4.397 m3/s, the RMSE was 3.09 and the %difference was 4.99. As a result of the correlation analysis using the %difference of the flow rate, the simulated value is thought to reflect the observed value well, as shown in Figure 9.
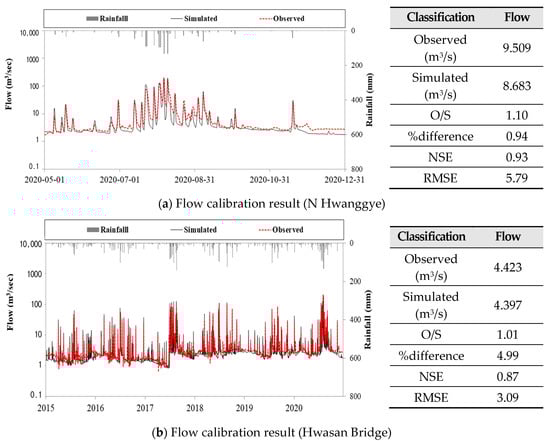
Figure 9.
Flow calibration result.
The water quality correction of the watershed model is based on the data of the Ministry of Environment’s water quality measurement network Hwanggujicheon 3, Suwon City’s self-measurement network (Kian, Jungbo, Saeteo, Daehwanggyo Bridge) and the implementation evaluation report of non-point source management areas (Kian Bridge, Jungbo Bridge, Saeteo Bridge, Daehwang Bridge, Hwasan Bridge) from 2015 to 2020. As a result of the correlation analysis using the %difference of water quality, it is judged that the simulated values reflect most of the observed values, as shown in Figure 10.
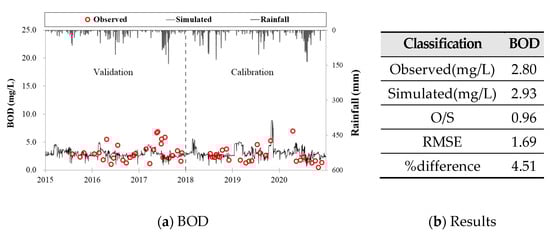
Figure 10.
Water quality calibration result (Hwasan Bridge).
Suwon City faithfully implemented the management measures presented in the implementation plan, and also actively performed water cycle management projects, such as green rainwater infrastructure construction. Various projects [33,51,52] were applied for runoff management during LID design. The results of the scenario simulation that applied them to HSPF showed that the BOD load at the Hwasan bridge point had decreased by 44.31 kg/day in 2020 compared to 2010. In addition to efforts to reduce non-point sources, various water quality improvement efforts, including the separate sewer system maintenance project according to the sewer management plan and the operation of the Seoho ecological water resource center, significantly reduced the BOD concentration measured at the Hwasan bridge point [35]. When the BOD loads before and after the reduction projects were compared using the HSPF model at the Hwasan bridge point, the effects of structural and non-structural projects during the management period were calculated to be 1.3 and 0.5%, respectively [35]. The reduction promoted by the structural projects corresponded to 17.98 kg/day, while the reduction promoted by the non-structural projects was calculated to be 7.42 kg/day. When all of them were applied, the BOD load decreased by 1.9% (26.0 kg/day). Based on these results, analysis was conducted for each stream. For all of the four streams in Suwon City, it was found that the BOD was improved, except for the Hwangguji and Suwon Streams, and the TP was improved, except for the Hwangguji Stream in 2020 compared to 2010. In particular, in 2020, the Hwangguji Stream showed the largest BOD and TP loads among the four streams. These results are shown in Table 5.
Table 5.
Annual average BOD load by stream (kg/day, HSPF).
3.2.2. Analysis of Non-Point Source Management and Water Cycle Improvement Effects through Statistics and Image Analysis
The impacts of the discharge, season, and time factors were compared using the log-linear model. The measurement points at the end of each stream were analyzed as shown in Figure 11. They are the gray points in Figure 11, and the model results are shown in Table 6 and Table 7. When the time regression coefficient (β3) has a statistically significant negative value, it means that the water quality concentration gradually decreases as a result of performing various water quality improvement projects. The time regression coefficient (β3) exhibited a statistically significant negative value in all streams except for the Suwon Stream for both BOD and TP, indicating that the water quality concentration of the Suwon Stream is affected by the change in discharge. For the other three streams, including the Hwasan bridge point, it can be interpreted that the water quality concentration was gradually reduced by watershed management projects rather than the simple discharge change effect.
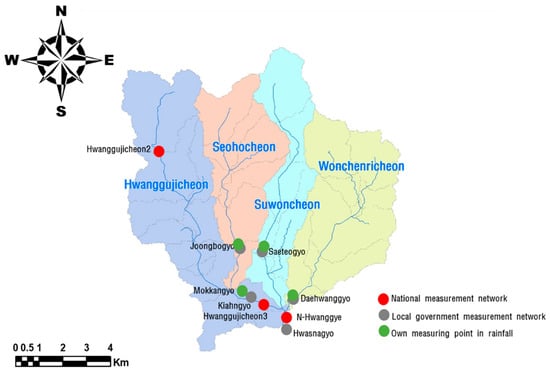
Figure 11.
Water quality and discharge measurement points in the target area.
Table 6.
Evaluation of BOD concentration improvement considering flow rate change.
Table 7.
Evaluation of TP concentration improvement considering flow rate change.
Based on these results, the improvement in non-point source management was presented using LDC. In LDC, the wet season section (10 to 40%) represents the load under large discharge conditions in the event of rainfall. Therefore, LDC graphs that reflected the target water quality of Suwon City (BOD 4.7 mg/L) were expressed using the measurement data from 2015 to 2020, as shown in Figure 12.
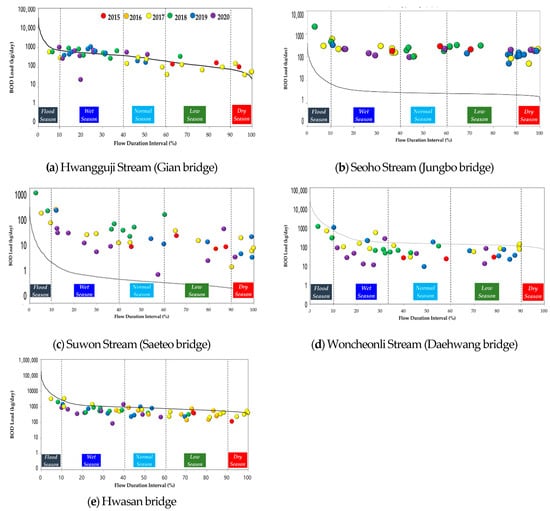
Figure 12.
LDC (Load Duration Curve) by river in Suwon.
Consequently, the discharge section (10 to 40%) affected by rainfall showed a decreasing trend. In particular, a significant load reduction in 2020 was observed from the Suwon and Woncheonli Streams. Suwon City applied non-point source reduction measures, such as non-point source reduction facilities and LID, in the order of the Woncheonli (11.80 km2), Seoho (7.24 km2), Hwangguji (5.19 km2), and Suwon (0.03 km2) Streams according to the watershed area. It appears that the Woncheonli Stream exhibited a significant load reduction in the wet season section because the largest number of non-point source reduction facilities were applied to it.
Figure 10 shows the ME landuse map based on the NDVI extracted from the image data of the Sentinel satellite (Figure 13a) and the 25 cm resolution landuse data constructed using the U-Net algorithm based on the orthographic aerial images of aviation LIDAR and NGII [53] (Figure 13b).
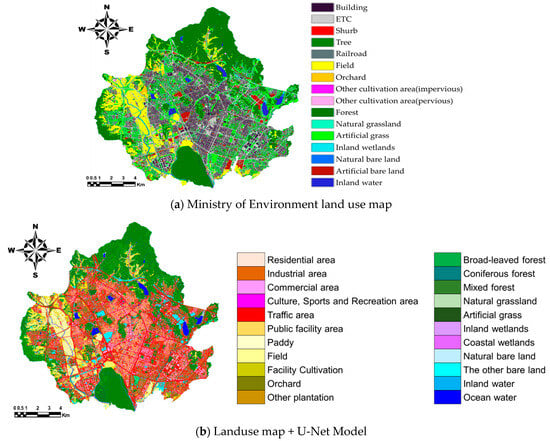
Figure 13.
Landuse map of Ministry of Environment and +U-Net Model.
The NDVI values were analyzed using these landuse results, and the Sentinel NDVI values were expressed for each landuse (Figure 14). Consequently, the NDVI value was found to be low in urban areas, such as residential areas, and high in forests among the classified landuse (Figure 14a). The NDVI value was also high in the LID areas classified as shrubs and trees at a 25 cm high resolution compared to general residential areas (Figure 14b), indicating that it is applicable in the estimation of the pervious area. In Figure 14b, the red border describes the LID area.
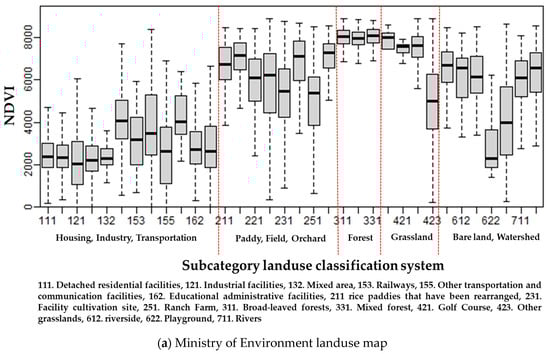
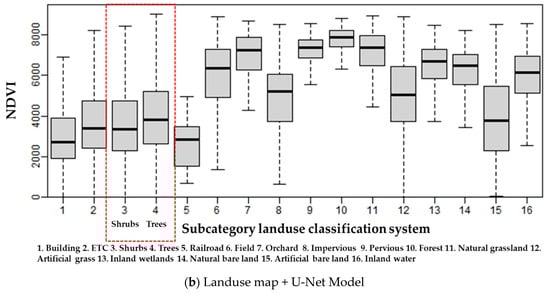
Figure 14.
Sentinel-based NDM by land use classification.
Through Sentinel2 A and B satellite images, the NDVI was analyzed for May when vegetation development was active. As shown in Figure 15, the NDVI distribution trends by year were analyzed for the target area, Hwangguji Stream, Seoho Stream, Suwon Stream, and Woncheonli Stream using the Sentinel NDVI. When the data from 2017 were analyzed for Suwon City and the four watersheds, it was found that the NDVI slightly increased with an increase in the vegetation area toward 2020.
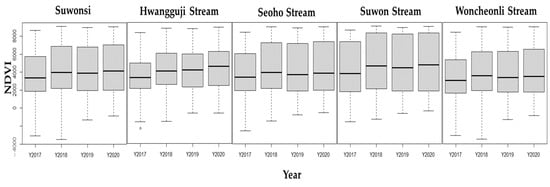
Figure 15.
NDVI distribution by year (2017~2020).
In addition, the Hwasan bridge point at the end of the target area where the four streams joined was analyzed. Figure 16 and Table 8 show the results of calculating the direct runoff using three hydrological curve separation techniques based on the observed discharge data at the Hwasan bridge point. The annual cumulative direct runoff increased as the precipitation increased. SWAT BFFLOW showed the largest direct runoff followed by USGS HYSEP and WHAT. The precipitation in 2014 was similar to that in 2019.
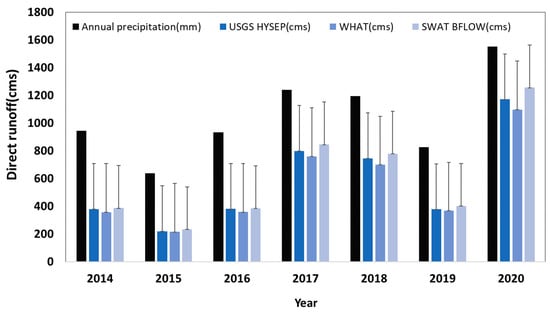
Figure 16.
Direct runoff calculation using the hydrological curve separation method.
Table 8.
Direct runoff calculation using the hydrological curve separation method.
Direct runoff changes were compared for 2014 and 2019 when similar precipitations (944 and 825 mm, respectively) were observed. According to Figure 17, the direct runoff ratio in 2019 increased compared to 2014. This appears to be due to the increase in land area.
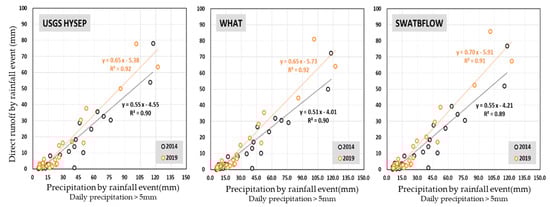
Figure 17.
Direct runoff ratio comparison according to the precipitation (2014 vs. 2019).
3.3. Presentation of Directions for Non-Point Source and Water Cycle Management
3.3.1. Evaluation according to the Analysis of Non-Point Source and Impervious Area Management Effects
Management measures to improve urban non-point sources from 2014 were applied to the HSPF model. The number of structural management measures implemented during the period from 2014 to 2020 was 22, indicating that 53.5% of the plan was performed. Non-structural management measures, such as governance and road cleaning, were performed according to the plan by year. The Woncheonli Stream showed the largest area (11.77 km2) of structural management measure application, followed by the Seoho Stream (7.24 km2), Hwangguji Stream (5.19 km2), and Suwon Stream (0.02 km2). The Woncheonli and Seoho Stream watersheds had a larger management measure application area than other watersheds because the project was planned (2014) for priority watersheds with a high impervious area ratio (%) and non-point pollution generation (kg/day), i.e., the Woncheonli Stream (38%, five sub-watershed), Seoho Stream (30.8%, four sub-watersheds), and Hwangguji and Suwon Streams (15.4%, two sub-watersheds, respectively).
In particular, in 2015, the Woncheonli Stream showed the largest impervious area (59.9%, 19.82 km2), followed by the Seoho Stream (52.9%, 15.86 km2), Suwon Stream (38.6%, 9.90 km2), and Hwangguji Stream (31.1%, 10.03 km2). Therefore, LID facilities were constructed in an area of 0.36 km2 for the Woncheonli Stream, 0.0 km2 for the Seoho Stream, and 0.03 km2 for the Suwon Stream in order of the largest impervious area.
Non-structural measures were performed across Suwon City. They were implemented at a rate of 2707.8 km/year for 9.52 km2 out of a total road area of 31.75 km2 in Suwon City. Eco-friendly fertilizers were used in a farmland area of 1.58 km2 across Suwon City at a rate of 47,433.1 tons/year.
Table 9 shows the model results of applying structural and non-structural reduction measures in 2020 when the management period ended. The BOD load (kg/day) decreased by 4.1% for the Woncheonli Stream, 2.2% for the Seoho Stream, 2.0% for the Hwangguji Stream, and 1.7% for the Suwon Stream compared to 2010 [35].
Table 9.
Delivery load for each watershed in Suwon City (2020).
The water quality with regard to the BOD and TP at the end of the four streams has showed a tendency to decrease over the last ten years. The average BOD (7.1 mg/L) of the Hwangguji Stream in 2020, however, exceeded the middle area target (III), and the maximum BOD (28.9 mg/L) at the end of Suwon City (N-Hwanggye) during rainfall in 2020 was found to be 2.6 times higher than usual. The results are shown in Table 10.
Table 10.
N-Hwanggye non-point pollutant monitoring network (2020).
Figure 18 shows the results of a comparison with the nearby streams of the Anseongcheon water system. The concentrations of BOD, a management target substance, and Total Organic Carbon (TOC), a non-biodegradable substance, were higher compared to nearby streams. The TOC concentration of the Hwangguji Stream was 5.5 mg/L, which was approximately 1.1 times higher compared to the Osan Stream (4.9 mg/L) and Jinwi Stream (4.5 mg/L), which are other streams in the water system, over the last three years (2018 to 2022).
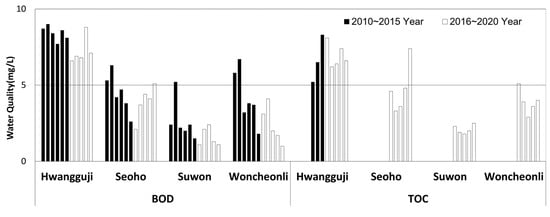
Figure 18.
Annual average BOD and TOC concentrations by stream (2010 to 2020).
The impervious area ratio increased from 45.9% in 2015 to 47.7% in 2020. Due to the continuous development plan, the non-point source BOD is expected to be 184.7 kg/day in 2030 [35]. Considering that there is no significant difference in annual precipitation and that the impervious area continues to increase for Suwon City, the direct runoff of non-point sources is highly likely to occur in the event of rainfall. Figure 19 shows the pollution load contribution rate for each stream using the HSPF model. The Hwangguji and Seoho Streams exhibited high BOD and TP loads.
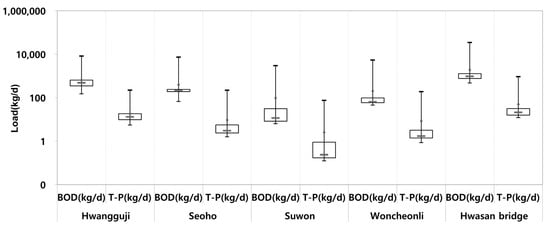
Figure 19.
Annual average BOD and TP pollution load contribution rate in 2020 by stream.
The comprehensive analysis of the non-point source management project status of Suwon City showed some reduction effects, including a reduction in BOD from 8.7 mg/L to 2.2 mg/L and a decrease in the non-point source pollution load by 26.02 kg/day based on the application of the HSPF model for the past ten years (2010 to 2020) at the Hwasan bridge point at the end of the city. The water quality by stream, management project status, the exceedance of the middle area target, the degree of the increase in water quality during rainfall, and the pollution load contribution rate, however, indicated that further non-point source management is required, with a focus on the Hwangguji and Seoho Streams.
3.3.2. Research on Directions for Effective Non-Point Source and Impervious Area Management
In this study, the current status of management projects and pollution sources was investigated to evaluate the effects of non-point source and impervious area management on watersheds using measurement data at the end of the urban watershed. In addition, statistical analysis was conducted to identify trends in the water quality and the impact of discharge. In particular, the load change in the LDC high-discharge (10 to 40%) section was identified to evaluate the non-point source management effect. The planned reduction projects were actively implemented. Consequently, it appears that the water quality was improved and that the pollution load was reduced at some points. The finding that the direct runoff ratio increased in 2019 when the precipitation was similar to that of 2014 and when various reduction projects were performed showed that the impact of development in Suwon City, such as the increase in land area, offset the effects of various reduction projects, indicating that further management is required for key management areas. Despite the increase in land area, the NDVI slightly increased. This appears to be due to the application of small non-point source reduction facilities in accordance with the Water Environment Conservation Act and landscaping areas during development in accordance with the Building Act. It appears that the NDVI values applied in this study may indirectly represent vegetation-type LID, as well as ecological and landscaping areas with similar functions. Despite these improvements, the effects of watershed management do not seem to lead to a reduction in direct runoff at the end of the watershed. It will be possible to derive general results in the future if sufficient data are accumulated and direct runoff calculation techniques are improved. Most of all, it is deemed necessary to prepare manuals for installation and maintenance personnel so that the LID/GI element technologies for each facility type installed during urban development, such as buildings, roads, parking lots, and parks, can lead to a reduction in the direct runoff and an increase in the base flow. Considering the water quality status and future development plans, the sub-watersheds that require further management are judged to be the Hwangguji and Seoho Stream watersheds.
4. Conclusions
In this study, Suwon City’s efforts to manage non-point sources and the water cycle were investigated in relation to the comprehensive evaluation of the non-point source management area designation system of the third comprehensive measures for non-point sources, as well as the water cycle target management system. In addition, the effects of non-point source and water cycle management projects were analyzed using long-term monitoring data, such as water quality and satellite images. Areas that require further management and the reasons were also presented to support the implementation of related policies.
For Suwon City, the population and land area continuously increased as pollution sources during the ten-year management period, and the emission load had also increased by up to 24.8% in the Hwangguji and Woncheonli Streams in 2020 compared to 2010. Various development projects also continuously increased the land area. Despite these conditions, non-point source improvement and pipeline maintenance projects were performed. The statistical analysis results confirmed a decreasing trend in the water quality concentrations, and the results of analyzing the load duration curve (LDC) using measurement data also confirmed that the load decreased in some high discharge sections in 2020 compared to 2015.
When calculating the normalized difference vegetation index (NDVI) using satellite images, there were limitations with regard to deriving general results because the data used were from 2017, but the NDVI was found to increase during the period when the impervious area of the cadastral map-based data increased. This indicates that the impervious area calculation method based on cadastral maps or land use maps has limitations with regard to reflecting small-scale LID and the increase in ecological and landscaping areas. It is also deemed necessary to prepare measures to connect and maintain element technologies for each facility type applied during development, such as buildings and roads, so that the increase in pervious area expressed as the vegetation index can lead to a reduction in direct runoff and to disaster prevention functions, such as stream depletion.
The BOD and TP concentrations of the four streams have showed a tendency to decrease over the past ten years, but the middle area target (III) was still exceeded in the Hwangguji and Seoho Streams, and the pollution load contribution rate was also found to be high at the end of Suwon City. Considering the water quality status, pollution load, and future development plans, it is judged that non-point source and water cycle management is required, with a focus on the Hwangguji and Seoho Stream watersheds.
This study investigated the management of non-point sources and the water cycle in Suwon for non-point source management areas under the Water Environment Conservation Act, and analyzed the improvement in non-point source and water cycle management projects using long-term actual monitoring data, such as water quality and satellite images. During the management period, the improvement effect linked to the current status of the watershed before and after the application of non-point sources and water circulation management measures can be supplemented by evaluating the improvement effect based on prediction methods such as models and statistics and the end of the watershed using monitoring results. In addition, it was possible to support the promotion of related policies by presenting locations that required key management in the target area.
In the future, we think it is necessary to further expand the spatial scope to study the improvement of non-point sources and the effect of water circulation in the basin due to rainfall outflows; this includes non-point pollution source reduction projects, green changes, and LID.
Author Contributions
Conceptualization, M.P. and J.-H.M.; Methodology, J.K., M.P., J.-H.M. and E.H.N.; Software, M.P. and J.-H.M.; Validation, M.P. and J.-H.M.; Formal analysis, J.K. and E.H.N.; Investigation, J.K., J.L., J.-H.M., J.M.L. and H.J.; Data curation, M.P.; Writing—original draft, J.K. and J.-H.M.; Writing—review & editing, M.P.; Visualization, J.K. All authors have read and agreed to the published version of the manuscript.
Funding
This research was supported by a grant from the National Institute of Environmental Research (NIER), funded by the Ministry of Environment (ME) of the Republic of Korea (NIER-2023-01-01-037).
Data Availability Statement
Data are contained within the article.
Conflicts of Interest
The authors declare no conflict of interest.
References
- Ministry of Environment (ME). A Study on the Nationwide Impervious Area Ratio Survey and Improvement Plan; Ministry of Environment: Seojong, Republic of Korea, 2013.
- National Institute of Environmental Research (NIER). A Study on the Establishment of Medium and Long Term Management Objectives for Hydrologic Cycle (II); National Institute of Environmental Research (NIER): Incheon, Republic of Korea, 2019.
- Bellucci, C. Stormwater and aquatic life: Making the connection between impervious cover and aquatic life impairments for TMDL development in Connecticut streams. Proc. Water Environ. Fed. 2007, 5, 1003–1018. [Google Scholar] [CrossRef]
- NIER. A Study on the Establishment of Survey and Management Goals for Impervious Surface Runoff Characteristics (I); NIER: Incheon, Republic of Korea, 2014. [Google Scholar]
- Ministry of Environment (ME). 2nd National Comprehensive Nonpoint Source Pollution Management Plan; Ministry of Environment: Seojong, Republic of Korea, 2012.
- Kim, J.M.; Yoon, E.Y.; Park, J.R.; Kim, B.S.; Shin, H.S. Development of experimental equipment for water balanced analysis of planter box. J. Korean Soc. Hazard Mitig. 2017, 17, 87–92. [Google Scholar] [CrossRef]
- Kim, B.S.; Kim, J.M.; Baek, J.S.; Shin, H.S. An analysis of storage and runoff reduction characteristics using planter box in architectural LID system. J. Korea Water Resour. Assoc. 2019, 52, 219–226. [Google Scholar]
- Choi, Y.S.; Kim, J.Y.; Han, S.S.; Kwon, S.C. Permeable coastal pavement structure for shore protection and removal of non-point source pollutants. J. Ocean. Eng. Technol. 2019, 33, 597–606. [Google Scholar] [CrossRef]
- Jung, J.S.; Jung, K.W.; Kang, S.M.; Hyun, K.H. Evaluation of water cycle improvement in LH institute using SWMM-LID model. J. Korean Soc. Hazard Mitig. 2018, 34, 308–315. [Google Scholar]
- Yeon, J.S.; Jang, Y.S.; Lee, J.H.; Shin, H.S.; Kim, E.S. Analysis of stormwater runoff characteristics for spatial distribution of LID element techniques using SWMM. J. Korea Acad. Ind. 2014, 15, 3983–3989. [Google Scholar]
- Zahmatkesh, Z.; Burian, S.J.; Karamouz, M.; Tavakol-Davani, H.; Goharian, E. Low-impact development practices to mitigate climate change effects on urban stormwater runoff: Case study of New York City. J. Irrig. Drain. Eng. 2015, 141, 04014043. [Google Scholar] [CrossRef]
- Kim, B.S.; Lim, S.H.; Lee, S.J.; Baek, J.S.; Kim, J.M. A Study on the Water Cycle Improvement Plan of Low Impact Development. J. Korean Soc. Water Environ. 2020, 36, 109–115. [Google Scholar]
- Kim, J.; Choi, J.; Park, M.; Min, J.-H.; Lee, J.M.; Lee, J.; Na, E.H.; Jang, H. A Study on Identifying Priority Management Areas and Implementing Best Management Practice for Effective Management of Nonpoint Source Pollution in a Rural Watershed, Korea. Sustainability 2022, 14, 13999. [Google Scholar] [CrossRef]
- Kim, J.S.; Choi, J.Y.; Lee, J.M.; Nah, E.H.; Shin, D.S.; Lee, J.G.; Ryu, J.C. A Study on the Plan for Selection of Prioritization Management Area for Reduction of Non-Point Pollution in Gwangju Metropolitan City. Korea Environ. Policy Adm. Soc. 2019, 6, 189–214. [Google Scholar]
- Gang, M.J. Nonpoint source research direction for improving nonpoint source management policies. J. Korean Soc. Agric. Eng. 2012, 54, 19–25. [Google Scholar]
- Suwon City Local Government. Management Plan Report for Nonpoint Source Management Areas in Suwon City; Suwon City Local Government: Suwon City, Republic of Korea, 2010.
- Hyun, G.H.; Lee, J.M. Impacts on water-cycle by land use change and effects of infiltration trenches in A New town. J. Korean Soc. Water Wastewater 2010, 24, 691–701. [Google Scholar]
- Lee, J.M.; Lee, Y.S.; Choi, J.S. Analysis of Water Cycle Effect according to Application of LID Techniques. Korean Wetl. Soc. 2014, 16, 411–421. [Google Scholar]
- Arjenaki, M.O.; Sanayei, H.R.Z.; Heidarzadeh, H.; Mahabadi, N.A. Modeling and investigating the effect of the LID methods on collection network of urban runoff using the SWMM model (case study: Shahrekord City). Model. Earth Syst. Environ. 2021, 7, 1–16. [Google Scholar] [CrossRef]
- Song, B.G.; Park, G.H.; Lee, T.S. An assessment of urban water cycle in Changwon-si Using GIS-based Water Cycle Area Ratio. Environ. Impact Assess. 2013, 22, 397–408. [Google Scholar] [CrossRef][Green Version]
- Conley, G.; McDonald, R.I.; Nodine, T.; Chapman, T.; Holland, C.; Hawkins, C.; Beck, N. Assessing the influence of urban greenness and green stormwater infrastructure on hydrology from satellite remote sensing. Sci. Total Environ. 2022, 817, 152723. [Google Scholar] [CrossRef]
- Shin, D.S.; Park, J.B.; Kang, D.G.; Cho, D.J. An Analysis of Runoff Mitigation Effect Using SWMM-LID Model for Frequently Inundated Basin. Korean Soc. Hazard Mitig. 2013, 13, 303–309. [Google Scholar] [CrossRef][Green Version]
- Lim, Y.G.; Jeong, J.C.; Shin, H.S.; Hah, G.J. Analyzing the Efficiency of LID Technique for Urban Non-point Source Management—Focused on City of Ulsan in Korea. Korea Soc. Environ. Restor. Technol. 2014, 17, 1–14. [Google Scholar] [CrossRef]
- Bhandari, S.; Jobe, A.; Thakur, B.; Kalra, A.; Ahmad, S. Flood damage reduction in urban areas with use of low impact development designs. In Proceedings of the World Environmental and Water Resources Congress 2018, Minneapolis, MN, USA, 3–7 June 2018; pp. 52–61. [Google Scholar]
- Vohra, R.; Tiwari, K.C. Analysis of land use and land cover changes and their impact on temperature using landsat satellite imageries. Environ. Dev. Sustain. 2022, 25, 8623–8650. [Google Scholar] [CrossRef]
- Kim, G.H.; Kim, D.B.; Song, Y.M.; Choi, H.S. Analysis of Land Surface Temperature Status by Land Cover in Urban Areas. J. Assoc. Korean Geogr. 2021, 10, 415–430. [Google Scholar]
- Do, J.; Ahn, S.; Kang, J. Urbanization effect of mega sporting events using sentinel-2 satellite images: The case of the pyeongchang olympics. Sustain. Cities Soc. 2021, 74, 103158. [Google Scholar] [CrossRef]
- Semenzato, A.; Pappalardo, S.E.; Codato, D.; Trivelloni, U.; De Zorzi, S.; Ferrari, S.; Massironi, M. Mapping and monitoring urban environment through sentinel-1 SAR data: A case study in the Veneto region (Italy). ISPRS Int. J. Geo-Inf. 2020, 9, 375. [Google Scholar] [CrossRef]
- Korea Meteorological Administration Weather Data Open Portal. Available online: www.data.kma.go.kr (accessed on 1 July 2022).
- NIER, National Pollution Source Survey. Available online: www.wems.nier.go.kr (accessed on 1 July 2022).
- Ministry of Environment of Korea (ME). Environmental Spatial Information Service. Available online: www.egis.me.go.kr (accessed on 1 July 2022).
- Suwon City Local Government. Second Stage Jinwicheon TMDL Basic Plan Report; Suwon City Local Government: Suwon City, Republic of Korea, 2021.
- Suwon City Local Government. Management Plan Implementation Evaluation Report for Nonpoint Source Management Areas in Suwon City; Suwon City Local government: Suwon City, Republic of Korea, 2020.
- ME. Water Environment Information System, 2010 to 2020. Available online: www.weis.nier.go.krm (accessed on 31 December 2020).
- NIER. Monitoring and Investigation of Pollutant Loads in Non-Point Sources Management Area; NIER: Incheon, Republic of Korea, 2022.
- Korea Environment Corporation. A Study on Pilot Project of Expanding the Application of Optimal Management Technique for Nonpoint Source Management in Rural Areas; Korea Environment Corporation: Incheon, Republic of Korea, 2020. [Google Scholar]
- Ministry of Environment (ME). Manual for Installation and Management of Non-point Pollution Reduction Facilities; Ministry of Environment: Seojong, Republic of Korea, 2020.
- Kim, G.W.; Kang, M.S.; Song, J.H.; Park, J.H. Estimation of LOADEST coefficients according to watershed characteristics. J. Korea Water Resour. Assoc. 2018, 51, 151–163. [Google Scholar]
- Arnold, J.G.; Srinivasan, R.; Muttiah, R.S.; Williams, J.R. Large area hydrologic modeling and assessment. Part I: Model development. JAWRA 1998, 34, 73–89. [Google Scholar] [CrossRef]
- Jang, S.S.; Ji, H.S.; Kim, H.G. Identifying Priority Area for Nonpoint Source Pollution Management and Setting up Load Reduction Goals using the Load Duration Curve. J. Korean Soc. Agric. Eng. 2018, 2018, 17–27. [Google Scholar]
- Web-Based SWATBFLOW. Available online: https://www.envsys.co.kr/~swatbflow/USGS_GOOGLE (accessed on 20 October 2022).
- Web-Based HYSEP. Available online: https://www.envsys.co.kr/~hysep/USGS_GOOGLE (accessed on 20 October 2022).
- Web-Based WHAT. Available online: https://www.envsys.co.kr/~what/USGS_GOOGLE (accessed on 20 October 2022).
- Lange, M.; Dechant, B.; Rebmann, C.; Vohland, M.; Cuntz, M.; Doktor, D.J.S. Validating MODIS and sentinel-2 NDVI products at a temperate deciduous forest site using two independent ground-based sensors. Sensor 2017, 17, 1855. [Google Scholar] [CrossRef]
- Wu, M.; Yang, C.; Song, X.; Hoffmann, W.C.; Huang, W.; Niu, Z.; Wang, C.; Li, W.; Yu, B. Monitoring cotton root rot by synthetic Sentinel-2 NDVI time series using improved spatial and temporal data fusion. Sci. Rep. 2018, 8, 2016. [Google Scholar] [CrossRef] [PubMed]
- Recanatesi, F.; Giuliani, C.; Ripa, M.N.J.S. Monitoring Mediterranean Oak decline in a peri-urban protected area using the NDVI and Sentinel-2 images: The case study of Castelporziano State Natural Reserve. Sustainability 2018, 10, 3308. [Google Scholar] [CrossRef]
- Choi, J.Y.; Shin, E.S.; Lee, D.H. A Study on the Urban Non-Point Source Pollutant Loadings in Seoul. J. Korean Soc. Water Environ. 2018, 1999, 315–323. [Google Scholar]
- Chang, S.H.; Choi, J.Y.; Lee, J.H. A Case Study on Correlation of Water Quality and Impervious Cover Rates in Watersheds. Seoul Inst. 2005, 6, 15–17. [Google Scholar]
- Scheler, T. The Importance of Imperviousness. Wbtershed Prot. Tech. 1994, 1, 100–111. [Google Scholar]
- Suwon City Local Government. Jinwicheon Water System TMDL Plan Implementation Evaluation Report; Suwon City Local Government: Suwon City, Republic of Korea, 2020.
- Suwon City Local Government. Nonpoint Source Management Area Evaluation Report; Suwon City Local Government: Suwon City, Republic of Korea, 2015.
- Suwon City Local Government. Nonpoint Source Management Area Evaluation Report; Suwon City Local Government: Suwon City, Republic of Korea, 2016.
- Bokyung, S.O.N.; Yeonsu, L.E.E.; Jungho, I.M. Classification of Urban Green Space Using Airborne LiDAR and RGB Ortho Imagery Based on Deep Learning. J. Korean Assoc. Geogr. Inf. Stud. 2021, 24, 83–98. [Google Scholar]
Disclaimer/Publisher’s Note: The statements, opinions and data contained in all publications are solely those of the individual author(s) and contributor(s) and not of MDPI and/or the editor(s). MDPI and/or the editor(s) disclaim responsibility for any injury to people or property resulting from any ideas, methods, instructions or products referred to in the content. |
© 2024 by the authors. Licensee MDPI, Basel, Switzerland. This article is an open access article distributed under the terms and conditions of the Creative Commons Attribution (CC BY) license (https://creativecommons.org/licenses/by/4.0/).