Article

A Study on a New 5S Model of Decent Work Perception

1
Business School, Shanghai Dianji University, Shanghai 201306, China
2
Huizhixin Management Consulting Co., Ltd., Chengdu 610000, China
*
Author to whom correspondence should be addressed.
Sustainability 2024, 16(3), 1207; https://doi.org/10.3390/su16031207
Submission received: 10 December 2023 / Revised: 28 January 2024 / Accepted: 29 January 2024 / Published: 31 January 2024

Abstract

:
Purpose: Decent work promotes decent and productive work opportunities for all genders under conditions of freedom, equality, safety, and human dignity. Despite the growing body of literature on this concept, decent work perception (DWP) measurement still needs to be improved. Although the literature provides several measurement tools for DWP, only some studies focus on knowledge works. This study aims to provide an original, valid, and reliable measure of DWP reflecting the knowledge workers’ perception of decent work. Problem: Based on a proposed conceptual framework of DWP, a scale was developed through a systematic scale development process. Methodology: In this study, an exploratory survey is conducted to generate codes using in-depth interviews. A pilot study is used to generate and select items for the DWP scale. An exploratory factor analysis is conducted to determine the underlying factor structure of the scale. Data are collected from 869 knowledge workers in China in the formal survey. Results: The analysis provides a five-dimensional structure of DWP with 15 items, including security, support, self-value, skills, and self-esteem. Implications: Our work expands research on decent work and adds to the broader area of knowledge workers. By developing a scale of DWP, our research has practical implications in theory and practice.

1. Introduction

The International Labor Organization (ILO) proposed decent work in 1999. Decent work aims to promote decent and productive work opportunities for all genders in conditions of freedom, equality, safety, and human dignity. The proposal of decent work is of practical significance for social, organizational [1], and individual development [2]. By contributing to a more equitable, just, and humanistic approach to work, decent work helps reach a fairer globalization goal. At the organizational level, decent work provides us with guiding directions for the rational and legitimate use of human capital [3]. Understanding decent work at the individual level is vital to transforming decent work from theory to reality [2]. Decent work may provide a general framework to structure workers’ freedom, equality, safety, and human dignity. Although the expanding literature on this issue has provided a clear understanding, developing a commonly accepted definition of decent work from an individual level still needs to be solved. Another problem is to measure based on its links with knowledge workers. Despite various measurement tools in the literature, almost all have some limitations. In order to better understand and measure decent work perception for knowledge workers, a new measurement of decent work perception is needed. This current study aims to fill this gap by providing a new scale to measure decent work in terms of the perceptions of knowledge workers.
The data for this study were collected from knowledge workers in China. The ILO and China signed the “China Decent Work Country Program 2016–2020” in 2017, which sets out the areas of cooperation between China and the ILO for five years. Chinese workers’ decent work status has attracted international attention. Research results show that 12.9% of Chinese workers work over 10 h overtime per week [4], far exceeding international average working hours. With the popularity of mobile Internet in the workplace, knowledge workers can effectively use the Internet to work anytime and anywhere, extending workers’ working hours and making overwork more invisible [5]. Overworking has a significant negative effect on society [6], organizations [7], and individuals [8,9]. It squeezes the public’s time for leisure consumption and triggers an imbalance between work and family relationships from a social perspective, sacrifices employees’ health [10,11], decreases innovation-driven development incentives from an organizational perspective [12], and violates workers’ right to life and health from an individual perspective [8,9]. As a result, overworking impacts sustainable social and human development [13,14].
Decent work has received attention from academics since its proposal in 1999. Studies have found that decent work promotes socioeconomic development and helps achieve strategic organizational goals. Decent work can significantly contribute to labor market stability [15], socioeconomic competitiveness [16], and the human development index [17]. Moreover, decent work can predict employee engagement [18], self-efficacy [19], organizational commitment [20], voice behavior [21], innovative behavior, and job performance [22,23]. Surprisingly, organizational behavior and human resource management researchers have seldom directly studied knowledge workers’ decent work perception, although they have long realized that knowledge workers are critical to improving the competitiveness of organizations in the knowledge economy [24]. The reason for the lack of management research on knowledge workers’ decent work perception is the inconsistency in the measurement of decent work. Since 1999, decent work measurement has been developed at the macro and micro levels. Ferraro et al. first proposed a decent work questionnaire (DWQ) consisting of thirty-one indexes from the four pillars of rights, employment equity, social dialogue, and social protection [25]. This measurement is based on the ILO macro definition of decent work. Duffy et al. developed a decent work scale (DWS) based on the Psychology of Working Theory (PWT) from the micro-level [26]. DWS consists of five dimensions: safe working conditions, security of health care, adequate salary, free time and rest hours, and organizational value [26]. Yan et al. designed a decent work perception scale (DWPS) for knowledge workers at the micro-level of DWP [27]. This scale is developed from grounded theory and contains 4 dimensions and 13 items. Job security (JSE), respect and support (RSU), self-value (SVA), and professional skills (PSK) are the four dimensions.
While offering valuable information, the objective measures of decent work have several limitations. First, decent work’s structural dimensions are complex, inconsistent, and difficult to recognize and disseminate. The 5-dimensions of Duffy et al. and the 7-dimensions of Ferraro et al. are complex [25,26], with too many items in the scale, resulting in low accuracy of subjects’ responses when collecting data through the questionnaire. Also, current scales need a solid foundation for qualitative research. The scales of Duffy et al. and Ferraro et al. were borrowed directly from established literature or objective indicator systems and lacked a solid qualitative study as a theoretical basis. Last, existing measurements are constructed on a small sample size for interviews and questionnaires. Yan et al.’s scale is based on qualitative research to develop DWPS scales [27]. However, the sample size of interviews and questionnaires is small, and the generalizability and representativeness of their findings need to be improved.
The research questions of this study are: (1) How to construct a reasonable theoretical framework for decent work perception based on a standard scale development procedure? (2) How to construct a scale of decent work perception that is easy to remember and disseminate? (3) Is the newly developed scale valid and reliable? Based on these research questions, this paper is organized as follows: Section 2 discusses current studies on decent work concept and scale development. Section 3 explains the exploratory survey of generating codes of decent work perception based on the in-depth interview, pilot survey of item generating and selecting, and formal survey validating the decent work perception scale. Section 4 compares the previous research results with the decent work perception scale and indicates that self-esteem is a distinct dimension proposed in decent work for knowledge workers. Section 5 discusses the main conclusions of this research and the theoretical and practical applications of a decent work perception scale in the research field and management practice. Section 6 discusses the limitations of this study and predicts future research directions.

2. Literature Review

2.1. Definition of Decent Work

Work-related research is a leading research topic in human resource management. Researchers have developed many academic concepts related to work since the 1950s, such as job satisfaction, job engagement, quality of work life, work-family balance, and quality of employment [28]. These concepts laid the theoretical foundation for decent work. ILO first introduced decent work at the 87th International Labor Conference in 1999, a major milestone for theoretical research and industrial relations practice worldwide. Scholars have been working on decent work for more than 20 years since then. The definition can be developed from safety, equality, and self-value perspectives.
From a safety perspective, workers can not only secure their livelihood through employment [29], but also receive adequate health protection against injuries that may result in work disability when exposed to hazardous working conditions [30]. Therefore, decent work from a safety perspective should include a stable income and a safe working environment [31]. Relevant laws, regulations, and policies should be formulated at the national level to guarantee the safety of workers and promote healthy human development [32].
In accordance with the equality perspective, decent work should foster personal development and social inclusion, facilitate unrestricted expression of individual opinions, and ensure active participation in decision-making processes by both men and women [33]. Under this perspective, decent work focuses on guaranteeing fairness and equity among different groups [34]. However, there are two opposing views among scholars. Optimists believe that decent work, as proposed by the ILO, has a counter-hegemonic tendency. Alzola, from the perspective of human resource management, views decent work as the “moral rights” of employees in the workplace [35]. Thus, gender equality advocates strongly support decent work because it focuses on formal and informal labor. On the other hand, pessimists criticize decent work, arguing that it is consistent with neo-liberal hegemony, mainly as it includes labor regulations and corporate social responsibility that are mandatory for enterprises. Hauf skillfully resolves the two confronting perspectives in decent work from a political economy perspective [36]. He posits that gender equality and corporate social responsibility constitute the fundamental pillars of decent work and are mutually indispensable to one another.
The perspective of self-value originates from the psychological perception of workers and underscores that work-related challenges and opportunities can actualize their sense of self-worth and dignity [37]. This perspective suggests that decent work should place career-related work experiences at the center of self-construction [38]. Blustein et al. defined decent work as a stable, dignified, and safe job based on the PWT [39]. Among them, stability, dignity, and safety all come from the individual perception of workers. PWT consists of survival and rights, social connections, and self-determination. Survival and rights pertain to an individual’s capacity to sustain their livelihood and accomplish personal objectives through employment. Work-related factors related to this dimension in decent work are job security, job stability, minimum wage, social security, and paid leave. Social connections encompass interpersonal and societal affiliations, including the provision of support, respect, and external resources beyond the realm of work, exerting an impact on employment outcomes. Self-determination refers to an individual’s autonomy, competence, and values related to opportunities. Employers and governments should endeavor to enhance the caliber of their workforce, bolster skills training initiatives, and devise strategies for career advancement that align with the objective of promoting decent work. Compared with the safety and equality perspectives, the self-value perspective emphasizes the individual’s subjective perception, especially the perception of the meaning and value of work. Therefore, the promotion of decent work from this perspective should commence with workers’ individual perception and enhance their sense of self-worth and dignity by delving into the significance and essence of labor [40].

2.2. Existing Measurement of Decent Work

The definition of decent work is broadly defined from a practical perspective, while it is measured from a narrowly theoretical perspective. As a result, there exists an inconsistency between the concept and measurement. According to the literature review, decent work is measured at both the macro-level and micro-level.
Based on the ILO’s definition of decent work, macro-level decent work indicators aim to measure the level of a particular country or region from the four dimensions of rights, employment, social dialogue, and social protection by analyzing economic data, demographic data, labor market data, and societal development data. These four dimensions are also the four pillars of decent work. Representative measurement tools are as follows: (1) Anker et al. first developed 11 dimensions from rights, social security, employment, and social dialogue proposed by the ILO alongside 63 indicators to measure decent work [29]; (2) Bescond et al. revised Anker’s study and constructed seven indexes for conducting labor market surveys [41]. The limitations of these two representative studies are reflected in the complexity and difficulty of standardizing decent work indexes at the macro-level. Too many indexes from Anker’s study result in the limitations of utilizing decent work indicators in practice and the constraints of disseminating them in other research. Bescond’s indicators are smaller in size and easy to utilize. However, the standardization of decent work indicators across countries is difficult due to differences in the methods of calculating statistical indicators in various countries [27]. Consequently, the macro-level measurement of decent work fails to acknowledge that decent work is fundamentally a subjective concept at the individual level, exhibiting variations among individuals even within the same working environment.
Later, scholars tried to measure decent work at the micro level. The micro level of decent work should be called decent work perception because it measures the decency of work at the level of workers’ perceptions. The measurement of decent work perceptions at the micro level is usually conducted through questionnaires, in which workers subjectively evaluate the extent to which they perceive decent work to be achieved. According to the literature review, representative research results are as follows: (1) DWQ developed by Ferraro et al. Based on the definition from the ILO, this scale consists of 31 indexes from the four pillars of employment equity, rights, social dialogue, and social protection [25]. The process of scale development necessitates a solid theoretical foundation and a standardized procedure, thereby requiring further testing to ensure the scale’s appropriateness; (2) DWS developed by Duffy et al. Based on the psychology of working theory from the micro-level, this scale includes five dimensions [42]. They are safe working conditions, security of health care, adequate salary, free time and rest hours, and organizational value [43]. Duffy argues that decent work, shaped by the political, social, and economic environment, is crucial in meeting people’s basic psychological needs, determining their job fulfillment, physical and mental health, and well-being. However, the scale only encompasses a subset of the dimensions of decent work recognized by the International Labor Organization (ILO), thereby disregarding the unique characteristics of diverse groups of workers; (3) DWPS developed by Yan et al. (2023) [27]. Based on decent work perception at the micro-level, DWPS was designed for knowledge workers. Based on grounded theory, this scale includes four dimensions and thirteen items. Job security, resource and support, self-value, and professional silks are the four dimensions. The four dimensions can reflect knowledge workers’ characteristics. However, the sample size needs to be expanded, and there needs to be more consistent testing of the scale in different cultural contexts.
In summary, a literature review shows several instruments for measuring decent work from the macro-level and micro-level. Although these methods have contributed a lot to the decent work literature, there are still some limitations in the existing studies. First, the accurate measurement of decent work at a macro level relies on robust statistical data, typically sourced from Statistical Yearbooks and research reports pertaining to a specific region or country. However, it is important to note that these objective datasets often overlook individual variations in decent work [44]. Second, the existing measurement tools of decent work at the micro-level are complex and inconsistent, making them difficult to recognize and disseminate. Meanwhile, there are too many items on the scales, resulting in low accuracy of subjects’ responses when collecting data through the questionnaire. Third, DWQ and DWS were directly borrowed from established literature or current indicators and lacked a solid qualitative study as a theoretical foundation. Thus, a new, valid, and reliable measurement of decent work perception conducted on a standard scale development procedure needs to be developed.

3. Research Methodology

3.1. Research Philosophy

According to Saunders [45], research philosophy can be classified into positivism, realism, interpretivism, and pragmatism. Interpretivism refers to a study that aims to comprehend the differences among individuals. Such research is often socially constructed and focuses on subjective meanings and social phenomena. Additionally, researchers are an integral part of the subject being studied and cannot be detached from it; therefore, their perspectives will inevitably be subjective. The commonly employed data collection techniques include small sample sizes, in-depth interviews, and qualitative methods. The underlying philosophy guiding this study is interpretivism since perceptions of decent work pertain to individuals’ internal hidden sentiments about their occupation.

3.2. Research Design
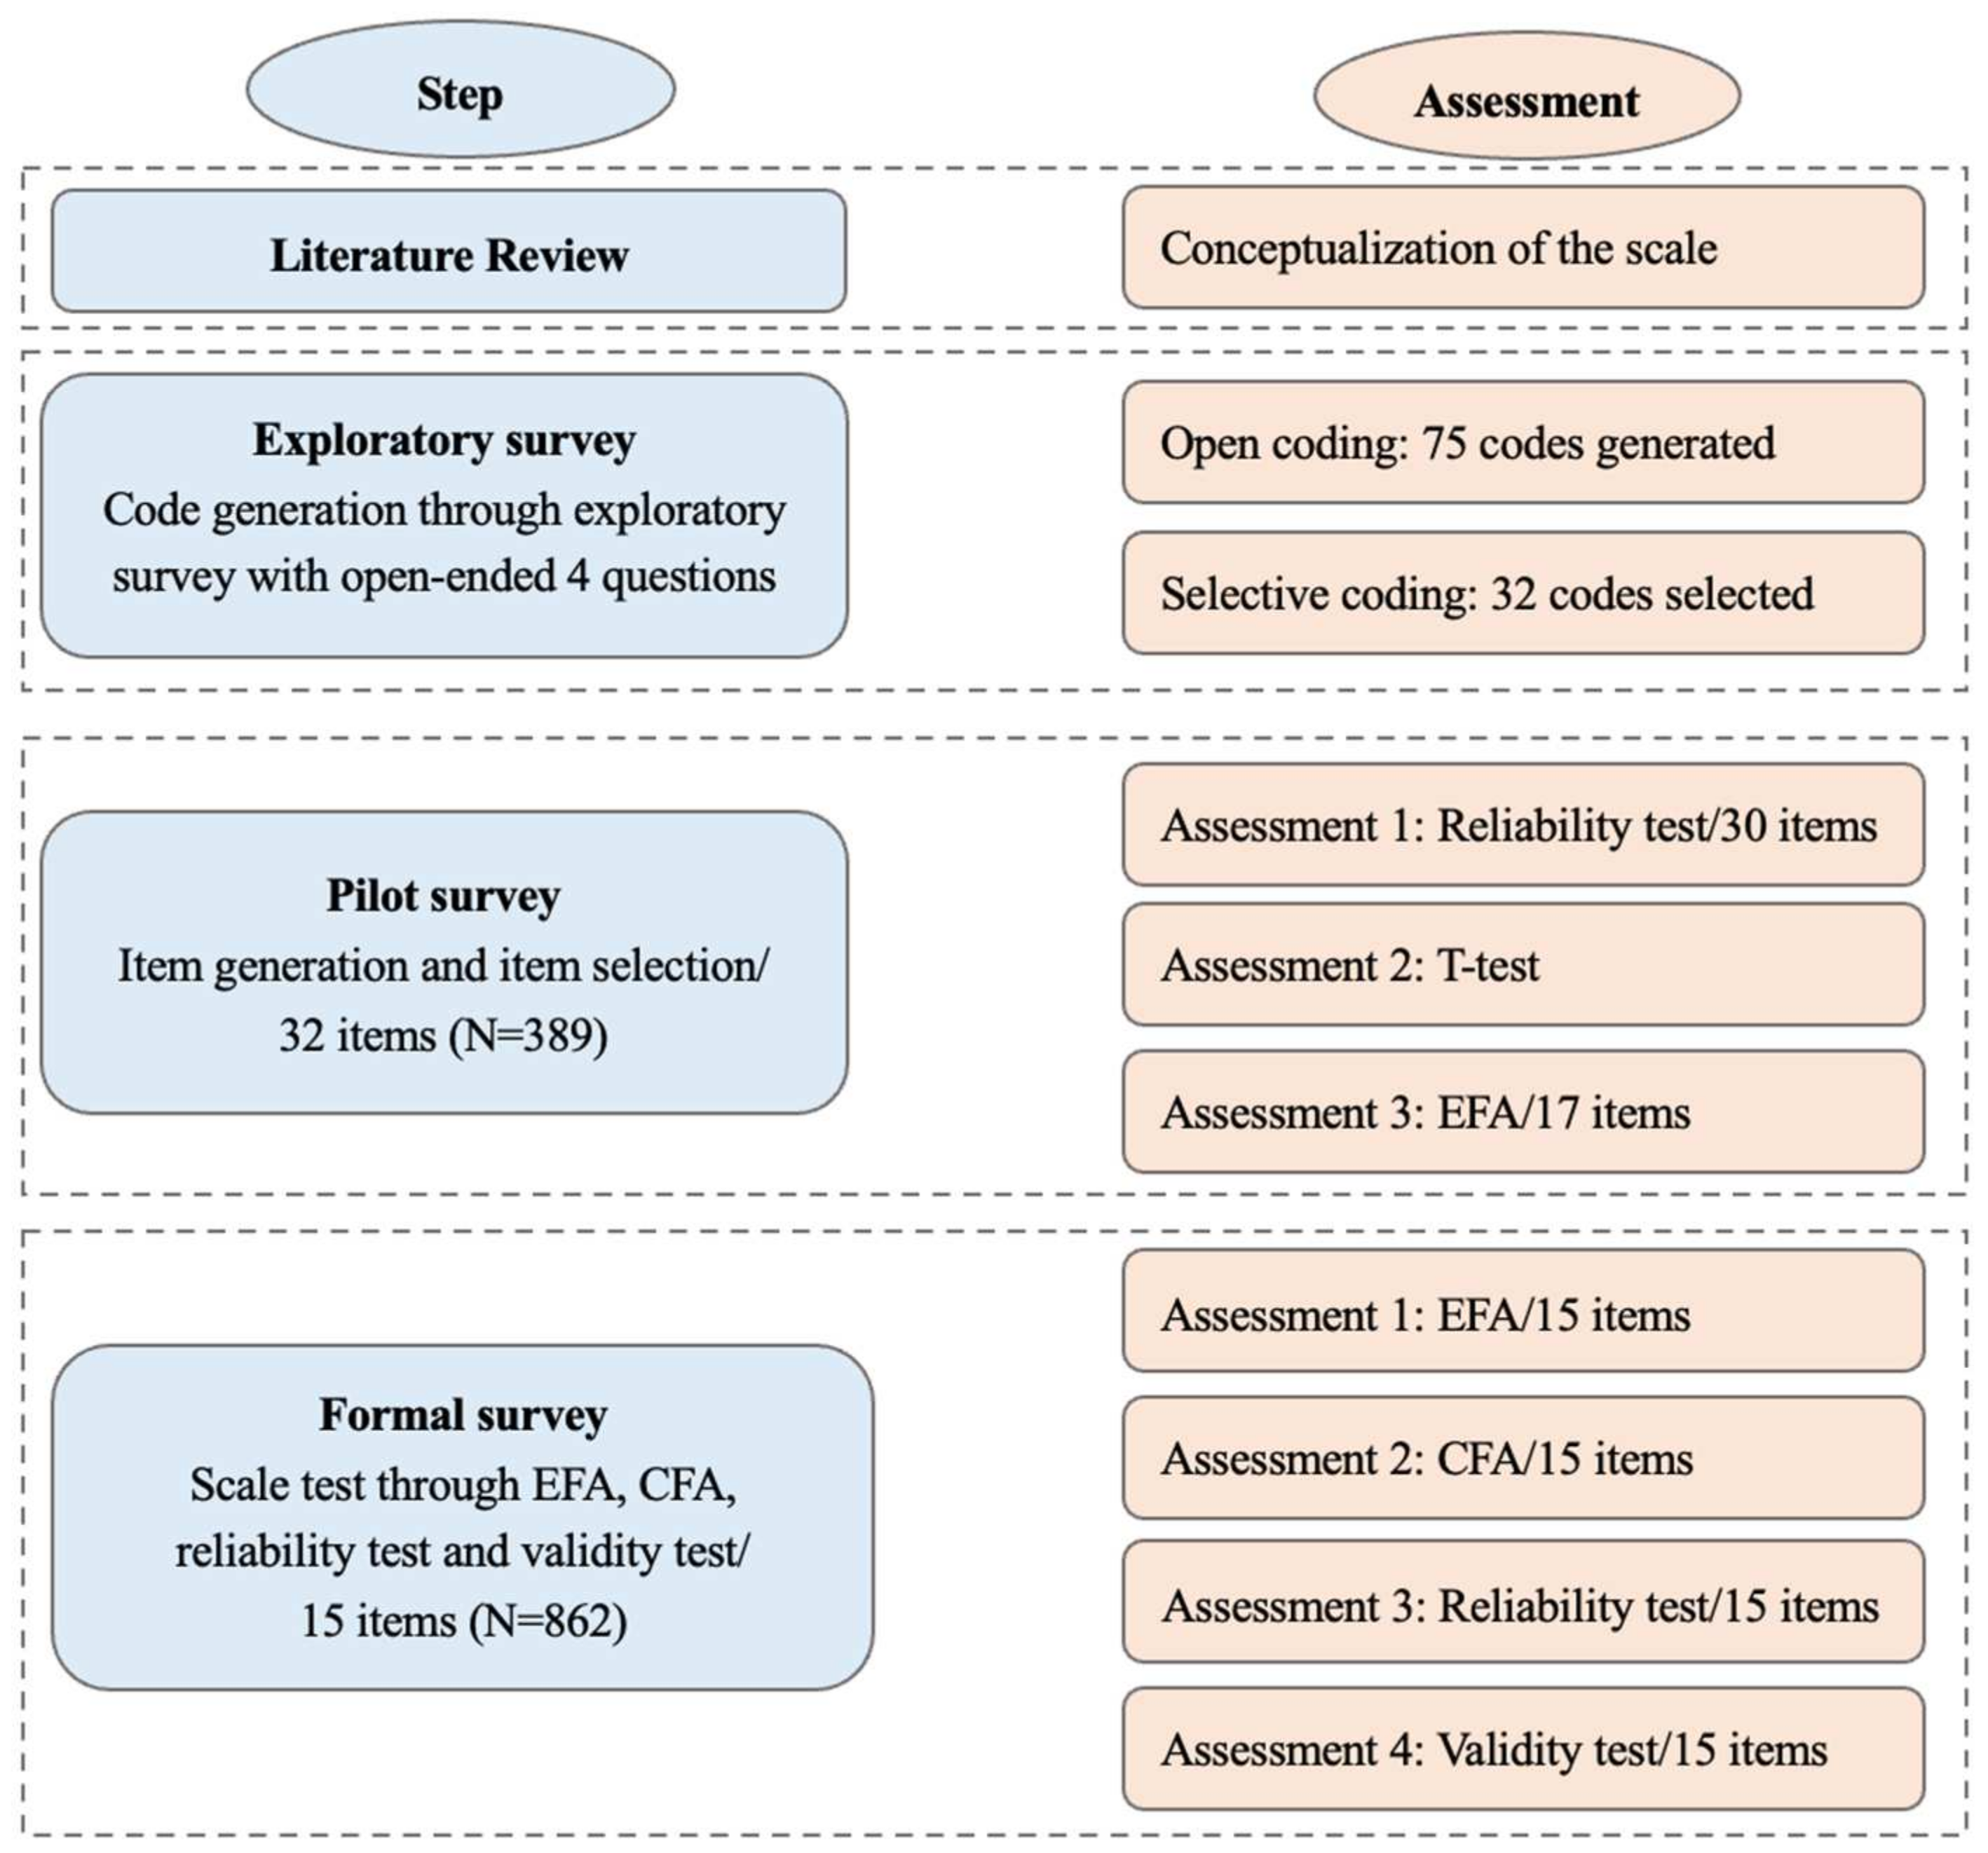
As Figure 1 indicates, the scale development process strictly followed the scale development procedure proposed by Bagozzi et al. [46]. Step 1 is a literature review. We have reviewed the general goal of decent work proposed by the ILO in 1999, which is also the definition of decent work. However, there are macro-level perspectives and micro-level perspectives in decent work measurement. Decent work in this study adopts the micro-level perspective. Therefore, decent work is also called decent work perception. It should be noted that this typology can only be used to build the foundation for decent work perception. Step 2 is an exploratory survey. An exploratory survey is conducted to construct the conceptual framework and create new items for decent work. As a result, a qualitative research method, proposed by Glaser and Holton [47], is required. We conducted semi-structured interviews with thirty participants to answer four questions about decent work. Step 3 is a pilot survey. In this stage, we collected 389 questionnaires and analyzed the data using exploratory factor analysis to screen the items in the pool and verify the scale’s reliability. Step 4 is a formal survey. In this survey, a total of 862 valid questionnaires were collected. The scale was subjected to rigorous testing including exploratory factor analysis, confirmatory factor analysis, reliability assessment, and validity examination.

3.3. Ethics Statement

This research was approved by the Academic Ethics Committee in 2023. The reference code for this admission was 2023051201. The research will not pose any daily risks or provide any direct benefits to the respondents. To some extent, this study can provide evidence for understanding decent work for knowledge workers. It can also provide new ideas for understanding knowledge workers’ current work situation and improving industrial relations. Before the in-depth interview and the survey, the respondents will receive an oral consent form. Meanwhile, the researchers promise that respondent answers will be recorded anonymously and kept in encrypted files. All data will be only be used academically.

3.4. Exploratory Survey

We conducted exploratory surveys to generate codes with in-depth interviews. The in-depth interview was conducted in the following steps. First, the interviewer explained the research purpose and research content to the respondents. Then, the respondents were asked whether they were willing to be interviewed. If the respondents agreed to participate in the interview, they were orally informed about the consent form and confidentiality agreement. Finally, the formal interview began. The interview was recorded and transcribed with the respondents’ consent.
The interview lasted for 60 min and contained semi-structured questions. The interview contained two parts: the introduction questions and the core questions. Introduction questions were: (1) What position do you hold? How long have you been in this position? How long have you worked in this organization? (2) Can you describe the job content of your current position? Core questions were: (1) Which jobs do you feel are decent (please give examples), and why do you feel they are decent? (2) Which jobs do you consider are not decent (please give examples), and why do you believe they are not decent? (3) Do you agree that your current job is decent, and how can you make your current job (more) decent? (4) What characteristics do you think a decent job should have, and why do these characteristics make you feel decent? We identify knowledge workers by the respondents’ job content.

3.4.1. Samples

The target objective of this study is knowledge workers. Knowledge workers, initially proposed by Peter Drucker, are individuals who possess expertise in manipulating and applying symbols and concepts, relying on knowledge and information as the foundation of their professional endeavors. In this study, we specifically recruited knowledge workers with a minimum of a bachelor’s degree, who actively engage in knowledge sharing and creation within their work environment, and primarily perform cognitive tasks rather than physical labor. We recruited 30 respondents to participate in the in-depth interview by releasing information online. After receiving the respondent’s consent to participate in the interview, the academics evaluated the respondent’s age, gender, organization type, tenure, occupation, and other information. Participants will continue the interview only after meeting the above criteria for knowledge workers. The 30 respondents came from 30 organizations in different industries, including real estate, banking, securities, insurance, universities, and government. The respondents’ positions included product managers, human resource managers, teachers, accountants, finance specialists, sales, and administrative personnel. Among them, 18 were male, 12 were female, and their tenures ranged from 3 to 20 years. The demographic character of the sample shows that the respondents are diverse and representative in terms of industry, position, and tenure.

3.4.2. Coding Procedure

After data collection, we used substantive coding methods to analyze the data, including open and selective coding [48]. The results of open coding and selective coding can be found in Appendix A.
Step 1 is open coding. It refers to the coding process of data from the raw materials sentence-by-sentence and line-by-line. Open coding abstracts concepts without omitting critical information. In the open coding process, this study used a manual approach to encode the interview texts of 30 respondents. This was carried out to enhance the extraction of codes by repeatedly organizing, comparing, and analyzing them to eliminate irrelevant and redundant information about decent work. Researchers extracted the codes from the respondent’s description by identifying which aspect of decent work it belongs to. Ultimately, this study identified 877 labels after data analysis of the raw material and further derived 75 codes. We chose the 13 open coding extractions as an example, shown in Table 1. To describe the code abstraction process, we take “realization of self-value” as an example. Representing the 22nd code in the 6th raw materials, original data 06-22 indicated, “I think decent work should allow me to realize self-value and life value.” We identified the code “work can realize self-value” from sentences 06-22. Original data 08-05 stated, “I think the work that reflects their values is the most decent. I particularly admire firefighters”. Original data 20-21 indicated, “I have value, and I will be respected.” Our extracting code was “self-worth can gain respect.” All three original data were related to self-value. We obtained the concept of self-value realization by opening coding.
Step 2 is selective coding. We use selective coding to purify the concepts generated from open coding because the initial information gathered from open coding is ambiguous. Selective coding extracts core concepts by filtering codes, which are more directional, specific, and theoretical [47]. Based on the definition of decent work and the features of knowledge workers, this study deleted concepts with a frequency of less than three. Finally, we extracted 32 items, classified into 5 dimensions (see Table 2), which differs from previous research results. First, we found that knowledge workers understand decent work in terms of social status in the newly conducted survey. They perceive decent work to be related to social status [49], the most recent finding in our survey. As a result, we added the social status dimension to the new decent work structure. Second, we revised respect and support as support and renamed the dimension of professional skills as skills based on the new data.

3.4.3. Coding Results

As a result of the in-depth interviews, this study constructs a structural dimension of the perception of decent work through open coding and selective coding, which is elaborated as follows.
(1) Security. When talking about their understanding of decent work during the interviews, the respondents mentioned that jobs that are not easily dismissed, guarantee income and benefits, are safe in the workplace, match income to effort, and have well-organized systems can be considered decent work. According to respondents, this study extracts financial security, institutional security, and safety as the first dimension of “security,” i.e., financial security, institutional security, and safety that workers can feel at work [26,44,50].
(2) Support. During the interviews, respondents suggested that decent workers should have access to job support from both outside and inside the organization. Support from outside the organization is evident in the fact that the clients and customers served by the work are well educated. Clients and customers can provide job support and assistance from a position of mutual benefit. Intra-organizational support is reflected in organizational support (e.g., being valued by the organization, having power and resources), superior support (receiving help and support from superiors), and co-worker support (having a positive relationship with co-workers). In line with this, this study extracts internal and external organizational support into the second dimension, “support,” i.e., workers can feel diversified support from outside and inside the organization at work [2].
(3) Skills. According to the respondents’ replies, decent work should also be reflected in individual professional skills, job requirements, and work ethics. First, an individual’s professional skills should be applied to the working process, which is not easily replaced by machines and artificial intelligence (AI). Second, the work needs to be innovative and challenging and able to meet complex work requirements. Finally, decent work requires good professional ethics and qualifications. In line with this, this study extracts professional skills, job requirements, and professional ethics as the third dimension of “skills” [44,51,52].
(4) Self-value. In the in-depth interviews, the respondents suggested that decent work should encompass self-determination, work autonomy, and development opportunities for knowledge workers. Knowledge workers’ self-determination refers to their ability to create and realize value at work and the resulting sense of accomplishment and pleasure. Job autonomy means knowledge workers have autonomy over work time and empowerment from leaders, which stimulates creativity. Third, development opportunities refer to identifying opportunities and effectively utilizing opportunities to improve employability. As a result, this study extracts self-determination, work autonomy, and development opportunities as the fourth dimension of perceived decent work “self-value” [26,53].
(5) Social status. The respondents believed that decent work’s social status should be reflected in three aspects: social image, work image, and personal image. To enhance the social image, the work should be legal, and the organization should enjoy an excellent societal reputation. The image of a person should be reflected in his or her occupation, work content, and workplace image. Regarding personal image, the implementation of decent work can facilitate employees in acquiring recognition, respect, and job satisfaction throughout the work process. In line with this, this study defines the fifth dimension of decent work as “social status,” inducing the ability of workers to obtain a sound social image, work image, and personal image through their work [49,54].

3.5. Pilot Survey

The pilot survey was two-sided: item generation and selection. Based on the 5S structural dimensions of knowledge workers’ perception of decent work, the researchers developed declarative sentences as the initial question pool. This was achieved by combining in-depth interviews and related literature. To ensure content validity, we invited two scholars specializing in human resource management to classify the initial question items back-to-back. The categorizing principle is “whether this item is related to its dimension”. If two experts categorize the question items in the same way, they were identified as measurement questions. If the question was not categorized consistently, the two experts discussed deleting or adjusting its categorization until all questions were organized consistently. Subsequently, we started with another round of evaluation on the principle of “no semantic overlap.” We merged or deleted the overlapping questions. After further purification, 32 items were retained.

3.5.1. Participants Selection

In this study, we developed an initial questionnaire using a 5-point Likert scale. The options for each question included “1 strongly disagree”, “2 disagree”, “3 neutral”, “4 agree”, and “5 strongly agree”. The questionnaires were distributed through an online platform, Questionnaire Star. The researcher set an RMB 1 bonus for each questionnaire as feedback to the survey participants. Based on the standards we followed, we selected a valid questionnaire. First, a knowledge worker should have a bachelor’s degree or above. Second, the response time should be more than one minute. Third, there are at most five consistent responses. All participants were sent a written consent form before taking the online survey. If participants agreed with the consent form, the survey could proceed.
The pilot survey was distributed over ten days from 5 July to 15 July 2023. We collected 480 questionnaires, and 389 were valid. The valid rate is 81.04%. According to the demographic statistical analysis, males were 42.4%, and females were 57.6%. The percentage of those aged 25 years and below was 8.8%, 26.8% aged 26–35 years, 37.1% aged 36–45 years, and 27.3% who were 46 years and above. The percentage of those with an education level of college or below is 11.7%, with a bachelor’s degree at 36.6%, a master’s degree at 27.3%, and a doctoral degree at 24.4%.

3.5.2. Data Analysis

Step 1: Reliability test for the initial scale. The initial question items were purified according to the following standards: (1) CICT is not significant. We should eliminate the items with a CICT value less than 0.50. Thus, S53 was deleted with a CICT value of 0.402; (2) Cronbach’s α after deleting an item is higher than the overall Cronbach’s α without deleting any item [55]. We deleted S31 because Cronbach’s α after deleting the item is 0.933, higher than the dimensional Cronbach’s α 0.932 (see Table 3). Ultimately, we retained 30 questions. Each dimensional Cronbach’s α is higher than 0.7, indicating an adequate internal reliability. It is noted that the reliability tests were carried out at the 95% significance level.
Step 2: T-test. The 27% cutoff was used as a grouping boundary. We ranked the first 27% of the scale total score in the sample data as the highest subgroup and the final 27% as the lowest subgroup. Each group had 105 questionnaires. We compared differences between the two extreme groups. The participants’ replies to one specific question significantly differed between the two groups when the p-value was lower than 0.05, indicating that the question distinguishes different groups. Therefore, questions with a significant p-value should be retained. If not, the questions should be deleted. According to the t-test results between the extreme groups, all questions have a significant p-value, indicating that they are well-identified. Therefore, all questions are retained.
Step 3: EFA of the initial scale. First, we conducted KMO and Bartlett tests to examine whether the initial scale was suitable for EFA. KMO is 0.969, and Bartlett’s p-value was significant, indicating common factors among the questions. Second, we constructed Principal Component Analysis (PCA). We set five common factors extraction rules and applied orthogonal rotation using the maximum variance method. The results of EFA revealed low loadings, multi-loadings, and misallocation (see Table 4). Therefore, we screened the questions for each situation. We deleted S15, S51, and S52 because the loadings on any factor were lower than 0.5. Multi-loading occurred when the question item loaded on both factors with a value greater than 0.5. As a result, we eliminated S13, S36, and S47 because of multi-loading. The misallocation of loadings indicates that the item did not exhibit loadings exceeding 0.5 on the predetermined factors, but instead demonstrated loadings surpassing 0.5 on alternative factors. We deleted S16, S24, S25, S26, S34, S44, and S54 because of misallocation. Finally, we kept 17 question items as the final scale with loadings higher than 0.5 on each factor. This indicates that the extracted common factor explained the measured variables well.
It should be noted that the fifth factor was originally named social status and contained three components: social image, work image, and personal image. However, according to the EFA, the final retained items were all related to personal image. This indicates that knowledge workers value self-esteem, recognition, and satisfaction. Thus, we renamed the fifth dimension as self-esteem. The results also indicated that knowledge workers were eager for inner spiritual desire, which differed from other workers.

3.6. Formal Survey

3.6.1. Data Collection

A formal survey was conducted to verify the reliability and validity of the scale through EFA, CFA, and reliability and validity tests. The questionnaire was distributed from 1 to 15 September 2023, on the online platform Questionnaire Star. The distribution of this questionnaire took one and a half months, and 969 questionnaires were collected. All participants were sent a written consent form before taking the online survey. Participants could proceed with the survey if they agreed to the consent form in advance. Finally, there were 862 valid questionnaires, and the validity rate of the questionnaires was 88.96%.

3.6.2. Descriptive Statistical Analysis

This questionnaire was distributed to a large number of subjects in order to ensure a wide range of sample sizes and distributions. Descriptive statistical analysis shows the sample consisted of 42.1% males and 57.9% females. In terms of education, 9.9% had a college degree or less, 57.7% had a bachelor’s degree, 22.0% had a master’s degree, and 10.4% had a PhD. More than 90% of the samples had a bachelor or higher, which is identical with the definition of knowledge workers as defined in the study. The age distribution is mainly concentrated in 26–45 years old, of which 26–35 years old accounted for 49.8%, and 36–45 years old accounted for 30.2% (see Table 5). These data show that knowledge workers are predominantly middle-aged and young, which is in line with the inverted U-shape curve of human capital. The distribution of tenure is more dispersed; 6.7% are below 0.5 years, 6.8% are between 0.5 and 1 year, 21.5% are between 1.01 and 3 years, 16% are between 3.01 and 5 years, 18.4% are between 5.01 and 10 years, and 30.5% are more than 10 years. There is a wide range of tenure among samples, which indicates that knowledge workers are more loyal to careers than to organizations. The industry distribution of the sample covers banking (22%), insurance (31.4%), securities and investment (5.7%), communications and the internet (3.9%), education and training (24.2%), and smart manufacturing (2.7%). These industries are strategic emerging industries that have been vigorously developed by the Chinese government in recent years, attracting many knowledge workers. In terms of the distribution of the organization type, private enterprises accounted for 11.4%, state-owned enterprises accounted for 36.4%, government departments accounted for 19.7%, public services accounted for 17.4%, and foreign-funded enterprises accounted for 10.6%. The sample covered all different types of organizations.

3.6.3. Exploratory Factor Analysis (EFA)

We conducted an EFA on the formal questionnaire utilizing SPSS 26.0. First, we conducted KMO and Bartlett tests to clarify whether the data were suitable for EFA. Research results showed that KMO was 0.949, and the Bartlett test result of χ2 was 10,603.080, indicating that common factors existed among the items. The overall variance explained was 78.046%. Second, we used PCA to extract factors. We set five common factors extraction rules and applied Promax rotation. The results are shown in Table 6. We deleted S35 and S46 as they were misallocated. Professors from human resource management were consulted to confirm the dimensions and items that were misloaded. The experts suggested that S35 and S46 should be deleted because the item content was inconsistent with the loaded dimensions. As a result, we retained 15 items with loadings higher than 0.5 on each factor. Therefore, this study constructed the 5S dimensions of decent work perception as follows.
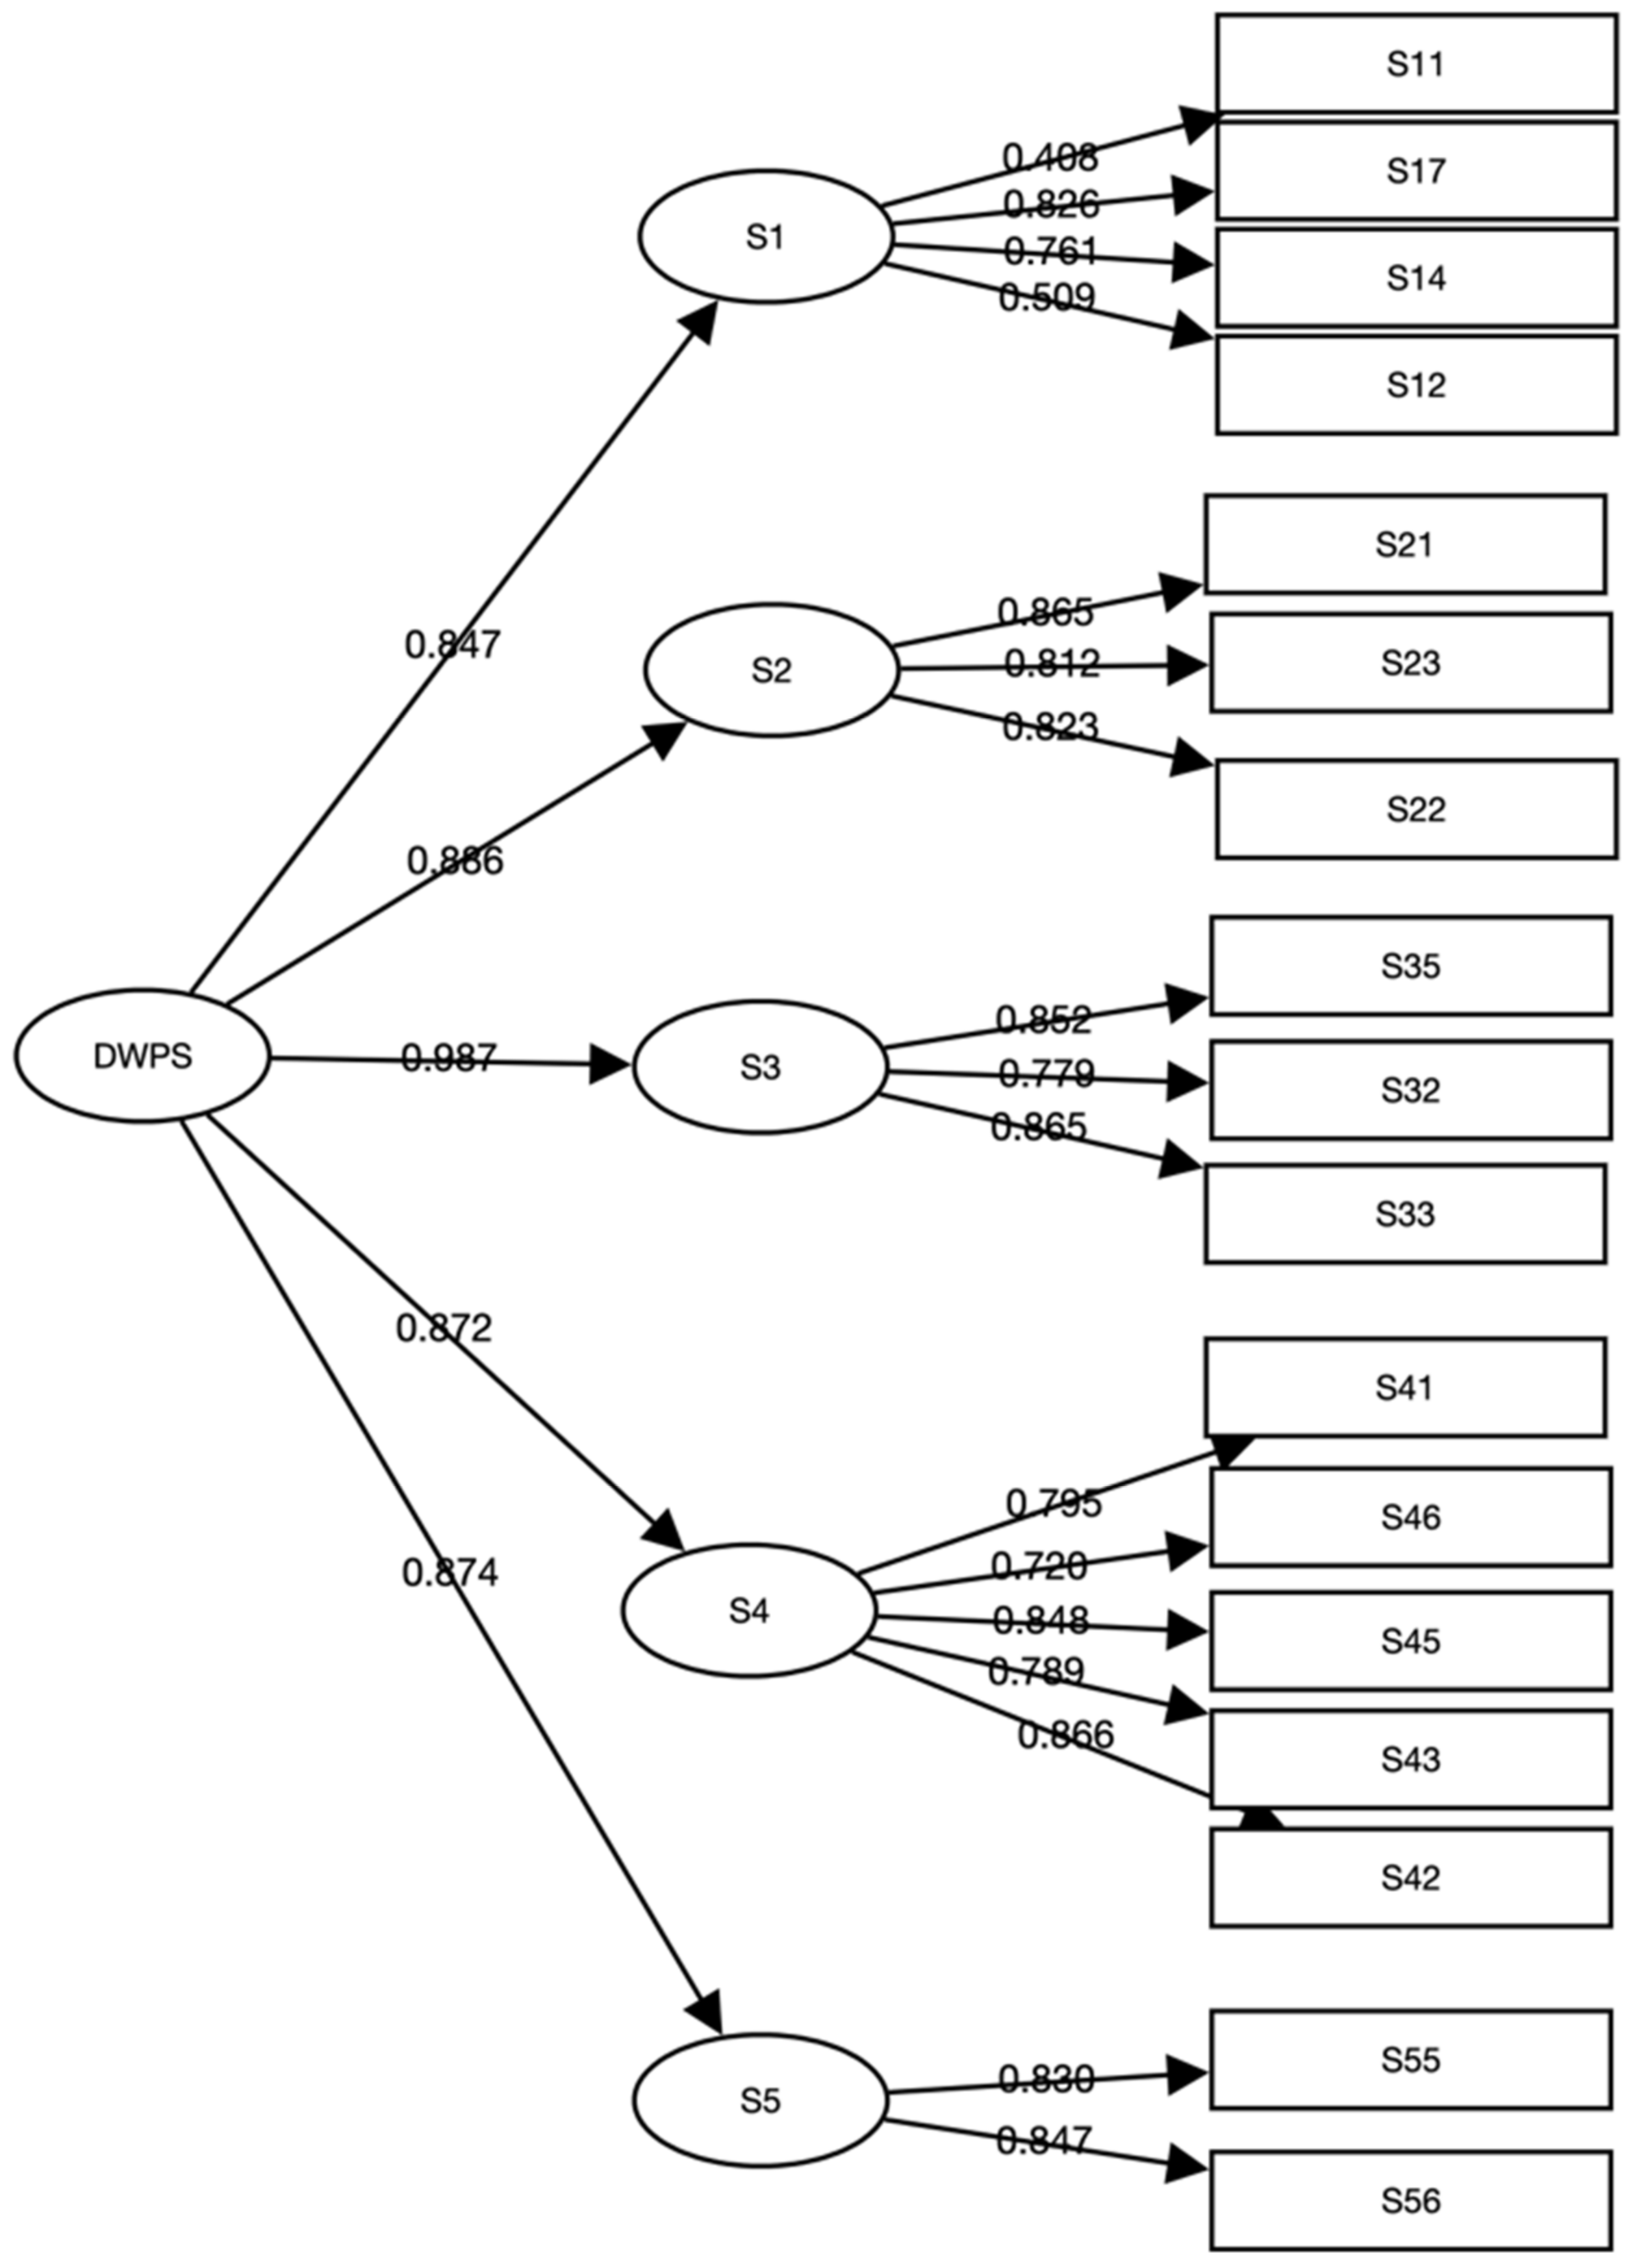
(1) S1 is security, including four items. They are “The job is secured”, “The income is secured”, The job is safe and secured”, and “One should feel equitable about the distribution system”.
(2) S2 is support, consisting of three items. They are “One can be respected by the organization”, “One should have resources and power at work”, and “One can get support and help from work”.
(3) S3 is self-value, including two items. They are “The job helps one realize his or her self-value” and “The job helps one create value”.
(4) S4 is skills, containing four items. They are “The job requires high competence,” “The job is creative”, “The job requires specialized skills and knowledge”, and “The job is challenging”.
(5) S5 is self-esteem with two items. They are “One can be respected and recognized for the job” and “One can be respected and satisfied with the job”.

3.6.4. Confirmatory Factor Analysis (CFA)

We used CFA to verify whether the 5S structure of decent work perception matches the formal survey data. We propose five test models as shown below:
M1: Single factor model means the 5S share the same latent variable (security + support + self-value + skills + self-esteem).
M2: The two-factor model means security, support, and skills share the same latent variable, while self-value and self-esteem share the same latent variable.
M3: The three-factor model suggests that security, support, and skills share the same latent variable, while self-value and self-esteem have separate latent variables.
M4: The four-factor model proposes that security and skills share the same latent variable, while support, self-value, and self-esteem have separate latent variables.
M5: The five-factor model hypothesizes that security, support, self-value, skills, and self-esteem all have their own latent variables.
We analyzed the data for model fit through the SPSSAU online statistical software platform (https://spssau.com). Results showed that M5 was the highest performing model among the five models, with χ2 of 1226.025; GFI, RMSEA, RMR, CFI, and NFI were 0.859, 0.106, 0.045, 0.895, and 0.885, respectively (see Table 7). GFI, CFI, and NFI are close to 0.9, RMSEA is close to 0.1, and RMR is less than 0.1, indicating that the five factor structure is well fitted with the data. CFA path coefficients are shown in Figure 2.

3.6.5. Reliability Test and Validity Test

We utilized Cronbach’s α to test the overall reliability of the scale and CR to test the reliability of each dimension. Research results showed that Cronbach’s α was 0.944, indicating significant scale reliability. Meanwhile, 5S CR was 0.731, 0.872, 0.871, 0.902, and 0.826, respectively, indicating that each dimension was reliable. This shows that the whole scale and each dimension have high reliability.
Validity tests are examined for content and structural validity. Content validity is a test of measured items’ appropriateness. This study used qualitative research methods and expert consultation to ensure content validity and accuracy. We began by clearly defining the content of each topic on decent work perception according to the literature and in-depth interviews. Then, two experts in human resource management conducted a back-to-back review of the clarity and appropriateness of the language expression. Ultimately, the questionnaire was ensured to be of high content validity through a literature review, in-depth interviews, and expert review.
Structural validity is generally evaluated in terms of convergent and discriminant validity. AVE and CR usually examine convergent validity. An adequate convergent validity indicates that AVE is greater than 0.4 and CR is greater than 0.7. As can be seen from Table 8, the CR of each dimension is 0.731, 0.872, 0.871, 0.902, and 0.826, respectively. All of them are greater than 0.7.
Furthermore, the AVE of the five dimensions is 0.422, 0.695, 0.693, 0.648, and 0.703, respectively. All are greater than 0.4, indicating good convergent validity. An effective discriminant validity indicates that the AVE square root for each factor is greater than the maximum correlation coefficient between that factor and the other factors. Table 9 shows that the square roots of AVE are 0.649, 0.834, 0.833, 0.805, and 0.839, respectively. These values are significantly higher than the maximum value of the correlation coefficients. Therefore, the scale has an excellent discriminant validity.

4. Discussion

This research addresses a significant gap in the measurement of decent work at an individual level by proposing a novel conceptual framework, known as the 5S framework, specifically designed for knowledge workers. Furthermore, it lays the foundation for a comprehensive decent work framework that can be applied to various employee categories in different regions and countries. Additionally, this paper introduces a multidimensional scale to assess knowledge workers’ perception of decent work and examines its validity and reliability.
The findings of this study once again validate that the primary objective of decent work, safety and security, remains the paramount concern across diverse categories of workers. DWS with five dimensions and DWQ with seven indicators are both helpful for assessing decent work [26,40], emphasizing the importance of ensuring the occupational safety and job security of employees. Consistent with the conceptualization of DWS and DWQ, this study examines the security, support, and skills dimensions to ascertain that security and safety form the core components of decent work. The security dimension ensures the satisfaction of workers’ physical needs through the attainment of an adequate income [29]. The support from organization and professional skills enhances employment safety in the labor market [56].
This paper contributes the self-esteem dimension to the measurement of decent work for knowledge workers. Although DWPS has developed a four-dimensional model for knowledge workers, including job security, respect and support, self-value, and professional skills [27], the model does not account for the pursuit of work meaning among knowledge workers [42]. Consequently, the utilization of DWPS impose limitations on the assessment of decent work among knowledge workers. The inclusion of self-esteem in the measurement of decent work, as presented in the 5S model of this study, represents a significant advancement towards understanding the concept of decent work for knowledge workers. Self-esteem can be conceptualized as the level of self-esteem based on the organization and work activities. Employees’ perception of decent work is influenced by the inherent dignity associated with their organizational membership and job responsibilities. Previous research has demonstrated that the self-esteem of individuals, based on organization and work, significantly influences knowledge-sharing behavior and employee well-being among knowledge workers [57,58]. Therefore, the introduction of self-esteem enhances the comprehensiveness of measuring decent work.
This paper redefines the dimension of self-value in decent work. As indicated in the DWPS, the dimension of self-value encompasses a knowledge worker’s perception of autonomy within their work environment, their ability to create value, and the sense of accomplishment derived from their professional endeavors [27]. The concept of self-value in DWPS focuses solely on value creation, while disregarding the importance of value realization. However, value creation and realization are the key process in the knowledge management [59]. The self-value dimension in this study is defined as the process of cultivating and actualizing a sense of self-value experienced by knowledge workers within their professional roles, which is consistent with the conceptualization of knowledge management. The distinct dimension of self-esteem and redefined dimension of self-value reflect the unique perception of knowledge workers towards decent work, thereby enhancing the precision in measuring decent work.

5. Conclusions and Applications

5.1. Conclusions

According to Blustein et al. [42], there is a tendency to understand decent work through the meaningfulness of the work from individual perception. In the VUCA era, organizations and employees face volatility, uncertainty, complexity, and ambiguity. As a core asset of the organization, knowledge workers play a vital role in the VUCA era [60]. However, comprehensively developing an individual measure of decent work on the traditional definition and perception of decent work is challenging. Despite this, relying on knowledge workers’ views can be a more reliable way of measuring decent work than alternative methods. In the current study, a new measure of decent work perception was obtained based on the view of knowledge workers. After an elaborate scale development process, we construct the 5S dimensions of decent work perception with 15 items. The 5S dimensions are security, support, self-value, skills, and self-esteem, and the corresponding items are shown in Figure 3 and Appendix B.

5.2. Theoretical Applications

The results of this research can be applied to theoretical studies in the following ways.
(1) The scale can be used to measure decent work for knowledge workers, specifically self-value and self-esteem. Previous studies on decent work measurement tools at the micro-level have focused on the PWT. The scale developed by PWT has been tested for reliability and validity in groups such as black Americans, low-income groups, and urban workers [61,62,63]. However, knowledge workers are more eager to obtain spiritual satisfaction and recognition than other workers. Consequently, the 5S structural dimensions of self-value and self-esteem developed in this study can reflect knowledge workers’ need for a spiritual dimension in their careers. Thus, this scale can help researchers measure knowledge workers’ decent work on self-value and self-esteem.
(2) This scale can be used to compare whether and to what extent there are differences in security, support, and skills among different workers. In decent worker index bundles at the macro-level, previous studies have validated the dimensions of security, support, and skills in various groups of workers [2,64]. Like previous research, this study confirmed the importance of security, support, and skills for decent employment. This finding reconfirms the ILO’s 1999 decent work goal of improving fair and productive work for workers of all genders [29]. Security and support are embodied in decent work, while skills are embodied in productive work opportunities. Therefore, the scale developed in this study can be used to compare the difference between knowledge workers and other types of workers on security, support, and skills.
(3) The scale also provides insight into the relationship between decent work and employee attitudes and behavior variables. These variables include work engagement, organizational commitment, intrinsic motivation, occupational skill enhancement, and innovation ability and behavior. Variable relationship research can help researchers understand motivational factors behind work attitudes and behavior. This can achieve a win-win situation for both workers and the organization. The organization can enhance organizational creativity and workers can gain well-being simultaneously, realizing bi-directional coupling development of the organization and workers.

5.3. Practical Applications

In practice, these research results can be applied as follows.
(1) The scale can be used as a practical tool for government departments to evaluate and monitor how much decent work has been achieved, thus promoting society’s sustainable development [24]. It should be noted that the scale development is based on respondents’ subjective self-report, and rating scores are inevitably affected by the personal expectations of respondents. Combined with the objective indicator system, this scale can help public organizations and governments understand workers’ subjective psychological situation. It is possible for public organizations and governments to compare decent work within different groups, demonstrating progress in relevant economic and social governance as well as shortcomings.
(2) Self-value and self-esteem, the dimensions specific to decent work for knowledge workers found in this study, can serve as tools for business managers to recognize employee needs and motivate employees. Knowledge workers are more focused on spiritual fulfillment through work than other types of employees. Therefore, understanding the current situation and deficiencies of knowledge workers’ spiritual needs is a basis for compelling motivation. The scale is developed in a self-report manner, which measures knowledge workers’ feelings about self-value and self-esteem. Supplemented with in-depth interviews and semi-structured questions, this scale can help business managers understand the needs of knowledge workers regarding self-value and self-esteem and then effectively motivate employees by fulfilling their needs.

6. Limitations and Directions for Future

The study’s limitations are as follows: (1) The sample was only validated on Chinese knowledge workers and did not involve samples from other countries. Due to the researcher’s time and budget constraints, the study only sampled within China, resulting in some sample selection limitations; (2) The 5S model was not compared with other work attitudes variables. This study’s dimensions of self-value, support, and self-esteem overlap with the dimensions of job satisfaction, well-being at work, and work meaningfulness. Due to time and energy constraints, this study did not establish a correlation validity test to differentiate between decent work perception and job satisfaction, well-being at work, and work meaningfulness.
Researchers can select samples of knowledge workers in multiple countries and regions to validate the questionnaire and revise the model in future research, which will significantly improve the questionnaire’s universality. Researchers can also compare and analyze decent work perception with job satisfaction, well-being at work, and work meaningfulness, which can define decent work clearly and lay a theoretical foundation for studying the antecedents and outcomes of decent work.

Author Contributions

Conceptualization, Y.G.; Methodology, Y.G.; Validation, Y.G.; Software, Y.Y.; Data Computation, Y.Y.; Data Management, E.L.; First Draft Writing, Y.Y.; Writing Review and Editing, Y.G. and J.G.; Reviewing, Y.Y., X.J. and J.G.; Research Visualization, X.J.; Letter of Credit Issuance and Supervision, Y.G.; Project Management, Y.G. All authors have read and agreed to the published version of the manuscript.

Funding

This research was funded by Education and Scientific Research Project of Shanghai (C2024248), Shanghai Dianji University for Project Teaching (A1-5101-22-003-08-153), Shanghai Dianji University for postgraduates’ education (A1-0225-23-011-02-012), Shanghai Key Curriculum Construction Project (Micro-economics).

Institutional Review Board Statement

This study was conducted in accordance with the declaration of Helsinki and approved by the Ethic Committee of Business School of Shanghai Dianji University.

Informed Consent Statement

Informed consent was obtained from all subjects involved in the study.

Data Availability Statement

Data will be provided upon request.

Conflicts of Interest

Author Enzhong Lin is employed by the company Huizhixin Management Consulting Co., Ltd. The authors declare no conflicts of interest.

Appendix A. Results of Open Coding and Selective Coding

ConceptCode ExtractionRaw Data of Labels (Examples)
SecurityJob security22-36 The job is stable; 23-24 The job should be with relatively higher stability; 24-49 Decent work sounds like it should be kind of peaceful and stable……
Income security17-29 Economic income should fall under the category of decent work; 21-33 At least you’ll be able to live without worrying.……
Work safety21-11 Work that gives others a sense of security is decent work……
Benefit security02-09 Decent work should include employee welfare; 23-04 The job is relatively better paid than in manufacturing and logistics; 23-15 It should include good protection, such as insurance and pension……
Institutional security09-18 There is a relative fairness in the system in terms of distribution; 09-25 Since our current assessment amounts to a one-size-fits-all system, I feel that there is a problem with this system……
Adequate income13-02 What you give is what you get; 17-02 The labor and the benefits should be proportional……
Fair and equity08-16 It’s not a decent job if it’s not fair; 08-20 It’s fair and just; 13-06 Teachers may feel that these inequalities reflect a sense of undignified work……
SupportPleasant working environment16-08 Work in a high-end office building; 17-20 Have a better working environment; 23-11 Not too dirty, not too tired.……
Respect07-04 I have the respect and cooperation of over 100 teachers; 10-17 That’s probably because these are the more respected professions; 11-05 Teaching is a more respected profession……
Favorable working atmosphere03-29 If the relationship with coworkers and supervisors is not good, then the job will not be performed well; 14-07 The work environment and interpersonal relationships will reflect the decency of the job……
Power and resource16-16 Additional resources were obtained; 17-18 Decent working people should have a lot of social resources; 25-05 Civil servants, by virtue of their authority, are able to demonstrate decency in their work……
Well-educated clients02-11 Customers should be educated; 09-04 The quality of the client can also reflect the decency of the work……
Assistance and support07-04 Decency is demonstrated by being able to get some help from colleagues in the work process; 09-15 My leader is very supportive.……
Self-valueAutonomy and freedom01-13 Autonomy of work, e.g., freedom from constraints; 02-10 High degree of time freedom; 24-58 To give people enough sense of freedom……
Realizing the value06-22 Opportunity to realize the value of your life; 08-05 I think it’s the most decent job to be able to show your values; 20-21 I have value and I will be respected.……
Creating the value12-02 Also bring some value to the business; 20-20 Decent work should be able to create value for society……
Physical and mental pleasure03-30 It takes a more pleasant environment to facilitate the work; 08-03 I think decent work is good for the body and mind.……
High achievement17-12 Get a sense of fulfillment; 22-28 Personally, I feel that having a sense of accomplishment is very decent; 22-39 Feeling accomplished is a decent thing to do……
Opportunities for growth17-23 Being able to offer some training; 23-18 A chance to get promoted would be more decent; 26-27 The company will give you many opportunities to learn and grow……
SkillsHigh demand of work ability22-21 The job can Improve one’s professional skills; 24-65 The job can make your skills even better……
High demand of innovation25-34 A decent job would be to be innovative, I guess; 27-02 Be able to do creative work……
Professional knowledge and skills03-01 I think being able to bring more knowledge to people; 03-02 Let’s say it’s a bit challenging; 03-10 They are exposed to things on a daily basis that require them to apply their knowledge of finance.……
Good work ethics08-14 For example, government officials should act in the interest of the people in their work; 21-13 First of all, character; 21-45 There is craftsmanship in all walks of life……
Challenging work03-04 Challenging job; 06-11 His job content has some challenges, such as the realization of customer claims is difficult……
Irreplaceable work20-13 Then there’s scarcity; 12-08 The kind of work that can be easily replaced by others or by AI is not decent work; 25-08 highly valuable due rarity……
Utilization of talent27-17 Individual talents can be put to good use……
Social statusWork image03-05 The kind of feeling given by people with good appearance should be better; 03-10 It’s important to dress well and look good every day; 03-14 People who don’t pay much attention to their appearance in public don’t look very comfortable.……
High social status12-02 Social acceptance will be a little higher, while bringing some value; 13-09 of course social acceptance is the best……
Legal work23-12 Indecent work, such as fraudulent and illegal work; 24-26 It’s certainly not decent to cheat……
Good employer reputation02-07 Our bank’s training, income, and growth are okay, and the platform, if you will, is relatively large; 23-20 The reputation of the company also reflects the decency of the work.……
Respect and esteem20-12 The more economically valuable a job is, the more it is valued and respected; 22-19 China is now paying more attention to auditing……
Recognition and fulfillment03-38 Maybe I think I’m more focused on some inner fulfillment; 25-03 Decency is all about job satisfaction.……

Appendix B. 5S Model for Knowledge Workers

Items
The job is stable.
The income is secured
The job is safe and secured.
One should feel equitable about the distribution system.
One can be respected by the organization.
One should have power and resources at work.
One can get help and support in my work.
The job helps one realize his or her self-value.
The job helps one create value.
The job requires high competence.
The job is creative.
The job requires specialized skills and knowledge.
The job is challenging.
One can be respected and recognized for the job.
One can be satisfied with the job.

References

  1. Magalhães, A.; Dos Santos, N.R.; Pais, L. Human resource management practices and decent work in UN global compact: A qualitative analysis of participants’ reports. Soc. Sci. 2024, 13, 56. [Google Scholar] [CrossRef]
  2. Cooke, F.L.; Xu, J.; Bian, H. The prospect of decent work, decent industrial relations, and decent social relations in China: Towards a multi-level and multi-disciplinary approach. Int. J. Hum. Resour. Manag. 2019, 30, 122–155. [Google Scholar] [CrossRef]
  3. Grishnova, O.; Brintseva, O. Decent work and human development: Interrelation and interdependence. Econ. Educ. 2016, 1, 44–49. Available online: http://www.baltijapublishing.lv/index.php/econedu/article/view/1087 (accessed on 10 October 2023).
  4. Zhang, Z. A Survey Report on Workplace Behavior and Fatigue, China Daily. Available online: https://baijiahao.baidu.com/s?id=1624346814382705153&wfr=spider&for=pc (accessed on 1 November 2018).
  5. Liu, B.; Chen, H.; Yang, X.; Hou, C. Why work overtime? A systematic review on the evolutionary trend and influencing factors of work hours in China. Front. Public Health 2019, 7, 343. [Google Scholar] [CrossRef]
  6. Fontinha, R.; Easton, S.; Van Laar, D. Overtime and quality of working life in academics and nonacademic: The role of perceived work-life balance. Int. J. Stress Manag. 2019, 26, 173. [Google Scholar] [CrossRef]
  7. Ko, Y.J.; Choi, J.N. Overtime work as the antecedent of employee satisfaction, firm productivity, and innovation. J. Organ. Behav. 2019, 40, 282–295. [Google Scholar] [CrossRef]
  8. Yang, S.; Chen, L.; Bi, X. Overtime work, job autonomy, and employees’ subjective well-being: Evidence from China. Front. Public Health 2023, 17, 1077177. [Google Scholar] [CrossRef] [PubMed]
  9. Zhao, L.; Wu, L. How does digital office affect overtime through job autonomy in China? A nonlinear mediating model for the autonomy paradox. Technol. Soc. 2023, 72, 102181. [Google Scholar] [CrossRef]
  10. Lv, X.; Ji, Y.; Que, X.; Qing, T.; Yang, Y. Dual-squeeze effect: How job demands fuel overwork and its consequences in the context of hospitality. Curr. Issues Tour. 2023, 26, 2265–2283. [Google Scholar] [CrossRef]
  11. Huang, H.; Xia, X.; Zhao, W.; Pan, X.; Zhou, X. Overwork, job embeddedness and turnover intention among Chinese knowledge workers. Asia Pac. J. Hum. Resour. 2021, 59, 442–459. [Google Scholar] [CrossRef]
  12. De Clercq, D.; Pereira, R. Knowledge-sharing efforts and employee creative behavior: The invigorating roles of passion for work, time sufficiency and procedural justice. J. Knowl. Manag. 2020, 24, 1131–1155. [Google Scholar] [CrossRef]
  13. Geng, Y.; Xiang, Q.; Gao, J.; Yan, Y.; Li, J. Progress and framework of clean energy production: Bibliometric analysis from 2002 to 2022. Energy Strategy Rev. 2024, 51C, 101270. [Google Scholar] [CrossRef]
  14. Geng, Y.; Liu, L.; Chen, L. Rural revitalization of China: A new framework, measurement and forecast. Socio-Econ. Plan. Sci. 2023, 89, 101696. [Google Scholar] [CrossRef]
  15. Wachter, T.V. The persistent effects of initial labor market conditions for young adults and their sources. J. Econ. Perspect. 2020, 34, 168–194. [Google Scholar] [CrossRef]
  16. Egger, P. Decent work and competitiveness: Labor dimensions as accession to the European Union. Int. Labor Rev. 2003, 142, 5–27. [Google Scholar] [CrossRef]
  17. Ahmed, L. Decent work and human development. Int. Labor Rev. 2003, 142, 263–271. [Google Scholar] [CrossRef]
  18. Graça, M.; Pais, L.; Mónico, L.; Santos, N.R.D.; Ferraro, T.; Berger, R. Decent work and work engagement: A profile study with academic personnel. Appl. Res. Qual. Life 2021, 16, 917–939. [Google Scholar] [CrossRef]
  19. Xu, Y.; Liu, D.; Tang, D.S. Decent work and innovative work behavior: Mediating roles of work engagement, intrinsic motivation, and job self-efficacy. Creat. Innov. Manag. 2022, 31, 49–63. [Google Scholar] [CrossRef]
  20. Huang, W.; Shen, J.; Yuan, C. How decent work affects affective commitment among Chinese employees: The roles of psychological safety and labor relations climate. J. Career Assess. 2022, 30, 157–180. [Google Scholar] [CrossRef]
  21. Sheng, X.; Zhou, H. The effect of decent work on voice behavior: The mediating role of thriving at work and the moderating role of proactive personality. Curr. Psychol. 2021, 41, 8524–8537. [Google Scholar] [CrossRef]
  22. Yan, Y.; Deng, D.; Geng, Y.; Gao, J.; Lin, E. The dual influence path of decent work perception on employee innovative behavior. Front Psychol. 2023, 14, 1302945. [Google Scholar] [CrossRef] [PubMed]
  23. Aybas, M.; Özçelik, G.; Uyargil, C. Can decent work explain employee-level outcomes? The Roles of work–family and family–work conflict. Sustainability 2022, 14, 11488. [Google Scholar] [CrossRef]
  24. Geng, Y.; Chen, L.; Li, J.; Kashif, I. Higher education and digital economy: Analysis of their coupling coordination with the Yangtze River economic belt in China as the example. Ecol. Indic. 2023, 154, 110510. [Google Scholar] [CrossRef]
  25. Ferraro, T.; Pais, L.; Rebelo Dos Santos, N.; Moreira, J.M. The decent work questionnaire: Development and validation in two samples of knowledge workers. Int. Labor Rev. 2018, 157, 243–265. [Google Scholar] [CrossRef]
  26. Duffy, R.D.; Allan, B.A.; England, J.W.; Blustein, D.L.; Autin, K.L.; Douglass, R.; Ferreira, P.J.; Santos, E.J.R. The development and initial validation of the decent work scale. J. Couns. Psychol. 2017, 64, 206–221. [Google Scholar] [CrossRef]
  27. Yan, Y.; Geng, Y.; Gao, J. Measuring the decent work of knowledge workers: Constructing and validating a new scale. Heliyon 2023, 9, 17945. [Google Scholar] [CrossRef] [PubMed]
  28. Burchell, B.; Sehnbruch, K.; Piasna, A. Quality of employment and decent work: Definitions, methodologies, and ongoing debates. Camb. J. Econ. 2014, 38, 459–477. [Google Scholar] [CrossRef]
  29. Anker, R.; Chernychev, I.; Egger, P. Measuring decent work with statistical indicators. Int. Labour Rev. 2003, 142, 147–172. [Google Scholar] [CrossRef]
  30. Benach, J.; Muntaner, C.; Santana, V. Employment Conditions and Health Inequalities: Final Report to the WHO Commission on Social Determinants of Health (CSDH). Available online: https://www.who.int/social_determinants/resources/articles/emconet_who_report.pdf (accessed on 20 September 2007).
  31. Athanasou, J.A. Decent work and its implications for careers. Aust. J. Career Dev. 2010, 19, 36–44. [Google Scholar] [CrossRef]
  32. Di Ruggiero, E.; Cohen, J.E.; Cole, D.C.; Forman, L. Competing conceptualizations of decent work at the intersection of health, social and economic discourses. Soc. Sci. Med. 2015, 133, 120–127. [Google Scholar] [CrossRef]
  33. MacNaughton, G.; Frey, D.F. Decent work, human rights and the sustainable development goals. Geo. J. Int. Labor 2015, 47, 607. [Google Scholar]
  34. Cheng, B.; Yu, X.; Dong, Y.; Zhong, C. Promoting employee career growth: The benefits of sustainable human resource management. Asia Pac. J. Hum. Resour. 2024, 62, e12371. [Google Scholar] [CrossRef]
  35. Alzola, M. Beware of the watchdog: Rethinking the normative justification of gatekeeper liability. J. Bus. Ethics 2017, 140, 705–721. [Google Scholar] [CrossRef]
  36. Hauf, F. The paradoxes of decent work in context: A cultural political economy perspective. Glob. Labour J. 2015, 6, 138–150. [Google Scholar] [CrossRef]
  37. Carr, A. Positive Psychology: The Science of Happiness and Human Strengths; Routledge: London, UK, 2013. [Google Scholar]
  38. Pouyaud, J. For a psychosocial approach to decent work. Front. Psychol. 2016, 7, 422. [Google Scholar] [CrossRef] [PubMed]
  39. Blustein, D.L.; Olle, C.; Connors-Kellgren, A.; Diamonti, A.J. Decent work: A psychological perspective. Front. Psychol. 2016, 7, 407. [Google Scholar] [CrossRef] [PubMed]
  40. Ferrari, L.E. Decent employment and subjectivity in the workplace: Notes for an agenda of labor policies in citizenship terms. Orientación Y Soc. 2009, 9, 8. [Google Scholar]
  41. Bescond, D.; Chtaignier, A.; Mehran, F. Seven indicators to measure decent work: An international comparison. Int. Labor Rev. 2003, 142, 179–211. [Google Scholar] [CrossRef]
  42. Blustein, D.L.; Lysova, E.I.; Duffy, R.D. Understanding decent work and meaningful work. Annu. Rev. Organ. Psychol. Organ. Behav. 2023, 10, 289–314. [Google Scholar] [CrossRef]
  43. Duffy, R.D.; Kim, H.J.; Gensmer, N.P.; Raque-Bogdan, T.L.; Douglass, R.P.; England, J.W.; Buyukgoze-Kavas, A. Linking decent work with physical and mental health: A psychology of working perspective. J. Vocat. Behav. 2019, 112, 384–395. [Google Scholar] [CrossRef]
  44. Blustein, D.L.; Kenny, M.E.; Di Fabio, A.; Guichard, J. Expanding the impact of the psychology of working: Engaging psychology in the struggle for decent work and human rights. J. Career Assess. 2019, 27, 3–28. [Google Scholar] [CrossRef]
  45. Saunders, M.; Lewis, P.; Thornhill, A. Research Methods for Business Students; Prentice Hall: London, UK, 2003. [Google Scholar]
  46. Bagozzi, R.P.; Yi, Y.; Phillips, L.W. Assessing construct validity in organizational research. Adm. Sci. Q. 1991, 36, 421–458. [Google Scholar] [CrossRef]
  47. Glaser, B.G.; Holton, J. Remodeling grounded theory. Hist. Soc. Res. 2007, 32, 47–68. [Google Scholar]
  48. Miles, M.B.; Huberman, A.M. Qualitative Data Analysis: An Expanded Sourcebook; Sage: Newbury Park, CA, USA, 1994. [Google Scholar]
  49. Kim, N.R.; Kim, H.J.; Lee, K.H. Social status and decent work: Test of a moderated mediation model. Career Dev. Q. 2020, 68, 208–221. [Google Scholar] [CrossRef]
  50. Lee, S.; McCann, D. (Eds.) Regulating for Decent Work: New Directions in Labor Market Regulation; Springer: New York, NY, USA, 2011. [Google Scholar]
  51. Svicher, A.; Di Fabio, A. Job crafting: A challenge to promote decent work for vulnerable workers. Front. Psychol. 2021, 12, 681022. [Google Scholar] [CrossRef]
  52. Ferreira, J.A.; Haase, R.F.; Santos, E.R.; Rabaça, J.A.; Figueiredo, L.; Hemami, H.G.; Almeida, L.M. Decent work in Portugal: Context, conceptualization, and assessment. J. Vocat. Behav. 2019, 112, 77–91. [Google Scholar] [CrossRef]
  53. Gutowski, E.; Blustein, D.L.; Kenny, M.E.; Erby, W. The decline of decent work in the twenty-first century: Implications for career development. In The Oxford Handbook of Career Development; Oxford University Press: Oxford, UK, 2021; pp. 23–34. [Google Scholar]
  54. Ioannides, D.; Gyimóthy, S.; James, L. From liminal labor to decent work: A human-centered perspective on sustainable tourism employment. Sustainability 2021, 13, 851. [Google Scholar] [CrossRef]
  55. Churchill, G.A., Jr. A paradigm for developing better measures of marketing constructs. J. Mark. Res. 1979, 16, 64–73. [Google Scholar] [CrossRef]
  56. Frey, D.F. Economic growth, full employment and decent work: The means and ends in SDG 8. In The Sustainable Development Goals and Human Rights; Routledge: London, UK, 2018; pp. 122–142. [Google Scholar]
  57. Gupta, B.; Sharma, N.K.; Ganesh, C. The influence of organizational cultural values, reward, time, self-esteem and job security on knowledge sharing intentions among managers. Int. J. Indian Cult. Bus. Manag. 2009, 2, 125–143. [Google Scholar] [CrossRef]
  58. Kuykendall, L.; Craig, L.; Tay, L. Work-contingent self-esteem: A boon or bane for worker well-being? J. Organ. Behav. 2020, 41, 1–16. [Google Scholar] [CrossRef]
  59. Zyngier, S.; Burstein, F. Knowledge management governance: The road to continuous benefits realization. J. Inf. Technol. 2012, 27, 140–155. [Google Scholar] [CrossRef]
  60. Geng, Y.; Zhang, N.; Zhu, R. Research progress analysis of sustainable smart grid based on CiteSpace. Energy Strategy Rev. 2023, 48, 101111. [Google Scholar] [CrossRef]
  61. Williams, T.R.; Autin, K.L.; Pugh, J.; Herdt, M.E.; Garcia, R.G.; Jennings, D.; Roberts, T. Predicting decent work among us black workers: Examining psychology of working theory. J. Career Assess. 2023, 31, 10690727221149456. [Google Scholar] [CrossRef]
  62. Kozan, S.; Işık, E.; Blustein, D.L. Decent work and well-being among low-income Turkish employees: Testing the psychology of working theory. J. Couns. Psychol. 2019, 66, 317. [Google Scholar] [CrossRef]
  63. Wang, D.; Jia, Y.; Hou, Z.J.; Xu, H.; Zhang, H.; Guo, X.L. A test of psychology of working theory among Chinese urban workers: Examining predictors and outcomes of decent work. J. Vocat. Behav. 2019, 115, 103325. [Google Scholar] [CrossRef]
  64. Bonnet, F.; Figueiredo, J.B.; Standing, G. A family of decent work indexes. Int. Labor Rev. 2003, 142, 213. [Google Scholar] [CrossRef]
Figure 1. Scale Design Process.
Sustainability 16 01207 g001
Figure 2. Path coefficient of CFA.
Sustainability 16 01207 g002
Figure 3. 5S conceptual model of decent work perception.
Sustainability 16 01207 g003
Table 1. Coding extraction from the raw materials.
Raw Data of LabelsCode
06-22 I think decent work should give me the opportunity to realize self-value and life value.Work can realize self-value
08-05 I think the work that reflects their values is the most decent. I particularly admire firefighters.Be able to show your value in the work
20-21 I have value and I will be respected.Self-worth can gain respect
08-16 It’s not a decent job if it’s not fair.Fairness
08-20 It’s fair and just.Justness
13-06 Teachers may feel that these inequalities reflect a sense of undignified work.Equality
07-04 Decency is demonstrated by being able to get some help from colleagues in the work process.Assistance from colleagues
09-15 My leader is very supportive.Support from supervisor
03-01 I think being able to bring more knowledge to people.Get more knowledge
03-02 Let’s say it’s a bit challenging.Challenging job
03-10 They are exposed to things daily that require them to apply their knowledge of finance.Application of knowledge
02-07 Our bank’s training, income, and growth are okay, and the platform is relatively large.Large platform
23-20 The reputation of the company also reflects the decency of the workGood reputation
Table 2. Selective coding results.
DimensionCode
SecurityJob security
Income security
Benefit security
Work safety
Adequate income
Fair and equity
Institutional security
SupportRespect
Power and resource
Assistance and support
Favorable working atmosphere
Pleasant working environment
Well-educated clients
Self-valueAutonomy and freedom
Realizing the value
Creating the value
Physical and mental pleasure
High achievement
Opportunities for growth
SkillsHigh demand of work ability
High demand of innovation
Professional knowledge and skills
Good work ethics
Challenging work
Irreplaceable work
Utilization of talent
Social statusWork image
High social status
Legal work
Good employer reputation
Respect and esteem
Recognition and fulfillment
Table 3. Reliability analysis of preliminary test.
DimensionItemCICTCronbach’s α after Deleting ItemCronbach’s α
SecurityS110.5290.8740.889
S120.7070.847
S130.7610.841
S140.7380.842
S150.6770.850
S160.6710.859
S170.7150.869
SupportS210.7890.8220.868
S220.6650.847
S230.7680.827
S240.5740.861
S250.6410.849
S260.5730.862
Self-valueS310.7000.9330.932
S320.8560.912
S330.7990.920
S340.7770.922
S350.8780.909
S360.7970.920
SkillsS410.7140.8890.903
S420.7640.883
S430.7520.885
S440.5830.902
S450.7850.881
S460.7030.890
S470.6960.891
Social statusS510.7360.8510.876
S520.7540.845
S530.4020.897
S540.6950.856
S550.8000.837
S560.7350.849
Table 4. Principal Component Analysis of preliminary test.
ItemFactor 1Factor 2Factor 3Factor 4Factor 5Reason for Deleting
S11 0.858
S12 0.723
S13 0.6200.501 Multi-loading
S14 0.740
S15 0.4510.479 Low loadings
S16 0.691 Misallocation
S17 0.722
S21 0.691
S22 0.611
S23 0.617
S24 0.671Misallocation
S25 0.655 Misallocation
S260.487 0.572 Misallocation
S320.610
S330.650
S34 0.640 Misallocation
S350.6020.597
S360.5430.592 Multi-loading
S41 0.702
S42 0.783
S43 0.775
S44 0.619Misallocation
S45 0.748
S46 0.705
S470.5040.575 Multi-loading
S510.473 0.463Low loadings
S520.4910.492 Low loadings
S54 0.677 Misallocation
S55 0.551
S56 0.683
Table 5. Sample distribution.
GenderFrequencyIndustryFrequency
Male42.1Banking22.0
Female57.9Insurance31.4
AgeFrequencySecurities investment5.7
<257.8Telecommunication and internet service3.9
26–3549.8Education and training24.2
36–4530.2Intelligent Manufacturing2.7
>4612.3Others10.0
TenureFrequencyOwnershipFrequency
<0.5 year6.7Private enterprise11.4
0.5–1 year6.8State-owned enterprise36.4
1.01–3 years21.5Governments19.7
3.01–5 years16.0Public institutions17.4
5.01–10 years18.4Foreign-funded enterprise10.6
>10.01 years30.5Others4.5
Table 6. EFA of formal survey.
DimensionItemFactor 1Factor 2Factor 3Factor 4Factor 5
SecurityS110.957
S120.854
S140.917
S170.781
SupportS21 0.712
S22 0.681
S23 0.653
Self-valueS32 0.713
S33 0.615
SkillsS41 0.586
S42 0.793
S43 0.916
S45 0.818
Self-esteemS55 0.913
S56 0.818
Table 7. CFA results.
Model χ2dfχ2/dfGFIRMSEARMRCFINFI
M1: Single factor model1616.76410415.5460.7530.1300.0450.8480.840
M2: 2-factor model2120.37411817.9690.7290.1400.0540.8100.802
M3: 3-factor model2000.21511617.2430.7410.1370.0530.8220.813
M4: 4-factor model1382.11711512.20180.8390.1130.0490.8800.871
M5: 5-factor model1226.02511410.7550.8590.1060.0450.8950.885
Table 8. Reliability test results of formal survey.
FactorItemStd. EstimateCRAVE
S1S110.8750.7310.422
S120.798
S140.861
S170.881
S2S210.8540.8720.695
S220.875
S230.775
S3S320.9180.8710.693
S330.823
S4S410.8500.9020.648
S420.874
S430.779
S450.837
S5S550.8340.8260.703
S560.815
Table 9. Discrimination validity test result.
S1S2S3S4S5
S10.649 *
S20.6430.834 *
S30.5980.7650.833 *
S40.5220.6410.7990.805 *
S50.5740.6600.7120.7050.839 *
* indicated p < 0.05.
Disclaimer/Publisher’s Note: The statements, opinions and data contained in all publications are solely those of the individual author(s) and contributor(s) and not of MDPI and/or the editor(s). MDPI and/or the editor(s) disclaim responsibility for any injury to people or property resulting from any ideas, methods, instructions or products referred to in the content.

