
Pollution Load Coordination and Eco-Compensation for Trans-Boundary Water Pollution Control: The Case of the Tri-Border Region of the Yangtze Delta

Abstract
1. Introduction
- (1)
- The effective coordination areas for trans-boundary pollution control were proposed and delineated from the vague scope of the tri-border area in the Yangtze Delta. This facilitates the identification of administrative regions for the precise allocation of pollution discharge responsibilities.
- (2)
- Considering the complex hydrodynamic and densely discharged pollution in the tri-border area of Yangtze Delta, a one-dimensional (1-D) mathematical model encompassing interconnected trans-boundary rivers was built to simulate the complex pollutant transportation and variation in water quality at the trans-boundary cross sections.
- (3)
- Taking the water quality standard (WQS) achievement status of all the key trans-boundary cross-sections into consideration, the load reduction goals of all the contributing administrative regions were determined based on load capacity calculations.
- (4)
- An eco-compensation calculation model was established with an objective compensation standard proposed based on the practical cost in TYBY, which enables the detailed compensation payment estimation of all the contributing regions for trans-boundary pollutant discharging.
2. Materials
2.1. Research Areas
2.2. Dataset
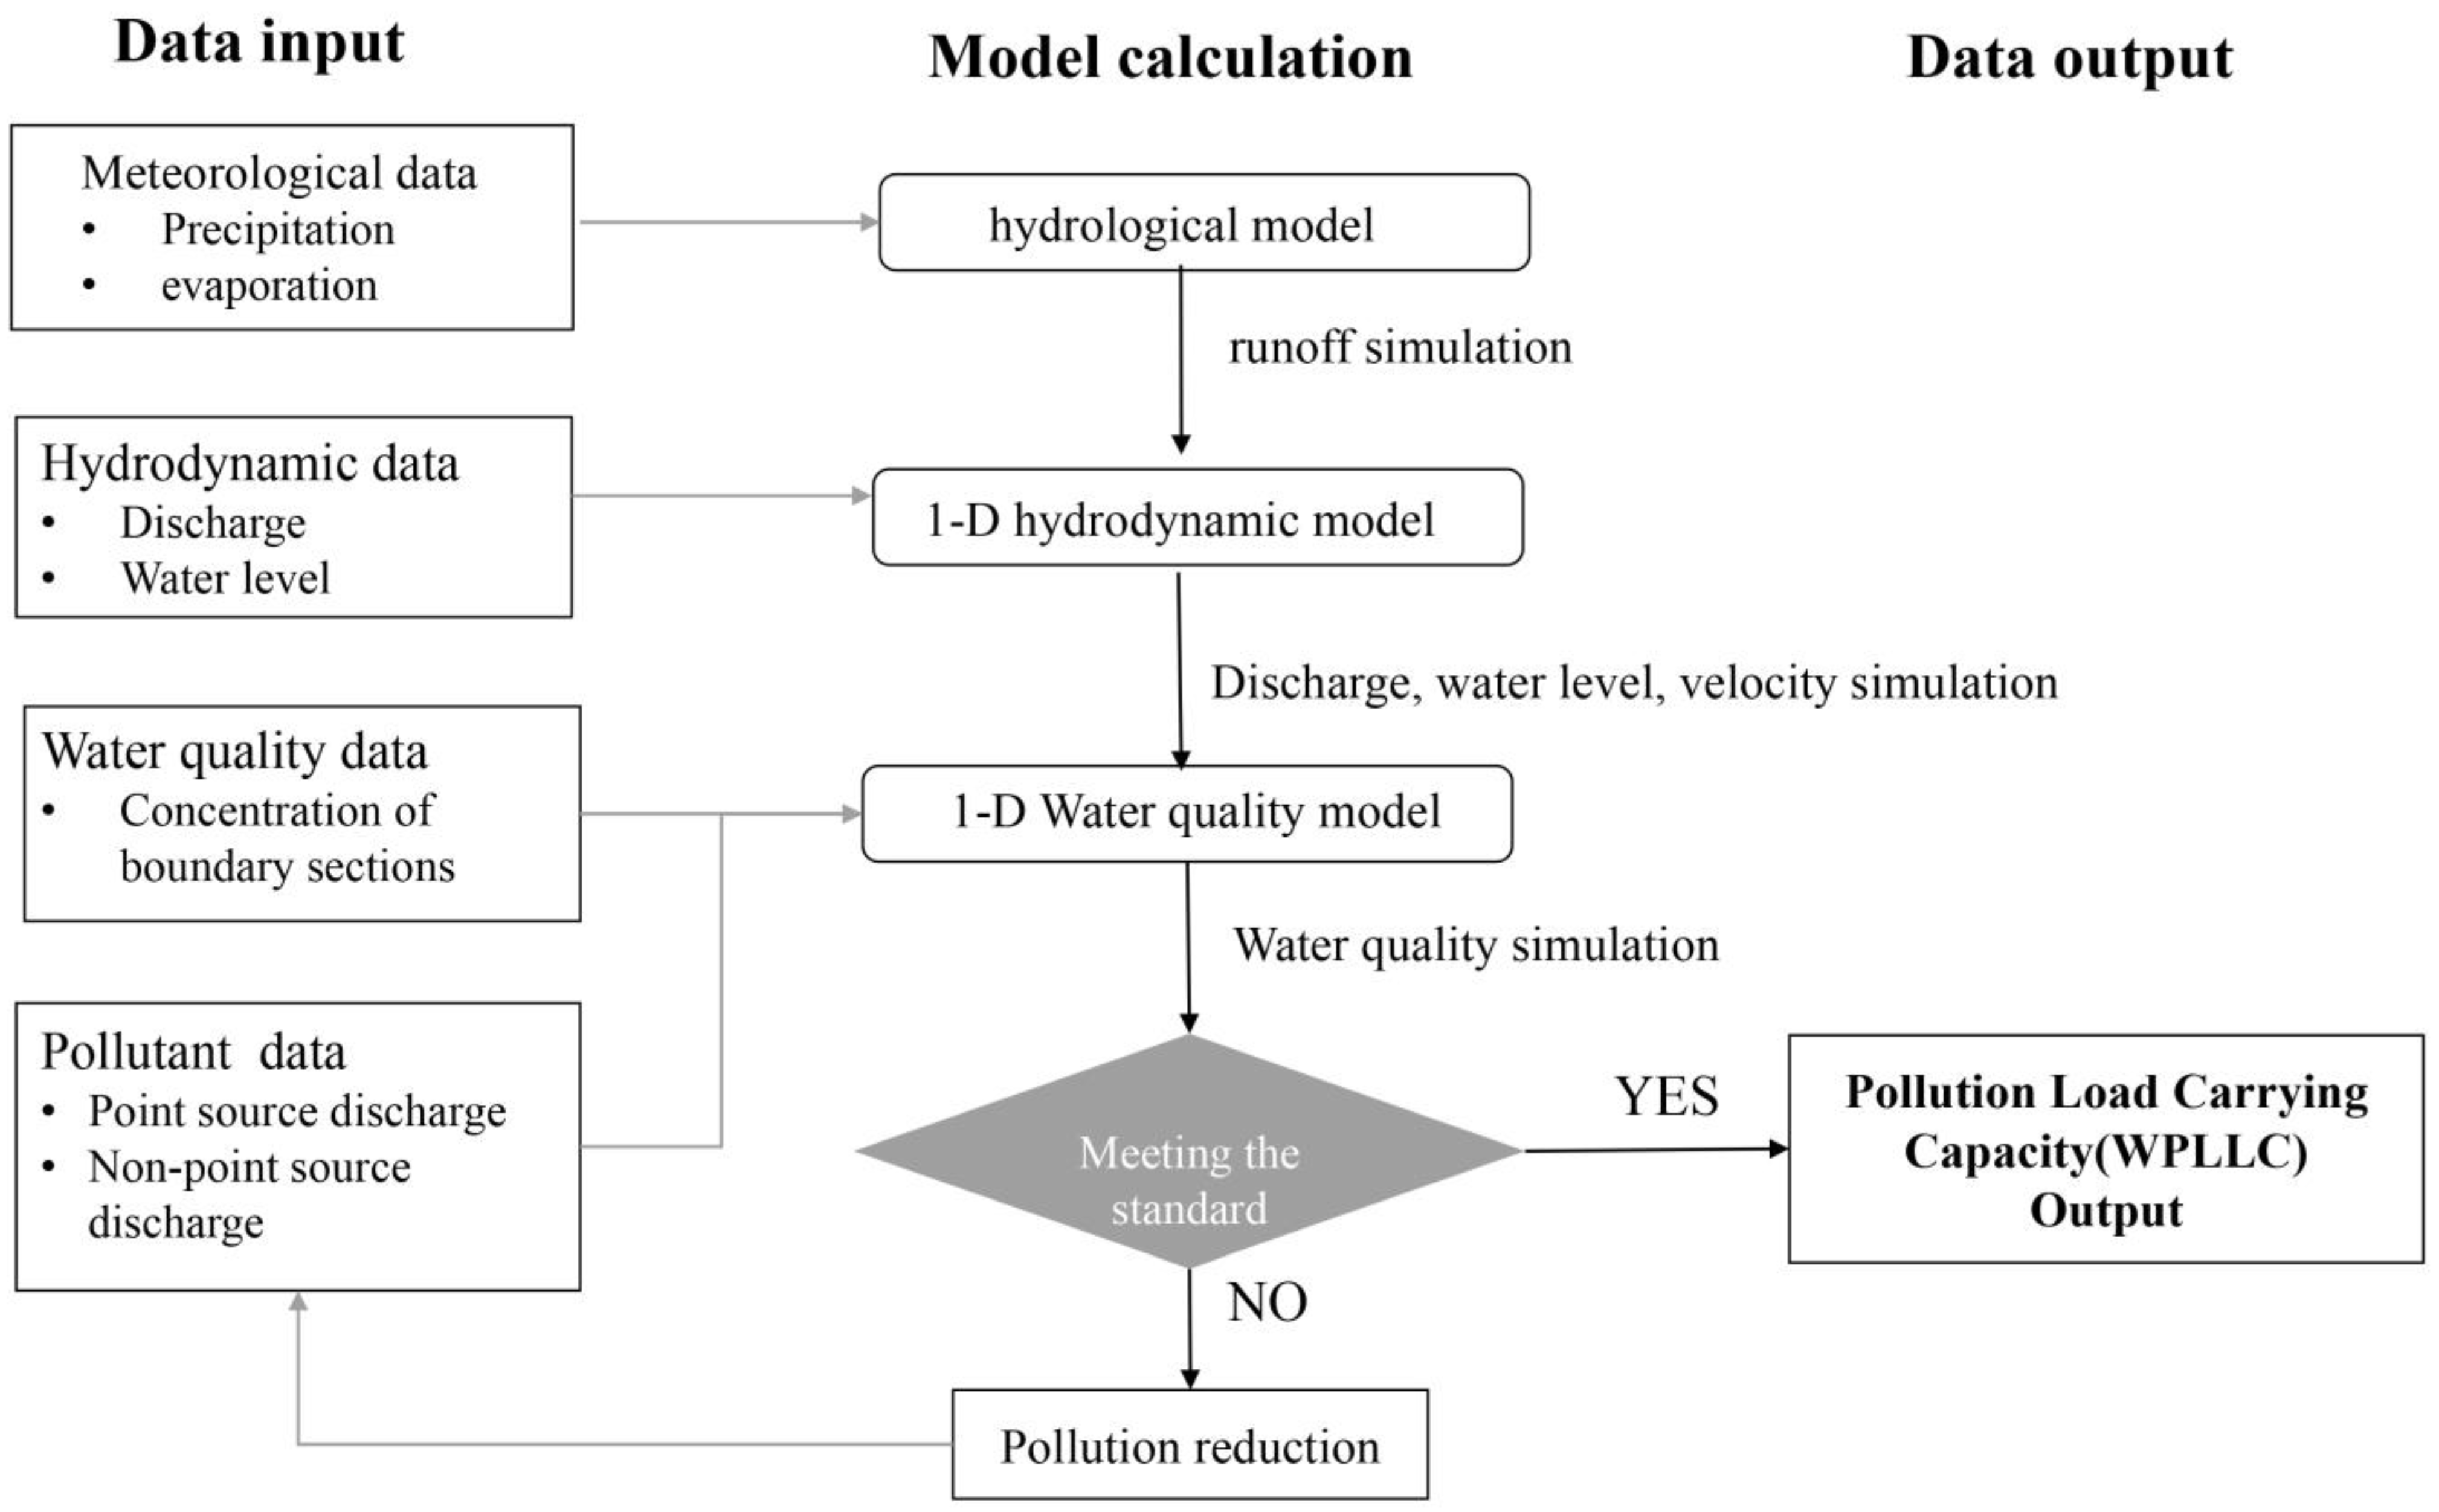
3. Methodology
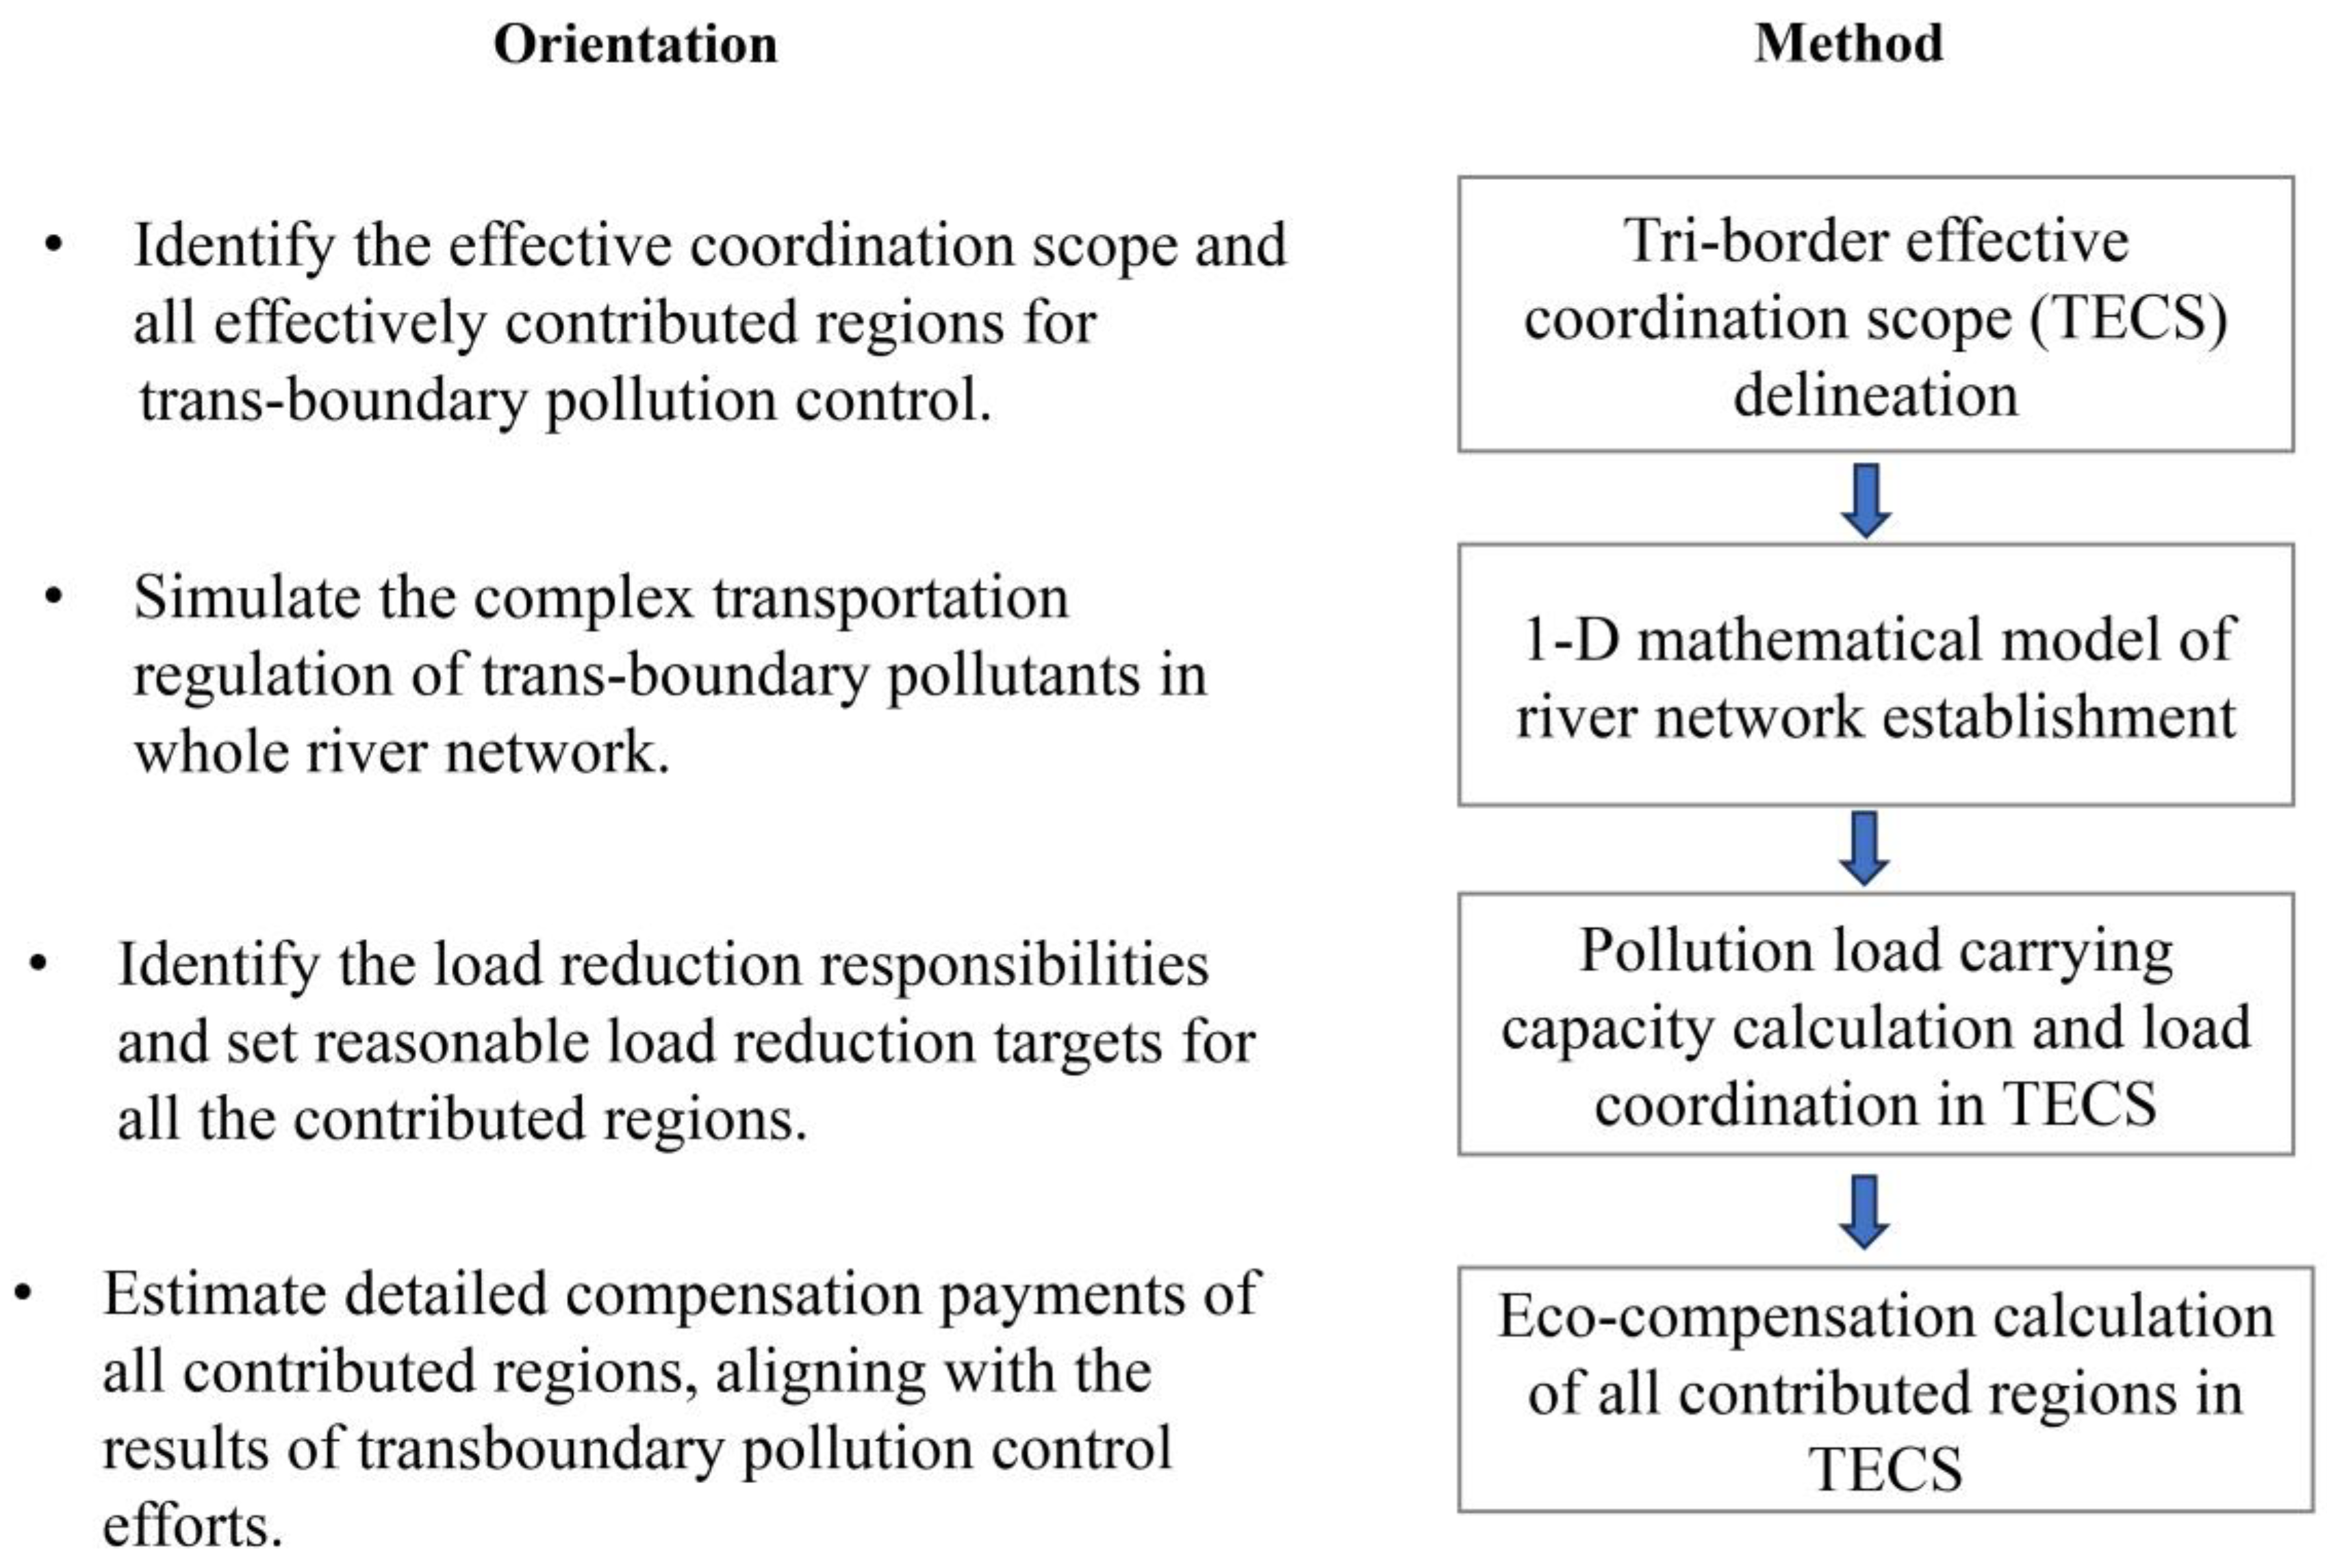
3.1. Tri-Border Effective Coordination Scope Delineation
3.2. One-Dimensional Mathematical Model of River Network Establishment
3.2.1. One-Dimensional Mathematical Mode River Network Model Establishment
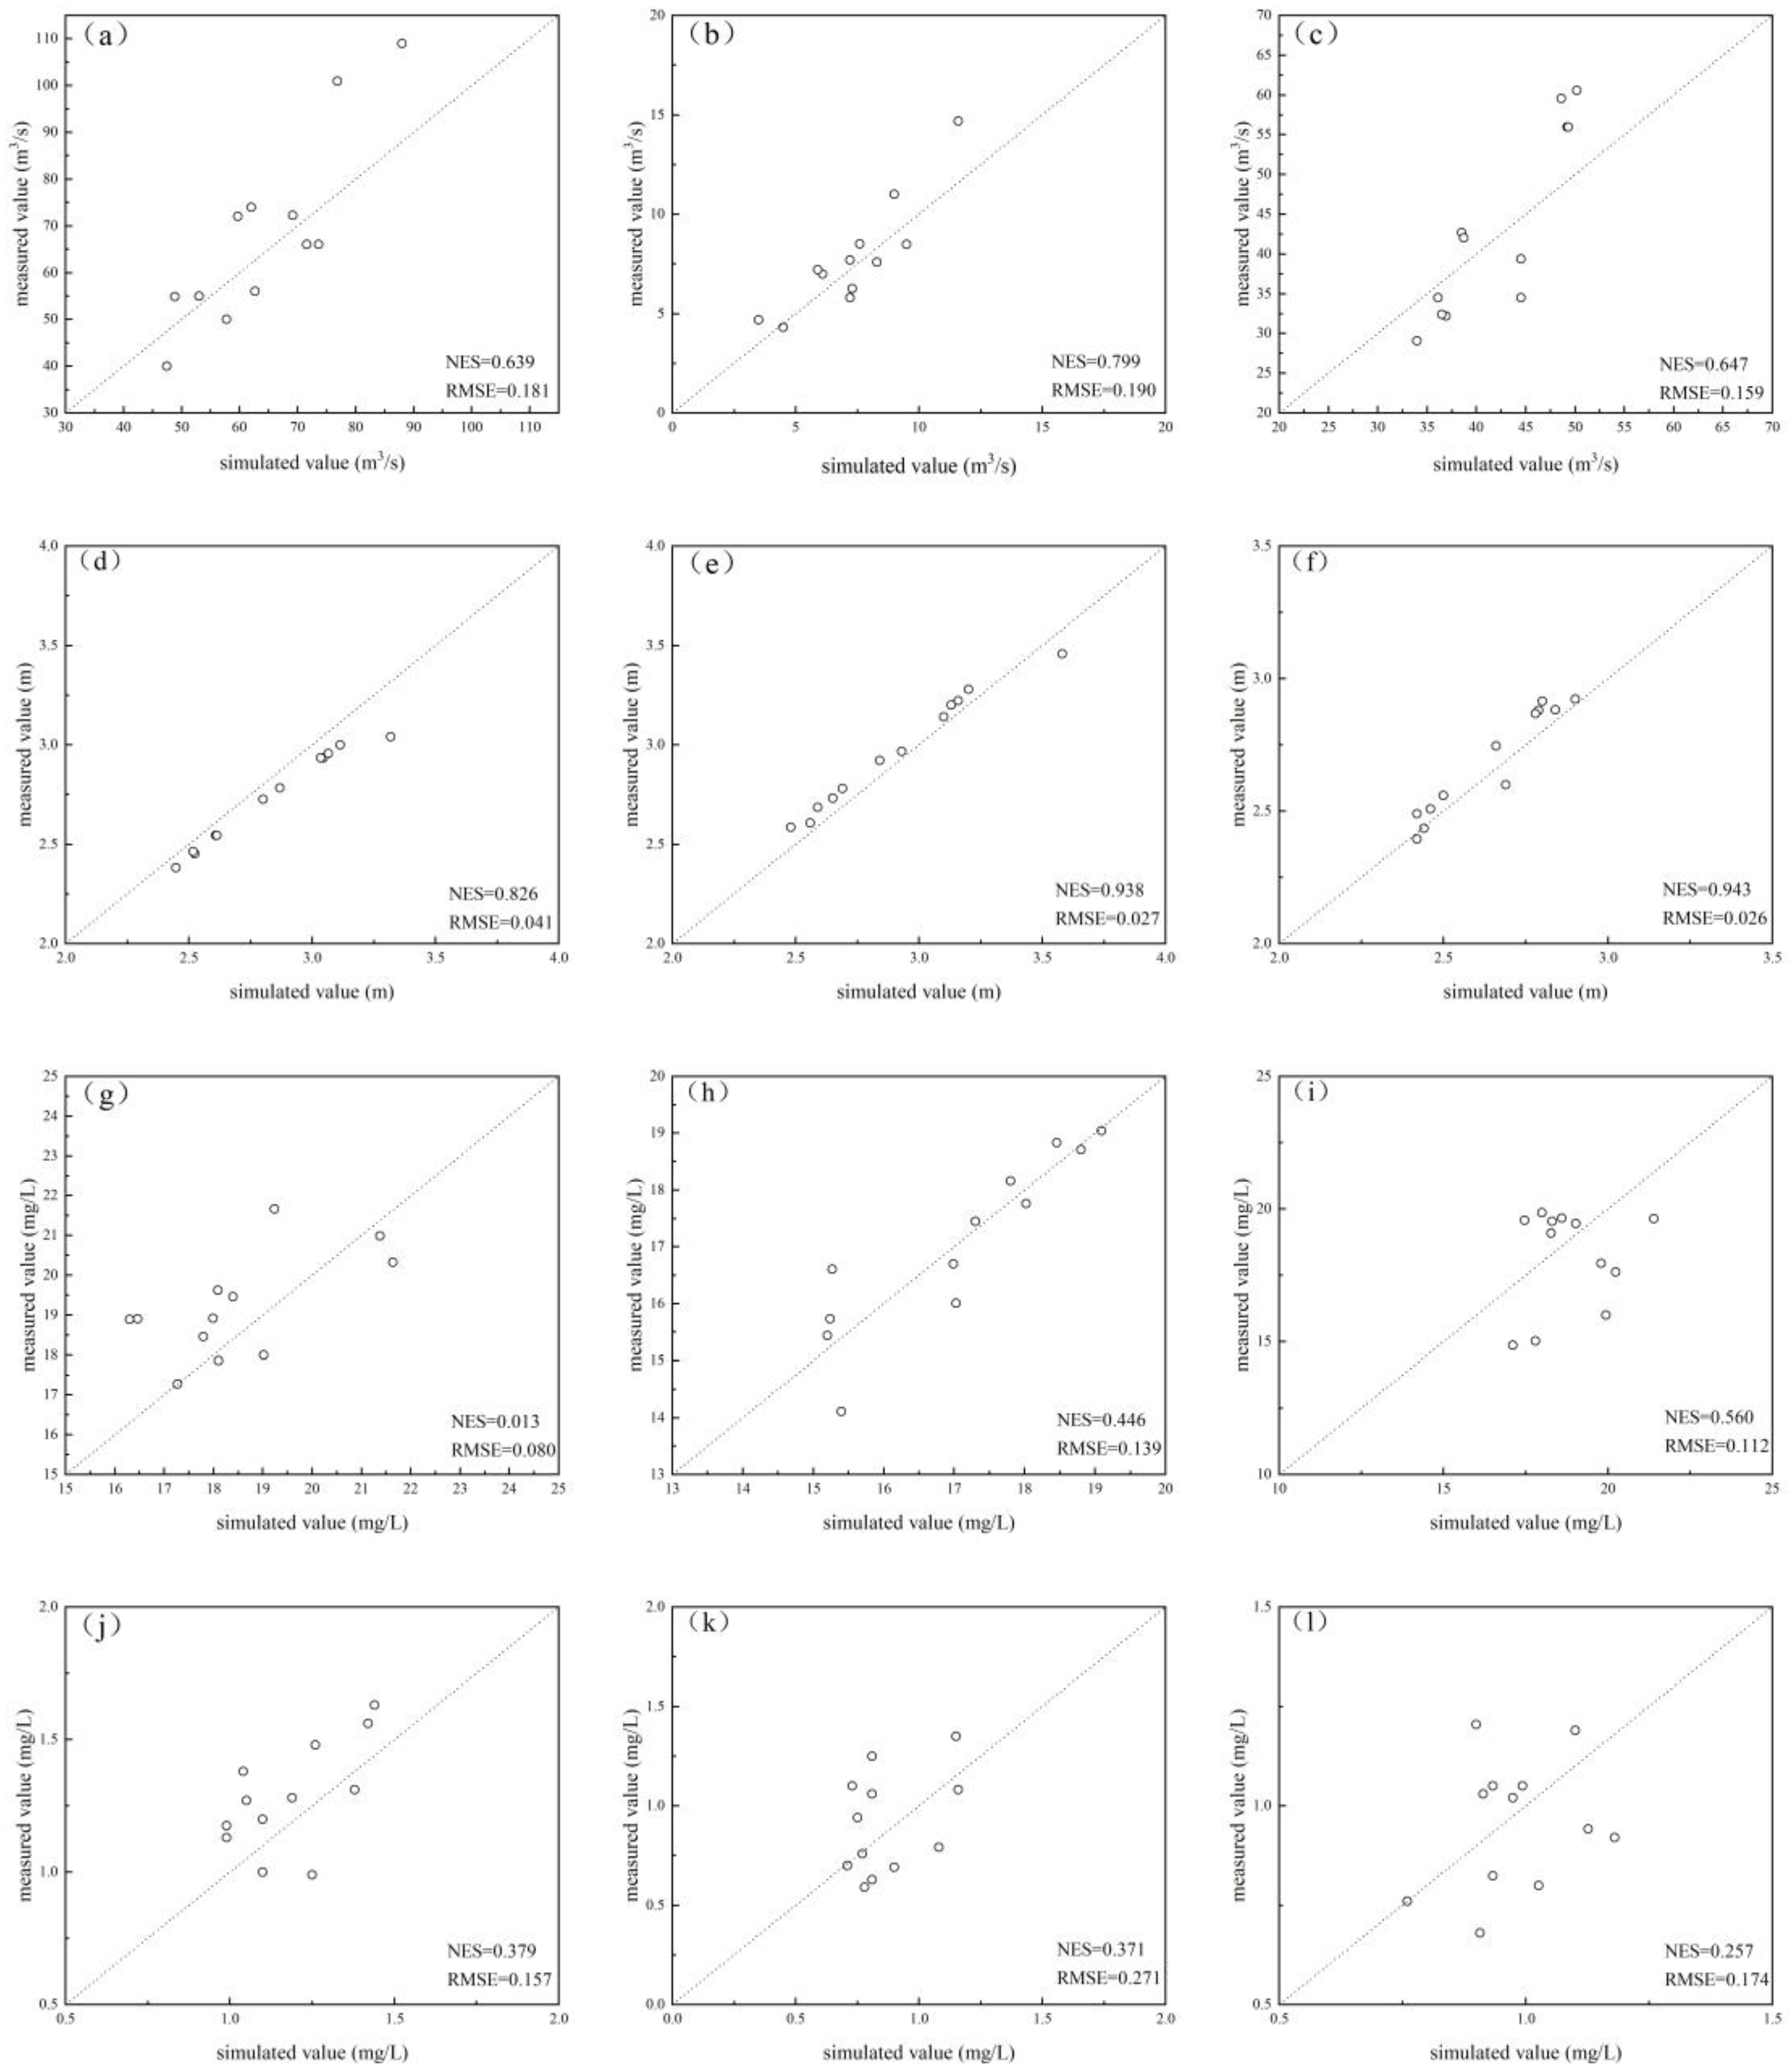
3.2.2. One-Dimensional Mathematical Model Calibration and Validation
3.3. Load Allocation Based on Water Pollution Load Carrying Capacity Calculation
3.4. Eco-Compensation Calculation in Tri-Border Region
4. Results and Discussion
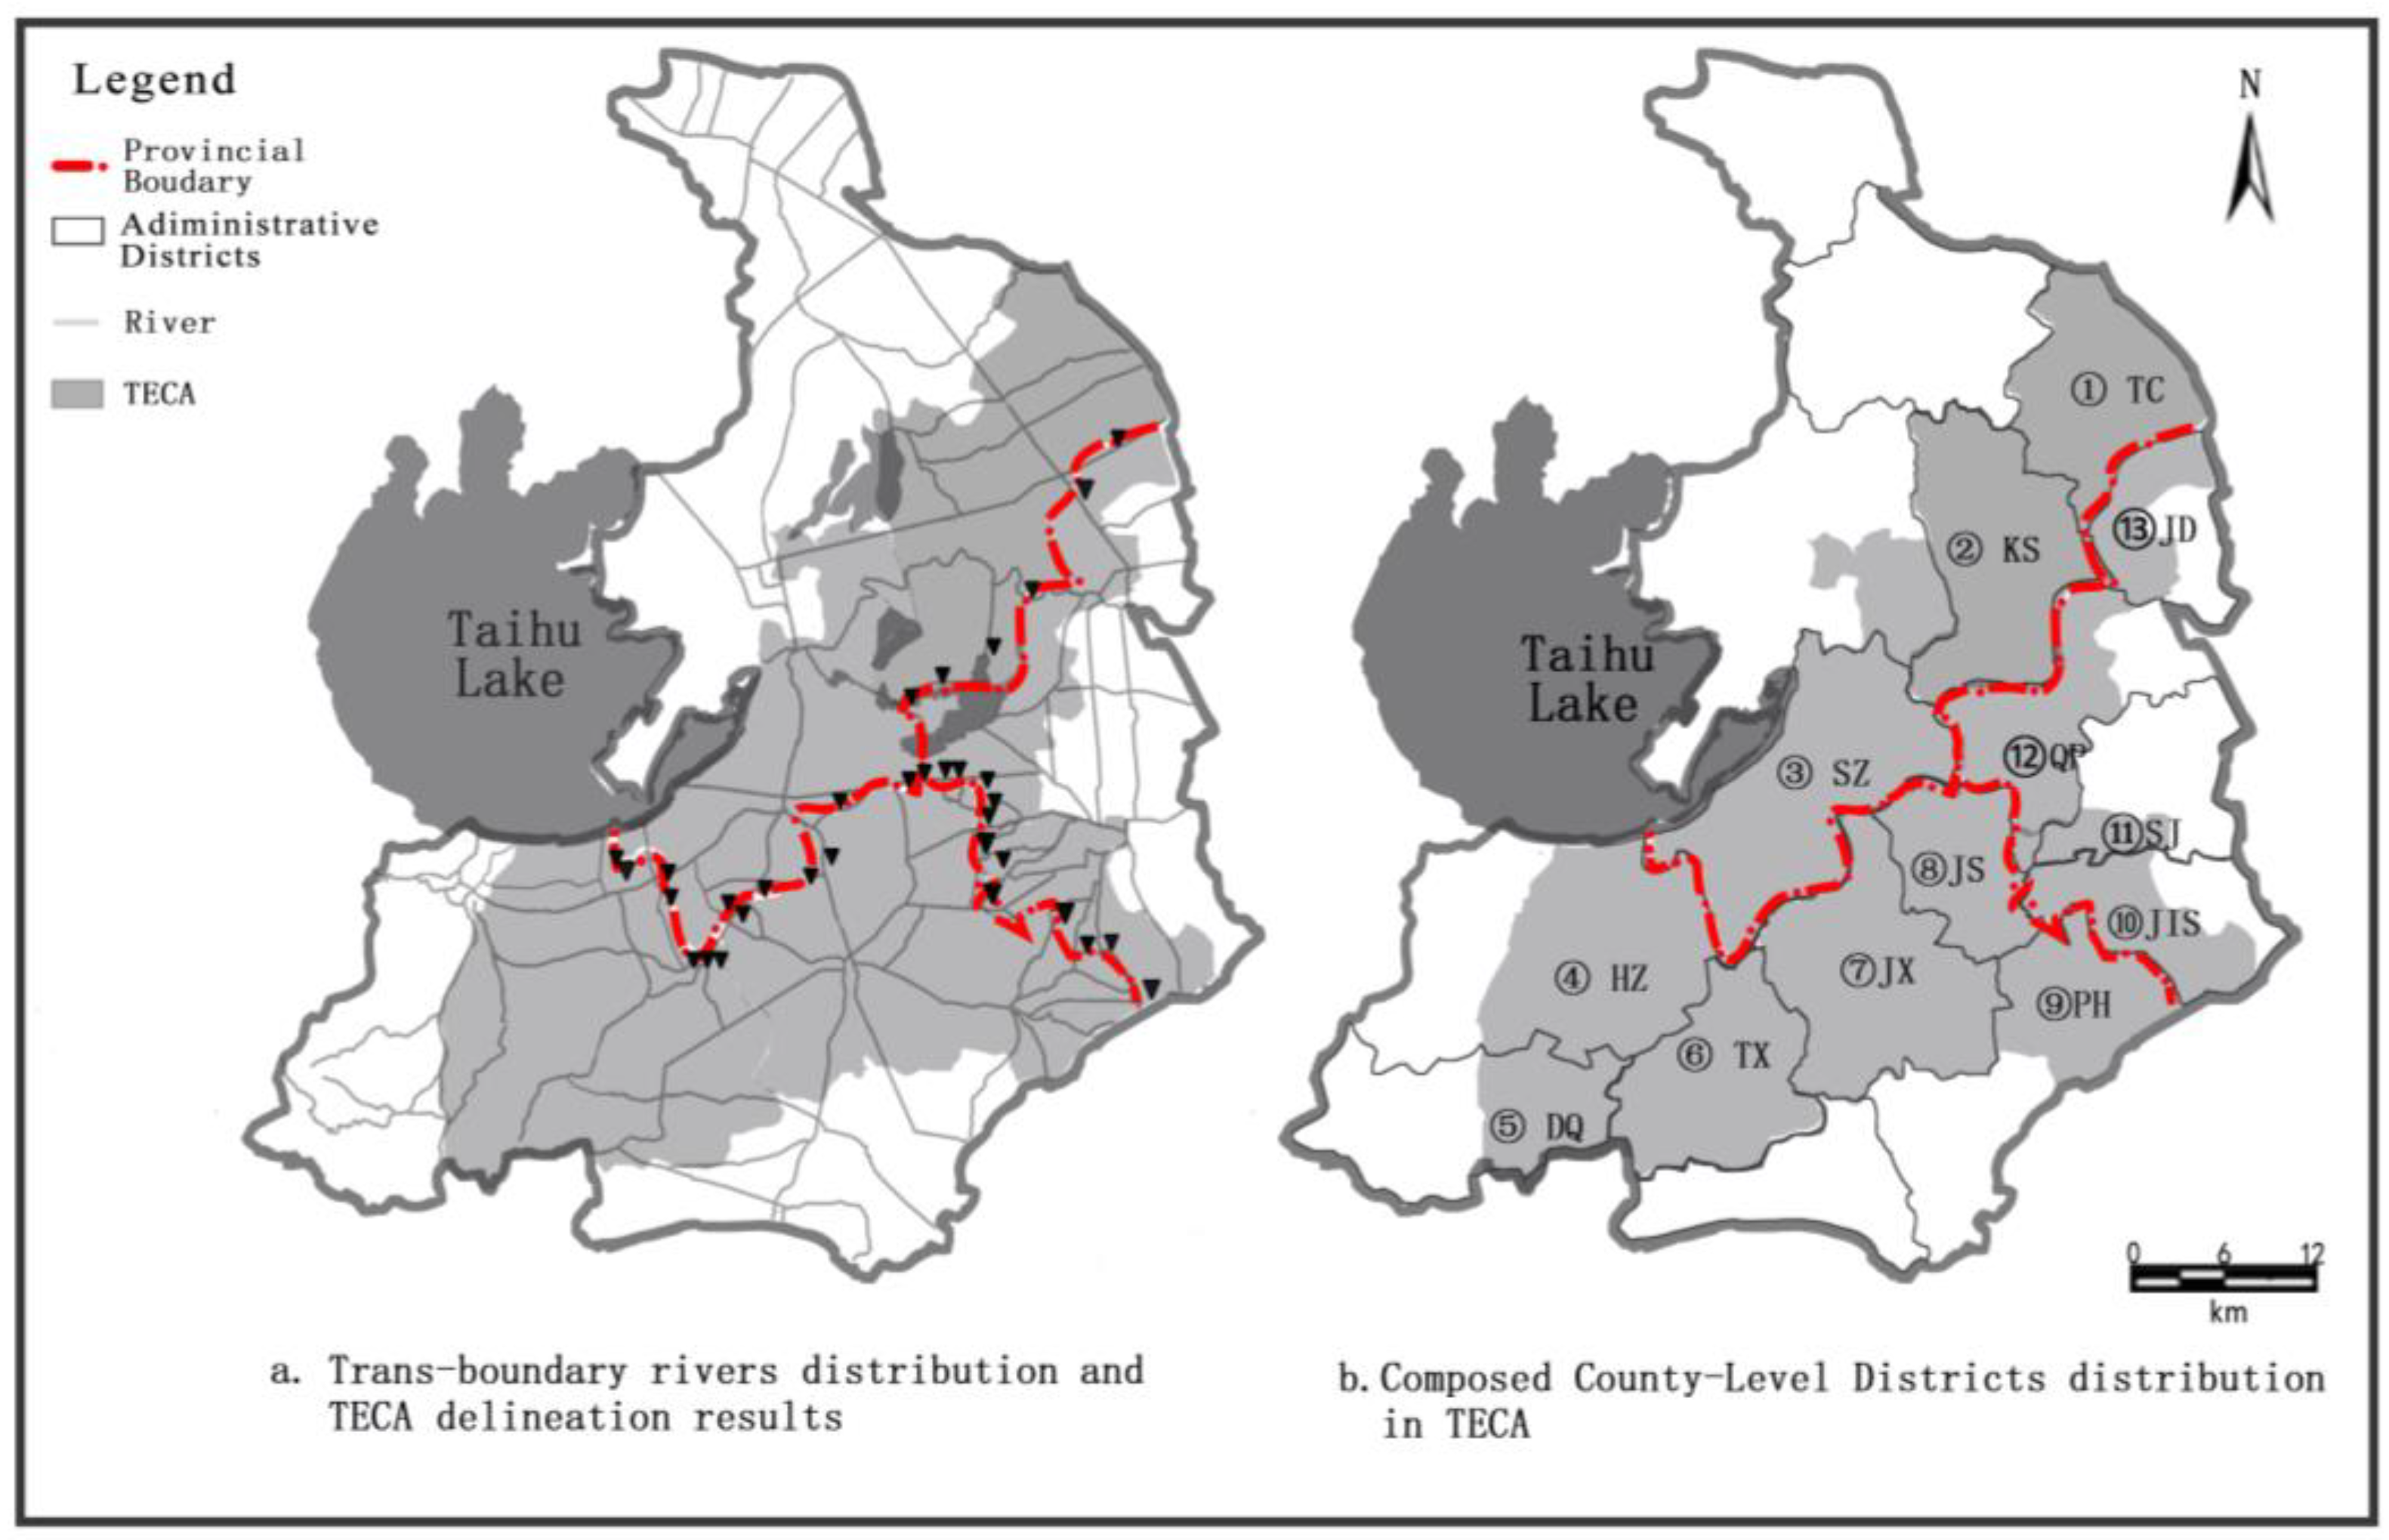
4.1. Effective Coordination Scope of Tri-Border Region Delineation Based on Hydrodynamic Analysis
4.2. Load Coordination Based on Pollution Load Capacity Calculation in TECS
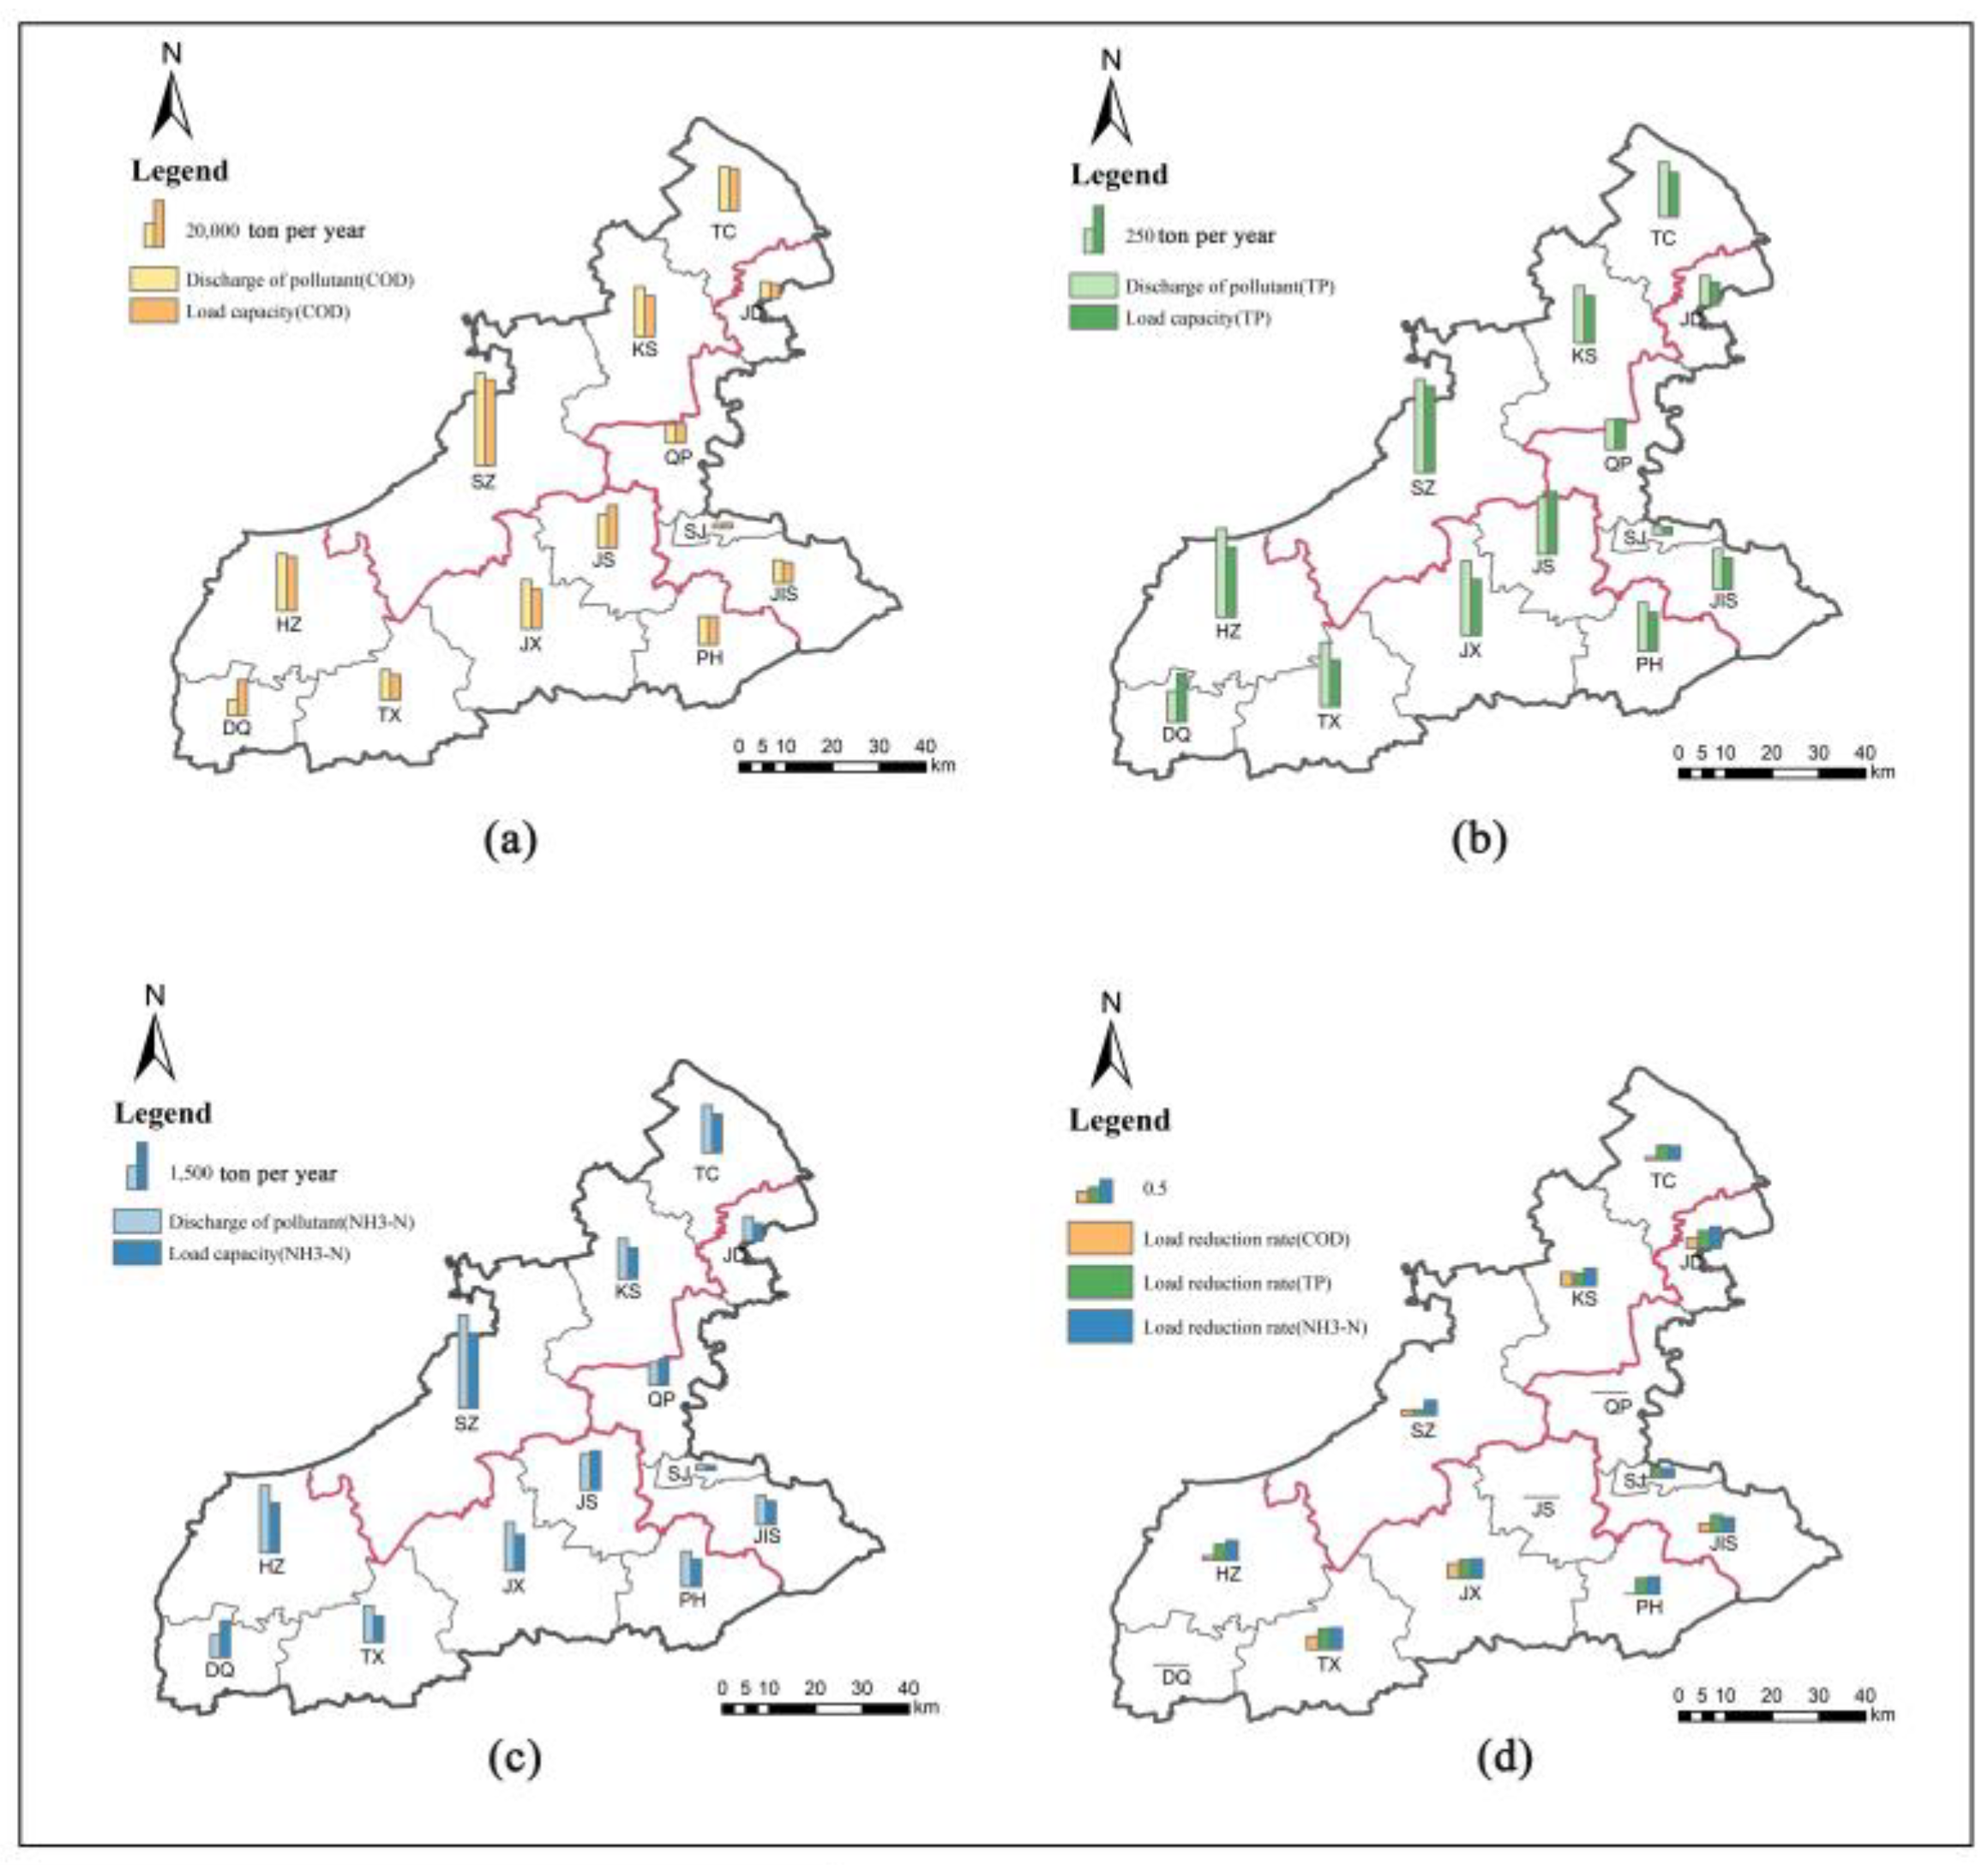
4.2.1. Pollution Load Capacity Calculation of 13 Administrative Districts in TECS
4.2.2. Pollution Load Cooperation in TECS
4.3. Eco-Compensation Standard and Payment Calculation in TECS
4.3.1. Eco-Compensation Standard Calculation in TECS
4.3.2. Eco-Compensation Payment Calculation in TECS
5. Implications and Limitation
5.1. Implications
5.2. Limitation
6. Conclusions
- Delineation of tri-border effective coordination scope (TECS): Building upon the water hydrodynamic characteristics analysis of the whole river network in TBYD, the TECS, a strategic region where trans-boundary pollution control management could be uniformly implemented, has been divided considering the bio-influence range of key trans-boundary cross-sections. On that basis, 13 county-level administrative districts encompassed in the TECS have been identified as the coordination objects for trans-boundary pollution control.
- Load coordination based on load capacity calculation: By constructing a large-scale river network mathematical model, the load capacity of each trans-boundary pollution-contributing region in the TECS has been determined and ranges from 2064 to 35,664 ton/year (cod), 153 to 2409 ton/year (ammonia nitrogen), and 42 to 482 ton/year (TP). Consequently, quantitative load reduction responsibilities of all the contributing regions were clarified and coordinated by comparing them to the current pollution load distribution.
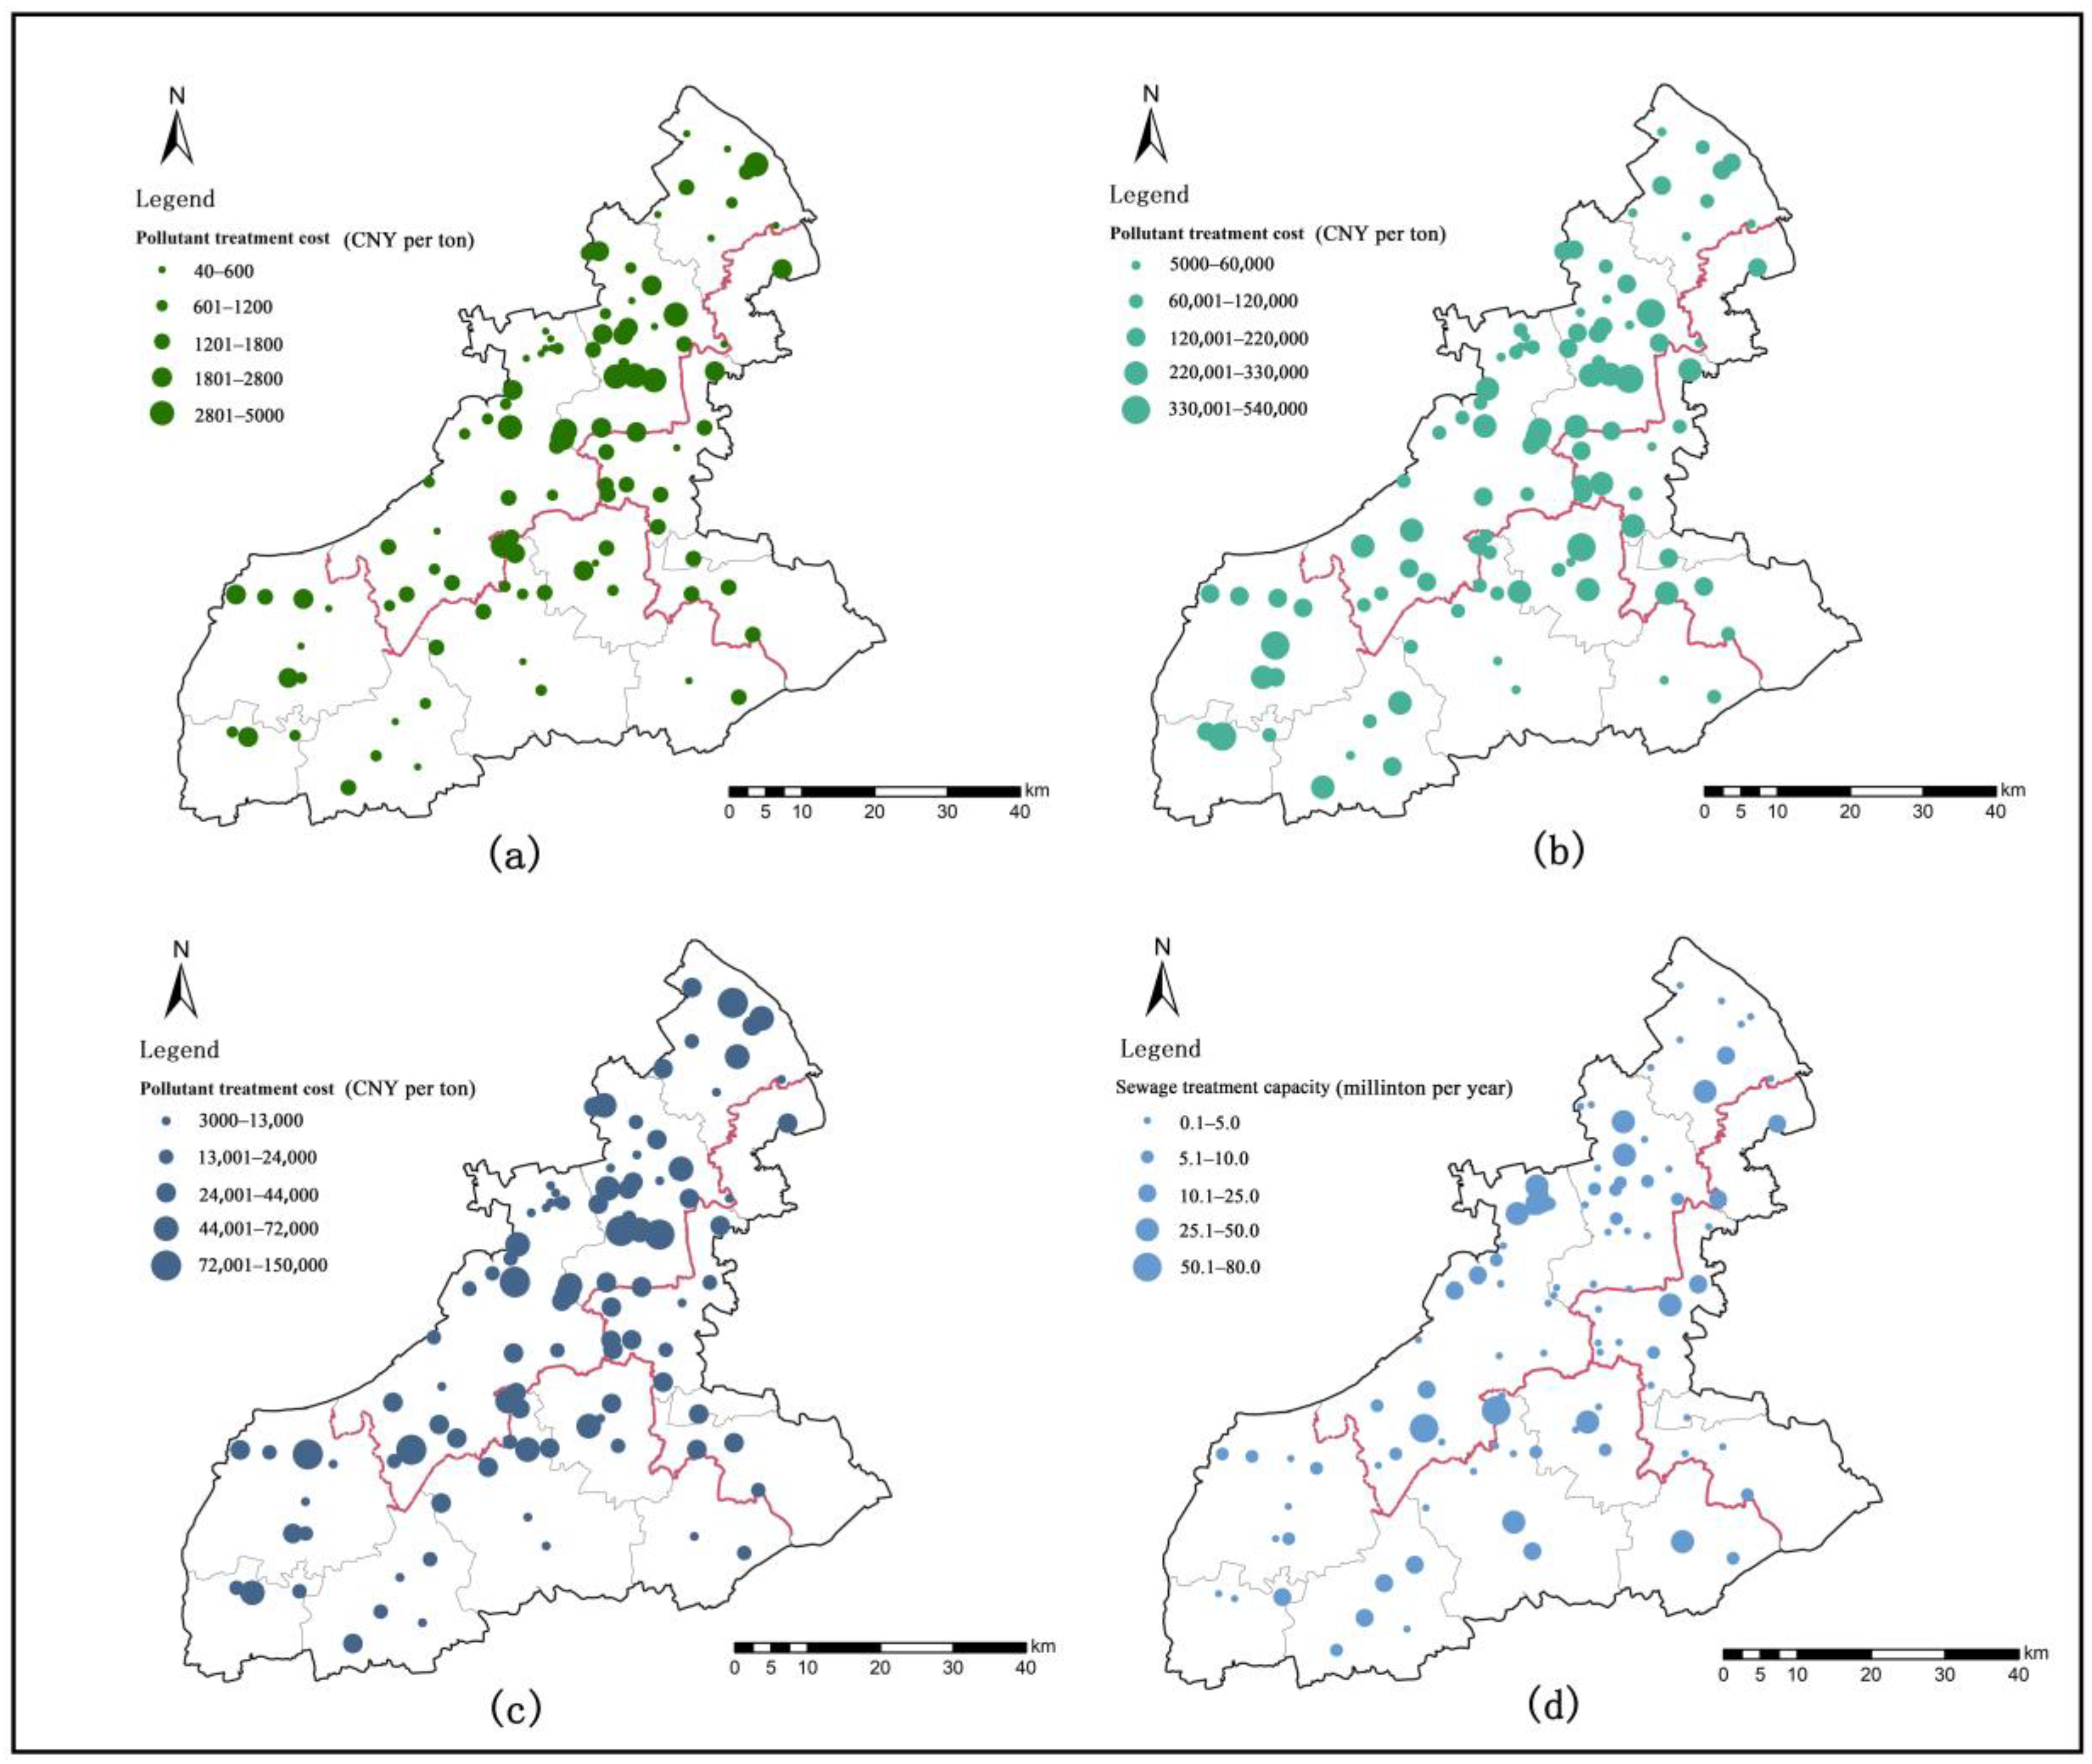
- Establishment of unified eco-compensation criterion: In analyzing the operational details of 94 treatment plants in the TECS, the standardized eco-compensation criterion has been calculated as follows: CNY 755 per ton for COD, CNY 18,150 per ton for NH3-N, and CNY 141,402 per ton for TP. This guides equitable compensation practices across the contributing regions.
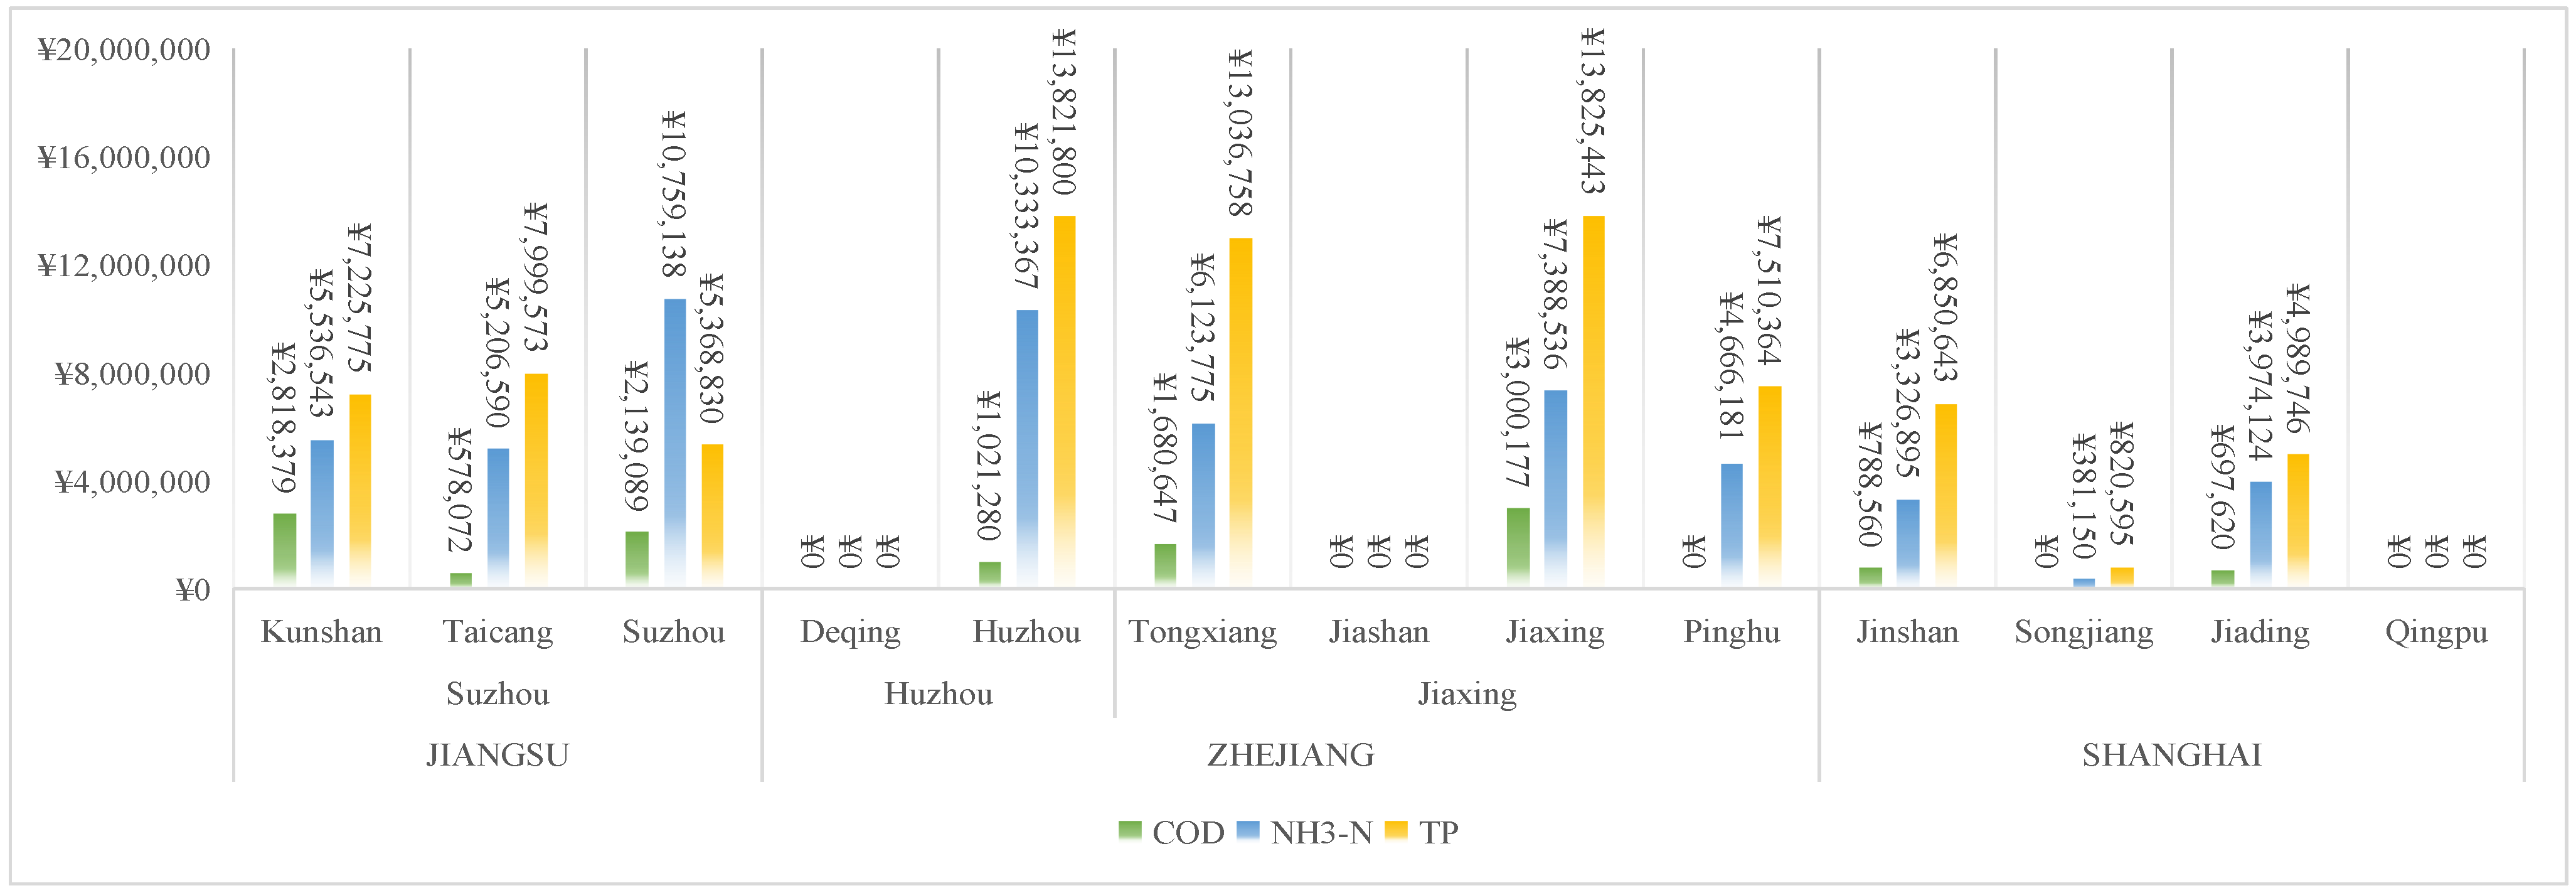
- Trans-boundary pollution eco-compensation: Combined with the load coordination results, the detailed compensation payments of 13 administrative districts in the TECS for trans-boundary pollution control is in the range of CNY 0 to 25,176,446. In addition, the results illustrate that the NH3-N and TP should receive more attention in the practical management for trans-boundary pollution control in the TECS.
Author Contributions
Funding
Institutional Review Board Statement
Informed Consent Statement
Data Availability Statement
Conflicts of Interest
Appendix A

| Administrative Level | Load Discharging Amount (Ton/Year) | Load Capacity (Ton/Year) | Reduction Rate (%) | ||||||||
|---|---|---|---|---|---|---|---|---|---|---|---|
| Province | City | County-Level District | COD | NH3-N | TP | COD | NH3-N | TP | COD | NH3-N | TP |
| Jiangsu Province | Suzhou | Kunshan | 20,519 | 1296 | 319 | 16,787 | 991 | 265 | 18.2% | 23.5% | 17.1% |
| Taicang | 18,076 | 1534 | 309 | 17,310 | 1247 | 249 | 4.2% | 18.7% | 19.5% | ||
| Suzhou | 38,497 | 3002 | 523 | 35,664 | 2409 | 482 | 7.4% | 19.7% | 7.8% | ||
| Zhejiang Province | Huzhou | Deqing | 6558 | 736 | 172 | 14,707 | 1182 | 272 | 0.0% | 0.0% | 0.0% |
| Huzhou | 23,640 | 2171 | 497 | 22,287 | 1602 | 393 | 5.7% | 26.2% | 21.0% | ||
| Jiaxing | Tongxiang | 12,588 | 1171 | 359 | 10,362 | 834 | 260 | 17.7% | 28.8% | 27.4% | |
| Jiashan | 13,838 | 1178 | 318 | 17,650 | 1257 | 351 | 0.0% | 0.0% | 0.0% | ||
| Jiaxing | 20,397 | 1569 | 419 | 16,423 | 1162 | 315 | 19.5% | 25.9% | 24.9% | ||
| Pinghu | 11,677 | 1134 | 273 | 11,690 | 877 | 216 | 0.0% | 22.7% | 20.8% | ||
| Shanghai Municipality | Shanghai | Jinshan | 9337 | 943 | 227 | 8293 | 760 | 175 | 11.2% | 19.4% | 22.8% |
| Songjiang | 1863 | 174 | 48 | 2065 | 153 | 42 | 0.0% | 12.1% | 12.9% | ||
| Jiading | 7009 | 776 | 165 | 6085 | 557 | 127 | 13.2% | 28.2% | 22.8% | ||
| Qingpu | 7869 | 728 | 166 | 8178 | 836 | 171 | 0.0% | 0.0% | 0.0% | ||
| Administrative Level | Eco-Compensation Payment | |||||
|---|---|---|---|---|---|---|
| Province | City | County Level District | COD | NH3-N | TP | SUM |
| JIANGSU | Suzhou | Kunshan | ¥2,818,379 | ¥5,536,543 | ¥7,225,775 | ¥15,580,698 |
| Taicang | ¥578,072 | ¥5,206,590 | ¥7,999,573 | ¥13,784,235 | ||
| Suzhou | ¥2,139,089 | ¥10,759,138 | ¥5,368,830 | ¥18,267,058 | ||
| ZHEJIANG | Huzhou | Deqing | ¥0 | ¥0 | ¥0 | ¥0 |
| Huzhou | ¥1,021,280 | ¥10,333,367 | ¥13,821,800 | ¥25,176,446 | ||
| Jiaxing | Tongxiang | ¥1,680,647 | ¥6,123,775 | ¥13,036,758 | ¥20,841,180 | |
| Jiashan | ¥0 | ¥0 | ¥0 | ¥0 | ||
| Jiaxing | ¥3,000,177 | ¥7,388,536 | ¥13,825,443 | ¥24,214,156 | ||
| Pinghu | ¥0 | ¥4,666,181 | ¥7,510,364 | ¥12,176,545 | ||
| SHANGHAI | Jinshan | ¥788,560 | ¥3,326,895 | ¥6,850,643 | ¥10,966,098 | |
| Songjiang | ¥0 | ¥381,150 | ¥820,595 | ¥1,201,745 | ||
| Jiading | ¥697,620 | ¥3,974,124 | ¥4,989,746 | ¥9,661,490 | ||
| Qingpu | ¥0 | ¥0 | ¥0 | ¥0 | ||
References
- Ma, C.; Vanessa, S.; Jennifer, R.; Yu, J.; Zhang, Z.; Zheng, H.; Lin, L.; Yang, H.; Jin, Y. A risk-based approach to cumulative effects assessment for large marine ecosystems to support transboundary marine spatial planning: A case study of the yellow sea. J. Environ. Manag. 2023, 342, 118165. [Google Scholar] [CrossRef]
- Zeng, Y.; Li, J.; Cai, Y.; Tan, Q.; Dai, C. A hybrid game theory and mathematical programming model for solving trans-boundary water conflicts. J. Hydrol. 2019, 570, 666–681. [Google Scholar] [CrossRef]
- Shen, M.; Yang, Y. The Water Pollution Policy Regime Shift and Boundary Pollution: Evidence from the Change of Water Pollution Levels in China. Sustainability 2017, 9, 1469. [Google Scholar] [CrossRef]
- Jichuan, S.; Michael, W. Incentive coordination for transboundary water pollution control: The case of the middle route of China’s South-North water Transfer Project. J. Hydrol. 2020, 598, 125705. [Google Scholar]
- Talukder, B.; Hipel, K.W. Diagnosis of sustainability of trans-boundary water governance in the Great Lakes basin. World Dev. 2020, 129, 104855. [Google Scholar] [CrossRef]
- Wu, X.; Cao, Y.; Xiao, Y.; Guo, J. Finding of urban rainstorm and waterlogging disasters based on microblogging data and the location-routing problem model of urban emergency logistics. Ann. Oper. Res. 2018, 290, 1–32. [Google Scholar]
- Huang, X. Transboundary watershed pollution control analysis for pollution abatement and ecological compensation. Environ. Sci. Pollut. Res. Int. 2023, 30, 44025–44042. [Google Scholar] [CrossRef]
- Veeren, R.J.H.M.v.d. Least cost emission reductions in transboundary river basins: The case of diffuse emissions of nutrients in the Rhine river basin. Phys. Chem. Earth Part B Hydrol. Ocean. Atmos. 1999, 24, 603–607. [Google Scholar] [CrossRef]
- Li, H.; Guo, G. Dynamic decision of transboundary basin pollution under emission permits and pollution abatement. Phys. A Stat. Mech. Its Appl. 2019, 532, 121869. [Google Scholar] [CrossRef]
- Zhang, J.; Liu, M.; Li, Q. Transboundary water pollution coordination decision-making model: An application in Taihu Basin in China. Environ. Dev. Sustain. 2023, 1–18. [Google Scholar] [CrossRef]
- Cheng, N.L.; Mou, H.; Deng, M.; Tang, D.; Yang, D. Application of eco-compensation to control transboundary water pollution in water diversion projects: The case of the Heihe River transfer project in China. Ecol. Indic. 2024, 158, 111326. [Google Scholar]
- Chen, Z.; Xu, R.; Yi, Y. A Differential Game of Ecological Compensation Criterion for Transboundary Pollution Abatement under Learning by Doing. Discret. Dyn. Nat. Soc. 2020, 2020, 7932845. [Google Scholar] [CrossRef]
- Ma, N.; Gao, L.; Ge, Z.; Li, M. Hydrochemical characteristics of groundwater in a plain river network region: Establishing linkages between source and water quality variables. Chemosphere 2023, 331, 138809. [Google Scholar] [CrossRef]
- Song, S.; Xu, Y.P.; Zhang, J.X.; Li, G.; Wang, Y.F. The long-term water level dynamics during urbanization in plain catchment in Yangtze River Delta. Agric. Water Manag. 2016, 174, 93–102. [Google Scholar] [CrossRef]
- Xu, Y.; Lan, H.; Wang, B.; Zhao, X.; Li, D.; Yang, Y.; Xie, Y.; Sun, W. Identifying priority areas for freshwater supply conservation integrating multi-scale freshwater flows. J. Environ. Manag. 2023, 344, 118722. [Google Scholar] [CrossRef] [PubMed]
- Wu, H.; Fan, H.; Lei, R.; Sun, C.; Wang, S.; Wu, H.; Fu, C. Atmospheric processes control the stable isotopic variability of precipitation in the middle–lower reaches of the Yangtze River Basin, East Asian monsoon region. J. Hydrol. 2023, 623, 129835. [Google Scholar] [CrossRef]
- Wang, Y.N.; Yang, G.; Li, B.; Wang, C.; Su, W. Measuring the zonal responses of nitrogen output to landscape pattern in a flatland with river network: A case study in Taihu Lake Basin, China. Environ. Sci. Pollut. Res. Int. 2022, 29, 34624–34636. [Google Scholar] [CrossRef] [PubMed]
- Zhang, J.; Zhang, L.; Chai, Q.; Shen, Y.; Ji, L.; Zhao, Q.; Li, X.; Liu, W.; Li, C. Insights into spatiotemporal variations of the water quality in Taihu Lake Basin, China. Environ. Monit. Assess. 2021, 193, 757. [Google Scholar] [CrossRef] [PubMed]
- Gao, C.; Hao, M.; Chen, J.; Gu, C. Simulation and design of joint distribution of rainfall and tide level in Wuchengxiyu Region, China. Urban Clim. 2021, 40, 101005. [Google Scholar] [CrossRef]
- Hu, Z.; Pang, Y.; Xu, R.; Liu, Y. Study on the proportion and flow path of Yangtze River water diversion into Taihu Lake. Water Supply 2022, 22, 1820–1834. [Google Scholar] [CrossRef]
- Taihu Basin Authority of Ministry of Water Resources. Shanghai: Taihu Basin Authority of Ministry of Water Resources 2010–2020; Health Report of Taihu Lake; Taihu Basin Authority of Ministry of Water Resources: Shanghai, China, 2018. [Google Scholar]
- GB3838-2002; Environmental Quality Standard for Surface Water. Ministry of Ecology and Environment of the People’s Republic of China: Peking, China, 2002.
- Bao, K.; Pang, Y.; Sun, H. A Water Environment Capacity Calculation Method Based on Water Quality Standards at the Control Sections: A Case Study of the Yincun Port. Resour. Sci. 2011, 33, 249–252. [Google Scholar]
- Chen, L.; Han, L.; Ling, H.; Wu, J.; Tan, J.; Chen, B.; Zhang, F.; Liu, Z.; Fan, Y.; Zhou, M.; et al. Allocating Water Environmental Capacity to Meet Water Quality Control by Considering Both Point and Non-Point Source Pollution Using a Mathematical Model: Tidal River Network Case Study. Water 2019, 11, 900. [Google Scholar] [CrossRef]
- Xiong, H.; Liu, T.; Wang, H.; Feng, C. Simulation of the improving effect of graphene visible-light photocatalysis using the MIKE11 model of an urban landscape river in the Chaohu Lake Basin, China. Nat. Resour. Model. 2022, 35, e12344. [Google Scholar] [CrossRef]
- Tang, C.; Yi, Y.; Yang, Z.; Cheng, X. Water pollution risk simulation and prediction in the main canal of the South-to-North Water Transfer Project. J. Hydrol. 2014, 519, 2111–2120. [Google Scholar] [CrossRef]
- Feng, L.; Li, Q.; Zhang, L.; Wang, H.; Wang, W.; Han, J.; Li, B.-L. Exploring the effect of floodgates operation systems on water environmental capacity in a regulated river network of Wuxi, China. J. Clean. Prod. 2021, 299, 126743. [Google Scholar] [CrossRef]
- Bu, J.; Li, C.; Wang, X.; Zhang, Y.; Yang, Z. Assessment and prediction of the water ecological carrying capacity in Changzhou city, China. J. Clean. Prod. 2020, 277, 123988. [Google Scholar] [CrossRef]
- Moriasi, D.N.; Arnold, J.G.; Liew, M.W.V.; Bingner, R.L.; Harmel, R.D.; Veith, T.L. Model Evaluation Guidelines for Systematic Quantification of Accuracy in Watershed Simulations. Trans. ASABE 2007, 50, 885–900. [Google Scholar] [CrossRef]
- Kai, P.; Jiake, L.; Xiang, Z.; Huaien, L.; Weifeng, X.; Ke, Z.; Zakir, U. Simulation and control of non-point source pollution based on MIKE model: A case study of Danjiang river basin, China. Ecohydrol. Hydrobiol. 2023, 23, 554–568. [Google Scholar]
- Xie, R.; Pang, Y.; Bao, K. Spatiotemporal distribution of water environmental capacity—A case study on the western areas of Taihu Lake in Jiangsu Province, China. Environ. Sci. Pollut. Res. Int. 2014, 21, 5465–5473. [Google Scholar] [CrossRef]
- Wang, L.; Dang, D.; Liu, Y.; Peng, X.; Liu, R. Dynamic Water Environment Capacity Assessment Based on Control Unit Coupled with SWAT Model and Differential Evolution Algorithm. Water 2023, 15, 1817. [Google Scholar] [CrossRef]
- Bui, L.T.; Pham, H.T.H. Linking hydrological, hydraulic and water quality models for river water environmental capacity assessment. Sci. Total Environ. 2022, 857, 159490. [Google Scholar] [CrossRef] [PubMed]
- HJ 1142-2020; Technical Specification for Supervision of Ecological Conservation Redline—Ecological Function Evaluation (on Trial). Ministry of Ecology and Environment of the People’s Republic of China: Peking, China, 2020.
- Zhong, D. Equal Standard Pollution Load Method for Evaluating the Effect of Pollution Source on Aquatic Environment. China Water Wastewater 2005, 21, 101–103. [Google Scholar]
- Li, H.; Lu, J. Can regional integration control transboundary water pollution? A test from the Yangtze River economic belt. Environ. Sci. Pollut. Res. Int. 2020, 27, 28288–28305. [Google Scholar] [CrossRef] [PubMed]
- He, L.; Yao, L.; Petar, S.V. A Bi-level optimization approach to reduce the pollution burden of lake water with ecological compensation. Ecol. Indic. 2023, 151, 110334. [Google Scholar] [CrossRef]
- Zhang, J.; Wang, J.; Xu, J. Research of River Basin Ecological Compensation Mechanism; Science Press: Peking, China, 2017. [Google Scholar]
- National Development and Reform Commission:Letter on the Reply to the Proposal No. 02110 (No. 162 of Resources and Environment) of the Fifth Meeting of the 13th National Committee of the Chinese People’s Political Consultative Conference. Available online: https://www.ndrc.gov.cn/xxgk/jianyitianfuwen/qgzxwytafwgk/202301/t20230113_1346486.html (accessed on 10 November 2023).
- General Office of the State Council, PRC. The Strictest Regulation for Water Resource Management. (No.2-2013 of General Office of the State Council). Available online: https://www.gov.cn/govweb/zwgk/2013-01/06/content_2305762.htm (accessed on 10 November 2023).
- The National Development and Reform Commission, PRC. Ecological Comprehensive Compensation Pilot Scheme. Available online: https://www.gov.cn/xinwen/2019-11/21/5454116/files/5d2f287f889947a6b3f61440d6fea22a.pdf (accessed on 10 November 2023).
- China Statistical Yearbook; National bureau of Statistic of China: Beijing, China, 2021.
- Ministry of Housing and Urban-Rural Development, PRC. Bulletin on Urban Construction Status in 2022. Available online: https://www.mohurd.gov.cn/gongkai/fdzdgknr/sjfb/index.html (accessed on 10 November 2023).
- Zhou, W.; Zhu, Z.; Xie, Y.; Cai, Y. Impacts of rainfall spatial and temporal variabilities on runoff quality and quantity at the watershed scale. J. Hydrol. 2021, 603, 127057. [Google Scholar] [CrossRef]


| Data Type | Unit | Data Source | |
|---|---|---|---|
| Water quality | Concentration of COD, NH3-N, TP | mg/L | Monthly measurements at 33 boundary cross-sections |
| Concentration of COD, NH3-N, TP | mg/L | Monitoring data from 64 water quality stations | |
| Hydrology | Water elevation, discharge | m, m3/s | Monthly measurements at 33 boundary cross-sections |
| Water elevation, discharge | m, m3/s | Monitoring data from 64 hydrology stations | |
| Point sources | Discharge amount of COD, NH3-N, TP | t/n | Pollution census data of 202 sewage treatment plants |
| Discharge amount of COD, NH3-N, TP | t/n | Pollution census data of 200 key industry sources | |
| Discharge amount of COD, NH3-N, TP | t/n | Pollution census data of 2070 centralized live-poultry farms | |
| Non-point sources | Discharge amount of COD, NH3-N, TP | kg/d | GIS analysis based on underlying distribution |
Disclaimer/Publisher’s Note: The statements, opinions and data contained in all publications are solely those of the individual author(s) and contributor(s) and not of MDPI and/or the editor(s). MDPI and/or the editor(s) disclaim responsibility for any injury to people or property resulting from any ideas, methods, instructions or products referred to in the content. |
© 2024 by the authors. Licensee MDPI, Basel, Switzerland. This article is an open access article distributed under the terms and conditions of the Creative Commons Attribution (CC BY) license (https://creativecommons.org/licenses/by/4.0/).
Share and Cite
Wang, X.; Wang, Y.; Pang, Y.; Wang, K.; Yu, J. Pollution Load Coordination and Eco-Compensation for Trans-Boundary Water Pollution Control: The Case of the Tri-Border Region of the Yangtze Delta. Sustainability 2024, 16, 1151. https://doi.org/10.3390/su16031151
Wang X, Wang Y, Pang Y, Wang K, Yu J. Pollution Load Coordination and Eco-Compensation for Trans-Boundary Water Pollution Control: The Case of the Tri-Border Region of the Yangtze Delta. Sustainability. 2024; 16(3):1151. https://doi.org/10.3390/su16031151
Chicago/Turabian StyleWang, Xiao, Yumeng Wang, Yong Pang, Kan Wang, and Jie Yu. 2024. "Pollution Load Coordination and Eco-Compensation for Trans-Boundary Water Pollution Control: The Case of the Tri-Border Region of the Yangtze Delta" Sustainability 16, no. 3: 1151. https://doi.org/10.3390/su16031151
APA StyleWang, X., Wang, Y., Pang, Y., Wang, K., & Yu, J. (2024). Pollution Load Coordination and Eco-Compensation for Trans-Boundary Water Pollution Control: The Case of the Tri-Border Region of the Yangtze Delta. Sustainability, 16(3), 1151. https://doi.org/10.3390/su16031151