Article

Does Independent Directors’ Interlocking Network Position Affect Green Innovation?

1
Faculty of Business, City University of Macau, Macau 999078, China
2
School of Information Science and Engineering, Southeast University, Nanjing 210096, China
*
Authors to whom correspondence should be addressed.
Sustainability 2024, 16(3), 1089; https://doi.org/10.3390/su16031089
Submission received: 15 December 2023 / Revised: 25 January 2024 / Accepted: 25 January 2024 / Published: 26 January 2024

Abstract

:
Green innovation is a potent driver of sustainability. Drawing on social network theory, this paper used data from Chinese listed companies from 2010 to 2020 as a sample and found that independent directors’ interlocking network position significantly enhanced corporate green innovation. Additionally, digital transformation positively moderated this impact, while environmental regulations exhibited a U-shaped influence on this relationship. Further analysis revealed that independent directors’ interlocking network position can enhance green innovation through leveraging information, resource advantages, and environmental responsibilities. The network position of companies with lower pollution levels and diligent independent directors notably amplified green innovation. This study clarifies the boundary conditions and mechanisms of corporate green innovation, offering new ideas and evidence for sustainability.

1. Introduction

In an era marked by rapid industrialization and urbanization, the conflict between development and environmental protection is escalating. Governments worldwide are actively seeking a balance between economic growth and environmental protection. Green innovation has emerged as a pivotal means for achieving this balance [1,2]. The Chinese government has also recognized the significance of green innovation and has implemented the “Carbon Peak Action Plan Before 2030” [3]. This plan highlights the need to bolster green and low-carbon technological advances, thereby fostering eco-friendly production practices among companies. Nevertheless, the development and application of green innovation often demand substantial investments of time and resources [4]. Meanwhile, owing to path dependence, innovation will not spontaneously turn into green transformation [5]. Therefore, how to bolster corporate green innovation capabilities to achieve the “dual carbon” strategic objective and facilitate the harmonious development of the economy and environmental protection has become an essential issue.
Independent directors, as part of an important corporate governance system, have a profound impact on corporate green innovation. Existing works, e.g., Zhang et al. [6], have shown that the background of independent directors considerably affects corporate green innovation. Independent directors’ interlocking network position (IDINP), which refers to the position occupied by independent directors in the network structure formed through serving in multiple companies at the same time, is a key indicator of an independent director’s background [7]. Notably, more than 90% of Chinese listed companies have hired interlocking independent directors [8]. According to social network theory, IDINP may yield more heterogeneous information and resources, thereby helping independent directors responsibly perform their duties [9], promoting corporate green innovation. Nevertheless, the “busy independent director” theory points out that independent directors wearing multiple hats have to divide their energy [10], and reliance on “relationship” networks may lead independent directors to compromise their independence, knowledge, and efficacy. Therefore, what impact does IDINP have on green innovation? Is this impact influenced by other macro- and micro-governance factors, such as digital transformation and environmental regulation? What is the underlying mechanism driving this effect?
Current research on IDINP has largely explored its economic impact on corporate internal governance and business operations, including outcomes of mergers and acquisitions [7], accounting conservatism [11], corporate investment efficiency [8], and stock price synchronicity [12], as well as the reduction in the risk of stock price crashes [13]. Overall, these studies attributed the observed benefits to the informational and resource-related advantages of IDINP. Current green innovation research primarily focuses on its driving factors, which are broadly divided into three categories. The first category focuses on the resource-based view, exploring factors such as absorptive capacity [1], managerial backgrounds [6,14], stakeholder concerns [15], etc. The second category is grounded in institutional theory, with a focus on factors such as green credit policies [16], environmental regulations [17,18,19], government subsidies [20,21], two-track institutional approaches [22], and so on. The last category draws upon innovation diffusion theory, examining how corporate levels of digitalization [4,23,24,25] and regional digitalization levels [26,27,28,29] affect corporate green innovation.
Although previous research has emphasized IDINP’s positive effects on corporate governance, its influence on green innovation remains unexplored. Qiu and Yu [30] mentioned that independent director networks can affect green innovation but defined them broadly, overlooking emerging factors like technology and regulations. Meanwhile, the aforementioned research has predominantly concentrated on information and resource advantages when investigating the impact mechanism of IDINP, inadvertently overlooking its vital role in advancing environmental responsibilities. Furthermore, while digital transformation and environmental regulation are widely acknowledged as drivers of green innovation, no existing literature has effectively integrated them into a model that considers IDINP and its impact on green innovation. Based on the above observations, this study aimed to establish the connection between IDINP and corporate green innovation and reveal the important moderating role of digital transformation and environmental regulation.
The main contributions of this study are summarized as follows:
  • Enhanced understanding of green innovation factors.Compared to the aforementioned studies that focused on the impact of green innovation based on the resource-based view, institutional theory, and innovation diffusion theory, and that examined factors such as stakeholder attention, government subsidies, and level of digitalization, this paper applies social network theory to explore in depth the impact of IDINP on corporate green innovation, extending the theoretical application of social networks in corporate governance and sustainable development.
    Additionally, this study diverges from the practice of using developed countries as samples by focusing on a developing country, China. Given its distinctive relational culture and its position as the leading emitter of carbon dioxide globally, China epitomizes a vital context for the exploration of green innovation, particularly through the IDINP framework.
  • Capturing moderating variables and an innovative methodological approach. Previous research has focused on the impact of digital transformation and environmental regulation on corporate green innovation [19,25], yet these have not been incorporated as situational variables in a model that also considers IDINP and its effect on green innovation. By comprehensively applying social network theory, neoclassical economics, and the Porter hypothesis, our study reveals, for the first time, the substantial moderating effects of digital transformation and environmental regulation within this framework. This study provides a solid theoretical foundation for governments to formulate green policies and for companies to effectively implement green innovation initiatives.
    Additionally, this study enhances the precision in quantifying the interplay between IDINP and a company’s digital transformation by integrating social network analysis with text analysis. This multifaceted approach surpasses the confines of prior research that relied on a solitary indicator, thereby providing a more holistic understanding of interlocking network positions and digital transformation dynamics.
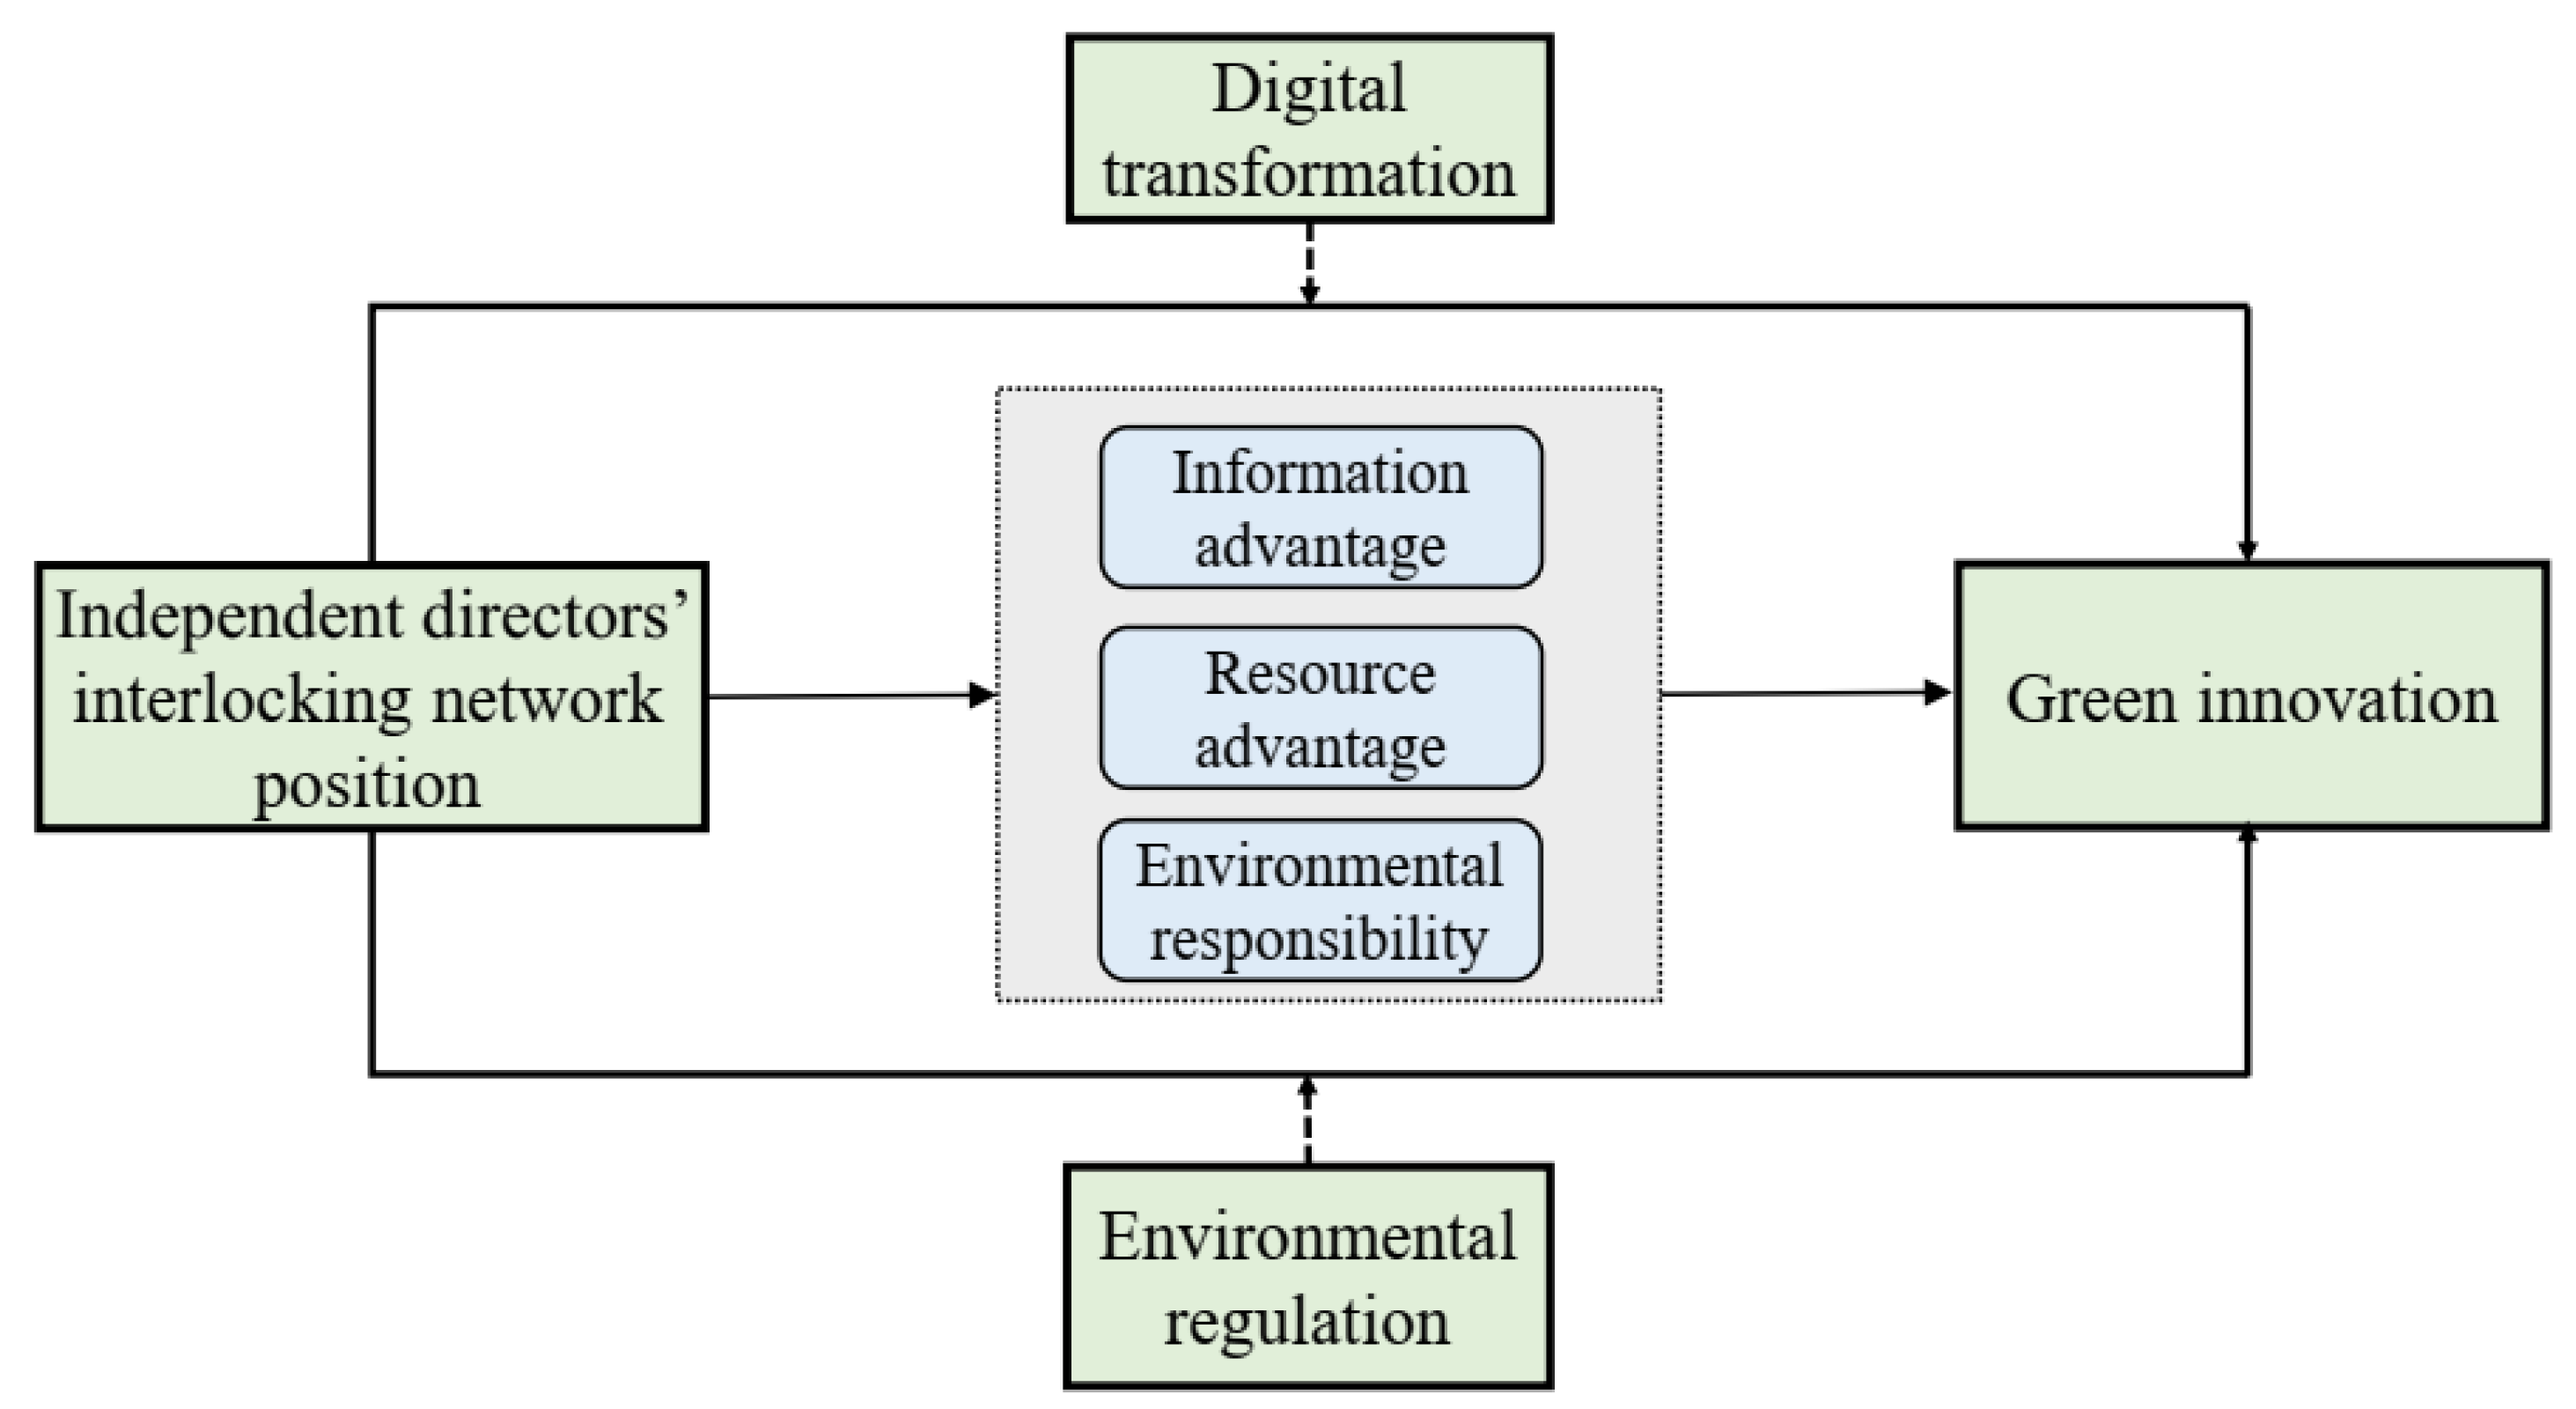
  • Clarification of boundary conditions and mechanisms. This research not only clarifies the contextual constraints that shape the impact of IDINP on corporate green innovation but also, for the first time, reveals how these network positions promote green innovation through novel mechanisms (environmental responsibility).
The paper is organized as follows: Section 2 gives the origin of the hypotheses, while Section 3 presents the data and methodology used in this study. Then, Section 4 discusses the empirical results, and Section 5 goes on to examine the mechanisms and conducts a heterogeneity analysis. Finally, Section 6 briefly summarizes the article’s findings, offers policy proposals, and provides its limitations.

2. Theoretical Analysis and Hypotheses

2.1. IDINP and Green Innovation

Social network theory posits that society is a comprehensive network comprised of connections between individuals, facilitating the exchange of information and resources, thus becoming a valuable resource for cultivating competitive advantages [31]. A fundamental concept within social networks is “centrality” [9], which denotes an actor’s position within the broader social network. The more central the position, the greater its significance within the network. Consequently, this study employs centrality as a metric to gauge IDINP. Regarding the path of impact, this can be elaborated from three aspects: information advantage, resource advantage, and environmental responsibility.
First, we consider the perspective of information advantage: Green innovation, compared with traditional innovation, is a multi-stage and long-term process [32]. In this multi-stage process, companies comprehensively consider environmental and social benefits, while pursuing economic profits and continuously assessing and mitigating impacts on the environment. During this extended period of research, development, and introduction to the market, companies face the challenge of rapidly evolving environmental technologies and standards, requiring them to adjust their business models and value chains promptly to meet new demands. Additionally, since green products and technologies often face greater market uncertainty, companies need to have sufficient insight to respond to risks on time. Consequently, green innovation heavily relies on external information channels [33].
IDINP can serve as an important channel for obtaining external information, and this close connection will also shape the willingness of independent directors to provide green information [20]. Therefore, using this “information bridge” [12], companies can gain access to more comprehensive and in-depth green information. Furthermore, a wealth of diverse information enhances the professionalism and independence of central independent directors [7], empowering them to evaluate green innovation projects objectively and comprehensively. This, in turn, helps companies make a more accurate assessment of green innovation projects, facilitating a more precise understanding of the associated risks and benefits.
Second, considering the perspective of resource advantages: Green innovation is marked by significant uncertainty due to the externalities associated with environmental resource utilization and technological advancements, as well as the requirement for cross-functional collaboration across various departments [14]. Consequently, companies often lack the motivation to carry out green innovation. However, IDINP can mitigate this uncertainty by providing stable internal staff support and external resource investment. On the one hand, independent directors in a central position often have a more prominent voice, which is conducive to gaining the support of internal employees and promoting the integration of dispersed green knowledge and resources [13]. On the other hand, independent directors in a center position can offer companies access to a more extensive and diversified pool of resources through their connections [8]. This, in turn, helps reduce the costs associated with green innovation, while enhancing the likelihood of its success. As Tsai and Ghoshal [34] noted, social ties can facilitate the transfer of productive resources, thereby fostering more significant innovation within organizations. Additionally, Arribas et al. [35] proposed that relationship capital can serve as a catalyst for the development of additional R&D and innovation activities, particularly those with high costs and extended return periods.
Lastly, we consider the perspective of environmental responsibility: Beyond their roles in supervision and consultation, the board must confer legitimacy on the organization and prioritize commitment to gaining support from key stakeholders within the environment. This implies that boards of directors must consider corporate social responsibilities, particularly environmental responsibility [36]. Wang et al. [37] clearly asserted that the board of directors plays a pivotal role as the primary decision-maker regarding corporate environmental responsibility. It is worth noting that independent directors constitute more than one-third of the boards of directors of listed companies in China. Consequently, independent directors must supervise and encourage the board of directors to embrace their environmental responsibilities, thereby fostering corporate green innovation. Moreover, as Granovetter [38] proposed, individuals are embedded within social networks, and their decisions are inevitably influenced by the network’s structure. For independent directors occupying central positions within an interlocking network, high network centrality signifies elevated social status and a favorable social reputation within the network [11]. Whether driven by a need to maintain their image or to consider the pressure exerted by various stakeholders, independent directors are compelled to embrace environmental responsibilities. This, in turn, stimulates the advancement of green innovation. Additionally, Beji et al. [39] conducted empirical tests that confirmed the notion that directors who hold multiple corporate positions tend to place greater emphasis on the environmental performance of the company.
Based on the above analysis, this study asserts that IDINP can yield information and resource advantages, while also encouraging companies to embrace their environmental responsibilities, thereby promoting corporate green innovation. From this, Hypothesis 1 is put forward:
Hypothesis 1.
IDINP enhances corporate green innovation.

2.2. Moderating Role of Digital Transformation

Digital transformation refers to a systematic process in which companies use modern information technology to improve information processing and circulation efficiency [24]. The positive impact of digital transformation on corporate green innovation has been well verified [4,24,25]. Regarding its moderating role, this study analyzes it through the following three dimensions.
First, digital transformation greatly improves the information exchange among independent directors, reducing costs and promoting green innovation. Specifically, through digital platforms, independent directors access and share green innovation information efficiently, consequently narrowing the “information gap” [4]. Moreover, data derived from digital transformation surpasses manual data in terms of accuracy [27], thus enhancing the rationality of decision-making among independent directors and garnering managerial support for green innovation initiatives. Additionally, by using intelligent production equipment and optimizing the green innovation process, companies can decrease the costs associated with gathering green information [28]. Furthermore, after analyzing and processing using digital technologies, the acquired data can yield a substantial volume of high-quality, valuable information. For example, complex causal relationships among multidimensional parameters can be effectively identified through algorithmic analysis, which helps companies discover green innovation opportunities [27].
Second, digital transformation can optimize resource allocation and promote interaction and cooperation within and outside the interlocking network of independent directors, further enhancing their role in green innovation. Specifically, with the help of communication tools such as online platforms and instant messaging, independent directors can obtain and share market information in real-time, thereby evaluating resource allocation more accurately. The limited green innovation resources can also be directed to companies that can maximize their value [1]. Through digital platforms, directors can engage in virtual meetings and online discussions, without geographical limitations [23], helping to design and implement resource integration and distribution strategies. Moreover, digital transformation creates opportunities for independent directors to collaborate with other stakeholders, including government agencies and environmental organizations [40]. This collaboration fosters a broader collective effort to advance green innovation.
Lastly, digital transformation pushes independent directors to embrace environmental responsibilities and forces companies to engage in green innovation. On the one hand, digital technology equips central independent directors with enhanced capabilities for addressing increased environmental challenges [29]. Through digital transformation, they gain access to a broader array of data analysis tools, enabling a more accurate understanding and evaluation of the company’s environmental impact. This aids in designing and implementing eco-innovative products and processes, fulfilling environmental responsibilities more effectively. On the other hand, digital transformation reduces the ability of companies to conceal negative environmental information or to exaggerate environmental performance, forcing independent directors at the center to embrace environmental responsibilities. This, in turn, reinforces corporate commitment to green innovation. Previous works have also confirmed that digital transformation can enhance the quality of internal control [4,25], and good internal control quality can reduce the ability to hide or distort information and strengthen responsibility regarding the disclosure for environmental data [41]. Therefore, within the context of digital transformation, independent directors in the center pay more attention to environmental responsibilities and supervise companies to develop in the direction of green innovation. Accordingly, this study puts forward Hypothesis 2:
Hypothesis 2.
Digital transformation positively moderates the relationship between IDINP and corporate green innovation.

2.3. Moderating Role of Environmental Regulation

Environmental regulation refers to the supervision and control of companies’ pollution behavior through the formulation of laws and regulations, to protect and improve environmental quality [17]. Considering the prolonged nature of green innovation and the threshold effects often associated with environmental regulations, it is crucial to account for the time dimension in our research. Previous studies, such as those conducted by Fan et al. [26] and Li and Du [19], have demonstrated a U-shaped relationship between environmental regulation and green innovation. Consequently, this study will elaborate on the moderating effect of environmental regulation in the following two stages: the short-term “compliance costs”, and the long-term “innovation compensation”.
Neoclassical economics posits that, due to compliance costs, the additional production expenses incurred as a result of environmental regulations may exert a crowding-out effect, potentially hindering corporate innovation [42]. Especially in the initial stage, it is difficult to determine the continuity and certainty of environmental protection policies, which results in a relative lack of information in interlocking networks (especially about environmental regulations), making it impossible to transmit information on green innovation effectively. Furthermore, as the intensity of environmental regulations increases, companies face increasing compliance pressure. To meet regulatory requirements, companies prioritize saving compliance costs. This can be expressed as an increased focus on pollution control expenditures at the expense of other factors, including reduced investments in interlocking network maintenance or research and development of green initiatives [19]. Consequently, this diminishes the positive influence of independent directors’ interlocking network position on corporate green innovation. Several studies have also verified that the compliance cost pressure brought by environmental regulations in the short term reduces the input of other factors and inhibits green innovation. For instance, Tang et al. [17] proposed that China’s “Eleventh Five-Year Plan” environmental regulations temporarily weakened corporate green innovation efficiency by affecting corporate cash flows. Chen et al. [43] found that China’s carbon emissions trading pilot policy has had a significant negative impact on short-term corporate green innovation.
The Porter hypothesis proposes that environmental regulation can form “innovation compensation” [44]. This implies that the benefits gained from green innovation can offset the costs incurred by companies for environmental management, ultimately enhancing their competitiveness in the future [19]. In the long term, the positive regulatory effect of environmental regulations will gradually be released. On the one hand, as environmental regulations become more stringent, companies face heightened environmental pressures and elevated costs associated with environmental governance, motivating them to embrace green innovation [20,22]. Given the significant role of IDINP in green innovation, this further motivates companies to prioritize the assessment of IDINP. On the other hand, when the intensity of environmental regulation exceeds a certain threshold, the economic benefits of early investment in pollution control will gradually increase, and these economic effects can offset the compliance costs from environmental investment. Consequently, this provides added incentives and support for IDINP, empowering companies to gain a competitive edge and sustaining their commitment to green innovation. Based on this, this study posits Hypothesis 3:
Hypothesis 3.
U-shaped environmental regulation moderates the relationship between IDINP and corporate green innovation.
In summary, the conceptual framework developed in this paper is illustrated in Figure 1:

3. Data and Methodology

3.1. Data and Sample Selection

Considering the impact of the “2010 Environmental Information Disclosure Guidelines” released in China and the dataset availability during our research, following Li et al. [45] and Zhang et al. [6], A-share listed companies on the Shanghai and Shenzhen stock exchanges were collected for the period from 2010 to 2020.
All data were obtained from public and authoritative databases and websites commonly used by scholars. Specifically, following Ning et al. [24] and Quan et al. [14], sample data of green patents, which are used to measure green innovation, were derived from the China National Intellectual Property Administration (CNIPA). Following Ning et al. [24], data for digital transformation were derived from the annual reports of listed companies disclosed on the official websites of the Shenzhen and Shanghai Stock Exchanges, obtained through text analysis. Following Dou and Guan [46], data for environmental regulation were derived from the China Statistical Yearbook for the relevant year and the website of the National Bureau of Statistics. The Hexun CSR Report Evaluation System is a specialized online platform dedicated to evaluating corporate social responsibility reports, and it features a comprehensive evaluation framework that includes environmental, social, and governance (ESG) aspects. Data regarding environmental responsibility scores were obtained from this system. Given that the China Stock Market and Accounting Research (CSMAR) database is the largest and most precise financial database in China, following Chen and Nie [8] and Gong et al. [12], the necessary background information on independent directors’ concurrent positions for IDINP were derived from CSMAR. Additionally, other financial data required for this paper were also extracted from this database.
To ensure the accuracy and consistency of data analysis, the data were processed according to the following criteria: (1) Data from the financial sector were excluded, due to the industry’s unique structural characteristics, which can introduce analysis bias. (2) Data from ST and PT category companies were eliminated to prevent research distortion caused by their operational difficulties and atypical market performance. (3) Observations with missing data were removed, to avoid potential bias and misleading inferences. (4) To mitigate against the impact of outliers, all continuous variables were winsorized within a 1% and 99% quantile range. The final dataset comprised 20,209 observations from 3304 companies. The software used for statistical testing in this article included Stata16.0, Python3.5, and Pajek5.11.

3.2. Variable Measurement

3.2.1. Dependent Variable

Green innovation ( G I ): Green patents have the inherent advantage of measuring green technology innovation [23]. Green patents can be divided into two categories: patent applications, and patent authorizations. Since patents usually take a period of time, or even years, to be approved, and as they are affected by the patent granting agency during the review process, selecting patent applications is relatively more stable and reliable. Furthermore, green innovation does not involve design patents [24]. Consequently, this study aligned with the approach used by Liu et al. [4] and employed the total count of green invention patent applications along with green utility model patent applications as metrics for quantifying the extent of green innovation.
Additionally, to address issues related to the right-skewed distribution, the method employed by Chen et al. [25] was adopted, involving adding 1 to the data and applying the logarithmic transformation. Lastly, considering the difference between absolute quantity and relative quantity, this paper used the proportion of the number of green patents applied by an enterprise in that year to the number of all patents applied in that year as a substitute variable for the dependent variable and put this into a robustness test.

3.2.2. Independent Variable

IDINP ( C e n t r a l i t y ): Drawing from the methodology proposed by Guo and Lv [7], centrality was employed as a metric to gauge the interlocking network positions. To obtain centrality data, Python3.5 and Pajek5.11 software were used. The background information of independent directors was queried through Python3.5 software, to ensure the uniqueness of their IDs. Subsequently, an adjacency matrix was constructed using Python3.5 based on the working relationship between independent directors. This matrix was then imported into Pajek5.11 software to calculate centrality. The centrality included degree centrality, closeness centrality, and betweenness centrality [47]. In line with the approach presented by Qu et al. [48], IDINP was assessed through the product of these three centrality measures. Moreover, degree centrality, closeness centrality, and betweenness centrality were subjected to a robustness test to ensure the reliability of the findings, as follows:
Degree centrality measures the number of other independent directors who are directly connected to an independent director. The more direct connections it has, the stronger it is in the overall interlocking network of independent directors. The calculation is performed as follows:
D e g r e e i = j X i , j g 1
where i stands for the independent director i, j represents other independent directors except i, X i j represents the number of network connections, and g represents the total number of independent directors in a certain year. Since the number of independent directors in listed companies in different years is different, g 1 is used to eliminate this size difference. j X i , j represents the number of connections between independent director i and the other independent directors j.
Closeness centrality measures the distance between an independent director and the other independent directors. The closer the distance to the other independent directors, the higher the centrality, and vice versa. That is, in a social network, if a person is less dependent on others in the process of information dissemination, this means that the person’s network status can avoid being controlled by others and they have strong decision-making ability. The calculation is performed as follows:
C l o s e n e s s i = g 1 j = 1 n d i , j
d i , j indicates the number on the shortest path between independent director i and independent director j. j = 1 n d i , j represents the sum of the shortest paths between independent director i and all other independent directors j. This indicator is equal to the reciprocal of the sum of the distances between independent director i and all other independent directors j.
Betweenness centrality measures the degree to which an independent director controls other independent directors in the network. In other words, the independent director in the central position can control the information between the other two nodes and become the medium for information exchange. The calculation is performed as follows:
B e t w e e n n e s s i = j < k g j k ( n i ) g j k ( g 1 ) ( g 2 )
g j k indicates the number of shortest paths connecting independent director i and independent director k, g j k ( n i ) indicates the number of independent directors i on the shortest path between independent director i and independent director k, j < k g j k ( n i ) g j k represents the number of unique tasks i on the shortest connection path of the network.

3.2.3. Moderating Variable

Digital Transformation

Digital Transformation ( D T ): Referring to Huang et al. [49], Python3.5 was used to extract the natural logarithm of the cumulative word frequencies across five distinct dimensions within the textual information found in the company’s annual report. This logarithm serves as a metric for evaluating the progress of corporate digital transformation. These five dimensions of word frequency, pertinent to enterprise digital transformation, included “artificial intelligence technology”, “big data technology”, “cloud computing technology”, “blockchain technology”, and “digital technology application”. Logarithmic transformation was employed to account for the inherent right-skewness frequently observed in such data.

Environmental Regulation

Environmental Regulation ( E R ): The intensity of environmental regulation is a reflection of the pollution control costs of companies. The greater the intensity of environmental regulation, the higher the pollution control costs of companies. Given that this paper predominantly focused on the investment outlays and compensatory aspects of environmental regulation, the intensity of environmental regulation was quantified by assessing the ratio of industrial pollution control investments within the province where the company is located, specifically within the secondary industrial sector.

3.2.4. Control Variable

Drawing on Du et al. [28], this study selected control variables from three aspects: company characteristics, corporate governance, and litigation risk. Among these, company characteristics included company size, nature of property rights, listing age, leverage ratio, inventory ratio, and capital intensity. Corporate governance factors included the shareholding ratio of the top shareholder, the size of the board of directors, the proportion of independent directors, the frequency of board meetings, and duality. Litigation risks included whether the company was audited by a “big four” accounting company and the turnover rate of outstanding shares. Furthermore, heavily polluting companies and the degree of marketization were added as additional variables.
To account for unobservable time and industry-specific effects, this paper also incorporated year and industry dummy variables. Table 1 provides detailed information about these variables.

3.3. Empirical Framework

To test Hypothesis 1, this study constructed the following model:
G I i , t = α 0 + α 1 C e n t r a l i t y i , t + α k Σ k C o n t r o l s i , t + ε i , t
To test Hypothesis 2, the interaction term ( C e n t r a l i t y × D T ) was introduced, and the following model was constructed:
G I i , t = α 0 + α 1 C e n t r a l i t y i , t + α 2 D T i , t + α 3 C e n t r a l i t y i , t × D T i , t + α k Σ k C o n t r o l s i , t + ε i , t
To test Hypothesis 3, this study introduced the first-order and quadratic terms of environmental regulation and their respective interaction terms with IDINP, and constructed the following model:
G I i , t = α 0 + α 1 C e n t r a l i t y i , t + α 2 E R i , t + α 3 E R i , t 2 + α 4 C e n t r a l i t y i , t × E R i , t + α 5 C e n t r a l i t y i , t × E R i , t 2 + α k Σ k C o n t r o l s i , t + ε i , t
In the equation, i is the company and t is the year. C o n t r o l s are the control variables and ε is the random disturbance term.

4. Empirical Analysis

4.1. Descriptive Statistics

Table 2 shows the descriptive statistics for the variables. It can be seen from the table that the average value of green innovation was 0.441 and the median was 0, which means that nearly half of the companies exhibited green innovation practices. China has a considerable journey ahead in the pursuit of green innovation. The mean value of IDINP was 0.009, the maximum value was 0.064, and the minimum value was 0. These values indicate a large variance among IDINP. Moreover, the variance expansion coefficient (VIF) constructed using all variables was less than 5, so there was no issue with varying multicollinearity.

4.2. Basic Regression Results

Table 3 shows the regression results of the relationship between the IDINP ( C e n t r a l i t y ) and the green innovation ( G I ) of the listed companies. Column (1) of Table 3 shows the results of univariate logistic regression. The coefficient of IDINP is significantly positive at the 1% level (Coefficients = 3.4748, p < 0.01). Columns (2) to (4) are the regression results after adding control variables. It is evident that after adding all control variables, the coefficient of the IDINP was still significantly positive at the 1% level (Coefficients = 3.3958, p < 0.01), which means that IDINP was significantly positively related to green innovation. The regression results are consistent with Hypothesis 1.

4.3. Moderating Effect Test Results

Column (1) of Table 4 shows the regression results after adding digital transformation ( D T ) and the interaction item ( C e n t r a l i t y × D T ) of IDINP and digital transformation. The results show that IDINP, digital transformation, and their interaction terms are all significantly positive at the 1% level. This means that digital transformation positively adjusts the correlation between the IDINP and the green innovation of listed companies. Hypothesis 2 is supported.
Column (2) of Table 4 shows the regression results after adding environmental regulation ( E R ) and its quadratic term ( E R 2 ). The results show that IDINP was still significantly positive at the 1% level. Compared with column (4) of Table 3, the coefficient of IDINP decreased. This means that environmental regulation plays a moderating role in the relationship between the IDINP and the green innovation of listed companies.
Column (3) of Table 4 shows the enhanced regression outcomes, which include the interaction terms derived from the linear and quadratic expressions of IDINP and environmental regulation for a more comprehensive analysis. The results show that the interaction term ( C e n t r a l i t y × E R ) of the IDINP and environmental regulation was significantly negative at the 1% level, while the squared term of the interaction term ( C e n t r a l i t y × E R 2 ) was significantly positive at the 5% level. This suggests that in cases of relatively lenient environmental regulation, it exerts an adverse moderating effect on the relationship between IDINP and the levels of green innovation in listed companies. Conversely, when environmental regulation attains a certain level of stringency, it will have a positive regulating effect on the above relationship. In other words, environmental regulation has a U-shaped regulatory impact. Hypothesis 3 is confirmed.

4.4. Robustness Tests

(1)
To mitigate the potential for reverse causality, a one-period lag was applied to both the independent variables and control variables. The regression outcomes for this lagged period are presented in Column (1) of Table 5. The findings reveal that the IDINP, after accounting for a one-period lag, exhibited a significant positive association at the 1% significance level, consistent with the results observed in the baseline model.
(2)
The Heckman two-step method was employed to mitigate against potential sample self-selection issues. In Heckman’s first-stage regression model, the explanatory variable was set as a dummy variable Centrality_D (assigned a value of 1 if the IDINP exceeds the sample median, and 0 otherwise). Additionally, the IDINP for other companies within the same industry was incorporated as an exogenous instrumental variable. Following the computation of the Ni-Mills Ratio (IMR), it was then incorporated into the second-stage model for estimation. The regression results are presented in Column (2) of Table 5 using the Heckman two-step method. The findings indicate that IMR was not statistically significant, while IDINP was significantly positive at the 1% significance level, suggesting the absence of a self-selection problem.
(3)
To further mitigate against endogeneity concerns, instrumental variables were used for testing, and weak instrumental variable tests were performed. Given the challenges in identifying suitable instrumental variables in social network analysis, this study adopted an approach inspired by Hu et al. [9]. This approach introduces IDINP as an independent variable into the regression model to predict residuals, which are subsequently employed as instrumental variables. The rationale behind this choice was that these residuals are independent of the other control variables, while exhibiting a strong correlation with IDINP. The results are shown in column (3) of Table 5. The results show that the positive relationship between the IDINP and the level of green innovation in listed companies remained robust.
(4)
Substituting the dependent variable, we employed the ratio of green patents filed by companies to the total patents filed in a given year (IPC) as a proxy variable. Column (4) of Table 5 displays the regression results with the dependent variable replacement. The findings reveal a significantly positive correlation between IDINP and green innovation within the company at a 1% significance level, aligning with the central hypothesis of this paper.
(5)
Substituting the independent variable, we employed degree centrality ( D e g r e e ), betweenness centrality ( B e t w e e n n e s s ), and closeness centrality ( C l o s e n e s s ) as alternative variables for IDINP. Columns (5)–(7) of Table 5 display the regression results with each independent variable replacement, respectively. The outcomes demonstrated a strong and significantly positive correlation between the degree centrality, betweenness centrality, and closeness centrality of the independent directors’ interlocking network and the level of green innovation among listed companies, all at a 1% significance level. This consistency underscores the robustness of the central findings of this paper.

5. Further Analysis

5.1. Mechanism Test

In the theoretical analysis and hypotheses, this paper delineated three mechanisms through which IDINP can facilitate corporate green innovation: information advantage, resource advantage, and heightened environmental responsibility. To evaluate these mechanisms, and take into account the broad range of information and resource advantages, as well as environmental responsibilities, this article adopted the approach of Gong et al. [12]. According to their perspective, stock price synchronicity reflects the degree of information sharing within Chinese industries. A high level of stock price synchronicity can indicate greater transparency in the information environment among Chinese companies. Therefore, stock price synchronicity was used as an alternative variable to represent information advantage. Furthermore, government subsidies(SUB) received by the company are considered an alternative measure of resource advantage. Additionally, this paper utilized the Hexun CSR report evaluation system’s environmental responsibility rating (CER) as an indicator of environmental responsibility. Consequently, a causal stepwise regression analysis was conducted, followed by Sobel tests to examine the outcomes.
The results of the study are presented in Table 6. Specifically, columns (1) and (2) of Table 6 report the role of information advantage. The coefficients of IDINP and stock price synchrony exhibited significant positive correlations at the 1% significance level. This indicates that the IDINP effectively facilitates information transmission, thereby elevating the level of green innovation among listed companies. Columns (3) and (4) of Table 6 report the role of resource advantages. The coefficients of IDINP and government subsidies are positively related to the green innovation of listed companies at the 1% level. This shows that IDINP is conducive to absorbing government subsidies and providing more resource guarantees for green innovation. Columns (5) and (6) of Table 6 report the role of environmental responsibility. The coefficients of IDINP and environmental responsibility exhibit significant positive correlations at the 1% significance level. This underscores that IDINP indeed encourages companies to assume environmental responsibilities, consequently augmenting the level of green innovation.

5.2. Heterogeneity Analysis

The first consideration was whether the company is a heavy polluter. This study divided the sample into two subgroups based on whether the listed companies qualify as heavy polluters. The results are shown in columns (1) and (2) of Table 7. These findings indicate that the positive association between IDINP and corporate green innovation was statistically significant for non-heavy polluting companies but not for their heavy-polluting counterparts. Possible reasons for this include the following: Non-heavy polluting companies are more likely to implement green innovation because their business models and technical feasibility are more adaptable. In contrast, heavily polluting companies may face higher technical thresholds and cost pressures, thus limiting the implementation of green innovations. In this case, the effect of IDINP may be relatively weak.
The second consideration was whether the independent directors fulfilled their duties diligently. In this study, the attendance rate of independent directors at three meetings was employed as a measure of their diligence. The sample was stratified into two subgroups based on whether the diligence level surpassed the industry average. The results are shown in Table 7, columns (3) and (4). The results show that when independent directors are relatively diligent, the positive relationship between the IDINP and the green innovation of listed companies is more significant. A possible reason for is that when independent directors are relatively diligent, they can devote more time and energy to participating in corporate green innovation-related affairs, thereby better exerting the positive effect of IDINP for green innovation.

6. Discussion and Conclusions

6.1. Discussion

In a time of pressing environmental issues, green innovation is key for corporations pursuing sustainability. Existing research, drawing from the resource-based view, institutional framework, and innovation diffusion theory [1,16,23], has considered the drivers of green innovation. However, explorations of IDINP’s impact on corporate green innovation through social network theory remain scant. This article considered this gap, providing empirical evidence for the positive impact of IDINP on corporate green innovation and highlighting the significant moderating roles played by digital transformation and environmental regulation.
The incremental effect of IDINP on green innovation, with a measured growth factor of 3.3958, underscores the crucial role that independent directors with core positions play in fostering sustainable progress. This finding resonates with the principles of positional value highlighted by social network theory [31] and represents a significant contribution to the literature on corporate governance and sustainability. Concurrently, the control variables including company size, inventory ratio, board size, big four, the degree of marketization, the shareholding ratio of the top shareholder, and the proportion of independent directors were positively correlated with green innovation, which is consistent with the findings in the literature Du et al. [28]. Listing age, capital intensity, frequency of board meetings, and heavy polluting companies were negatively correlated with green innovation, aligning with the literature Quan et al. [14]. However, the nature of property rights, leverage ratio, and duality were not significantly related with green innovation. The inclusion of these control variables not only enhanced the explanatory power of the model but also revealed the multifaceted factors influencing green innovation.
This study highlights digital transformation’s significant impact on enhancing corporate green innovation by adding digital transformation as a moderating variable, reinforcing its importance as a key driver of green innovation [24]. Environmental regulation’s effect displays a U-shaped trend, which is consistent with Fan et al. [26] and Li and Du [19], indicating a complex and layered impact that should be carefully weighed in policy design. Additionally, unlike prior studies, such as those of Guo and LV [7] and Xing et al. [13], which concentrated solely on the informational and resource advantages of IDINP, this paper differentiated itself by illuminating both the informational and resource strengths of IDINP and its notable role in advancing environmental responsibility. In a heterogeneity analysis, this paper found that the positive impact of IDINP on green innovation is more pronounced in non-heavy polluting companies. Possible reasons or this were discussed in the preceding sections. This finding diverges from the predominant focus of the existing literature on studying green innovation within heavily polluting firms [16,49]. Furthermore, the more significant IDINP–green innovation relationship when independent directors exhibit higher diligence underscores the importance of their active engagement in their roles.
This paper has limitations that future research should address and overcome. First, the scope of this study was limited to the Chinese market, due to data collection constraints. As one of the major carbon-emitting countries, it provides a focused case study. However, future research should look beyond China and compare how different countries approach IDINP and its impact on green innovation, to gain a broader understanding. Second, the data used in this study only went up to 2020, limited by the availability of later data. Newer data need to be gathered to better understand the current trends and movements in green innovation. Lastly, this study discussed green innovation without delving into the specific differences between technological and managerial innovation. Green innovation is a wide field, and future studies should explore in more depth how IDINP works in different types of green innovation. Additionally, including more factors like company culture, market demand, and policy support could widen the scope of this research and provide a richer, more varied framework for analysis.

6.2. Conclusions

Based on empirical research conducted on A-share listed companies’ data from 2010 to 2020 in China, this study revealed that IDINP has a significant influence on enhancing corporate green innovation. Moreover, as companies deepen their digital transformation, the positive impact of IDINP on green innovation becomes more pronounced. The effect of environmental regulation on the relationship between IDINP and green innovation is not a simple linear one. In the short term, the compliance cost pressure brought by environmental regulations will inhibit the positive role of IDINP in green innovation. However, when the strictness of environmental regulations exceeds a certain threshold, the economic benefits brought about by initial investments in pollution control will offset the compliance costs. This, in turn, provides greater incentives and support for IDINP, assisting companies in carrying out green innovation. Further analysis found that IDINP can enhance green innovation by leveraging information and resource advantages, and by taking on environmental responsibilities more proactively. Last but not least, this study revealed that this incentivizing effect is more pronounced for companies with less severe pollution issues and those with more diligent independent directors. These findings highlight the critical role of IDINP in driving green innovation across different companies.
Drawing from the findings of this study, the following practical policy suggestions are offered to encourage the advancement of green innovation:
For companies: First, companies, especially those aspiring to accelerate green innovation, should recognize the key role of IDINP in driving green innovation. Companies can systemically cultivate and strengthen their internal IDINP and actively introduce external independent directors who possess social networks, to expand the scope of their corporate social networks, thereby further promoting the positive green effects brought about by these social networks. Second, considering the crucial role digital transformation plays in enhancing the relationship between IDINP and green innovation, companies need to stay current with technological trends and speed up their digitalization efforts. Lastly, given the heterogeneous performance resulting form pollution status and independent director diligence, companies can set up oversight mechanisms to enhance the diligence of their independent directors and improve the company’s green performance, especially in non-polluting companies.
For government departments: First, there is a need to establish a robust supervisory mechanism for independent directors, to ensure that IDINP can truly play a constructive role in promoting corporate green innovation. Relevant government departments should refine their policies surrounding the independent director system and clearly define their duties and operational methods, to ensure their actions can be effectively monitored and regulated. Second, the consistent progression of environmental regulations is vital, considering their prolonged affirmative influence on the synergy between IDINP and green innovations. Government departments need to ascertain the effective enactment of environmental legislation, thereby fostering a regulatory milieu that encourages sustainable growth. This will guide and assist companies in pursuing commercial success, while fulfilling their ecological responsibilities and commitments, thereby achieving sustainable development.

Author Contributions

Conceptualization, Y.H., Z.L. and J.G.; methodology, Y.H., Z.L. and J.G.; software, Y.H.; validation, Y.H.; formal analysis, Y.H. and Z.L.; resources, Y.H.; data curation, Y.H.; writing—original draft preparation, Y.H. and Z.L.; writing—review and editing, J.G.; supervision, J.G. All authors have read and agreed to the published version of the manuscript.

Funding

This research received no external funding.

Institutional Review Board Statement

Not applicable.

Informed Consent Statement

Not applicable.

Data Availability Statement

All data used in this article are from public databases such as CSMAR.

Conflicts of Interest

The authors declare no conflict of interest.

References

  1. Albort-Morant, G.; Leal-Rodríguez, A.L.; De Marchi, V. Absorptive capacity and relationship learning mechanisms as complementary drivers of green innovation performance. J. Knowl. Manag. 2018, 22, 432–452. [Google Scholar] [CrossRef]
  2. Li, C.J.; Razzaq, A.; Irfan, M.; Luqman, A. Green innovation, environmental governance and green investment in China: Exploring the intrinsic mechanisms under the framework of COP26. Technol. Forecast. Soc. 2023, 194, 122708. [Google Scholar] [CrossRef]
  3. Ge, W.; Xu, Y.; Razzaq, A.; Liu, G.; Su, X.; Yang, X.; Ran, Q. What drives the green transformation of enterprises? A case of carbon emissions trading pilot policy in China. Environ. Sci. Pollut. Res. 2023, 30, 56743–56758. [Google Scholar] [CrossRef] [PubMed]
  4. Liu, Q.; Yang, X.; Shen, Z.; Štreimikiene, D. Digital economy and substantial green innovation: Empirical evidence from Chinese listed companies. Technol. Anal. Strateg. 2022, 1–15. [Google Scholar] [CrossRef]
  5. Roh, T.; Lee, K.; Yang, J.Y. How do intellectual property rights and government support drive a firm’s green innovation? The mediating role of open innovation. J. Clean. Prod. 2021, 317, 128422. [Google Scholar] [CrossRef]
  6. Zhang, L.; Zhang, Y.; Li, N.; Zhang, Q. Do the academician independent directors promote green innovation in enterprises? Environ. Sci. Pollut. Res. 2023, 30, 84061–84082. [Google Scholar] [CrossRef] [PubMed]
  7. Guo, C.; Lv, P. Network position of independent director in cross-border mergers and acquisitions. Int. J. Emerg. Mark. 2018, 13, 118–135. [Google Scholar] [CrossRef]
  8. Chen, S.; Nie, Y. Director network, governance of independent directors and efficiency of enterprise capital allocation. Entrep. Res. J. 2020, 13, 163–184. [Google Scholar] [CrossRef]
  9. Hu, H.; Guo, S.; Dou, B.; Wang, A. Chain director network and Chinese listed company violations. Econ. Manag. Stud. 2022, 43, 62–88. (In Chinese) [Google Scholar] [CrossRef]
  10. Beasley, M.S. An empirical analysis of the relation between the board of director composition and financial statement fraud. Account. Rev. 1996, 71, 443–465. Available online: https://www.jstor.org/stable/248566 (accessed on 6 June 2023).
  11. Liang, S.; Chen, D.; Fu, B.; Fang, K. Independent directors’ board networks and accounting conservatism. Chin. J. Account. Stud. 2017, 5, 173–195. [Google Scholar] [CrossRef]
  12. Gong, X.; Wang, Z.; Xiong, X. Independent director network and stock price synchronicity. Syst. Eng. Theory Pract. 2022, 42, 2049–2070. (In Chinese) [Google Scholar] [CrossRef]
  13. Xing, J.; Zhang, Y.; Xiong, X. Social capital, independent director connectedness, and stock price crash risk. Int. Rev. Econ. Financ. 2023, 83, 786–804. [Google Scholar] [CrossRef]
  14. Quan, X.; Ke, Y.; Qian, Y.; Zhang, Y. CEO foreign experience and green innovation: Evidence from China. J. Bus. Ethics 2021, 182, 535–557. [Google Scholar] [CrossRef]
  15. He, F.; Yan, Y.; Hao, J.; Wu, J.G. Retail investor attention and corporate green innovation: Evidence from China. Energy Econ. 2022, 115, 106308. [Google Scholar] [CrossRef]
  16. Hu, G.; Wang, X.; Wang, Y. Can the green credit policy stimulate green innovation in heavily polluting enterprises? Evidence from a quasi-natural experiment in China. Energy Econ. 2021, 98, 105134. [Google Scholar] [CrossRef]
  17. Tang, K.; Qiu, Y.; Zhou, D. Does command-and-control regulation promote green innovation performance? Evidence from China’s industrial enterprises. Sci. Total Environ. 2020, 712, 136362. [Google Scholar] [CrossRef]
  18. Zhang, J.; Kang, L.; Li, H.; Ballesteros-Pérez, P.; Skitmore, M.; Zuo, J. The impact of environmental regulations on urban Green innovation efficiency: The case of Xi’an. Sustain. Cities Soc. 2020, 57, 102123. [Google Scholar] [CrossRef]
  19. Li, J.; Du, Y. Spatial effect of environmental regulation on green innovation efficiency: Evidence from prefectural-level cities in China. J. Clean. Prod. 2021, 286, 125032. [Google Scholar] [CrossRef]
  20. Bai, Y.; Song, S.; Jiao, J.; Yang, R. The impacts of government R&D subsidies on green innovation: Evidence from Chinese energy-intensive firms. J. Clean. Prod. 2019, 233, 819–829. [Google Scholar] [CrossRef]
  21. Xia, L.; Gao, S.; Wei, J.; Ding, Q. Government subsidy and corporate green innovation-Does board governance play a role? Energy Policy 2022, 161, 112720. [Google Scholar] [CrossRef]
  22. Roh, T.; Yu, B. Paving a Way Toward Green World: Two-Track Institutional Approaches and Corporate Green Innovation. IEEE Trans. Eng. Manag. 2023, 1–14. [Google Scholar] [CrossRef]
  23. Dou, Q.; Gao, X. The double-edged role of the digital economy in firm green innovation: Micro-evidence from Chinese manufacturing industry. Environ. Sci. Pollut. Res. 2022, 29, 67856–67874. [Google Scholar] [CrossRef] [PubMed]
  24. Ning, J.; Jiang, X.; Luo, J. Relationship between enterprise digitalization and green innovation: A mediated moderation model. J. Innov. Knowl. 2023, 8, 100326. [Google Scholar] [CrossRef]
  25. Chen, X.; Zhou, P.; Hu, D. Influences of the ongoing digital transformation of the Chinese Economy on innovation of sustainable green technologies. Sci. Total Environ. 2023, 875, 162708. [Google Scholar] [CrossRef]
  26. Fan, F.; Lian, H.; Liu, X.; Wang, X. Can environmental regulation promote urban green innovation Efficiency? An empirical study based on Chinese cities. J. Clean. Prod. 2021, 287, 125060. [Google Scholar] [CrossRef]
  27. Sun, S.; Guo, L. Digital transformation, green innovation and the Solow productivity paradox. PLoS ONE 2022, 17, e0270928. [Google Scholar] [CrossRef] [PubMed]
  28. Du, J.; Shen, Z.; Song, M.; Zhang, L. Nexus between digital transformation and energy technology innovation: An empirical test of A-share listed enterprises. Energy Econ. 2023, 120, 106572. [Google Scholar] [CrossRef]
  29. Xu, J.; Yu, Y.; Zhang, M.; Zhang, J.Z. Impacts of digital transformation on eco-innovation and sustainable performance: Evidence from Chinese manufacturing companies. J. Clean. Prod. 2023, 393, 136278. [Google Scholar] [CrossRef]
  30. Qiu, Q.; Yu, J. Impact of independent director network on corporate green innovation: Evidence from Chinese listed companies. Corp. Soc. Responsib. Environ. Manag. 2023, 30, 3271–3293. [Google Scholar] [CrossRef]
  31. Williams, N.; Vorley, T. Institutional asymmetry: How formal and informal institutions affect entrepreneurship in Bulgaria. Int. Small Bus. J. 2015, 33, 840–861. [Google Scholar] [CrossRef]
  32. Fliaster, A.; Kolloch, M. Implementation of green innovations–The impact of stakeholders and their network relations. R&D Manag. 2017, 47, 689–700. [Google Scholar] [CrossRef]
  33. Duan, Y.; Liu, H.; Yang, M.; Chin, T.; Peng, L.; Russo, G.; Dezi, L. The moderating effect of corporate environmental responsibility on relational capital and green innovation: Evidence from a knowledge-driven context. J. Intellect. Cap. 2022, 24, 1002–1024. [Google Scholar] [CrossRef]
  34. Tsai, W.; Ghoshal, S. Social capital and value creation: The role of intrafirm networks. Acad. Manag. J. 1998, 41, 464–476. [Google Scholar] [CrossRef]
  35. Arribas, I.; Hernández, P.; Vila, J.E. Guanxi, performance and innovation in entrepreneurial service projects. Manag. Decis. 2013, 51, 173–183. [Google Scholar] [CrossRef]
  36. Ingley, C.B. Company growth and board attitudes to corporate social responsibility. Int. J. Bus. Gov. Ethics 2008, 4, 17–39. [Google Scholar] [CrossRef]
  37. Wang, Y.; Wilson, C.; Li, Y. Gender attitudes and the effect of board gender diversity on corporate environmental responsibility. Emerg. Mark. Rev. 2021, 47, 100744. [Google Scholar] [CrossRef]
  38. Granovetter, M. Economic action and social structure: The problem of embeddedness. Am. J. Sociol. 1985, 91, 481–510. [Google Scholar] [CrossRef]
  39. Beji, R.; Yousfi, O.; Loukil, N.; Omri, A. Board diversity and corporate social responsibility: Empirical evidence from France. J. Bus. Ethics 2021, 173, 133–155. [Google Scholar] [CrossRef]
  40. Brodeur, J.; Pellerin, R.; Deschamps, I. Collaborative approach to digital transformation (CADT) model for manufacturing SMEs. J. Manuf. Technol. Manag. 2022, 33, 61–83. [Google Scholar] [CrossRef]
  41. Boulhaga, M.; Bouri, A.; Elamer, A.A.; Ibrahim, B.A. Environmental, social and governance ratings and firm performance: The moderating role of internal control quality. Corp. Soc. Responsib. Environ. Manag. 2023, 30, 134–145. [Google Scholar] [CrossRef]
  42. Jaffe, A.B.; Peterson, S.R.; Portney, P.R.; Stavins, R.N. Environmental regulation and the competitiveness of US manufacturing: What does the evidence tell us? J. Econ. Lit. 1995, 33, 132–163. [Google Scholar]
  43. Chen, Z.; Zhang, X.; Chen, F. Do carbon emission trading schemes stimulate green innovation in enterprises? Evidence from China. Technol. Forecast. Soc. 2021, 168, 120744. [Google Scholar] [CrossRef]
  44. Porter, M.E.; van der Linde, C. Toward a new conception of the environment-competitiveness relationship. J. Econ. Perspect. 1995, 9, 97–118. [Google Scholar] [CrossRef]
  45. Li, Z.; Huang, Z.; Su, Y. New media environment, environmental regulation and corporate green technology innovation: Evidence from China. Energ. Econ. 2023, 119, 106545. [Google Scholar] [CrossRef]
  46. Dou, Y.; Guan, S. The regionally heterogeneous impact of China’s environmental regulation on the transformation and upgrading of its industrial structure. Sustainability 2023, 15, 16939. [Google Scholar] [CrossRef]
  47. Freeman, L.C. Centrality in social networks conceptual clarification. Soc. Netw. 1978, 1, 215–239. [Google Scholar] [CrossRef]
  48. Qu, L.; Li, Y.; Xie, Z. Research on the impact of executive chain network on the effectiveness of shareholder incentives: Internal mechanism and empirical test. J. Zhejiang Gongshang Univ. 2019, 36, 205–206. (In Chinese) [Google Scholar] [CrossRef]
  49. Huang, Y.; Bai, F.; Shang, M.; Liang, B. Catalyst or stumbling block: Do green finance policies affect digital transformation of heavily polluting enterprises? Environ. Sci. Pollut. Res. 2023, 30, 89036–89048. [Google Scholar] [CrossRef] [PubMed]
Figure 1. The conceptual framework of this paper. The impact of IDINP on green innovation, with digital transformation and environmental regulation as moderating factors.
Sustainability 16 01089 g001
Table 1. Definition of variables. The measurement methods for each statistical variable.
TypeNameSymbolDefinitions
Dependent VariableGreen InnovationGIThe natural logarithm of the total number of green patent applications filed by the company that year plus 1
Independent VariableInterlocking Network Position of Independent DirectorsCentralityThe product of degree centrality, closeness centrality, and betweenness centrality
Moderating VariableDigital TransformationDTFrequency of words related to digital transformation in annual reports
Environmental RegulationERThe intensity of environmental regulations in the province to which the company belongs
Control VariableCompany SizeSizeThe natural logarithm of the company’s total assets
Nature of Property RightsSoeDummy variable, the state-owned value is 1, otherwise it is 0
listing AgeAgeCompany listing age
Leverage ratioLevTotal liabilities at the end of the year divided by total assets at the end of the year
Inventory RatioInvEnding inventory divided by ending total assets
Capital IntensityCapRatio of net fixed assets at the end of the year divided by total assets at the end of the year
The Shareholding Ratio of the Top ShareholderTopThe ratio of the number of shares held by the largest shareholder to the total share capital
Size of the boardBoardTotal number of board members
Proportion of Independent DirectorsIndepProportion of independent directors on the board of directors
The Frequency of Board MeetingsMeetingNumber of board meetings held per year
DualityDualThe dummy variable equals 1 if the Chairman and CEO are the same person, 0 otherwise
BigFourBigfourDummy variable, takes the value 1 if audited by the Big Four, otherwise 0
Turnover Rate of Outstanding SharesTurnoverAnnual stock trading volume divided by stock outstanding capital
Heavy Polluting EnterprisesPollutionDummy variable, if the enterprise belongs to a heavily polluting industry, the value is 1, otherwise, it is 0
Marketization DegreeMarketDummy variable, the marketization index of the current year where the company is located is higher than the national median of that year, and the value is 1, otherwise, it is 0
Year & Industry DummiesYearYearYear dummy variables are assigned a value of 1 for the relevant year and 0 for all other years.
IndustryIndustryIndustry dummy variables are assigned as binary indicators based on the standard industry classification (CSRC’s Industry Classification of Listed Companies, revised edition 2012), with a value of 1 for companies in a specific industry and 0 for all others.
Table 2. Results of descriptive statistics. Observing the observations, mean, standard deviation, median, minimum value, maximum value, and VIF of each variable provides an understanding of the dataset’s characteristics.
VariableNMeanStd. Dev.MedianMinMaxVIF
GI202090.4410.8520.0000.0003.850-
Centrality202090.0090.0130.0040.0000.0641.05
DT202098.62121.1401.0000.000132.0001.45
ER2020921.09015.32015.8703.07277.6501.39
Size2020921.9801.30221.82019.30025.9201.39
Soe202090.3940.4890.0000.0001.0001.24
Age2020910.0006.7759.0000.00025.0001.22
Lev202091.4131.1381.0880.0008.4911.03
Inv202090.8812.9680.1100.00023.0501.36
Cap202090.2220.1670.1870.0020.7131.41
Top2020934.49014.90032.2008.50074.4501.10
Board202098.6541.7329.0005.00015.0001.44
Indep202090.3750.0540.3530.3330.5711.50
Meeting2020915.2206.01714.0005.00035.0001.10
Dual202090.2560.4770.0000.0001.0001.10
Bigfour202090.0550.2290.0000.0001.0001.13
Pollution202090.2680.4430.0000.0001.0001.43
Market202090.8300.3751.0000.0001.0001.28
Table 3. Regression results of the impact of IDINP on corporate green innovation. IDINP is highly related to green innovation.
Variable(1)(2)(3)(4)
Centrality3.4748 ***
(7.3174)
2.9594 ***
(6.3051)
2.9697 ***
(6.4909)
3.3958 ***
(7.7074)
Size-0.0109 **
(2.0731)
0.0096 *
(1.8989)
0.0171 ***
(3.5038)
Soe-0.0127
(0.9561)
0.0071
(0.5533)
0.0089
(0.7235)
Age-−0.0138 ***
(−15.2978)
−0.0157 ***
(−17.9613)
−0.0074 ***
(−8.4101)
Lev-0.0030
(0.5679)
0.0028
(0.5566)
0.0008
(0.1697)
Inv-0.0155 ***
(8.0348)
0.0141 ***
(7.5544)
0.0204 ***
(10.8357)
Cap-0.0080
(0.2130)
0.0557
(1.5347)
−0.1263 ***
(−3.3243)
Top-−0.0007 *
(−1.8133)
−0.0001
(−0.2452)
0.0006 *
(1.7046)
Board-0.0314 ***
(7.8625)
0.0401 ***
(10.3444)
0.0409 ***
(10.9128)
Indep-0.3127 **
(2.3627)
0.2488 *
(1.9463)
0.2448 **
(1.9870)
Meeting-−0.0024 **
(−2.3496)
−0.0018 *
(−1.8190)
−0.0017 *
(−1.7910)
Dual-0.0339 **
(2.4372)
0.0149
(1.1085)
0.0087
(0.6686)
Bigfour-0.4142 ***
(15.4074)
0.3991 ***
(15.3669)
0.4252 ***
(16.9051)
Pollution-−0.2051 ***
(−14.9844)
−0.1918 ***
(−14.5025)
−0.3993 ***
(−27.3749)
Market-0.1227 ***
(7.6876)
0.0980 ***
(6.3474)
0.1248 ***
(8.3317)
Year--ControlControl
Industry---Control
Constant0.4096 ***
(55.5259)
0.7464 ***
(4.7161)
0.4682 ***
(3.0255)
0.0573
(0.3669)
R 2 0.00260.05220.11660.1848
Observations20209202092020920209
Note: z-statistics are shown in brackets. *** p < 0.01; ** p < 0.05; * p < 0.1.
Table 4. The test results for the moderating effect. The moderating variables are digital transformation and environmental regulation.
Variable(1)(2)(3)
Centrality2.4947 ***
(5.2162)
3.3824 ***
(7.6777)
6.5038 ***
(5.4458)
DT0.0026 ***
(7.2657)
--
Centrality × DT0.1064 ***
(4.4645)
--
ER-−0.0008
(−0.6615)
0.0014
(0.9685)
ER 2 -0.0000
(0.5953)
−0.0000
(−0.8427)
Centrality × ER--−0.2482 ***
(−2.6922)
Centrality × ER 2 --0.0031 **
(2.3139)
Size0.0189 ***
(3.8695)
0.0188 ***
(3.8297)
0.0187 ***
(3.8125)
Soe0.0075
(0.6127)
0.0085
(0.6917)
0.0085
(0.6882)
Age−0.0071 ***
(−8.0547)
−0.0076 ***
(−8.5616)
−0.0076 ***
(−8.6240)
Lev0.0009
(0.1903)
0.0008
(0.1694)
0.0009
(0.1766)
Inv0.0244 ***
(11.4932)
0.0248 ***
(11.6576)
0.0248 ***
(11.6537)
Cap−0.0558
(−1.4554)
−0.1219 ***
(−3.2011)
−0.1239 ***
(−3.2534)
Top0.0008 **
(2.1459)
0.0006
(1.5761)
0.0006
(1.5835)
Board0.0387 ***
(10.3534)
0.0403 ***
(10.7537)
0.0402 ***
(10.7330)
Indep0.1873
(1.5253)
0.2306 *
(1.8719)
0.2260 *
(1.8342)
Meeting−0.0017 *
(−1.7622)
−0.0017 *
(−1.8172)
−0.0017 *
(−1.7995)
Dual0.0035
(0.2707)
0.0084
(0.6491)
0.0089
(0.6834)
Bigfour0.4237 ***
(16.9050)
0.4249 ***
(16.8892)
0.4251 ***
(16.8967)
Pollution−0.3890 ***
(−26.7316)
−0.3986 ***
(−27.3301)
−0.3984 ***
(−27.3157)
Market0.1220 ***
(8.1754)
0.1235 ***
(7.5345)
0.1243 ***
(7.5818)
YearControlControlControl
IndustryControlControlControl
Constant0.0248
(0.1589)
0.0322
(0.2039)
0.0064
(0.0406)
R 2 0.19140.18560.1859
Observations202092020920209
Note: z-statistics are shown in brackets. *** p < 0.01; ** p < 0.05; * p < 0.1.
Table 5. Endogeneity and robustness test results. The approaches included the use of lagged variables, Heckman two-stage correction, instrumental variables, and replacing dependent and independent variables.
Variable(1)(2)(3)(4)(5)(6)(7)
Centrality3.2256 ***
(6.7857)
3.3884 ***
(4.2123)
3.4216 ***
(7.7083)
0.2644 ***
(2.8847)
---
Degree----0.0022 ***
(6.0018)
--
Closeness-----0.7893 ***
(6.1095)
-
Betweenness------31.3968 ***
(7.0358)
ControlYesYesYesYesYesYesYes
YearYesYesYesYesYesYesYes
IndustryYesYesYesYesYesYesControl
Constant0.1054
(0.5835)
−0.7729
(−1.1258)
0.0416
(0.2640)
0.0955 ***
(2.9317)
0.0197
(0.1255)
−0.0201
(−0.1286)
−0.0090
(−0.0576)
IMR-0.3926
(1.2755)
-----
Wald chi2(41)--4557.09----
Prob > chi2--0.0000----
R 2 0.19290.18560.18650.09480.18460.18470.1852
Observations15682202091987820209202092020920209
Note: z-statistics are shown in brackets. *** p < 0.01.
Table 6. Test results of the mechanism of IDINP and corporate green innovation. Testing the mediating role of informational advantage, resource advantage, and environmental responsibility.
VariableInformation AdvantageResource AdvantageEnvironmental
Responsibility
(1) (2) (3) (4) (5) (6)
Centrality-3.2965 ***
(7.3463)
-2.3911 ***
(5.2711)
-3.2023 ***
(7.1275)
SYN0.3197 ***
(9.8156)
0.3127 ***
(9.6075)
----
SUB--0.0864 ***
(25.7847)
0.0850 ***
(25.3034)
--
CER----0.0125 ***
(10.3642)
0.0122 ***
(10.1045)
ControlsYesYesYesYesYesYes
Constant−0.1748
(−1.0860)
−0.1590
(−0.9889)
−1.1696 ***
(−6.9694)
−1.1438 ***
(−6.8176)
0.0084
(0.0512)
0.0060
(0.0370)
R 2 0.18850.19070.20610.20720.18640.1886
Observations195131951319149191491896518965
Sobel test0.0518 *** (2.676)1.2370 *** (10.61)0.1016 *** (3.783)
Indirect effect0.0518 *** (2.6758)1.230 *** (10.6080)0.1016 *** (3.7829)
Direct effect2.9101 *** (6.0690)1.5523 *** (3.2467)2.4258 *** (5.0308)
Total effect2.9619 *** (6.1756)2.7893 *** (5.7034)2.5274 *** (5.2431)
Proportion of total effect that is mediated0.01740.44340.0402
Note: z-statistics are shown in brackets. *** p < 0.01.
Table 7. Heterogeneity Analysis results. Distinguishing whether a company is a heavy polluter and whether independent directors are relatively diligent.
VariableNon-Heavy PollutionHeavy PollutionNon-DiligentDiligent
(1) (2) (3) (4)
Centrality4.6878 ***
(8.6155)
−0.5703
(−0.8431)
4.7592 **
(2.2620)
3.2374 ***
(7.4711)
ControlsYesYesYesYes
Constant−0.0286
(−0.1485)
0.1548
(0.6810)
−1.2937 *
(−1.6598)
0.0940
(0.5900)
R 2 0.17940.20130.20050.1853
Observations14791541863219577
Note: z-statistics are shown in brackets. *** p < 0.01; ** p < 0.05; * p < 0.1.
Disclaimer/Publisher’s Note: The statements, opinions and data contained in all publications are solely those of the individual author(s) and contributor(s) and not of MDPI and/or the editor(s). MDPI and/or the editor(s) disclaim responsibility for any injury to people or property resulting from any ideas, methods, instructions or products referred to in the content.

