Abstract
Tropical crops face significant challenges from abiotic and biotic stressors, resulting in substantial losses. This study aimed to assess the yield and losses in Bt soybean crops in Tocantins state, northern Brazil, during the 2017/2018 and 2018/2019 growing seasons. We monitored and estimated yield losses and their contributing factors in commercial fields, spanning dry and rainy seasons, from planting to harvest. Our findings revealed that crop yields remained consistent between the dry season (4349.85 kg/ha) and the rainy season (4206.51 kg/ha). Similarly, the overall yield loss showed no significant variation between seasons, with values of 902.86 kg/ha (dry) and 1007.92 kg/ha (rainy). Nevertheless, the factors contributing to these losses exhibited season-dependent variations. We observed higher plant mortality rates during the dry season, whereas insects (particularly stink bugs) and fungi were the primary contributors to grain yield losses during the rainy season. Conversely, losses due to flower abortion and pod malformation remained relatively consistent between the two seasons. Our study underscores the increase in soybean yield in one of Brazil’s agricultural frontiers. While overall yield and losses remained stable between dry and rainy seasons, the distinct seasonal patterns influencing yield losses call for nuanced and season-specific strategies in sustainable crop management.
1. Introduction
Soybean (Glycine max (L.) Merrill) holds the distinction of being the most extensively cultivated legume on a global scale. Its cultivation spans 136.02 million hectares, resulting in an annual production of 369.02 million tons [1]. Soybeans and their derivatives play a pivotal role in human and animal nutrition, and the global demand for these versatile grains continues to rise steadily [2]. Consequently, a pressing worldwide challenge revolves around achieving high yields while mitigating yield losses [3,4].
The expansion of soybean cultivation has primarily occurred in tropical regions through exploring new agricultural areas and introducing additional cultivation cycles [1]. For instance, in Brazil, soybean cultivation has extended to encompass the northern and northeastern regions, where Bt (Bacillus thuringiensis (Bt) protein) soybean varieties are cultivated biannually [5]. These regions are characterized by a climate typified by year-round high air temperatures, marked by well-defined dry and rainy seasons [5,6]. Nonetheless, despite the favorable climatic conditions prevailing throughout the year in these regions, discernible yield losses have been documented in Bt soybean crops [4].
Tropical crops face abiotic and biotic stressors, collectively causing multifaceted losses [7]. Elevated temperatures coupled with arid conditions can accentuate the incidence of soybean flower abortion and pod malformation [8]. Conversely, disease infestations intensify in response to increased moisture levels [3,4,9]. Notably, adopting Bt soybean crops in north-northeast Brazil was principally motivated by its efficacy in managing pests [10]. Nonetheless, while Bt soybeans exhibit substantial lethality against certain caterpillar species (e.g., Chrysodeixis includens and Anticarsia gemmatalis (Lepidoptera: Noctuidae)), a surge in infestations by other pests such as Spodoptera spp. (Lepidoptera: Noctuidae) has been documented [10]. Furthermore, various pests manifest during the initial stages of plant growth, thereby diminishing the plant stand [11]. Stink bugs (Hemiptera: Pentatomidae) also damage pods to a considerable extent during harvest [12].
Previous research has indicated that among the critical factors limiting soybean yield in tropical and subtropical regions, dry conditions constitute a significant bottleneck, alongside issues related to management, pests, and diseases. Estimations conducted in 2015 for the Tocantins, located in northern Brazil, suggested that yield improvements could yield a range between 3301 to 3550 kg/ha [13]. At that point, the attainable yield ranged from 2801 to 3100 kg/ha. After these estimations, efforts have been undertaken to enhance soybean production, including developing cultivars endowed with tolerance to dry conditions [14]. However, there is a lack of studies that quantify the specific factors associated with in situ conditions. Such quantification is imperative for updating previous assessments and facilitating effective management strategies to mitigate crop losses [4,5].
Crop life table studies represent a well-suited approach for comprehensively evaluating crop yield losses [15]. This method directly facilitates estimating yield and losses incurred by individual plant production components, drawing upon field-collected data [16,17]. Therefore, our primary aim was to employ this method to assess yield and yield losses in Bt soybean crops within northern Brazil’s agricultural frontiers. This approach holds particular importance in sustainable agriculture, offering a robust framework to comprehend the multifaceted factors contributing to fluctuations in crop yields. By monitoring and estimating yield losses and their contributing factors across both dry and rainy seasons in commercial Bt soybean fields, our study seeks to provide valuable insights essential for devising sustainable crop management strategies.
2. Materials and Methods
2.1. Experimental Conditions
The study was conducted during the 2017/2018 and 2018/2019 agricultural seasons in four commercial soybean fields. These fields were dedicated to the cultivation of the M8808 IPRO soybean variety, which is characterized by its transgenic properties, including the expression of Bacillus thuringiensis (Bt) protein to control lepidopteran pests and its tolerance to glyphosate (RR). These fields were located in the municipalities of Formoso do Araguaia and Gurupi, both in the state of Tocantins, in northern Brazil. The region is typified by a tropical climate, featuring distinct dry and rainy seasons (Figure 1).
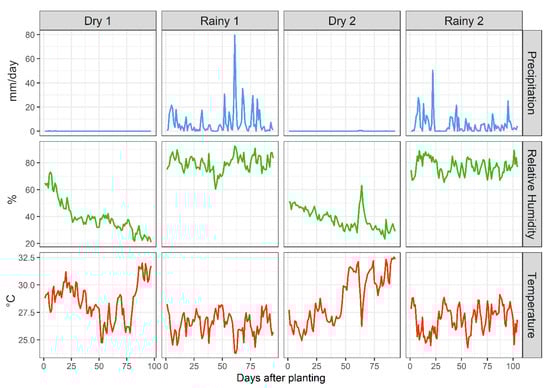
Figure 1.
Weather conditions during Bt soybean crop cultivation (days after planting) in Formoso do Araguaia (Dry Years 1 and 2) and Gurupi (Rainy Years 1 and 2), Tocantins, northern Brazil. Year 1 refers to 2017/2018 and Year 2 refers to 2018/2019. The daily data represent a 24 h average derived from continuous data collection over the entire day.
Two fields were subject to monitoring during the dry season: Field 1 (Year 1), spanning an area of 24.88 hectares (11°55′23.8″ S, 49°41′40.7″ W, altitude 193 m), and Field 3 (Year 2), encompassing 18 hectares (11°49′02.8″ S, 49°39′15.4″ W, altitude 190 m). Additionally, two fields were monitored during the rainy season: Field 2 (Year 1), covering 7.12 ha (11°48′10.3″ S, 49°00′29.3″ W, altitude 285 m), and Field 4 (Year 2), with an area of 15.84 ha (11°45′20.9″ S, 48°51′24.2″ W, altitude 262 m). The soil type classification in Fields 1 and 3 is plinthosol; in Fields 2 and 4, it is oxisols. A uniform planting spacing of 0.45 × 0.10 m was maintained across all fields, and standard cultivation practices, including insecticides and fungicides, were consistently implemented [18]. Throughout the entire cultivation, four applications of fungicides, four applications of insecticides, and three applications of herbicides were carried out. The concentrations used were in accordance with the manufacturers’ instructions. The insecticides applied (active ingredient (chemical subgroup)) were acetamiprid (neonicotinoid), bifenthrin (pyrethroids), diflubenzuron (benzoylureas), and methomyl (carbamates), and the entomopathogenic fungi Isaria fumosorosea (strain ESALQ-1296). The fungicides included (active ingredient (chemical group)) azoxystrobin (strobilurin), boscalid (carboxamides), epoxiconazole (azole), fludioxonil (phenylpyrrole), and pyraclostrobin (strobilurin). Finally, the herbicides applied were (active ingredient (chemical group)) clethodim (cyclohexanedione), diquat dibromide (bipyridinium), and glyphosate (organophosphorus). Throughout the study, meteorological stations at each location facilitated the monitoring of daily average air temperature, precipitation levels, and relative humidity (Figure 1).
2.2. Evaluation of Soybean Yield Loss Factors
Each field was subdivided into 20 replicate sub-areas, each spanning 1000 m2. The impacts of each factor on four soybean phenology stages (plants, flowers, pods, and grains) were monitored and quantified (as illustrated in Figure 2) at 7-day intervals, beginning from the germination stage and extending through to the harvest period.
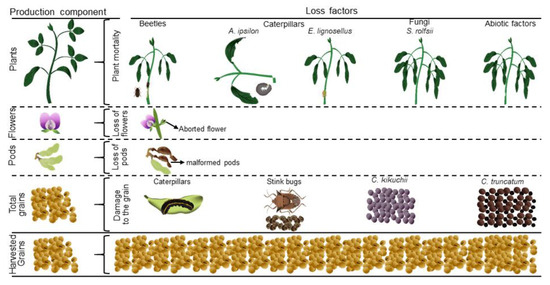
Figure 2.
Production components and loss factors in commercial soybean fields.
2.3. Evaluation of Plant Mortality Losses
Plant mortality was systematically observed within 1000 plants in each replicate’s central portion. Whenever plant mortality occurred, the underlying cause was meticulously documented. Mortality attributed to insect infestations was identified by directly observing the resulting damage. For instance, beetles (order Coleoptera) were noted for causing mortality by severing young seedlings and stems. At the same time, caterpillars were observed cutting stems at ground level during the plant’s initial stage or tunneling through branches close to the soil [19]. In all instances where insects were found to be responsible for these damages, they were carefully separated into distinct morphospecies, cataloged, and subsequently preserved in a 90% ethanol solution. Taxonomic identification was conducted by comparing specimens with reference materials available at the Regional Museum of Entomology, Federal University of Viçosa, Viçosa, located in Minas Gerais, Brazil, and by consulting relevant taxonomic literature [19].
Plants exhibiting permanent wilting, desiccation, or displaying other disease-related symptoms, such as stem necrosis [9,20], were individually encased in plastic bags and transported to the Phytopathology Laboratory, located at the Federal University of Tocantins in Gurupi, TO, Brazil. Lesion-associated tissue fragments were subjected to a thorough cleaning process involving an initial immersion in a 50% ethanolic solution for 40 s. Subsequently, these fragments underwent a 40 s immersion in a 1% sodium hypochlorite solution, followed by three consecutive rinses with sterile distilled water. The cleaned fragments were then positioned within Petri dishes (9 cm in diameter and 2 cm in height) containing potato dextrose agar (PDA) as the growth medium. These dishes were subsequently incubated in a BOD incubator at 25 °C for seven days. Pathogens were conclusively identified by applying taxonomic literature references [20].
2.4. Evaluation of Losses of Flowers, Pods, and Grains
A random sample of 20 plants was selected within each replicate to assess losses of flowers, pods, and grains. The flowering and pod-bearing plants were identified and quantified once they entered the reproductive stage. In these plants, when a flower or pod was lost, the cause of this loss was recorded (e.g., abortion or malformation) (Figure 2).
To evaluate grain losses, we documented damage and its underlying causes within pods exhibiting lesions, including insect infestations and pathogens. Additionally, during the harvesting process, pods were threshed, and any damaged grains and the causes of such losses were recorded. This involved the direct observations of insects and the injuries inflicted upon the grains. In cases where insects were responsible for pod and grain damage, they were methodically categorized into distinct morphospecies, and their identification followed the previously outlined procedures.
Grains exhibiting symptoms of pathogen damage were individually separated into plastic bags and transported to the laboratory for identification. Each grain underwent a rigorous cleansing process, including a 40 s immersion in a 50% ethanolic solution and a 40 s exposure to a 1% sodium hypochlorite solution. This was followed by three thorough rinses with distilled and sterilized water. Subsequently, the grains were arranged within sterile gearbox-type containers (measuring 11 × 11 × 3.5 cm, J. Prolab, São José dos Pinhais, Paraná, Brazil), each containing two layers of Germitest paper (Cienlab, Campinas, São Paulo, Brazil) moistened with sterile distilled water.
These containers were then placed in an incubation chamber (BOD) under a 12 h photoperiod, maintaining a temperature of 25 ± 2 °C for 24 h. Following this incubation, the containers were transferred to a freezer at −20 °C for 24 h to inhibit seed germination. Subsequently, they were returned to the incubation chamber at 25 ± 2 °C, under a 12 h photoperiod, for five days for the growth of fungi [21]. Following established literature guidelines, pathogens were identified by examining their morphological characteristics under magnification [20].
2.5. Estimated Loss of Each Phenological Stage
Within each repetition, the potential yields and losses of the four key components of soybean production—namely, plants, flowers, pods, and grains—were quantified in kilograms of grains per hectare (kg/ha). To achieve this, we employed the crop life table approach, which has previously been applied to analyze other crops, including watermelon [15], corn [17], and cucumber [16]. This method facilitates the estimation of potential yields at each phenological stage. It assesses yield losses caused by each factor (e.g., insects, fungi, abiotic factors, flower abortion, and malformed pods) during each stage.
The initial potential productivity of the soybean crop field was estimated using Equation (1):
where Pp = potential productivity at the beginning of the soybean field (kg/ha); Ns = number of seeds planted per hectare (266,400.000 plants); NFl = the average number of flowers per plant (minimum and maximum values of the replicates (15–254)), Ng = average number of grains formed per pod (1–4); and Gw = average weight (g) of one soybean grain (0.11–0.15).
Pp = Ns × NFl × Ng × Gw,
Likewise, this potential was also assessed during the flowering stage (Equation (2)):
where PFl = potential productivity in the flower production component (kg/ha); Np = number of plants per hectare in the harvest; NFl = the average number of flowers per plant (15–254); Ng = average number of grains formed per pod (1–4); and Gw = average weight (g) of soybean grain (0.11–0.15).
PFl = Np × NFl × Ng × Gw,
Subsequently, the number of plants per hectare during the harvest period was estimated using Equation (3):
where Np = number of plants per hectare in the harvest; Npr = number of plants in the evaluated area of the repetition in the harvest; and Cf = correction factor (222.22) to estimate this value for a hectare of soybean.
Np = Npr × Cf,
Later, we estimated the potential productivity in the pod production component using Equation (4):
where PPd = potential productivity in the pod production component (kg/ha); Np = number of plants per hectare in the harvest; NPt = average number of pods formed per plant (15–250); Ng = average number of grains formed per pod (1–4); and Gw = average weight (g) of soybean grain (0.11–0.15).
PPd = Np × NPt × Ng × Gw,
Grain potential productivity was estimated using Equation (5):
where PGr = potential productivity in the grain production component (kg/ha); Np = number of plants per hectare in the harvest; NPh = average number of pods per plant at harvest (15–250); Ngh = average number of grains per pod (1–4); and Gw = average weight (g) of soybean grain (0.11–0.15).
PGr = Np × NPh × Ngh × Gw,
Losses in the production components of plants, flowers, pods, and grains were estimated using Formulas (6), (7), (8), and (9), respectively:
where Lpi = losses (kg/ha) due to plant mortality by factor i (insects, fungi, and abiotic factors); Dpi = number of dead plants per hectare by factor i; NFl = the average number of flowers per plant (15–254); Ng = average number of grains formed per pod (1–4); and Gw = average weight (g) of soybean grain (0.11–0.15):
where Lfl = losses (kg/ha) due to flower abortion; PFl = potential productivity in the flower production component (kg/ha), which was calculated using Formula (2); and PPd = potential productivity in the pod production component (kg/ha), which was calculated using Formula (4):
where Lpd = pod losses (kg/ha); PPd = potential productivity in the pod production component (kg/ha), which was calculated using Formula (4); and PGr = potential productivity in the grain production component (kg/ha), which was calculated using Formula (5):
where Lgrj = losses (kg/ha) in grains due to factor j (insects and fungi); Np = number of plants per hectare in the harvest; NPh = average number of pods per plant at harvest (15–250); Ngj = number of grains lost per pod due to factor j; and Gw = average weight (g) of soybean grain (0.11–0.15). The total yield loss was calculated by the sum of all losses from individual losses in each production component, according to Equations (6)–(9). Soybean yield was assessed in kilograms of grains per hectare at harvest [15,17].
Lpi = Dpi × NFl × Ng × Gw,
Lfl = PFl − PPd,
Lpd = PPd − PGr,
Lgrj = Np × NPh × Ngj × Gw,
2.6. Data Analysis
We investigate the season’s influence on yield and yield loss at the phenological stages (vegetative and reproductive) and their associated factors in each production component (plants, flowers, pods, and grains). We employed a generalized linear mixed model (GLMM) utilizing a Gamma error distribution with a log link function to accomplish this. This approach accounted for the inherent random variability observed across the different fields (n = 4) and the potential spatial autocorrelation among replicates (n = 20 per field). Accordingly, we incorporated replicates nested within the plot as a random effect (1|field/replicate). The significance of the fixed factor was assessed using the Wald χ2 test (type II). All statistical analyses were conducted using R version 4.3.0 and RStudio version 2023.06.1 + 524, with the packages lme4 and DHARMa, to assess model suitability. Data visualization was carried out using the ggplot2 package, and results were presented as means and standard errors expressed in kg/ha.
3. Results
3.1. Yield and Yield Loss
The soybean yield (average ± standard error) exhibited minimal variation between the dry season (4349.85 ± 280.80 kg/ha) and the rainy season (4206.51 ± 117.31 kg/ha), with no statistically significant difference observed (Wald χ2 = 0.22; df = 1; p = 0.63). Likewise, the yield loss remained consistent across seasons, with no significant variation detected (Wald χ2 = 1.32; df = 1; p = 0.25). Specifically, during the dry season, the estimated loss was 902.86 ± 67.79 kg/ha; in the rainy season, it amounted to 1007.92 ± 59.79 kg/ha.
3.2. Yield Loss during Phenological Stages
The yield loss significantly increased in the vegetative stage during the dry season (Wald χ2 = 89.72; df = 1; p < 0.0001; Figure 3a). However, no statistically significant differences were detected in the first reproductive phenological stages (R1 to R4 (from beginning flowering to full pod)) (Wald χ2 = 3.20; df = 1; p = 0.07; Figure 3b). Conversely, increases in losses were notably higher during the second reproductive phenological stages (R5 to R8 (from beginning seed to full maturity)) in the rainy season (Wald χ2 = 4.58; df = 1; p = 0.03; Figure 3c).
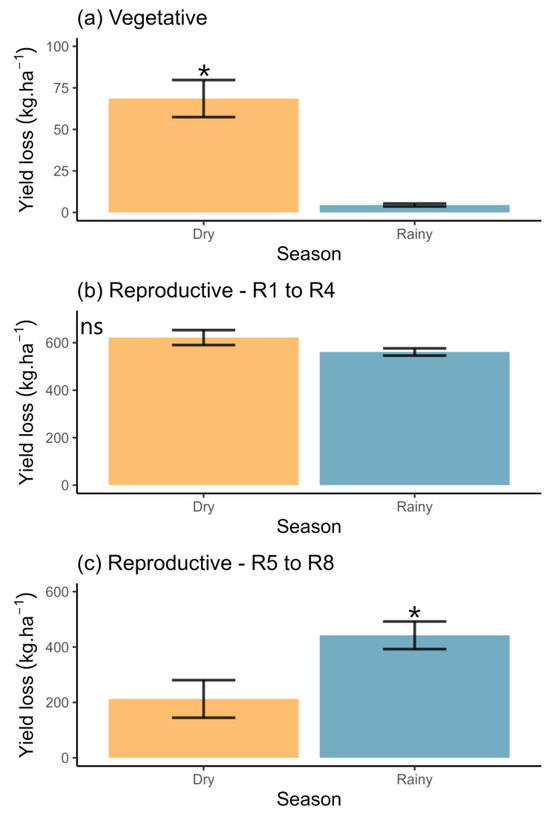
Figure 3.
Yield loss (average ± standard error) in Bt soybean crops estimated during the vegetative (a) and reproductive (b,c) phenological stages, categorized by the cultivation season in Tocantins state, north Brazil. Vegetative stages encompass the stages from emergence to the unfolding of trifoliate leaves. Reproductive R1 to R4 refers to the period from beginning flowering to full pod. Reproductive R5 to R8 refers to the period from beginning seed to full maturity. * denotes significant differences between seasons; ‘ns’ indicates non-significant differences.
3.3. Factors of Loss
Plant mortality primarily resulted from infestations by beetles and caterpillars, as illustrated in Figure 2. The identified pest species included Blapstinus sp. (Coleoptera: Tenebrionidae), Agrotis ipsilon (Hufnagel) (Lepidoptera: Noctuidae), and Elasmopalpus lignosellus Zeller (Lepidoptera: Pyralidae). Notably, plant mortality attributed to both pest groups exhibited a marked increase during the dry season (beetles: Wald χ2 = 20.05, df = 1, p < 0.0001 (Figure 4a); caterpillars: Wald χ2 = 31.76, df = 1, p < 0.0001 (Figure 4b)).
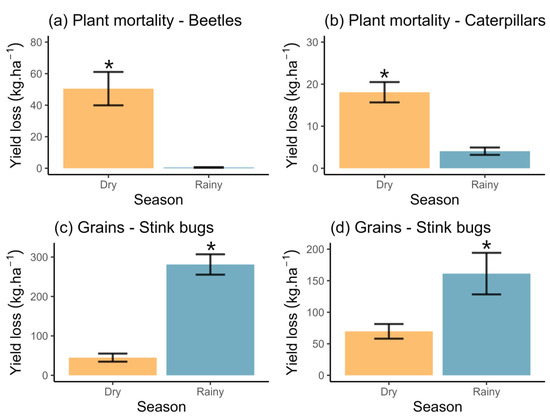
Figure 4.
Yield loss (average ± standard error) in Bt soybean crops estimated at vegetative (a,b) and reproductive (c,d) phenological stages according to the cultivation season in Tocantins state, north Brazil. In (a) and (b), the loss is caused by the attack of beetles and caterpillars, respectively. In (c) and (d), the loss is caused by stink bugs and fungi attacks. * denotes differences between seasons.
Furthermore, our observations revealed the presence of Sclerotium rolfsii Sacc. (Polyporales: Atheliaceae) as the causative agent responsible for southern blight disease, also known as southern stem rot, leading to instances of plant mortality (Figure 2). However, a formal analysis was not conducted due to the limited occurrence of this disease symptom in a few replicates (average ± standard error) during both seasons (dry: 0.10 ± 0.07 kg/ha; rainy: 0.33 ± 0.28 kg/ha).
Aborted flowers and deformed pods dropped to the ground near the plant canopy. While we did not conclusively identify a specific cause for this loss, such as insect damage, we associated it with abiotic factors that induce plant stress.
The loss of grains was primarily attributed to insects and fungi, as delineated in Figure 2. Stink bugs Euschistus heros (Fabr.), Nezara viridula (L.), and Piezodorus guildinii (Westwood) (Hemiptera: Pentatomidae) were the leading groups causing loss in grains. Additionally, we recorded sporadic attacks by caterpillars such as Spodoptera cosmioides (Walker), Spodoptera eridania (Cramer), and Helicoverpa sp. (Lepidoptera: Noctuidae), although statistical modeling (average ± standard error) was not feasible (dry: 2.93 ± 1.68 kg/ha; rainy: 5.46 ± 1.61 kg/ha). Regarding the stink bug group, a model was performed, revealing a substantial loss attributed to these insects, particularly during the rainy season (Wald χ2 = 49.05, df = 1, p < 0.0001; Figure 4c).
The fungi identified as responsible for grain damage included Cercospora kikuchii (T. Matsumoto & Tomoy), Gardner (Capnodiales: Mycosphaerellaceae), and Colletotrichum truncatum (Schwein.) Andrus & WD Moore (Glomerellales: Glomerellaceae). Collectively, these fungi tended to induce more significant losses, particularly during the rainy season (Wald χ2 = 9.84, df = 1, p = 0.001; Figure 4d).
4. Discussion
Our study confirms sustained soybean yield improvement in Brazil’s agricultural frontiers across dry and rainy seasons. While overall yield remains stable, seasonal variations significantly impact yield losses due to pests, diseases, and abiotic stressors. These findings validate the projections of narrowing the soybean yield gap while revealing new challenges in crop management. Addressing seasonal variations in pest, disease, and stressor impacts is crucial to enhance yields further. This underscores the need for adaptable and sustainable crop management strategies to sustain and elevate soybean production.
Since 2015, many factors have contributed to the significant increase in soybean yield in Brazil, as noted in our study. Notably, developing soybean varieties with enhanced characteristics, including heightened yield potential, resistance to pests and diseases, and greater tolerance to environmental stress, has played a pivotal role in driving this improvement [22]. These genetically modified varieties have been contributing to elevating crop yields. Furthermore, advancements in adopting effective agricultural practices for crop management have been instrumental in this upward trend. These practices encompass refined planting techniques, optimized spacing between rows, precise seed distribution, fine-tuning plant populations, and overall enhancements in crop yield strategies [23,24,25]. Additionally, the burgeoning availability of agricultural data and the proliferation of data analysis applications have ushered in a modern era of farming practices. This data-driven approach has proven invaluable in optimizing crop yields and resource allocation, offering farmers more precision and insight into their operations [26,27,28].
The most significant losses in the plant component occurred during the dry season, primarily attributed to pest infestations. The development and reproduction of insects are intricately linked to environmental factors, such as food availability, air temperature, and rainfall [29]. Dry seasons are characterized by elevated temperatures (27.5–32.5 °C) in the studied areas, which can potentially facilitate the proliferation of pests, including lepidopterans such as A. ipsilon and E. lignosellus [30,31]. This can occur by shortening the insect life cycle [29,32]. Seasonal fluctuations can also synchronize with the life cycles of certain insects, leading to increased activity, including reproductivity, during specific times of the year [33].
Flower abortion and pod malformation contributed significantly to soybean yield losses during both growing seasons. This occurrence is often linked to the plants’ physiological disruptions [34]. Potential contributing factors encompass elevated air temperatures, water stress, and nutritional deficiencies [34,35]. Water stress, in particular, has been recognized as a critical trigger for flower abortion and pod malformation [36]. The distinct characteristics of the dry and rainy seasons also play a role in this dynamic. While excess water from irrigation during the dry season can lead to water stress, a lack of essential nutrients can weaken and delay plant development [37]. Consequently, these factors collectively challenge crop yield, impacting both planting seasons.
The most significant losses in grain yield were observed during the rainy season, with stink bugs and fungi being the primary causes behind these losses. The stink bug complex prevalent in the fields is known for injecting saliva containing digestive enzymes and extracting liquefied content from the plants, resulting in physiological and biochemical alterations within the tissues that can ultimately lead to tissue death [38,39]. The puncturing of the stink bugs into the grains further exacerbates the problem, causing shrinkage and weight loss, thus adversely affecting overall yield. Furthermore, it creates entry points for pathogens to infiltrate the grains, impacting grain quality and health [38,40,41] such as Colletotrichum truncatum and Cercospora kikuchii. Typically, under conditions characterized by high precipitation and elevated temperatures (prevalent in the Cerrados region), these fungi species are known to cause substantial losses [42,43].
Grains exhibited high susceptibility during the rainy season, primarily attributable to the climatic conditions prevalent during this period, including increased precipitation, elevated humidity, and higher temperatures, all fostering the proliferation of pests and diseases [44,45]. The rainy season’s abundant water availability creates an optimal environment for the growth and dissemination of disease-causing pathogens [46,47]. Additionally, raindrops can act as carriers, transporting spores and facilitating their dispersion throughout the crop, rendering plants more susceptible to infection [48]. Furthermore, the elevated humidity during the rainy season creates favorable conditions for the reproduction and hatching of pest eggs, leading to an upsurge in pest populations [47,49,50].
Amid these challenges, growers must deploy robust management strategies. These approaches should encompass cultural practices, constant pest monitoring, and implementing integrated pest management to mitigate crop damage. When cultivating soybean crops, pivotal phases emerge during the reproductive and grain development stages. Safeguarding against losses in vital reproductive elements such as flowers and pods and constant monitoring for insect and fungal threats during grain development necessitates the application of sustainable pest management strategies.
5. Conclusions
Our study unveils a consistent trend in Bt soybean crop yields, showcasing stability between the dry season (4349.85 kg/ha) and the rainy season (4206.51 kg/ha). Interestingly, yield losses exhibit minimal variance between these seasons, recording 902.86 kg/ha (dry) and 1007.92 kg/ha (rainy). While the overall yield and losses maintain relative steadiness across seasons, the contributing factors display variations. Dry seasons unveil heightened plant mortality rates, whereas rainy seasons highlight significant impacts from insect infestations—mainly stink bugs—and fungal infections, serving as primary culprits behind grain yield losses. Conversely, losses attributed to flower and pod abortion display consistent patterns throughout both seasons. This suggests the need for nuanced strategies in sustainable crop management. Addressing the distinct challenges each season poses—mitigating plant mortality during dry seasons and implementing measures against insect and fungal threats in rainy seasons—is imperative. Additionally, the persistent issue of flower and pod abortion warrants focused attention, advocating for approaches that track seasonal restrictions to ensure crop health and yield stability across varying environmental conditions.
Author Contributions
Conceptualization, P.S.P., M.C.P. and R.A.S.; methodology, M.C.P., A.A.S. and P.S.P.; conducted the experiments, P.S.P., L.R.N., J.L.d.S. and A.G.G.; investigation, P.S.P., M.C.P., A.A.S., G.R.d.S. and M.M.P.; software, A.A.S., A.G.G. and M.M.P.; formal analysis, A.A.S., P.S.P., M.M.P., G.R.d.S. and M.C.P.; data curation, P.S.P., M.C.P. and A.A.S.; writing—original draft preparation, P.S.P., A.A.S. and M.C.P.; writing—review and editing, J.L.d.S., L.R.N., M.M.P., A.G.G., G.R.d.S. and R.A.S.; visualization, P.S.P., A.A.S., M.C.P., L.R.N., J.L.d.S. and G.R.d.S.; supervision, M.C.P. and R.A.S.; project administration, R.A.S.; funding acquisition, M.C.P. and R.A.S. All authors have read and agreed to the published version of the manuscript.
Funding
This study was financed in part by the Coordenação de Aperfeiçoamento de Pessoal de Nível Superior (CAPES), Brazil (project: PROCAD-AMAZÔNIA: 88887.200564/2018-00) and the Conselho Nacional de Desenvolvimento Científico e Tecnológico (CNPq), Brazil (projects: 458946/2014-1 and 306011/2022-0).
Institutional Review Board Statement
Not applicable.
Informed Consent Statement
Not applicable.
Data Availability Statement
The datasets used and/or analyzed during the current study are available from the corresponding author (P.S.P.) upon request.
Acknowledgments
We are deeply indebted to the agricultural producers who allowed us to conduct this research on their farms. We thank the Universidade Federal do Tocantins and Universidade Federal de Viçosa for their support.
Conflicts of Interest
The authors declare no conflicts of interest.
References
- United States Department of Agriculture (USDA). World Agricultural Production. 2023. Available online: https://wwwusdagov/topics/farming/crop-production (accessed on 25 July 2023).
- Voora, V.; Larrea, C.; Bermudez, S. Global Market Report: Soybeans; International Institute for Sustainable Development (IISD): Winnipeg, MB, Canada, 2020; pp. 3–11. [Google Scholar]
- Oerke, E.C.; Dehne, H.W. Safeguarding production losses in major crops and the role of crop protection. Crop Prot. 2004, 23, 275–285. [Google Scholar] [CrossRef]
- Sharma, S.; Kooner, R.; Arora, R. Insect pests and crop losses. In Breeding Insect Resistant Crops for Sustainable Agriculture; Arora, R., Surinder, S., Eds.; Springer: Singapore, 2017; pp. 45–66. [Google Scholar]
- Santos, J.F.S.; Naval, L.P. Spatial and temporal dynamics of water footprint for soybean production in areas of recent agricultural expansion of the Brazilian savannah (Cerrado). J. Clean Prod. 2020, 251, 119482. [Google Scholar] [CrossRef]
- Shimizu, M.H.; Anochi, J.A.; Kayano, M.T. Precipitation patterns over northern Brazil basins: Climatology trends and associated mechanisms. Theor. Appl. Climatol. 2022, 147, 767–783. [Google Scholar] [CrossRef]
- Bueno, A.F.; Panizzi, A.R.; Hunt, T.E.; Dourado, P.M.; Pitta, R.M.; Gonçalves, J. Challenges for adoption of integrated pest management (IPM): The soybean example. Neotrop. Entomol. 2021, 50, 5–20. [Google Scholar] [CrossRef]
- Fattori, I.M.; Sentelhas, P.C.; Marin, F.R. Assessing the impact of climate variability on Asian rust severity and soybean yields in different Brazilian mega-regions. Int. J. Plant Prod. 2022, 16, 17–28. [Google Scholar] [CrossRef]
- Hartman, G.L.; Rupe, J.C.; Sikora, E.J.; Domier, L.L.; Davis, J.A.; Steffey, K.L. Infectious diseases. In Compendium of Soybean Diseases and Pests, 5th ed.; Hartman, G.L., Rupe, J.C., Sikora, E.J., Domier, L.L., Davis, J.A., Steffey, K.L., Eds.; American Phytopathological Society: Saint Paul, MN, USA, 2015; pp. 17–135. [Google Scholar]
- Horikoshi, R.J.; Dourado, P.M.; Berger, G.U.; Fernandes, D.S.; Omoto, C.; Willse, A.; Martinelli, A.; Head, G.A.; Corrêa, A.S. Large-scale assessment of lepidopteran soybean pests and efficacy of Cry1Ac soybean in Brazil. Sci. Rep. 2021, 11, 15956. [Google Scholar] [CrossRef] [PubMed]
- Oliveira, C.M.; Auad, A.M.; Mendes, S.M.; Frizzas, M.R. Crop losses and the economic impact of insect pests on Brazilian agriculture. Crop Prot. 2014, 56, 50–54. [Google Scholar] [CrossRef]
- Zucchi, M.I.; Cordeiro, E.M.; Wu, X.; Lamana, L.M.; Brown, P.J.; Manjunatha, S.; Viana, J.P.G.; Omoto, C.; Pinheiro, J.B.; Clough, S.J. Population genomics of the Neotropical brown stink bug Euschistus heros: The most important emerging insect pest to soybean in Brazil. Front. Genet. 2019, 10, 1035. [Google Scholar] [CrossRef] [PubMed]
- Sentelhas, P.C.; Battisti, R.; Câmara, G.M.S.; Farias, J.R.B.; Hampf, A.C.; Nendel, C. The soybean yield gap in Brazil–magnitude causes and possible solutions for sustainable production. J. Agric. Sci. 2015, 153, 1394–1411. [Google Scholar] [CrossRef]
- Battisti, R.; Sentelhas, P.C. Improvement of soybean resilience to drought through deep root system in Brazil. Agron. J. 2017, 109, 1612–1622. [Google Scholar] [CrossRef]
- Pereira, A.S.; Santos, G.R.; Sarmento, R.A.; Galdino, T.V.S.; Lima, C.H.O.; Picanço, M.C. Key factors affecting watermelon yield loss in different growing seasons. Sci. Hortic. 2017, 218, 205–212. [Google Scholar] [CrossRef]
- Bacci, L.; Picanço, M.C.; Gonring, A.H.R.; Guedes, R.N.C.; Crespo, A.L.B. Critical yield components and key loss factors of tropical cucumber crops. Crop Prot. 2006, 25, 1117–1125. [Google Scholar] [CrossRef]
- Silva, G.A.; Picanço, M.C.; Ferreira, L.R.; Ferreira, D.O.; Farias, E.S.; Souza, T.C.; Silva, N.R.; Pereira, E.J.G. Yield losses in transgenic Cry1Ab and non-Bt corn as assessed using a crop-life-table approach. J. Econ. Entomol. 2018, 111, 218–226. [Google Scholar] [CrossRef] [PubMed]
- Sediyama, T.; Silva, F.; Borém, A. Soja: Do Plantio à Colheita; UFV: Viçosa, Brazil, 2015; pp. 53–133. [Google Scholar]
- Gallo, D.; Nakano, O.; Silveira Neto, S.; Carvalho, R.P.L.; Baptista, G.C.; Berti Filho, E.; Parra, J.R.P.; Zucchi, R.A.; Alves, S.B.; Vendramim, J.D.; et al. Entomologia Agrícola; FEALQ: Piracicaba, Brazil, 2002; pp. 494–507. [Google Scholar]
- Watanabe, T. Pictorial Atlas of Soil and Seed Fungi: Morphologies of Cultured Fungi and Key to Species; CRC Press: Boca Raton, CA, USA, 2010; pp. 12–426. [Google Scholar]
- Sousa, R.R.D.; Osório, P.R.A.; Nosé, N.P.; Arruda, G.L.D.; Ferreira, T.P.D.S.; Haesbaert, F.M.; Santos, G.R. Detection and transmission of Fusarium verticillioides in corn seeds according to the plant stage. Acta Sci. Agron. 2022, 44, e53213. [Google Scholar] [CrossRef]
- Kumar, K.; Gambhir, G.; Dass, A.; Tripathi, A.K.; Singh, A.; Jha, A.K.; Rakshit, S. Genetically modified crops: Current status and future prospects. Planta 2020, 251, 91. [Google Scholar] [CrossRef] [PubMed]
- Singh, G.; Ram, H.; Aggarwal, N. Agro-techniques for soybean production. In The Soybean: Botany Production and Uses; Singh, G., Ed.; CABI: Wallingford, UK, 2010; pp. 142–160. [Google Scholar]
- Pagano, M.C.; Miransari, M. The importance of soybean production worldwide. In Abiotic and Biotic Stresses in Soybean Production; Miransari, M., Ed.; Academic Press: Cambridge, UK, 2016; pp. 1–26. [Google Scholar]
- Faé, G.S.; Kemanian, A.R.; Roth, G.W.; White, C.; Watson, J.E. Soybean yield in relation to environmental and soil properties. Eur. J. Agron. 2020, 118, 126070. [Google Scholar] [CrossRef]
- Schimmelpfennig, D.; Ebel, R. On the doorstep of the information age: Recent adoption of precision agriculture. Econ. Res. Serv. 2011, 80, 1–22. [Google Scholar]
- Balafoutis, A.; Beck, B.; Fountas, S.; Vangeyte, J.; Wal, T.V.d.; Soto, I.; Gómez-Barbero, M.; Barnes, A.; Eory, V. Precision Agriculture Technologies Positively Contributing to GHG Emissions Mitigation, Farm Productivity and Economics. Sustainability 2017, 9, 1339. [Google Scholar] [CrossRef]
- Colussi, J.; Morgan, E.L.; Schnitkey, G.D.; Padula, A.D. How Communication Affects the Adoption of Digital Technologies in Soybean Production: A Survey in Brazil. Agriculture 2022, 12, 611. [Google Scholar] [CrossRef]
- Colinet, H.; Sinclair, B.J.; Vernon, P.; Renault, D. Insects in fluctuating thermal environments. Annu. Rev. Entomol. 2015, 60, 123–140. [Google Scholar] [CrossRef]
- Sandhu, H.S.; Nuessly, G.S.; Webb, S.E.; Cherry, R.H.; Gilbert, R.A. Temperature-dependent development of Elasmopalpus lignosellus (Lepidoptera: Pyralidae) on sugarcane under laboratory conditions. Environ. Entomol. 2010, 39, 1012–1020. [Google Scholar] [CrossRef] [PubMed]
- Lee, Y.S.; Lee, H.A.; Kim, G.H.; Kim, S.B.; Kim, D.S. Temperature-dependent development of Agrotis ipsilon (Lepidoptera: Noctuidae) and its stage transition models. Phytoparasitica 2023, 51, 199–214. [Google Scholar] [CrossRef]
- Ferguson, L.V.; Sinclair, B.J. Thermal variability and plasticity drive the outcome of a host-pathogen interaction. Am. Nat. 2020, 195, 603–615. [Google Scholar] [CrossRef]
- Williams, C.M.; Ragland, G.J.; Betini, G.; Buckley, L.B.; Cheviron, Z.A.; Donohue, K.; Hereford, J.; Humphries, M.M.; Lisovski, S.; Marshall, K.E.; et al. Understanding evolutionary impacts of seasonality: An introduction to the symposium. Integr. Comp. Biol. 2015, 57, 921–933. [Google Scholar] [CrossRef] [PubMed]
- Pereira-Flores, M.E.; Justino, F.B. Yield components and biomass partition in soybean: Climate change vision. In Soybean: Biomass Yield and Productivity; Kasai, M., Ed.; IntechOpen: London, UK, 2019; pp. 516–532. [Google Scholar]
- Jumrani, K.; Bhatia, V.S. Impact of combined stress of high temperature and water deficit on growth and seed yield of soybean. Physiol. Mol. Biol. Plants. 2018, 24, 37–50. [Google Scholar] [CrossRef]
- Pereira, P.S.X.; Daros, R.F.; Silva, A.L.; Campos, A.G.; Bianchini, A.; Júnior, J.H.C.; Santos, M.A.; Pereira, T.A.X.; Pallaoro, D.S. Effect of water stress on the development of soybean crop. J. Exp. Agric. Int. 2019, 39, 1–8. [Google Scholar] [CrossRef]
- Gonzalo, M.J.; Lucena, J.J.; Hernández-Apaolaza, L. Effect of silicon addition on soybean (Glycine max) and cucumber (Cucumis sativus) plants grown under iron deficiency. Plant. Physiol. Biochem. 2013, 70, 455–461. [Google Scholar] [CrossRef]
- Depieri, R.A.; Panizzi, A.R. Duration of feeding and superficial and in-depth damage to soybean seed by selected species of stink bugs (Heteroptera: Pentatomidae). Neotrop. Entomol. 2011, 40, 197–203. [Google Scholar] [CrossRef]
- Silva, F.A.; Silva, J.J.; Depieri, R.A.; Panizzi, A.R. Feeding activity salivary amylase activity and superficial damage to soybean seed by adult Edessa meditabunda (F) and Euschistus heros (F) (Hemiptera: Pentatomidae). Neotrop. Entomol. 2012, 41, 386–390. [Google Scholar] [CrossRef]
- Timbo, R.V.; Hermes-Lima, M.; Silva, L.P.; Mehta, A.; Moraes, M.C.B.; Paula, D.P. Biochemical aspects of the soybean response to herbivory injury by the brown stink bug Euschistus heros (Hemiptera: Pentatomidae). PLoS ONE. 2014, 9, e109735. [Google Scholar] [CrossRef][Green Version]
- Tuelher, E.S.; da Silva, É.H.; Rodrigues, H.S.; Hirose, E.; Guedes, R.N.C.; Oliveira, E.E. Area-wide spatial survey of the likelihood of insecticide control failure in the neotropical brown stink bug Euschistus heros. J. Pest. Sci. 2018, 91, 849–859. [Google Scholar] [CrossRef]
- Wrather, A.; Shannon, G.; Balardin, R.; Carregal, L.; Escobar, R.; Gupta, G.K.; Ma, Z.; Morel, W.; Ploper, D.; Tenuta, A. Effect of diseases on soybean yield in the top eight producing countries in 2006. Plant Health Prog. 2010, 11, 29–36. [Google Scholar] [CrossRef]
- Dias, M.D.; Pinheiro, V.F.; Café-Filho, A.C. Impact of anthracnose on the yield of soybean subjected to chemical control in the north region of Brazil. Summa Phytopathol. 2016, 42, 18–23. [Google Scholar] [CrossRef]
- Urban, D.W.; Roberts, M.J.; Schlenker, W.; Lobell, D.B. The effects of extremely wet planting conditions on maize and soybean yields. Clim. Chang. 2015, 130, 247–260. [Google Scholar] [CrossRef]
- Skendžić, S.; Zovko, M.; Živković, I.P.; Lešić, V.; Lemić, D. The impact of climate change on agricultural insect pests. Insects 2021, 12, 440. [Google Scholar] [CrossRef]
- Chakraborty, S.; Newton, A.C. Climate change plant diseases and food security: An overview. Plant Pathol. 2011, 60, 2–14. [Google Scholar] [CrossRef]
- Newton, A.C.; Johnson, S.N.; Gregory, P.J. Implications of climate change for diseases crop yields and food security. Euphytica 2011, 179, 3–18. [Google Scholar] [CrossRef]
- Kim, S.; Park, H.; Gruszewski, H.A.; Schmale III, D.G.; Jung, S. Vortex-induced dispersal of a plant pathogen by raindrop impact. Proc. Nat. Acad. Sci. USA 2019, 116, 4917–4922. [Google Scholar] [CrossRef] [PubMed]
- Panizzi, A.R.; Lucini, T.; Aldrich, J.R. Dynamics in pest status of phytophagous stink bugs in the Neotropics. Neotrop. Entomol. 2022, 51, 18–31. [Google Scholar] [CrossRef] [PubMed]
- Chen, J.; Jiang, K.; Wang, S.; Li, Y.; Zhang, Y.; Tang, Z.; Bu, W. Climate change impacts on the potential worldwide distribution of the soybean pest Piezodorus guildinii (Hemiptera: Pentatomidae). J. Econ. Entomol. 2023, 116, 761–770. [Google Scholar] [CrossRef] [PubMed]
Disclaimer/Publisher’s Note: The statements, opinions and data contained in all publications are solely those of the individual author(s) and contributor(s) and not of MDPI and/or the editor(s). MDPI and/or the editor(s) disclaim responsibility for any injury to people or property resulting from any ideas, methods, instructions or products referred to in the content. |
© 2024 by the authors. Licensee MDPI, Basel, Switzerland. This article is an open access article distributed under the terms and conditions of the Creative Commons Attribution (CC BY) license (https://creativecommons.org/licenses/by/4.0/).