Article

Predicting Changes in and Future Distributions of Plant Habitats of Climate-Sensitive Biological Indicator Species in South Korea

Department of Forestry and Landscape Architecture, Konkuk University, Seoul 05029, Republic of Korea
*
Author to whom correspondence should be addressed.
Sustainability 2024, 16(3), 1013; https://doi.org/10.3390/su16031013
Submission received: 5 December 2023 / Revised: 17 January 2024 / Accepted: 23 January 2024 / Published: 24 January 2024
(This article belongs to the Section Air, Climate Change and Sustainability)

Abstract

:
Climate change has been progressing rapidly in recent years; consequently, current plant habitats are expected to change. Therefore, to monitor plant movement caused by changed habitat environments, certain plants are designated as bioindicators and managed accordingly. Monitoring changes in plant habitats is important for protecting vulnerable plant species and establishing suitable measures for vegetation environments with suitable plant species under future climates. As part of this task, South Korea manages climate-sensitive plant species for each biological classification group, including plants. Accordingly, in this study, possible current habitats were identified and future habitats were predicted for nine climate-sensitive species in South Korea under climate change scenarios (representative concentration pathways RCP 4.5 and RCP 8.5) using a species distribution model (SDM) and based on national data acquired through field surveys. The MaxEnt algorithm, with high accuracy, was used for the SDM analysis. The MaxEnt algorithm is a powerful tool that analyzes the effects of environmental variables based on occurrence data and indicates possible habitats. To obtain precise results, environmental variables were utilized by collecting comprehensive climatic and topographic data for South Korea. Based on a current habitat analysis, the model accuracy of nine species yielded a high value of more than 0.9, on average, which indicates the extremely high performance of the model. Under climate change scenarios, evergreen coniferous and deciduous broadleaf plant habitats were predicted to expand inland and to the north of South Korea. The results of this study provide valuable data for establishing future conservation and management strategies for climate-sensitive plant species in South Korea. In addition, the detailed environment variable construction method and SDM analysis method used in this study could be applied to the analysis of changes in comprehensive plant habitats caused by climate change in other countries.

1. Introduction

Climate change causes alterations in ecosystem composition, such as the loss of existing plant species and replacement with new plant species [1,2,3]. Endemic species that grow naturally in geographically restricted areas and have a narrower niche are highly vulnerable to climate change [4]. Consequently, climate change can result in a decline in their habitable environments [5]. The loss of a habitable environment directly affects plants, whose distribution moves along favorable environments [4,6]. Therefore, specific plants or lists are used as indicators to derive and monitor plant habitat shifts and biodiversity due to climate change. Vitasse et al., who explored ecological changes in the European Alps, investigated an upward movement of plant habitats due to climate change through monitored data from woody and herbaceous plants [7]. New policies are required for established conservation areas to preserve biodiversity in the context of climate change [8]. In terms of ecosystem conservation and restoration, measures such as plant habitat monitoring and management should be implemented to address the accelerating rate of climate change [9,10].
Therefore, research with the aim of identifying the current habitat distributions of plant species and predicting future distribution tendencies by applying species distribution models (SDMs), various environmental variables, and machine learning algorithms is being actively conducted. SDMs determine possible distributions and habitat suitability based on plant occurrence information and environmental variables [11,12]. With the increasing availability of various types of environmental big data, SDM studies using different machine learning technologies have been attempted [13,14,15,16,17]. For example, Pouteau et al. confirmed the potential habitats of native and endemic plants using support vector machines (SVMs) and suggested the necessity of conservation strategies [14]. Sittaro et al. identified potential habitats and factors influencing invasive plant species in Germany using an SVM and boosted regression trees [16]. With the development of machine learning technology, comparative studies analyzing different machine learning algorithms have been conducted to derive high accuracy with several environmental variables. Mosebo et al. predicted future habitats for wildlife species in the United States under the backdrop of climate change by comparing four machine learning algorithms, namely, random forest, SVMs, an artificial neural network, and maximum entropy (MaxEnt) [17]. Edalat et al. derived the importance of 13 environmental variables that affect the distribution of medical plants and compared the results using five machine learning algorithms (a generalized linear model, a generalized boosting model, boosted regression trees, functional discrimination analysis, and mixture discriminant analysis) [13]. Furthermore, Sharifipour et al. derived distribution maps of three rangeland plant species using five algorithms (SVM, an artificial neural network, naïve Bayes, Bayes net, and classification and regression tree) and compared their performance [15].
In particular, the MaxEnt algorithm exhibits high performance in SDM analysis and has been used in many studies [18,19,20,21,22,23]. It identifies influencing environmental variables based on occurrence data and derives a potential distribution. Furthermore, future distributions can be projected under different climate change scenarios. Many studies have simulated potential distribution areas, such as those of major plant species in forest ecosystems, medicinal plants, and endangered plants, under future climate scenarios.
The accuracy of the MaxEnt model is based on the quality of the occurrence data and environmental variables [24,25]. Numerous MaxEnt studies frequently use global bioclimate data, such as WorldClim data, as environmental variables. WorldClim data are readily available as gridded climate data for the past and future. However, global datasets have limitations, such as low accuracy and a poor representation of regional climate [26,27].
Therefore, to address these limitations of the existing datasets, we aimed to conduct an SDM analysis by constructing detailed environmental variable data to identify possible current habitats and predict future habitats of climate-sensitive biological indicator species (CBIS) in South Korea. The environmental variables used were high-resolution topographic and climatic variables that detail regional information in South Korea. SDM analysis targeted plant species that are sensitive to climate change in South Korea. In this study, nine species of shrubs and trees (one evergreen coniferous plant, five evergreen broadleaf plants, and three deciduous broadleaf plants) were selected from the CBIS list. In order to explore the possibility of habitat expansion under future climate scenarios, this study analyzes plant species living in the southern part of South Korea. Deriving SDMs for future climates is useful for understanding future habitat changes [20]. Moreover, SDM analysis allows the tracking of changes in possible plant distributions due to climate change and can facilitate suitable management strategies for South Korea.

2. Materials and Methods

2.1. Study Setting

This study was conducted in South Korea, which is located in the middle of the Northern Hemisphere and is adjacent to the eastern coast of the Eurasian continent and the western Pacific Ocean (Figure 1). It lies in the temperate zone, with both continental and marine climatic characteristics. Its topographic characteristics include mountainous areas, accounting for 65% of the country’s total area; additionally, diverse plant species are present along with a high proportion of locally specific species. The Korean Peninsula is divided into three regions (northern, central, and southern) according to climate classification using the warmth index, and, accordingly, its vegetation distribution is greatly affected [26].
As global warming continues because of greenhouse gas emissions, habitat changes in temperate zones, such as South Korea, will occur rapidly [28,29,30,31,32,33]. Therefore, South Korea’s Ministry of Environment is continuously investigating species that are expected to show distinct changes in seasonal activity, distribution zones, and population size in response to climate changes. The species selected as part of this study are referred to as CBIS, constituting indicators used to prepare efficient monitoring and prediction methods for climate change. A total of 18 vertebrate, 28 invertebrate, 44 plant, and 10 fungal and seaweed species are included in the CBIS database. In this study, shrubs and trees, excluding herbs, were targeted. Among them, to examine distinct changes, plants native to the southern region were selected, and the final nine plant species were derived (Table 1).

2.2. Data Collection and Analysis

2.2.1. Species Data

Data acquired through field surveys were used to identify habitat changes of CBIS. The National Ecosystem Survey in Korea, conducted by the Korea Institute of Ecology, began in 1986 with four surveys of ecosystems conducted nationwide. The survey collected information on the distributions of animal and plant phases, topography, and vegetation. The collected data included spatial information about the investigated region obtained using point data. Currently, the fifth survey is ongoing, and it is expected to be completed in 2023; hence, the fourth survey conducted from 2014 to 2018 presented the most recent nationwide data, which were used in this study. This survey was conducted by dividing the country into sections over a 5-year period. The quantities of CBIS datasets obtained from the National Ecosystem Survey are presented in Table 2.

2.2.2. Environmental Data

High-resolution (90 m) climatic and topographic variables acquired in South Korea were used to derive results with higher accuracy (Table 3).
For climatic data, the annual average temperature, maximum temperature, minimum temperature, and average precipitation data provided by the Korea Meteorological Administration were used. Climatic variables were collected from 102 observation sites that monitored weather and climate using the automated synoptic observing system, and all the data from 75 sites collected during the fourth survey period were used. Because the National Ecosystem Survey was divided into sections for the 2014–2018 period, climatic data were also averaged, and Inverse Distance Weighted interpolation was conducted for each variable across the country.
The topographic data were constructed based on a digital elevation model (DEM), with a resolution of 90 m, provided by the National Geographic Information Institute. The elevation, topographic wetness index, aspect, and slope were extracted using a DEM map [34]. Additionally, valid soil depth data provided by the National Institute of Agricultural Sciences were used. Among the environmental variables, all data, except for the valid soil depth data, had continuous values. All environmental variable data were required to have the same grid size, boundaries, and coordinate system for MaxEnt analysis, and the data were unified using the geographical information system program (Qgis ver 3.28).

2.2.3. MaxEnt Analysis

The MaxEnt algorithm was used to determine suitable habitats for CBIS and analyze habitat changes under future climate conditions. Climate change scenario data for South Korea were used as the future climate data. The Korea Meteorological Administration provides representative concentration pathway (RCP) scenarios for 2100, with 1 km of high-resolution data produced using statistical spatial information (http://www.climate.go.kr accessed on 9 January 2023). RCPs are classified into four categories according to greenhouse gas emissions, and among those, RCP 4.5 and RCP 8.5 were used in this study. RCP 4.5 refers to a case wherein reduction measures for greenhouse gas emissions have been implemented, and RCP 8.5 refers to a case wherein greenhouse gas emissions are generated according to the current trend. For the analysis, the data for 2050 (average of the 2041–2060 period) and 2070 (average of the 2061–2080 period) for each RCP were used.
The MaxEnt execution setting was the default format of “cloglog”, and it was replicated 5 times with crossvalidate. Other parameters followed the default setting, and the jackknife test was used to indicate the importance of environmental variables in determining the habitat distribution of each species. The results of the MaxEnt model are depicted by projecting possible habitats onto a map through an analysis accounting for the plant occurrence data and environmental variables [24]. In this study, model performance was classified into four categories to determine habitat suitability (Table 4) [35].

3. Results

3.1. Model Evaluation and Current Possible Habitats

The evaluation of the MaxEnt model can be verified using the area under the curve (AUC) of the receiver operating characteristic (ROC) curve. Generally, values in the range of 0.5–0.7 and 0.7–0.9 and values above 0.9 indicate poor, moderate, and high performance, respectively [24,36]. The AUC value (0.923) of the CBIS model implied high average performance (Table 5).
Most of the relative importance of the environmental variables from the jackknife test tended to be influenced by climatic variables. However, for C. harringtonia, an evergreen coniferous tree, topographic variables (DEM, slope, and valid soil depth) were the most important; among these, slope and DEM were found to lower the gain value of the model when excluded.
A distribution map of the nine CBIS in the current climate conditions is shown in Figure 2. Because the CBIS selected in this study tended to inhabit the southern region, the potential distribution in the current climate was mostly in the southern region and on Jeju Island, the latter of which is located at the southern tip of South Korea.

3.2. Habitat Changes under Future Climate Scenarios

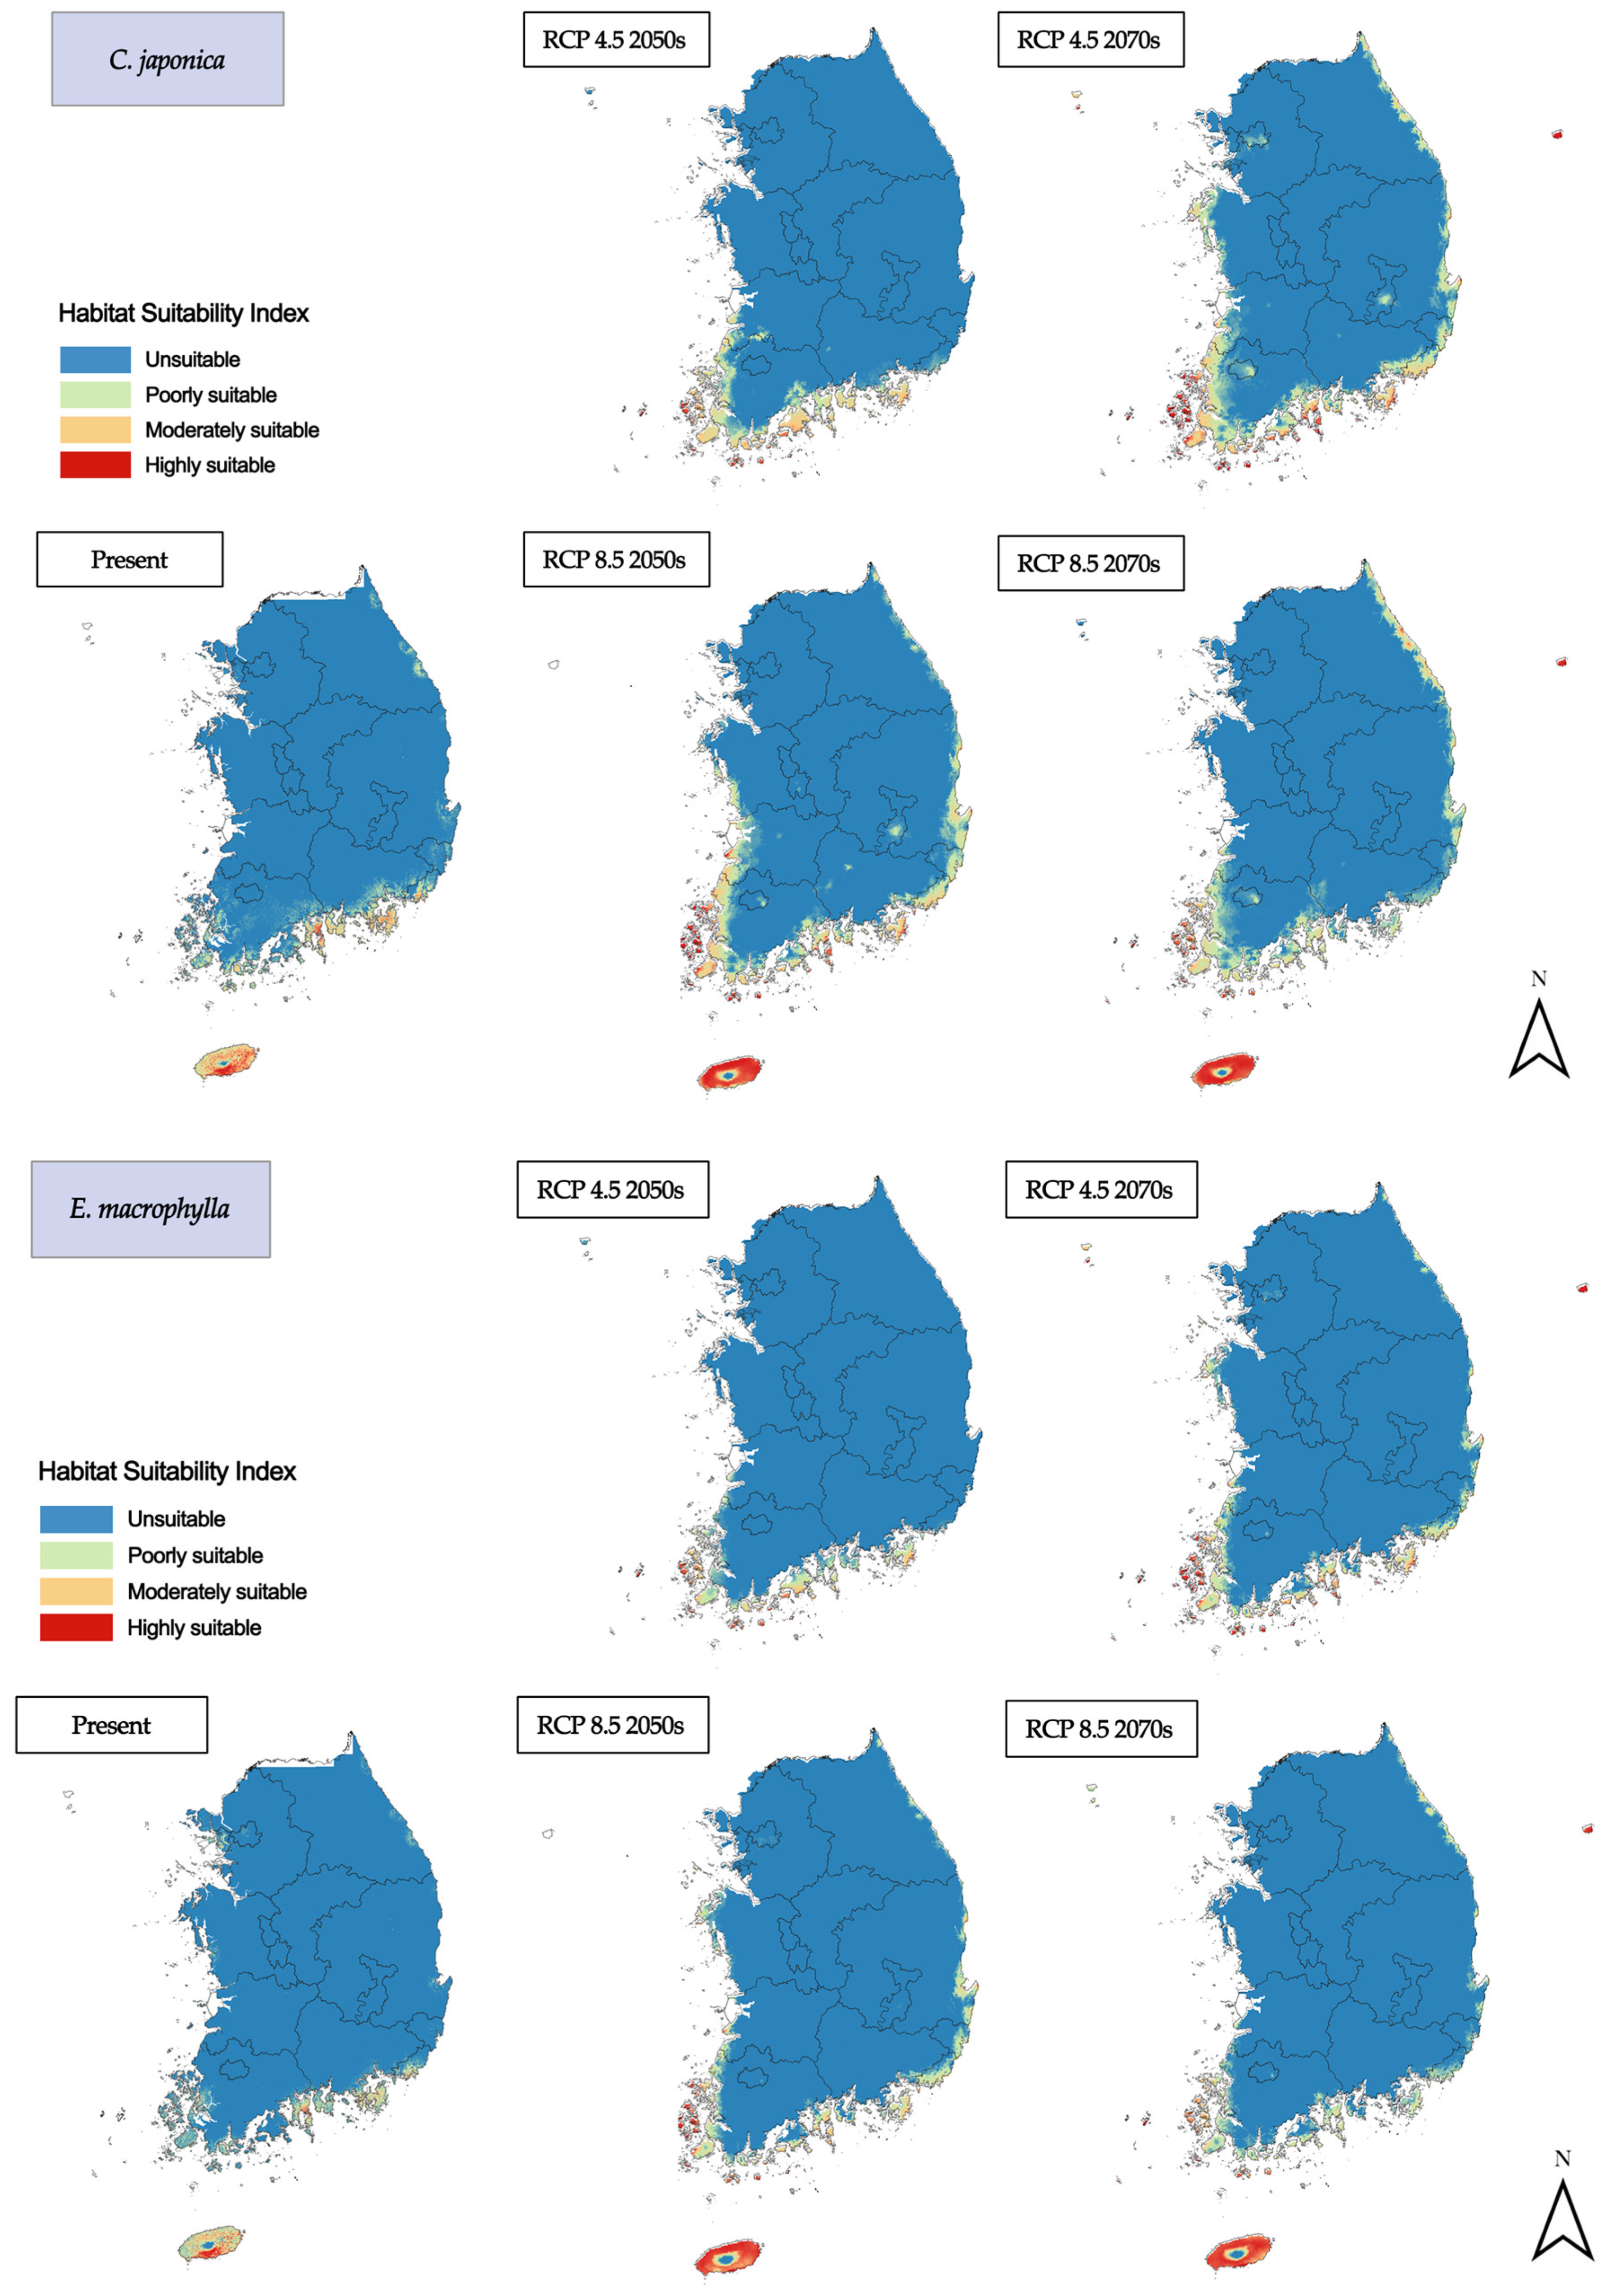
3.2.1. Evergreen Coniferous/Broadleaf Trees

For C. harringtonia, the only coniferous tree in CBIS, DEM, slope, and valid soil depth were the most critical variables. Under future climate change scenarios, the habitats of C. harringtonia in South Korea tended to change according to topographical characteristics, such as mountain ranges (Figure 3). In the case of RCP 8.5 2070s, habitat suitability greatly increased in Taebaek, which is the largest mountain range in the Korean Peninsula. Additionally, habitat suitability in the 2070s was observed to increase across South Korea owing to the presence of more suitable habitat areas at lower altitudes for both RCPs 4.5 and 8.5.
The five evergreen broadleaf tree species had sufficient occurrence data, corresponding to quantities of more than 100 for each species within the fourth ecological survey; consequently, the AUC values were all 0.940 or higher. The results of the climate change scenarios showed similar patterns (Figure 4). The critical variables affecting habitats were minimum temperature, annual average temperature, and average precipitation for all five species. All evergreen broadleaf species showed evident habitat suitability on Jeju Island, and the entire area, except for Halla Mountain, with the highest altitude on Jeju Island, represented a highly suitable habitat. The southwest coast tended to be less suitable for habitats in RCP 8.5 2070s, at which point climate change was significant, whereas all species showed a common pattern of increasing habitat suitability on the central east coast. The habitat of E. japonica showed the most prominent changes among the habitats of evergreen broadleaf species, and in RCP 4.5 2070s and RCP 8.5 2050s, it also showed moderate suitability in some inland areas. However, even if climate change progressed significantly, the habitat for the evergreen broadleaf species only moved northward along the coastal area, which did not appear to be highly suitable in South Korea.

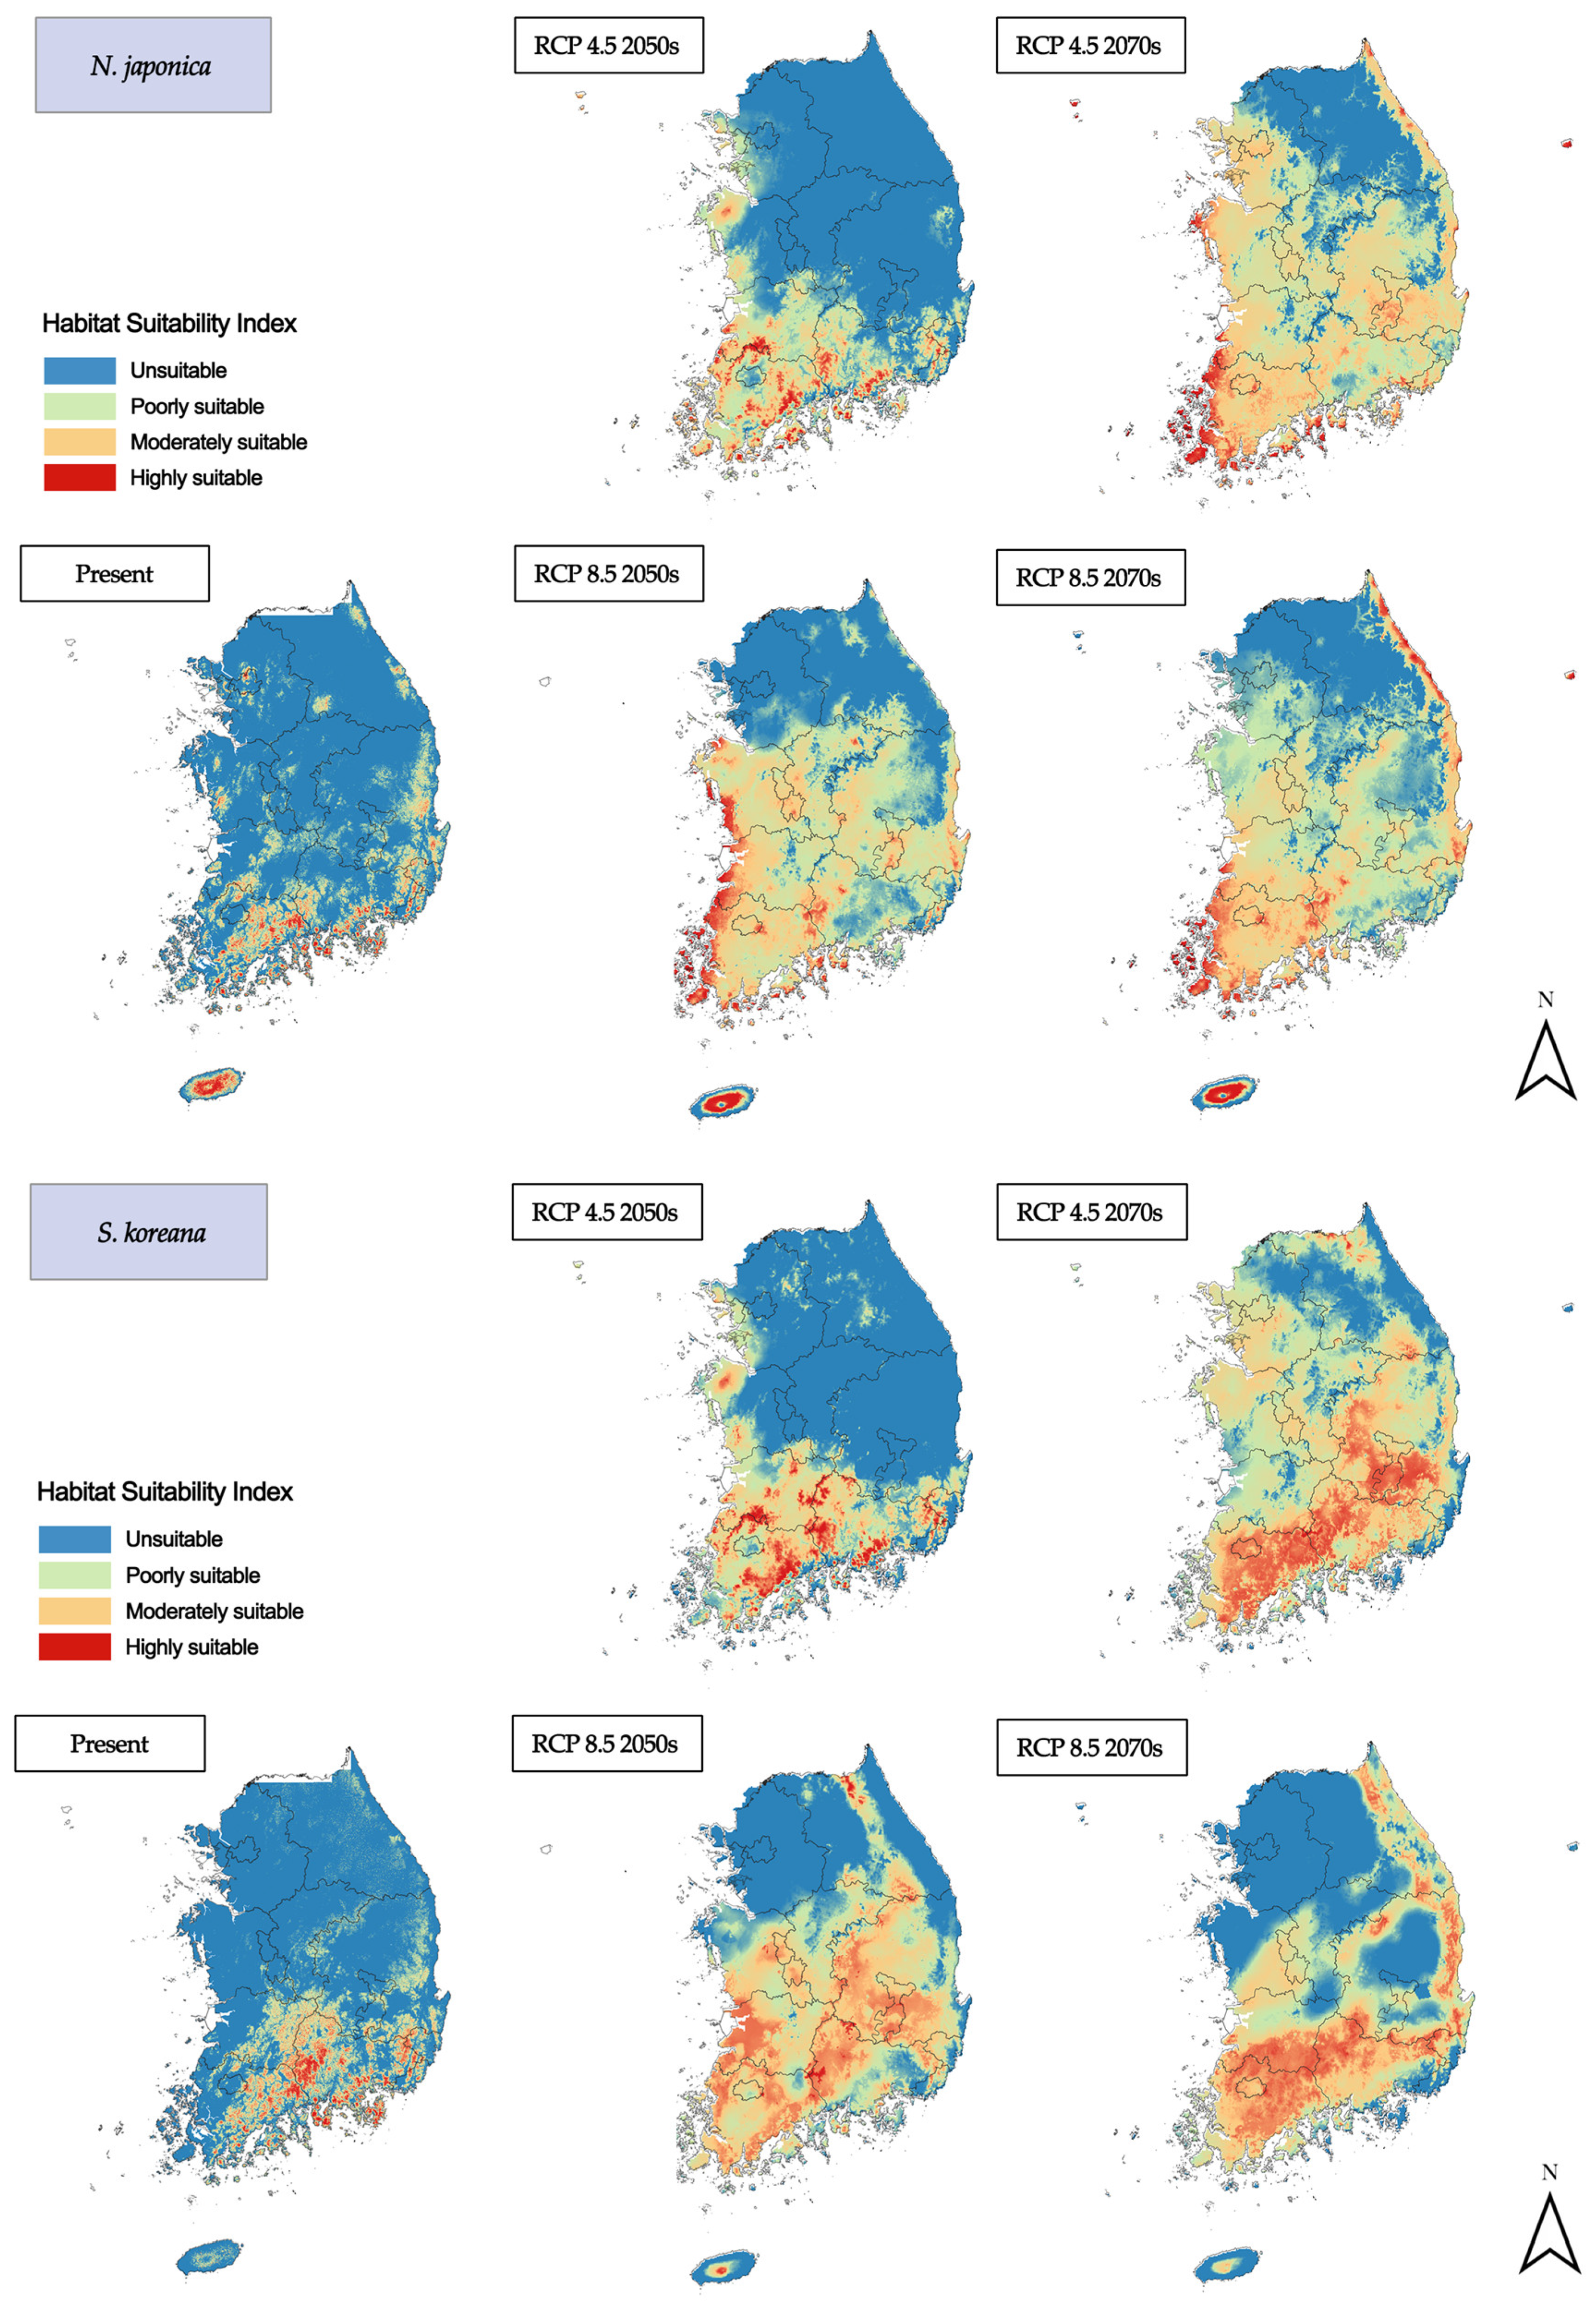
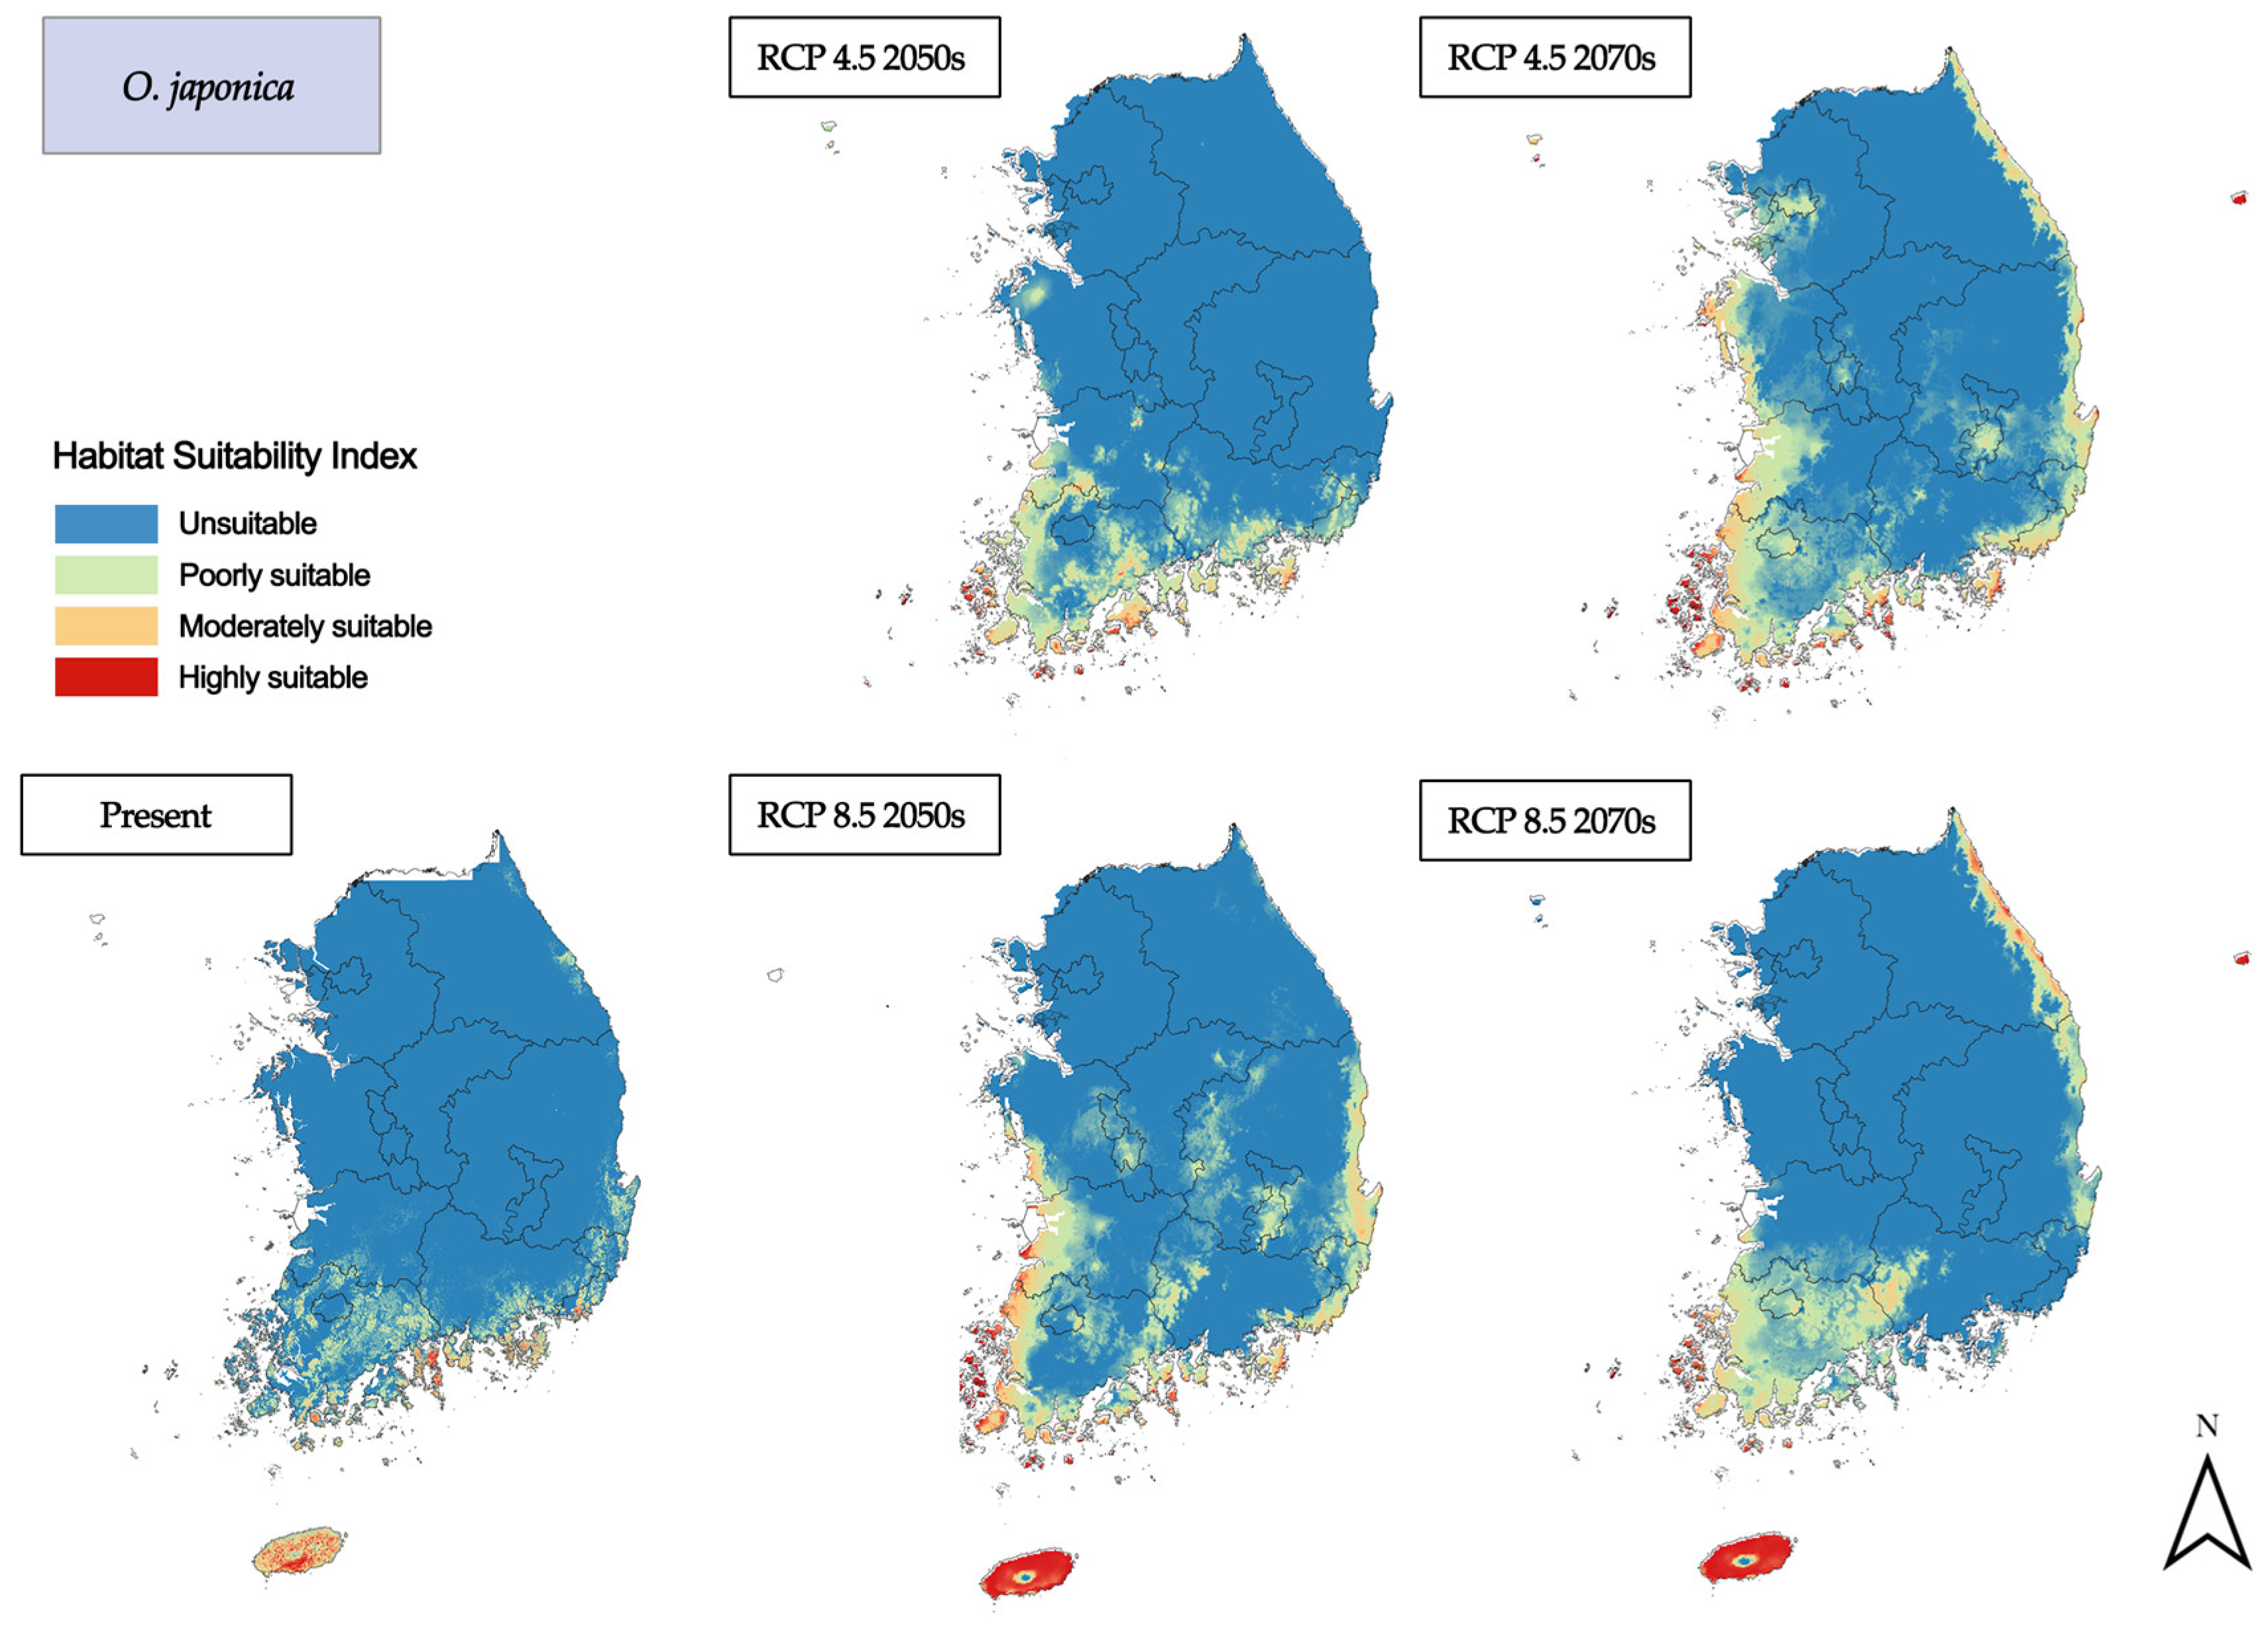
3.2.2. Deciduous Broadleaf Trees

According to the jackknife test results, deciduous broadleaf species tended to be largely affected by climatic variables. For both N. japonica and S. koreana, average precipitation was the most critical variable, and under future climate change scenarios, suitable habitat areas in inland South Korea increased in a similar pattern (Figure 5). For O. japonica, the minimum temperature was a critical variable, and habitat suitability tended to increase along the coast rather than in inland areas.
N. japonica showed high habitat suitability in the high-altitude areas, confirming that the jackknife results showed a low gain value in the model when the DEM variable was excluded. Under future climatic conditions, N. japonica is expected to be present in the middle of a mountainous range adjacent to the coast, showing higher habitat suitability on Jeju Island and on the southwest coast than the other species. Additionally, as climate change progresses, habitat suitability is expected to increase on the west coast, and in the 2070s, habitat suitability will increase on the east coast.
S. koreana is more likely to inhabit the middle of a mountainous range and exhibits high habitat suitability in the southern mountain range under the current climate scenario. Among the environmental variables, slope was a key factor influencing habitat, and in future climate scenarios, it was revealed that S. koreana will exhibit high habitat suitability along mountainous areas. As climate change progresses, habitat suitability will increase in the high-altitude Taebaek Mountains.
O. japonica shows a lower distribution in inland areas under the current climate conditions than other deciduous broadleaf species. Unlike N. japonica and S. koreana, O. japonica was deemed to be significantly affected by the minimum variable temperature and was estimated to show a different distribution in South Korea. Furthermore, higher habitat suitability for O. japonica was observed along the coast compared to the inland areas under future climatic conditions. The highest level of habitat suitability was observed to be on Jeju Island and extended over time to the central region of South Korea. With greenhouse gas emissions remaining the same in the 2070s, habitat suitability was predicted to be high along the east coast of the central region.

4. Discussion

As habitats change intensively because of climate change worldwide, predicting and preparing future habitats are important tasks. In recent years, climate change has been accelerating, and thus comprehensive monitoring is essential for conserving the existing species and identifying suitable habitats for future appropriate plant species. Therefore, many SDM studies have been conducted, and high-resolution regional and local studies are further required to better understand the impacts of future environmental changes [37,38]. However, most studies rely on global bioclimate data and do not sufficiently consider various environmental variables, such as soil and topography [39]. Contrastingly, this study used 1 km resolution climatic and topographical environmental variables based on vegetation data acquired through field surveys conducted across the entirety of South Korea. Additionally, compared with those in previous studies, more empirical results with higher accuracy were derived in this study.
The variable importance affecting the CBIS habitats was derived through the jackknife test of MaxEnt. The test results showed that the variable importance was similar among evergreen broadleaf species, and the minimum temperature and average precipitation had a large effect. This is similar to the results of the study by Boogar et al. and Liu et al. [35,40], and, in particular, the effect of annual precipitation on habitat distribution has already been derived through many studies [24,26,41,42,43,44]. This study found that the minimum temperature had a great effect on C. japonica and E. macrophylla, while the average precipitation had a large effect on O. japonica and E. japonica.
By considering topographic variables in the SDM analysis, this study determined that topographic variables also significantly affect the distribution of the CBIS. Among the nine species, C. harringtonia was found to have the greatest effect on the current habitat for the following topographic variables: DEM, slope, and valid soil depth. Moreover, based on the jackknife test results, topographic variables were identified as those that most significantly lowered the gain value of the model when excluded, for which the details are as follows: slope for C. japonica, N. sericea, and O. japonica; DEM for E. macrophylla, M. thunbergia, and N. japonica; and topographic wetness index for C. harringtonia. Therefore, the absence of topographic variables in the SDM analysis may have affected model accuracy. Analysis using only climatic variables without topographic variables may cause problems such as overfitting [45,46,47]. Therefore, deriving vegetation distribution through a comprehensive analysis is important and should be conducted by adding variables for habitat characteristics along with climatic variables.
Owing to global warming, the Korean Peninsula is expected to have a subtropical climate because of the decrease in subarctic and temperate climates and the expansion of subtropical climates [48]. Accordingly, the number of species that mainly inhabit the southern region of South Korea is expected to increase when moving northward. In addition to monitoring the habitat loss of existing plant species due to climate change, identifying species with the potential for future distribution expansion is important. Strategies for climate change must be developed by tracking plant species movement [49]. Therefore, future habitat analysis focusing on CBIS is significant in terms of resource management planning.
In this study, the changes in the CBIS habitat in South Korea were derived under the RCP 4.5 and RCP 8.5 climate change scenarios. Most CBIS were found to show an increasing pattern of suitable habitat areas over time. Among the nine CBIS investigated, three species of deciduous broadleaf trees and one evergreen coniferous tree (C. harringtonia) were found to have increased habitat suitability. Particularly, in the case of deciduous broadleaf trees, suitable habitats in inland areas increased, and by the 2070s, they will be ideal species in South Korea. C. harringtonia showed northward expansion along the Taebaek Mountains under the analyzed climate change scenarios. This was also observed by Lee et al., who analyzed habitat suitability for six coniferous species [50].
Evergreen broadleaf species showed similar distribution patterns under the climate change scenarios. Rather than exhibiting an increase, the suitable habitat areas moved north along the west and east coasts. The response curves of each variable affecting the evergreen broadleaf habitat were similar. This was because the current habitat environments, as well as the factors affecting the habitats, such as minimum temperature, average precipitation, and annual average temperature, were similar.
To summarize the results of the climate change scenarios, deciduous broadleaf tree species of CBIS may become more widespread in South Korea over time. These results are similar to those reported by Kim et al., who reported that deciduous broadleaf tree species were most suitable for the future climate of South Korea [26]. The results of this study can be used to establish future vegetation management goals in South Korea. In the future, vegetation movement and trends should be assessed considering potential habitat decreases and suitable habitat environmental changes. Therefore, not only CBIS but also other southern species with the potential for expansion and the replacement of plants due to climate change should be considered. As National Ecosystem Surveys continue to accumulate new data, future research should utilize these data to continuously track future plant habitat changes. Additionally, because human activities significantly affect plant habitat changes [35,51], future research should also consider land use.

5. Conclusions

Owing to intensified climate change and extreme climatic events, the existing plant habitats are threatened; therefore, the comprehensive monitoring of changes in plant habitats is essential. In this study, habitat changes of CBIS in South Korea were identified using the MaxEnt algorithm, a useful tool for SDM analysis. To respond to climate change, in addition to protecting currently suitable plant species, monitoring the plant species that can be introduced, as their habitat suitability increases, and considering them in future plantation plans is necessary. This study investigated changes in CBIS habitats by applying RCP 4.5 and RCP 8.5 scenarios and found that deciduous broadleaf and evergreen coniferous species were suitable for future inhabitation in South Korea. The results were significant, as high AUC values and more precise results were obtained by combining high-resolution environmental variable data with field survey data. This study contributes to the derivation of high-accuracy SDM through the construction of detailed environmental variables in South Korea. These results can be used to provide suggestions for the management and implementation of landscape plantation plans in the context of future climate change. In addition, through this study, it was confirmed that including topographic variables in SDM analysis has a significant effect on model accuracy. Elaborate SDM analysis based on high-resolution variables can be used to predict plant habitat changes in more detail. Future research should continue monitoring habitat changes by including additional climatic and human-activity-related variables.

Author Contributions

Conceptualization, Y.S., S.-W.L. and K.A.; Methodology, Y.S., E.S. and K.A.; Writing—original draft, Y.S. and K.A.; Writing—review & editing, K.A.; Supervision, S.-W.L. and K.A. All authors have read and agreed to the published version of the manuscript.

Funding

This paper was supported by Konkuk University in 2021.

Institutional Review Board Statement

Not applicable.

Informed Consent Statement

Not applicable.

Data Availability Statement

Data are contained within the article.

Conflicts of Interest

The authors declare no conflicts of interest.

References

  1. Sales, L.P.; Galetti, M.; Pires, M.M. Climate and Land-use Change Will Lead to a Faunal “Savannization” on Tropical Rainforests. Glob. Chang. Biol. 2020, 26, 7036–7044. [Google Scholar] [CrossRef]
  2. Dornelas, M.; Gotelli, N.J.; Shimadzu, H.; Moyes, F.; Magurran, A.E.; McGill, B.J. A Balance of Winners and Losers in the Anthropocene. Ecol. Lett. 2019, 22, 847–854. [Google Scholar] [CrossRef]
  3. Urban, M.C. Accelerating Extinction Risk from Climate Change. Science 2015, 348, 571–573. [Google Scholar] [CrossRef] [PubMed]
  4. Vincent, H.; Bornand, C.N.; Kempel, A.; Fischer, M. Rare Species Perform Worse than Widespread Species under Changed Climate. Biol. Conserv. 2020, 246, 108586. [Google Scholar] [CrossRef]
  5. Silva, J.L.S.E.; Cruz-Neto, O.; Peres, C.A.; Tabarelli, M.; Lopes, A.V. Climate Change Will Reduce Suitable Caatinga Dry Forest Habitat for Endemic Plants with Disproportionate Impacts on Specialized Reproductive Strategies. PLoS ONE 2019, 14, e0217028. [Google Scholar] [CrossRef] [PubMed]
  6. Franks, S.J.; Weber, J.J.; Aitken, S.N. Evolutionary and Plastic Responses to Climate Change in Terrestrial Plant Populations. Evol. Appl. 2014, 7, 123–139. [Google Scholar] [CrossRef]
  7. Vitasse, Y.; Ursenbacher, S.; Klein, G.; Bohnenstengel, T.; Chittaro, Y.; Delestrade, A.; Monnerat, C.; Rebetez, M.; Rixen, C.; Strebel, N.; et al. Phenological and Elevational Shifts of Plants, Animals and Fungi under Climate Change in the European Alps. Biol. Rev. 2021, 96, 1816–1835. [Google Scholar] [CrossRef]
  8. Araújo, M.B.; Alagador, D.; Cabeza, M.; Nogués-Bravo, D.; Thuiller, W. Climate Change Threatens European Conservation Areas: Climate Change Threatens Conservation Areas. Ecol. Lett. 2011, 14, 484–492. [Google Scholar] [CrossRef]
  9. Wang, C.; Liu, C.; Wan, J.; Zhang, Z. Climate Change May Threaten Habitat Suitability of Threatened Plant Species within Chinese Nature Reserves. PeerJ 2016, 4, e2091. [Google Scholar] [CrossRef]
  10. Prober, S.M.; Doerr, V.A.J.; Broadhurst, L.M.; Williams, K.J.; Dickson, F. Shifting the Conservation Paradigm: A Synthesis of Options for Renovating Nature under Climate Change. Ecol. Monogr. 2019, 89, e01333. [Google Scholar] [CrossRef]
  11. Elith, J.; Phillips, S.J.; Hastie, T.; Dudík, M.; Chee, Y.E.; Yates, C.J. A Statistical Explanation of MaxEnt for Ecologists: Statistical Explanation of MaxEnt. Divers. Distrib. 2011, 17, 43–57. [Google Scholar] [CrossRef]
  12. Manish, K.; Telwala, Y.; Nautiyal, D.C.; Pandit, M.K. Modelling the Impacts of Future Climate Change on Plant Communities in the Himalaya: A Case Study from Eastern Himalaya, India. Model. Earth Syst. Environ. 2016, 2, 92. [Google Scholar] [CrossRef]
  13. Edalat, M.; Dastres, E.; Jahangiri, E.; Moayedi, G.; Zamani, A.; Pourghasemi, H.R.; Tiefenbacher, J.P. Spatial Mapping Zataria multiflora Using Different Machine-Learning Algorithms. CATENA 2022, 212, 106007. [Google Scholar] [CrossRef]
  14. Pouteau, R.; Meyer, J.-Y.; Taputuarai, R.; Stoll, B. Support Vector Machines to Map Rare and Endangered Native Plants in Pacific Islands Forests. Ecol. Inform. 2012, 9, 37–46. [Google Scholar] [CrossRef]
  15. Sharifipour, B.; Gholinejad, B.; Shirzadi, A.; Shahabi, H.; Al-Ansari, N.; Farajollahi, A.; Mansorypour, F.; Clague, J.J. Rangeland Species Potential Mapping Using Machine Learning Algorithms. Ecol. Eng. 2023, 189, 106900. [Google Scholar] [CrossRef]
  16. Sittaro, F.; Hutengs, C.; Vohland, M. Which Factors Determine the Invasion of Plant Species? Machine Learning Based Habitat Modelling Integrating Environmental Factors and Climate Scenarios. Int. J. Appl. Earth Obs. Geoinf. 2023, 116, 103158. [Google Scholar] [CrossRef]
  17. Mosebo Fernandes, A.C.; Quintero Gonzalez, R.; Lenihan-Clarke, M.A.; Leslie Trotter, E.F.; Jokar Arsanjani, J. Machine Learning for Conservation Planning in a Changing Climate. Sustainability 2020, 12, 7657. [Google Scholar] [CrossRef]
  18. Shen, T.; Yu, H.; Wang, Y.-Z. Assessing the Impacts of Climate Change and Habitat Suitability on the Distribution and Quality of Medicinal Plant Using Multiple Information Integration: Take Gentiana rigescens as an Example. Ecol. Indic. 2021, 123, 107376. [Google Scholar] [CrossRef]
  19. Atzeni, L.; Cushman, S.A.; Bai, D.; Wang, J.; Chen, P.; Shi, K.; Riordan, P. Meta-replication, Sampling Bias, and Multi-scale Model Selection: A Case Study on Snow Leopard (Panthera uncia) in Western China. Ecol. Evol. 2020, 10, 7686–7712. [Google Scholar] [CrossRef]
  20. Fyllas, N.M.; Koufaki, T.; Sazeides, C.I.; Spyroglou, G.; Theodorou, K. Potential Impacts of Climate Change on the Habitat Suitability of the Dominant Tree Species in Greece. Plants 2022, 11, 1616. [Google Scholar] [CrossRef]
  21. Abdelaal, M.; Fois, M.; Fenu, G.; Bacchetta, G. Using MaxEnt Modeling to Predict the Potential Distribution of the Endemic Plant Rosa arabica Crép. in Egypt. Ecol. Inform. 2019, 50, 68–75. [Google Scholar] [CrossRef]
  22. Mudereri, B.T.; Mukanga, C.; Mupfiga, E.T.; Gwatirisa, C.; Kimathi, E.; Chitata, T. Analysis of Potentially Suitable Habitat within Migration Connections of an Intra-African Migrant-the Blue Swallow (Hirundo Atrocaerulea). Ecol. Inform. 2020, 57, 101082. [Google Scholar] [CrossRef]
  23. Grimmett, L.; Whitsed, R.; Horta, A. Presence-Only Species Distribution Models Are Sensitive to Sample Prevalence: Evaluating Models Using Spatial Prediction Stability and Accuracy Metrics. Ecol. Model. 2020, 431, 109194. [Google Scholar] [CrossRef]
  24. Soilhi, Z.; Sayari, N.; Benalouache, N.; Mekki, M. Predicting Current and Future Distributions of Mentha pulegium L. in Tunisia under Climate Change Conditions, Using the MaxEnt Model. Ecol. Inform. 2022, 68, 101533. [Google Scholar] [CrossRef]
  25. Phillips, S.J.; Dudík, M. Modeling of Species Distributions with Maxent: New Extensions and a Comprehensive Evaluation. Ecography 2008, 31, 161–175. [Google Scholar] [CrossRef]
  26. Kim, J.; Lee, D.K.; Kim, H.G. Suitable Trees for Urban Landscapes in the Republic of Korea under Climate Change. Landsc. Urban Plan. 2020, 204, 103937. [Google Scholar] [CrossRef]
  27. Bedia, J.; Herrera, S.; Gutiérrez, J.M. Dangers of Using Global Bioclimatic Datasets for Ecological Niche Modeling. Limitations for Future Climate Projections. Glob. Planet. Chang. 2013, 107, 1–12. [Google Scholar] [CrossRef]
  28. Cramer, W.; Bondeau, A.; Woodward, F.I.; Prentice, I.C.; Betts, R.A.; Brovkin, V.; Cox, P.M.; Fisher, V.; Foley, J.A.; Friend, A.D.; et al. Global Response of Terrestrial Ecosystem Structure and Function to CO2 and Climate Change: Results from Six Dynamic Global Vegetation Models. Glob. Chang. Biol. 2001, 7, 357–373. [Google Scholar] [CrossRef]
  29. Park, C.-E.; Jeong, S.-J.; Ho, C.-H.; Kim, J. Regional Variations in Potential Plant Habitat Changes in Response to Multiple Global Warming Scenarios. J. Clim. 2015, 28, 2884–2899. [Google Scholar] [CrossRef]
  30. Sitch, S.; Huntingford, C.; Gedney, N.; Levy, P.E.; Lomas, M.; Piao, S.L.; Betts, R.; Ciais, P.; Cox, P.; Friedlingstein, P.; et al. Evaluation of the Terrestrial Carbon Cycle, Future Plant Geography and Climate-carbon Cycle Feedbacks Using Five Dynamic Global Vegetation Models (DGVMs). Glob. Chang. Biol. 2008, 14, 2015–2039. [Google Scholar] [CrossRef]
  31. Lucht, W.; Schaphoff, S.; Erbrecht, T.; Heyder, U.; Cramer, W. Terrestrial Vegetation Redistribution and Carbon Balance under Climate Change. Carbon Balance Manag. 2006, 1, 6. [Google Scholar] [CrossRef] [PubMed]
  32. Jiang, Y.; Zhuang, Q.; Schaphoff, S.; Sitch, S.; Sokolov, A.; Kicklighter, D.; Melillo, J. Uncertainty Analysis of Vegetation Distribution in the Northern High Latitudes during the 21st Century with a Dynamic Vegetation Model. Ecol. Evol. 2012, 2, 593–614. [Google Scholar] [CrossRef] [PubMed]
  33. Gonzalez, P.; Neilson, R.P.; Lenihan, J.M.; Drapek, R.J. Global Patterns in the Vulnerability of Ecosystems to Vegetation Shifts Due to Climate Change: Global Vulnerability to Climate Change. Glob. Ecol. Biogeogr. 2010, 19, 755–768. [Google Scholar] [CrossRef]
  34. Hojati, M.; Mokarram, M. Determination of a Topographic Wetness Index Using High Resolution Digital Elevation Models. Eur. J. Geogr. 2016, 7, 41–52. [Google Scholar]
  35. Liu, L.; Guan, L.; Zhao, H.; Huang, Y.; Mou, Q.; Liu, K.; Chen, T.; Wang, X.; Zhang, Y.; Wei, B.; et al. Modeling Habitat Suitability of Houttuynia cordata Thunb (Ceercao) Using MaxEnt under Climate Change in China. Ecol. Inform. 2021, 63, 101324. [Google Scholar] [CrossRef]
  36. Swets, J.A. Measuring the Accuracy of Diagnostic Systems. Science 1988, 240, 1285–1293. [Google Scholar] [CrossRef]
  37. Riordan, E.C.; Rundel, P.W. Land Use Compounds Habitat Losses under Projected Climate Change in a Threatened California Ecosystem. PLoS ONE 2014, 9, e86487. [Google Scholar] [CrossRef]
  38. Sleeter, B.M.; Sohl, T.L.; Bouchard, M.A.; Reker, R.R.; Soulard, C.E.; Acevedo, W.; Griffith, G.E.; Sleeter, R.R.; Auch, R.F.; Sayler, K.L.; et al. Scenarios of Land Use and Land Cover Change in the Conterminous United States: Utilizing the Special Report on Emission Scenarios at Ecoregional Scales. Glob. Environ. Chang. 2012, 22, 896–914. [Google Scholar] [CrossRef]
  39. Liu, G.; Mai, J. Habitat Shifts of Jatropha curcas L. in the Asia-Pacific Region under Climate Change Scenarios. Energy 2022, 251, 123885. [Google Scholar] [CrossRef]
  40. Rahimian Boogar, A.; Salehi, H.; Pourghasemi, H.R.; Blaschke, T. Predicting Habitat Suitability and Conserving Juniperus spp. Habitat Using SVM and Maximum Entropy Machine Learning Techniques. Water 2019, 11, 2049. [Google Scholar] [CrossRef]
  41. Rahmani, R. Potential Distribution and the Habitat Suitability of the African Mustard (Brassica tournefortii) in Tunisia in the Context of Climate Change. Arab. J. Geosci. 2020, 13, 512. [Google Scholar] [CrossRef]
  42. Ben Mariem, H. Climate change impacts on the distribution of Stipa tenacissima L. Ecosystems in north african arid zone—A case study in Tunisia. Appl. Ecol. Environ. Res. 2017, 15, 67–82. [Google Scholar] [CrossRef]
  43. Du, Z.; He, Y.; Wang, H.; Wang, C.; Duan, Y. Potential Geographical Distribution and Habitat Shift of the Genus Ammopiptanthus in China under Current and Future Climate Change Based on the MaxEnt Model. J. Arid Environ. 2021, 184, 104328. [Google Scholar] [CrossRef]
  44. Xu, N.; Meng, F.; Zhou, G.; Li, Y.; Wang, B.; Lu, H. Assessing the Suitable Cultivation Areas for Scutellaria baicalensis in China Using the Maxent Model and Multiple Linear Regression. Biochem. Syst. Ecol. 2020, 90, 104052. [Google Scholar] [CrossRef]
  45. Feng, L.; Sun, J.; El-Kassaby, Y.A.; Yang, X.; Tian, X.; Wang, T. Predicting Potential Habitat of a Plant Species with Small Populations under Climate Change: Ostryarehderiana. Forests 2022, 13, 129. [Google Scholar] [CrossRef]
  46. Feng, L.; Sun, J.; Shi, Y.; Wang, G.; Wang, T. Predicting Suitable Habitats of Camptotheca Acuminata Considering Both Climatic and Soil Variables. Forests 2020, 11, 891. [Google Scholar] [CrossRef]
  47. Yu, F.; Wang, T.; Groen, T.A.; Skidmore, A.K.; Yang, X.; Ma, K.; Wu, Z. Climate and Land Use Changes Will Degrade the Distribution of Rhododendrons in China. Sci. Total Environ. 2019, 659, 515–528. [Google Scholar] [CrossRef] [PubMed]
  48. Choi, Y.; Lim, C.-H.; Chung, H.I.; Kim, Y.; Cho, H.J.; Hwang, J.; Kraxner, F.; Biging, G.S.; Lee, W.-K.; Chon, J.; et al. Forest Management Can Mitigate Negative Impacts of Climate and Land-Use Change on Plant Biodiversity: Insights from the Republic of Korea. J. Environ. Manag. 2021, 288, 112400. [Google Scholar] [CrossRef]
  49. Corlett, R.T.; Westcott, D.A. Will Plant Movements Keep up with Climate Change? Trends Ecol. Evol. 2013, 28, 482–488. [Google Scholar] [CrossRef]
  50. Lee, S.; Jung, H.; Choi, J. Projecting the Impact of Climate Change on the Spatial Distribution of Six Subalpine Tree Species in South Korea Using a Multi-Model Ensemble Approach. Forests 2020, 12, 37. [Google Scholar] [CrossRef]
  51. Wang, G.; Wang, C.; Guo, Z.; Dai, L.; Wu, Y.; Liu, H.; Li, Y.; Chen, H.; Zhang, Y.; Zhao, Y.; et al. Integrating Maxent Model and Landscape Ecology Theory for Studying Spatiotemporal Dynamics of Habitat: Suggestions for Conservation of Endangered Red-Crowned Crane. Ecol. Indic. 2020, 116, 106472. [Google Scholar] [CrossRef]
Figure 1. Study area.
Sustainability 16 01013 g001
Figure 2. Distribution map for potential current habitats for nine CBIS.
Sustainability 16 01013 g002
Figure 3. Distribution map of evergreen coniferous trees under future climate.
Sustainability 16 01013 g003
Figure 4. Distribution map of evergreen broadleaf trees under future climate scenarios.
Sustainability 16 01013 g004aSustainability 16 01013 g004bSustainability 16 01013 g004c
Figure 5. Distribution map of deciduous broadleaf species under future climate scenarios.
Sustainability 16 01013 g005aSustainability 16 01013 g005b
Table 1. Details of the climate-sensitive biological indicator species (CBIS).
ClassSpeciesFamilyLife Form
Evergreen
coniferous tree
Cephalotaxus harringtonia
(Knight ex Forbes) K. Koch
TaxaceaeTree
Evergreen
broadleaf tree
Camellia japonical L.TheaceaeTree
Elaeagnus macrophylla Thunb.ElaeagnaceaeShrub
Eurya japonica Thunb.PentaphylacaceaeTree
Machilus thunbergii Siebold & Zucc.LauraceaeTree
Neolitsea sericea (Blume) Koidz.LauraceaeTree
Deciduous
broadleaf tree
Neoshirakia japonica
(Siebold and Zucc.) Esser
EuphorbiaceaeTree
Orixa japonica Thunb.RutaceaeShrub
Stewartia koreana Nakai ex RehderTheaceaeTree
Table 2. Number of fourth-survey datasets for CBIS.
SpeciesNumber of Datasets
C. japonica129
C. harringtonia53
E. macrophylla112
E. japonica169
M. thunbergii114
N. sericea106
N. japonica126
O. japonica92
S. koreana64
Table 3. Environmental variables.
CategoryVariablesData Type
ClimaticAnnual average temperatureContinuous
Maximum temperature
Minimum temperature
Average precipitation
TopographicAltitude
Topographic wetness index
Aspect
Slope
Soil depthCategorical
Table 4. Results for suitable habitat index.
ClassificationSuitable Habitat Index
Unsuitable habitatp < 0.1
Poorly suitable habitat0.1 ≤ p < 0.3
Moderately suitable habitat0.3 ≤ p < 0.7
Highly suitable habitat0.7 ≤ p < 1.0
Table 5. Area under curve (AUC) values for CBIS.
SpeciesAUC Values
C. japonica0.951
C. harringtonia0.801
E. macrophylla0.954
E. japonica0.944
M. thunbergii0.971
N. sericea0.983
N. japonica0.892
O. japonica0.943
S. koreana0.873
Disclaimer/Publisher’s Note: The statements, opinions and data contained in all publications are solely those of the individual author(s) and contributor(s) and not of MDPI and/or the editor(s). MDPI and/or the editor(s) disclaim responsibility for any injury to people or property resulting from any ideas, methods, instructions or products referred to in the content.

