Article

The Evolution of the Spatial–Temporal Pattern of Tourism Development and Its Influencing Factors: Evidence from China (2010–2022)

1
Business School, Beijing Technology and Business University, Beijing 100048, China
2
Institute for Culture and Tourism Development, Beijing Technology and Business University, Beijing 100048, China
3
School of International Tourism and Public administration, Hainan University, Haikou 571155, China
*
Authors to whom correspondence should be addressed.
Sustainability 2024, 16(23), 10758; https://doi.org/10.3390/su162310758
Submission received: 25 August 2024 / Revised: 21 October 2024 / Accepted: 4 December 2024 / Published: 8 December 2024

Abstract

:
The Chinese economy has shifted towards a stage of high-quality development, and promoting high-quality development of tourism is of great significance for its sustainable development. Based on the new development concept, using Geographic Information System (GIS) spatial analysis, Moran’s I Index, and the Geographically Weighted Regression (GWR) model, this paper analyzes the spatial–temporal evolution of tourism development in 31 provinces in China during 2010–2022. The findings are as follows: (1) the overall tourism development level of China from 2010 to 2022 was at a medium-low level, showing a spatial distribution pattern of “higher in southeast and lower in northwest”; (2) from the perspective of the Quality–Quantity relationship, the quality of tourism development in China has gradually improved, the regional gap between the east and the west and the internal gap among western regions/provinces have gradually expanded; and (3) tourism innovation and internationalization level are the main influencing factors of high-quality tourism development in China’s provinces, providing practical decision-making references for advancing the high-quality development of tourism.

1. Introduction

Tourism accounted for 10.4% of the global GDP in 2019, the year before the COVID-19 outbreak [1,2], and was the third contributor to the global economy [3]. In China, relying on its characteristics of large correlation, wide involvement, and strong driving force, tourism revenue has reached USD 1585 billion, ranking second in the world in the proportion of GDP [4]. The number of people engaged in tourism accounts for 10.3% of the total employment, and tourism-related employment accounts for more than 79 million jobs [5]. At present, China’s economic development mode has shifted from high-speed growth to high-quality development. Tourism is an important component of China’s economic development, with characteristics of high correlation, wide coverage, and strong driving force. It profoundly affects the high-quality development of the Chinese economy. So the high-quality development of tourism is of great practical significance to the healthy development of the national economy. At the same time, the traditional extensive tourism urgently needs upgrading and reconstruction, and high-quality development has become the only way for the development of tourism. With the new development concept as the starting point, “Innovative Development”, “Coordinated Development”, “Green Development”, “Open Development”, and “Shared Development” lead the direction for the high-quality development of tourism [6], which promotes the process of Chinese-style modernization. In this context, exploring and improving the quality of tourism development is of great strategic significance for the orderly and green development of tourism in the future, and is an inevitable choice to achieve Chinese-style modernization.
The sustainable development of tourism has become the key consideration of global, national, and regional policies, and is also an important research field in tourism [7]. The economic, social, and environmental benefits brought by tourism have attracted increasing attention from scholars, mainly focusing on five fields: ecological protection, residents’ interests, carbon footprint, tourists’ behaviors and attitudes [8], and digital tourism [9]. Sustainable tourism requires not only rethinking the role of tourism in development but also reducing the impact of tourism on the environment to achieve personal and social well-being on a global scale [10]. The main source of carbon emissions from tourism is transportation. High carbon emissions from international tourism will damage environmental quality, and innovative and environmentally friendly transportation can significantly reduce carbon emissions [11]. Meanwhile, with the development of international tourism and digital industries, CO2 emissions will decrease [12]. Based on ecosystem theory, Ruan et al. (2019) created the evaluation model of tourism ecological security in the Yangtze River Delta with the DPSIR (Driving–Pressure–State–Impact–Response) framework, identified key influencing factors, and built the driving mechanism of tourism ecological security [13]. Gannon et al. (2021) investigated the mediating effect of residents’ perceptions of tourism development in Kashan and Tabriz, two Iranian cities with a long history [14], and residents’ perceptions of overall well-being and quality of life brought by tourism affected residents’ behaviors related to supporting tourism development [15,16]. It is a necessary practice to maintain a high level of satisfaction with tourists’ needs, ensure that consumers have a good experience, and improve their awareness of sustainable development issues [17]. In the future, the rapid development of innovative technologies, especially information and communication technologies, will make Smart Tourism Destinations (STDs) possible, which will contribute to the well-being of local communities and social and environmental protection, and promote the sustainable development of tourism [18]. These studies can conclude that the high-quality development of tourism is not only a single level of rapid development, but the result of multiple factors.
The study scale of high-quality tourism development ranges from small islands and heritage sites to large regions. Taking the sustainable development of island tourism as a research sample, Xu et al. (2020) conducted quantitative research through evaluation indicators to find the key factors and constraints affecting the sustainable development ability of island tourism [19]. Mousazadeh et al. (2023) adopted a thematic analysis approach to establish a research model to shape the effective behavior of tourists, officials, and local people to protect the ancient underground ditch system [20]. Ecotourism in southern Ethiopia has neglected stakeholders and accelerated the degradation of natural resources [21]. High-quality tourism development no longer relies on the advantages of traditional resources and market size [22,23]. The tourism industry needs to provide high-quality tourism products and services [24]. The focus should be on changing the development mode dominated by economic interests, finding the balance point between the tourism economy and ecological environment pressure [25], exploring effective low-carbon measures, and developing low-carbon tourism [26]. The economic benefits created are passed on to other economic sectors through various forward and backward linkages [27].
Scholars adopt different research methods to evaluate the high-quality development level of tourism. He et al. (2023) calculated the degree of tourism mismatch by using the entropy method, multi-index synthesis method, and healthy distance model, indicating that the role of tourism structure in China has not been fully utilized [28]. Based on Tencent migration big data and Weibo check-in big data, Chen et al. (2023) found that higher-quality tourism destinations with more tourists and higher-quality tourism destinations with few tourists coexist [29]. By using the time-varying median difference model, Liu et al. (2023) proved that global tourism has a positive impact on the high-quality development of local tourism [30], and global tourism can promote leadership in advantageous tourism regions, which is the key to high-quality development of local tourism [31]. Based on the Analytic Hierarchy Process and entropy method, Wei et al. (2024) used the coupling coordination model to explore the driving factors of coupling coordination between Rural Tourism and Rural Revitalization [32]. Shen et al. (2022) adopted the entropy method and coupling coordination model to explore the coupling coordination high-quality development mechanism of tourism and urbanization in the Yangtze River Delta [33]. By using data envelope analysis and social network analysis, Wang et al. (2020) concluded that China’s tourism efficiency network has an obvious network hierarchy, and the overall tourism efficiency shows a slight decline [34].
The objectives of this study are as follows: (1) based on the new development concept (NDC), construct the index system of the new development level of China’s tourism industry from the five aspects of “Innovation, Coordination, Green, Open, and Sharing” using the Analytic Hierarchy Process (AHP) and the expert consultation method; (2) explore the spatial and temporal differences of the development level of China’s tourism industry in the multi-scale of “nation–region–province”, analyze the Quality–Quantity relationship of the tourism industry, and discover the main factors affecting the quality of tourism development. The analysis will provide decision-making support for high-quality development instead of unbalanced and inadequate tourism development.

2. Data and Method

2.1. Data Source

The data used in this study were mainly derived from the “China Tourism Statistical Yearbook”, “China Statistical Yearbook”, “China Culture and Related Industries Statistical Yearbook” and the "National Provincial Statistical Yearbook", the "Statistical Bulletin of National Economic and Social Development", and the official website of the Department (or Committee, or Bureau) of Culture and Tourism (excluding the data of Hong Kong, Macao, and Taiwan). The patent information on China’s tourism industry from 2010 to 2019 was retrieved through the “innojoy patent search engine”, and the publication time and location of the “regional annual number of open tourism patents” were collected to define the year and province where the patents belonged [35]. Some indicators are calculated by secondary calculation, simple moving average method, and interpolation method (see the Supplementary Materials, Table S1, for details).

2.2. Index System Construction

This paper constructs an indicator system for the new development level of tourism from five dimensions: innovation, coordination, green, openness, and sharing. A total of 11 scholars from the academic, political, and business circles in the field of tourism were invited to fill in the 1–9 scale questionnaire, and the weights were determined by AHP [26], as shown in Table 1. Innovation is the driving force of tourism development, and innovation input and output measure the level of tourism innovation development. Hjalager (2010) believes that academic research and research-based education play an indispensable role in innovation and subsequent commercial utilization [36], and R&D (research and development) investment is a key factor in the development of innovation. Patents are also increasingly used to analyze and measure innovation [37]. Therefore, the dimension of innovation development in this paper includes two indicators of innovation input and five sub-indicators, including the number of tourism major students in higher education institutions, the general public budget expenditure on cultural tourism, sports, and media [13], the R&D expenditure of cultural manufacturing enterprises above designated size [38], the annual number of tourism patents published in the region, and the number of patent applications authorized for cultural and related industries [11].
Tourism development scale and the urban–rural gap can represent the level of regional coordinated development. Tourism consumption capacity is the existing scope of tourism economic growth and per capita disposable income and tourism e-commerce sales, which reflect the level of residents’ tourism consumption and tourism digital economy development, respectively. At the same time, the urbanization rate and the ratio of urban and rural disposable income are two indicators to measure the structure of regional residents’ tourism consumption power. Therefore, the coordinated development dimension of this paper includes two indicators and six sub-indicators of economic development and urban–rural structure, including the proportion of Chinese tourism income in GDP [13], the number of tourists received by tourist attractions [25], the per capita disposable income ratio of urban and rural residents [23], the urbanization rate of permanent residents [11], the per capita disposable income of residents, and the sales of tourism e-commerce [30].
Green tourism development is the main consideration. The dimension of green development in this paper includes two indicators and four sub-indicators of ecological construction and environmental governance, specifically including forest coverage rate, urban per capita green park area, urban solid waste harmless treatment rate [13], and the proportion of days with air quality of level 2 or better in provincial capitals in the whole year [26].
According to market entities, tourism is divided into domestic tourism and international tourism. Tourism income and number of tourists are the original basis for examining the scale and development level of the regional tourism market. The number of travel agencies, tourism turnover, and room rental rate of star-rated hotels represent the three pillars of travel agencies, tourism transportation, and hotel tourism, respectively. Therefore, the dimensions of open development in this paper include two indicators of domestic tourism and seven sub-indicators of international tourism, including Chinese tourism income [13], number of domestic tourists [11], passenger turnover [28], number of travel agencies [25], room rental rate of star-rated hotels [26], foreign exchange income from tourism, and reception of inbound overnight tourists [12].
Shared development enables people to have a more direct and real sense of gain and happiness in the process of tourism. The penetration rate of mobile phones and the number of ports brought by the Internet are proof that residents enjoy the development achievements of the Internet era, and they are also the basis for the development of a tourism digital economy. Urban construction infrastructure and cultural welfare can describe the promotion effect of high-quality tourism development on residents’ quality of life. Therefore, the shared development dimension of this paper includes two indicators and eight sub-indicators of infrastructure and cultural welfare, including the number of Internet broadband access ports per 10,000 visitors [12], the urban per capita road area [26], the number of public transportation vehicles owned per urban unit population, the circulation data of public libraries per 10,000 visitors, the actual building area of mass cultural institutions per 10,000 visitors [30], the penetration rate of mobile phones, the number of people participating in cultural activities per 10,000 visitors, and the number of museums per 10,000 museum visitors [35].

2.3. Data Standardization

The Min–Max standardization method (also known as the range method) is used to carry out the linear transformation of the original data and map the values to [0, 100]. Its purpose is to uniformly transform data into dimensionless values, so as to facilitate the comparison and weighting of the values of different units.
The calculation formula is as follows:
P o s i t i v e   I n d i c a t o r s : Z i = x i m i n 1 i n x i m a x 1 i n x i m i n 1 i n x i
N e g a t i v e   I n d i c a t o r s : Z i = m a x 1 i n x i x i m a x 1 i n x i m i n 1 i n x i
where Zi is the value after standardization, max 1 i n x i is the maximum value, min 1 i n x i is the minimum value, and xi is the value before standardization.

2.4. GWR Model

The GWR method considers the spatial heterogeneity of regression coefficients compared with the Ordinary Least Squares (OLSs) method. It may be more realistic to assume that economic behaviors between regions are spatially heterogeneous. When the independent variables exhibit spatial autocorrelation and variability, the assumption of residual term independence in the OLSs model will not be met. The GWR model was used to incorporate the spatial characteristics of data into the model, aiming to explore the spatial variation characteristics and rules of each influencing factor in the provinces. The Arcgis 10.8 software was used in the part.

2.5. New Tourism Development Index

The Index weight ω 1 i , ω 2 i , ω 3 i , was used to calculate the comprehensive weight w i of each indicator, and the standard value Zi of each indicator was multiplied by the corresponding comprehensive weight w i to transform it into an indexation value, Ci, and the Tourism New Development Index (TNDI) was obtained by adding 30 index values, Ci. In the same way, the Tourism Innovation Development Index (TIDI), Tourism Harmonious Development Index (THDI), Tourism Green Development Index (TGDI), Open Development Index (TODI), and Shared Development Index (TSDI) were calculated, respectively.

2.6. Grade Division Method

The natural break point grading method was used to classify TNDI values into seven grades: highest, higher, high, moderate, low, lower, and lowest using ArcGIS 10.8 software. The average annual growth rate of TNDI (AAGR–TNDI) was classified into seven levels, including the slowest, slower, slow, medium, fast, faster, and fastest, as shown in Table 2.

3. Result

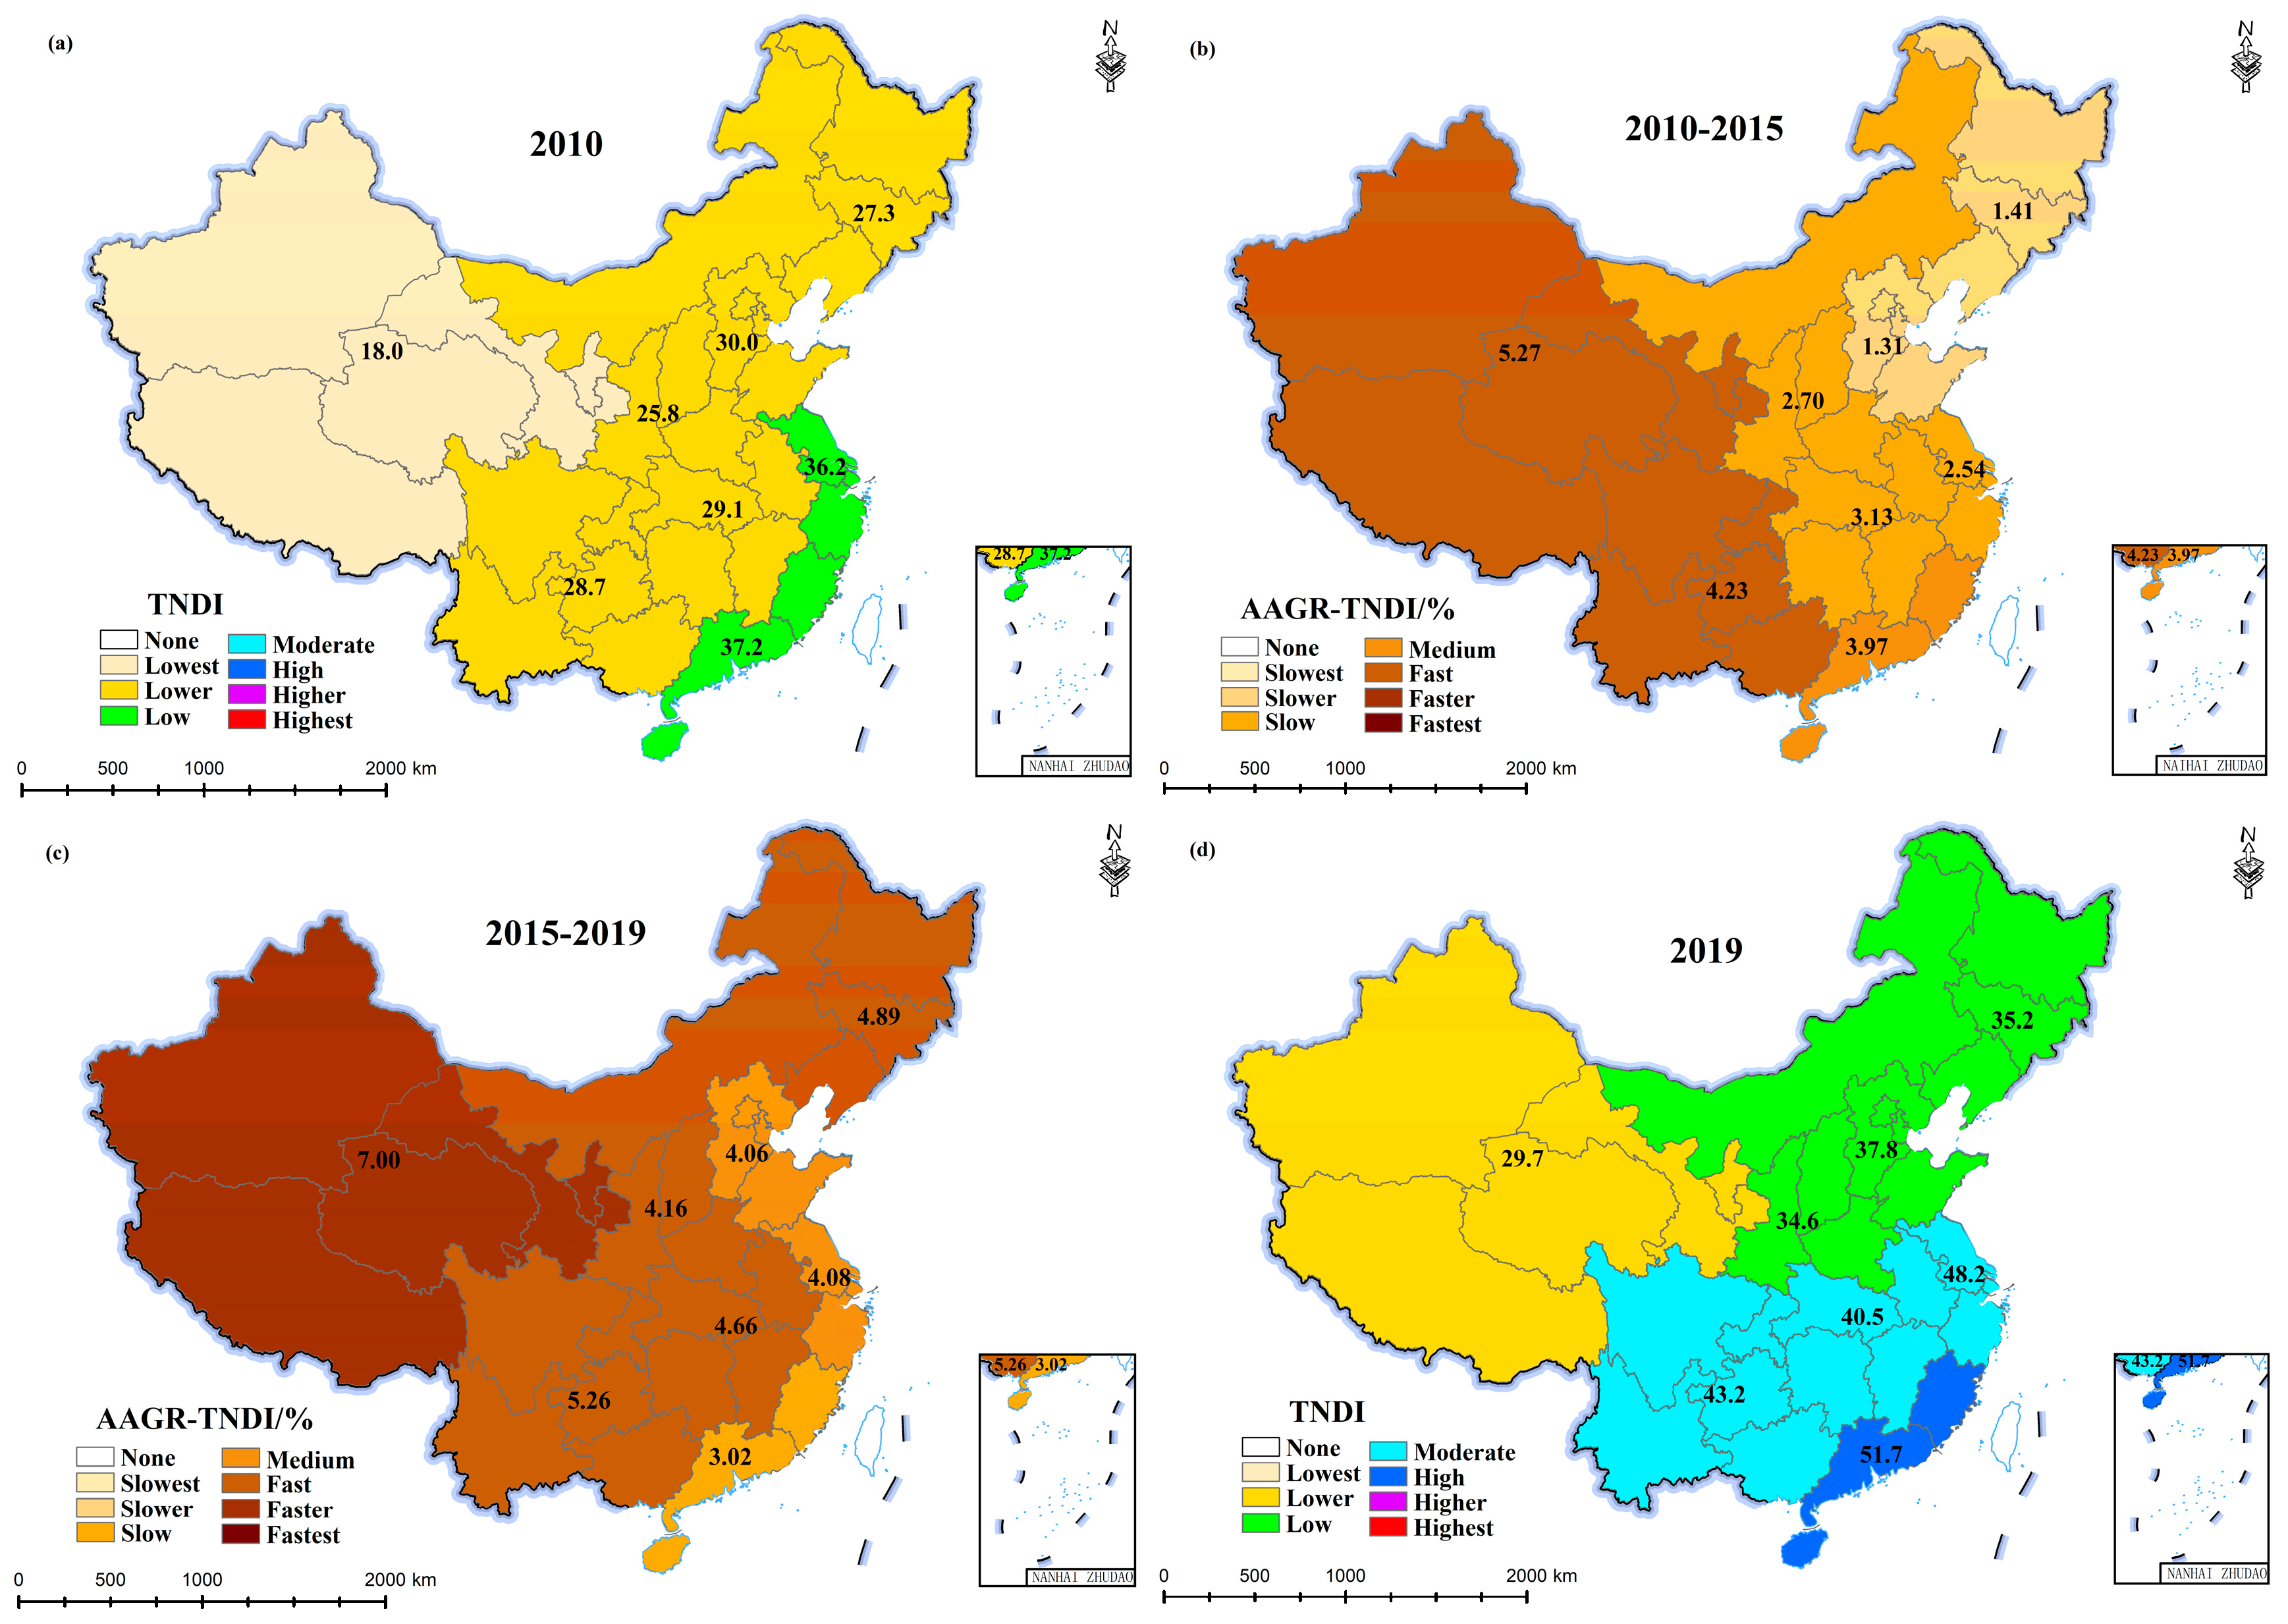
3.1. Overall Situation of TNDI in China

On the whole, Table 3 shows that the average TNDI of China increased from 28.21 in 2010 to 39.41 in 2019, and the level of Chinese tourism development has always been at a low or even lower level. The average value of AAGR–TNDI from 2010 to 2019 was 3.78%, showing an overall accelerating trend, increasing from 3.08% (Slow) from 2010 to 2015 to 4.66% (Fast) from 2015 to 2019. It can be seen that the level of China’s tourism industry improved faster after 2015. From a regional perspective, the TNDI value of the eastern region is at a medium-high level (34.03–45.35), occupying the core position of China’s tourism development while maintaining a steady acceleration (average annual rate of 3.18%) with super competitiveness. The TNDI value of the western region is at a low level (23.89–34.82), which is a weak area in the development of China’s tourism industry. The TNDI value in the central region was slightly higher than that in the western region (27.65–37.84) but lower than the average for the same period. The TNDI value of Northeast China in 2010 was 28.21, which is higher than that of the western region and the central region, and the average value of AAGR–TNDI was only 2.89%, which is significantly lower than that of the western region (4.82%) and the central region (3.55%). The TNDI of Northeast China in 2015 lagged behind compared with the western region. The TNDI of China and all regions sharply declined in 2020 and, as of 2022, it had not yet returned to the level of 2019.
From a regional perspective, the Chinese Mainland is divided into eight comprehensive economic zones [39]. From 2010 to 2019, the TNDI value of the eastern coastal and southern coastal comprehensive economic zones in the eastern region rose from a low level to a moderate and high level (36.2–48.2, 37.2–51.7), always leading other economic zones in the country (Figure 1a,d). From Figure 1b,c, it can be seen that the eastern coastal comprehensive economic zone has accelerated, while the growth rate of the southern coastal comprehensive economic zone has declined to a medium speed level. The AAGR–TNDI of the northern coastal and northeast comprehensive economic zone from 2010 to 2015 was relatively low, with a slow growth rate and a small change in TNDI values. The TNDI value of the northern coastal comprehensive economic zone in 2019 was 37.8, making it the highest-level comprehensive economic zone in the north. The central region is located in the middle reaches of the Yangtze River and the Yellow River. The TNDI value and AAGR–TNDI value of the comprehensive economic zone in the middle reaches of the Yangtze River are higher than those of the comprehensive economic zone in the middle reaches of the Yellow River from 2010 to 2015 and from 2015 to 2019. From 2020 to 2022, the southern coastal and northwestern comprehensive economic zones gradually grew, and the TNDI of the reaches of the Yangtze River and southwestern comprehensive economic zones surpassed those of 2019 in 2022.
Specific to the provinces, the new development level of tourism in the provinces (municipalities and autonomous regions) has gradually improved, with the exception of the Tianjin and Liaoning provinces, all of which have achieved leapfrog growth. As can be seen from Figure 2a, in 2010, China had no high-level provinces. In 2019, three provinces in the eastern region entered high-level status (Figure 2d), becoming the leaders of tourism development in coastal comprehensive economic zones, while the low TNDI values were mainly distributed in the northeast, the middle reaches of the Yellow River, and the Great Northwest. In terms of AAGR–TNDI values, all provinces achieved positive growth (Figure 2b,c). Before and after 2015, the provinces located in the western, central, and northeast regions showed a large increase in AAGR–TNDI values, indicating that although there are large differences in tourism development levels among provinces, the provinces with a lower TNDI value have a higher growth rate and maintain a trend of accelerating catch-up. Although the TNDI values of some provinces have increased year by year, such as the Xizang, Hainan, Inner Mongolia, Chongqing, and Shaanxi provinces, the AAGR–TNDI values from 2015 to 2019 declined. The TNDI of every province dropped sharply in 2020, and the TNDI of most provinces in 2022 was still lower than those in 2019.

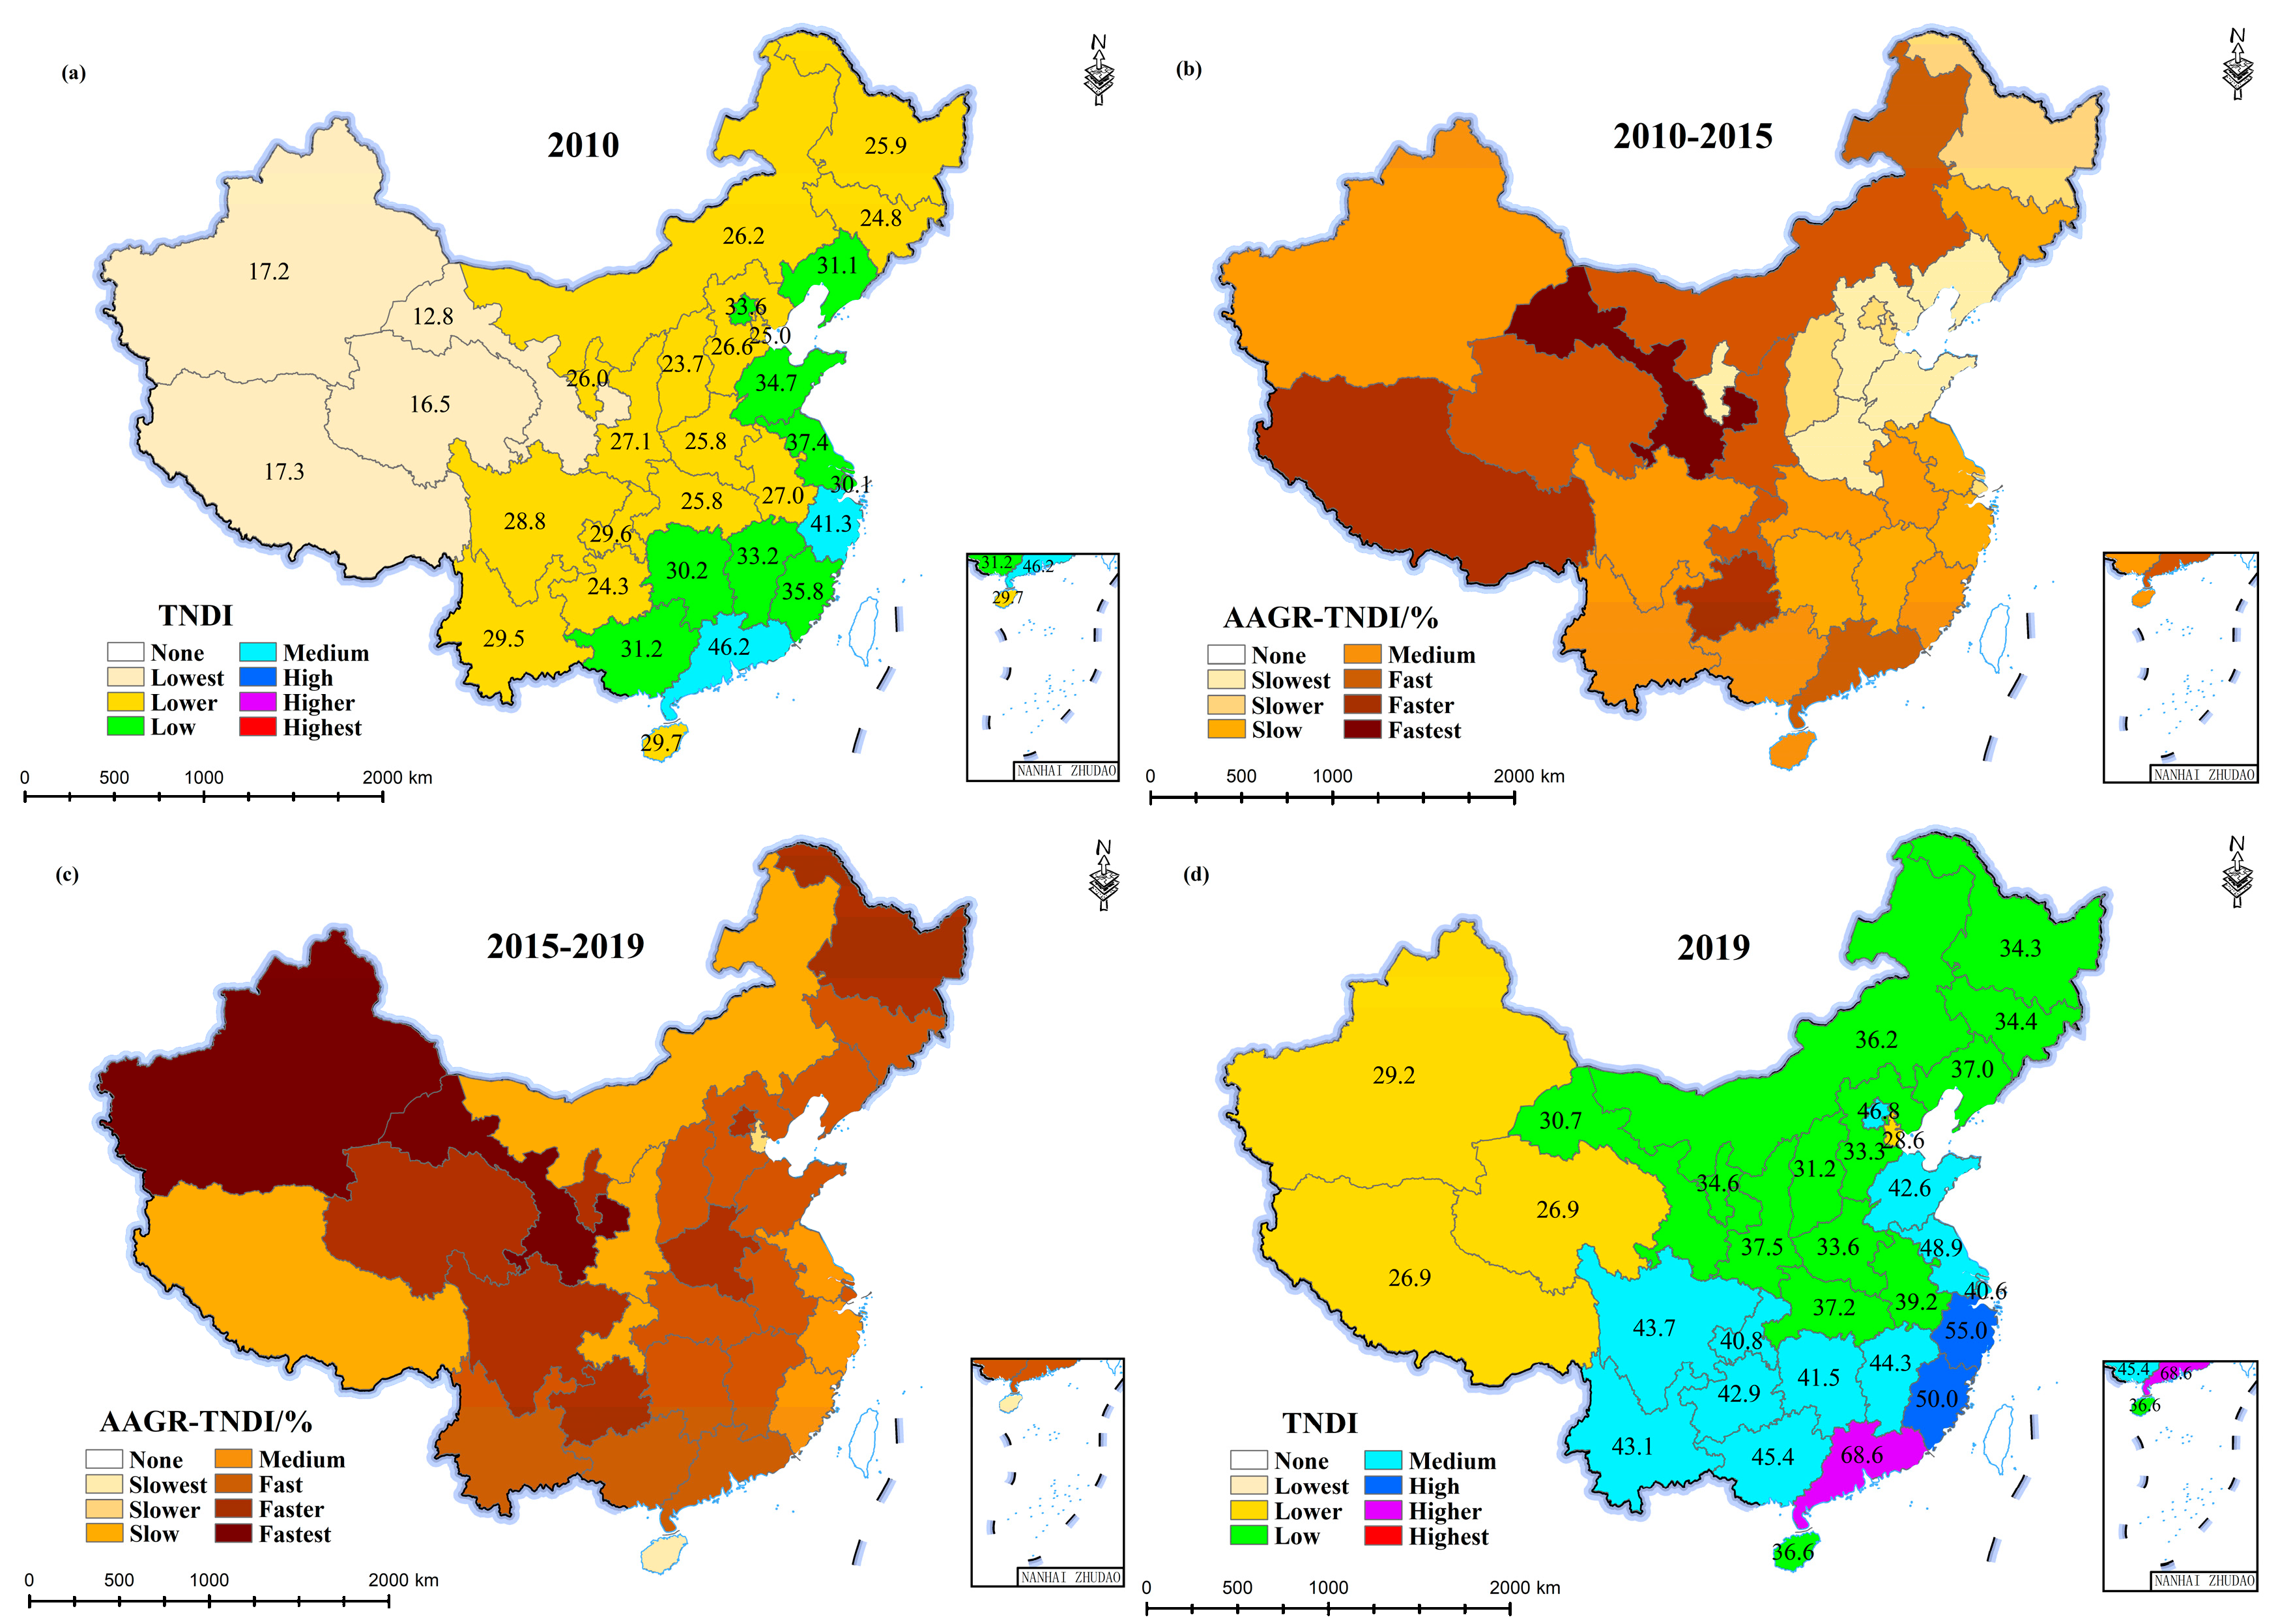
3.2. Five Dimensions of Development Indicators and Their Annual Growth Rates

Table 4 shows that the TIDI value increased from 1.59 in 2010 to 3.38 in 2022, with an average annual growth rate of 5.81%. The AAGR–TIDI value decreased significantly from 2015 to 2019, indicating that the innovation level of China’s tourism industry is still low and the innovation momentum is insufficient. Figure 3a shows that there are provinces with low TIDI values, slow AAGR–TIDI, or even retrogression in all regions, which will gradually widen the gap in tourism innovation development.
From 2010 to 2022, the THDI value increased from 2.17 to 4.22, doubling the level of coordinated development, but it decreased to 3.86 in 2022, and the AAGR–THDI value was 6.49%, confirming that tourism development can promote balanced regional development [40]. As shown in Figure 3b, the overall level of coordinated development of the country presents a cascade layout of “coastal to inland” decreasing in turn, and provinces with a lower level have a faster growth rate and better coordination.
The priority of ecological and environmental protection has become a development consensus, and the overall environmental quality has improved (19.18–23.07). Moreover, the AAGR–TODI value is 1.55%, which is an increase compared with the AAGR-TGDI values in 2010–2015 and 2015–2019. The forest vegetation coverage rate in the hilly areas of southeast China, the mountainous areas of Southwest China, and the large and small Xing’an Mountains of Northeast China is relatively high, and the TGDI value is relatively high (Figure 3c). The low values of TGDI are concentrated in northwest China and the Yellow River Delta, and the negative values of AAGR–TGDI in Shanxi (−0.38%) and Shaanxi (−1.57%) require urgent attention.
The TODI value increased from 3.37 in 2010 to 6.01 in 2019, and AAGR–TODI more than doubled in 2015–2019 compared with 2010–2015. The TODI value in the southern region is higher (Figure 3d), and the openness level is generally higher than that in the northern region. Guangdong (19.59), adjacent to Hong Kong and Macao, had the best international tourism performance, with a TODI value far ahead of the provinces, while Tianjin (−1.27%) experienced negative growth due to the decline in international tourism performance. From 2020 to 2022, the TODI value sharply dropped, seriously affecting the healthy development of the tourism industry.
The TSDI value jumped the most (1.90–4.98–4.86), maintaining a high growth momentum (11.28%), and the level of tourism infrastructure and cultural welfare was significantly improved. As shown in Figure 3e, high TSDI values are distributed in the eastern and western regions, while the western region is sparsely populated and the per capita level is relatively high. The AAGR–TSDI value of some provinces in the northeast, northwest, and central regions is small, and the growth rate of the TSDI value is slow.

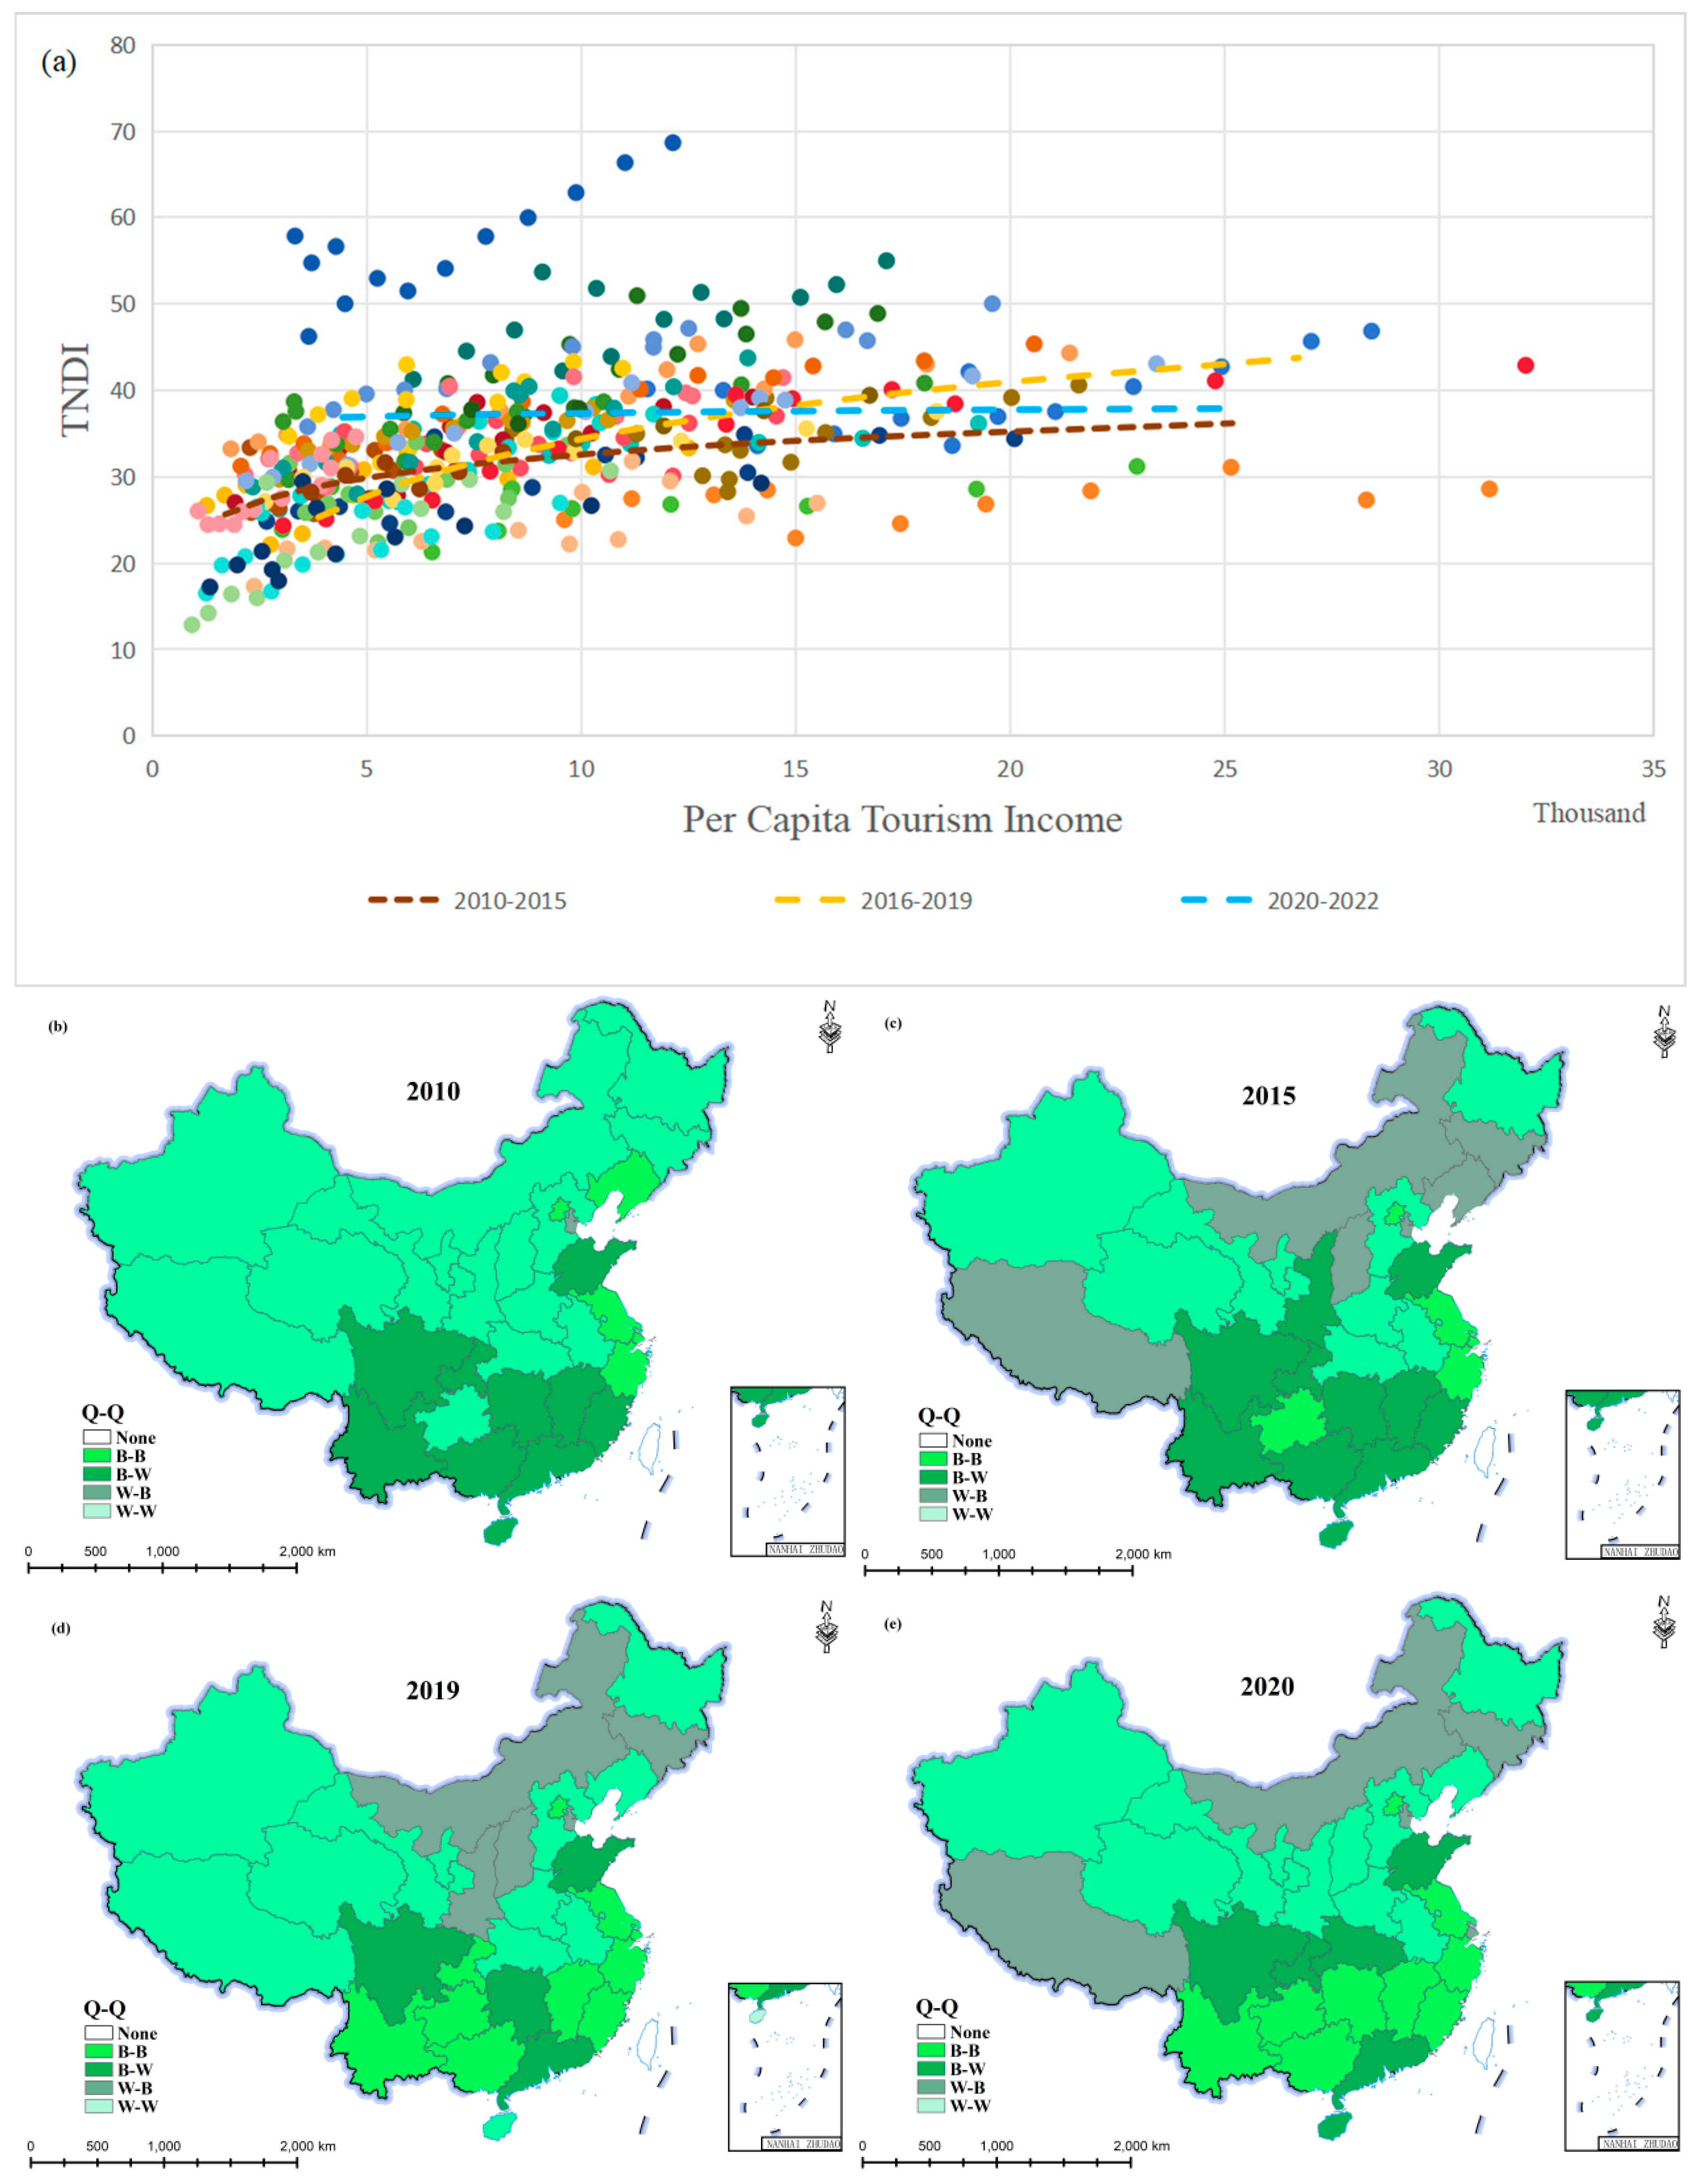
3.3. The Relationship Between Quality and Quantity

In order to demonstrate the Quality–Quantity (Q-Q) relationship of tourism in each province, the average values of TNDI and per capita tourism income were obtained by the mean method and a two-dimensional combination matrix of tourism development quality (X–axis) and quantity (Y–axis) (Figure 4b–d). The quantity and quality of tourism development in each province are divided into four types: Best–Best (B–B), Best–Worst (B–W), Worst–Worst (W–W), and Worst–Best (W–B), as shown in Table 5.
The new tourism development index and per capita tourism income of each province showed an upward trend from 2010 to 2019 (Figure 4a), declined from 2020 to 2022, and the development trend line from 2016 to 2019 was higher than that from 2010 to 2015, indicating that after the new development concept was put forward, the development quality of China’s tourism industry significantly improved, but the trend line was still flat. This result proves that there is still a disconnect between “qualitative” development and “quantitative” development. From the perspective of the tourism development quality of provinces, Zhejiang, Jiangsu, and Beijing have been at an optimal level of tourism development quality and tourism economic benefits. The tourism development quality of provinces in the southern region has become better, and the number of provinces with double excellent quality (B–B) has gradually increased. Meanwhile, the tourism quality of the middle Yellow River economic zone has improved, and the number of provinces with double poor quality (W–W) has decreased. In 2019, Liaoning turned into double poor quality, and the new tourism development index and per capita tourism income are lower than the national average. The provinces with uncoordinated tourism development deserve attention and further in-depth research.

3.4. Characteristics and Influencing Factors of Tourism Spatial Evolution

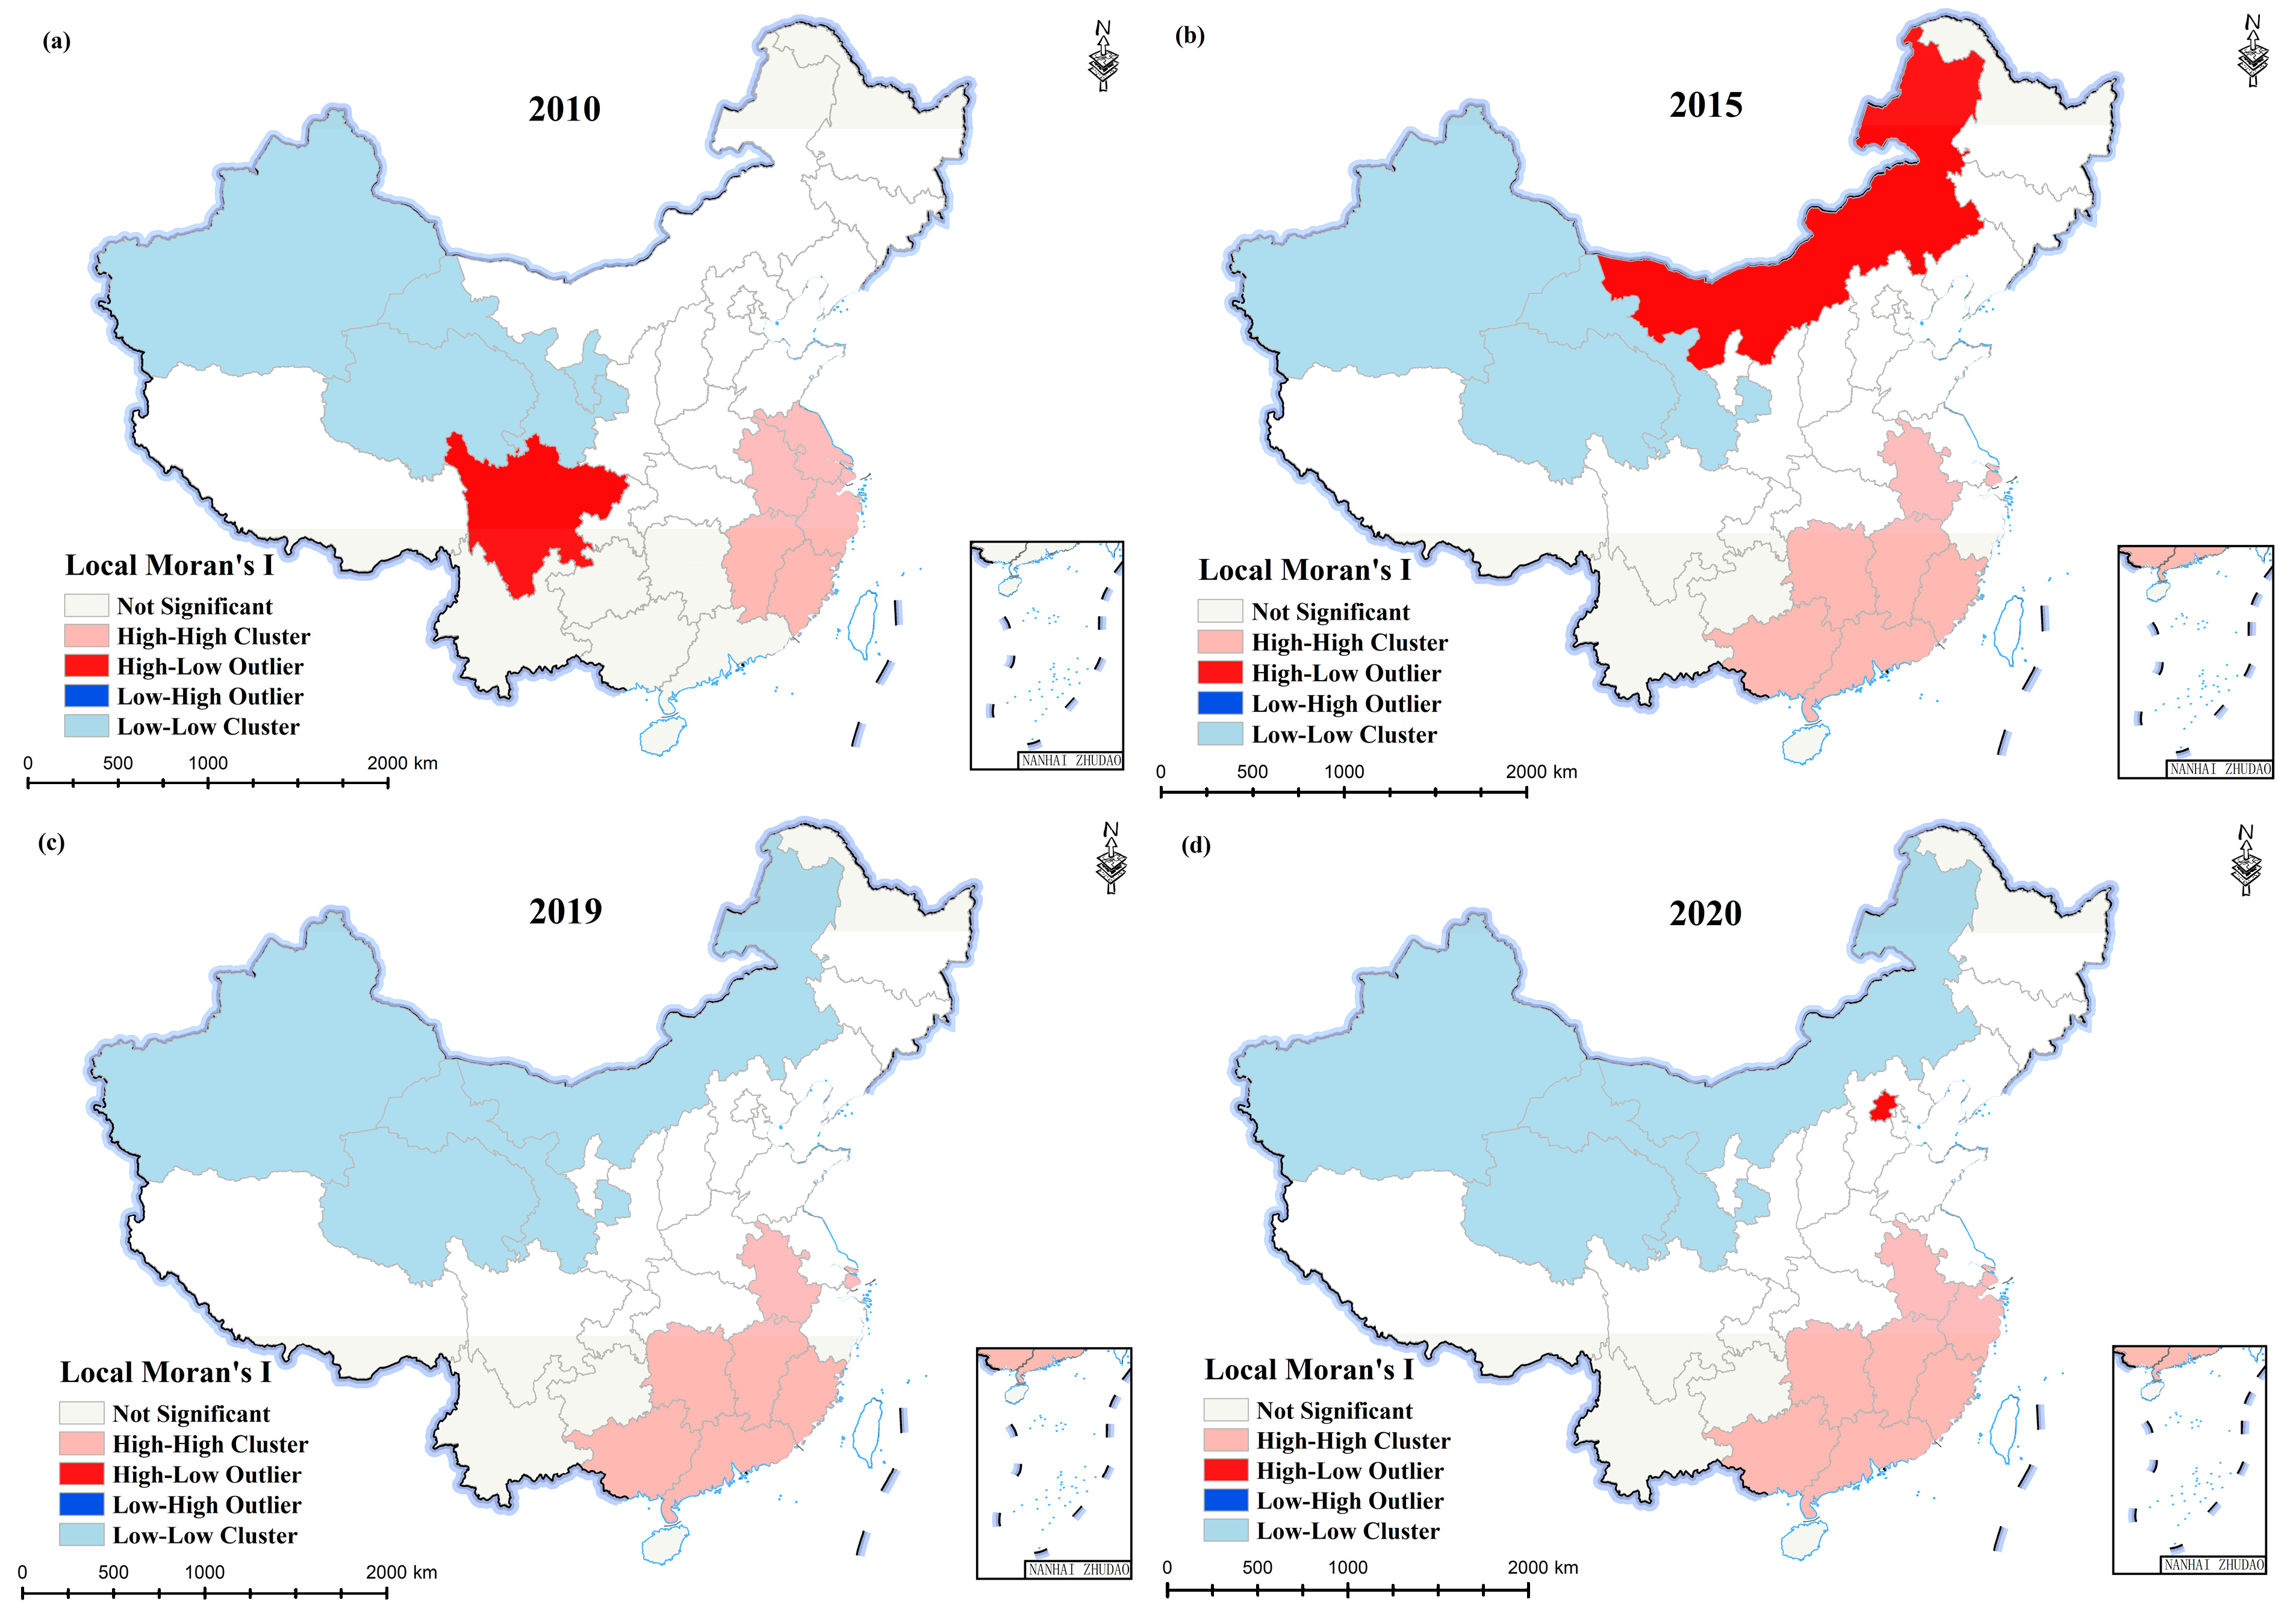
3.4.1. Global Spatial Correlation Pattern

Based on the new tourism development index of 2010, 2015, 2019, and 2020, Moran’s I value and standardized Z value of the inter-provincial Tourism New Development Index were measured by the ArcGIS 10.8 spatial analysis tool (Table 6). The results show that the global Moran’s I index is positive, passing the Z-test of a 1% significance level in each of the four years, indicating that the tourism development of each province presents a significant spatial aggregation feature from 2010 to 2019. From the perspective of the dynamic evolution trend, Moran’s I value decreased from 0.4581 to 0.3710 and increased to 0.4458 in 2020, showing a gradual downward trend overall, indicating that the spatial agglomeration trend of all provinces was weakened and the spatial development differences decreased.

3.4.2. Local Spatial Correlation Pattern

Due to the problem that global spatial autocorrelation ignores the potential instability of spatial processes, it is necessary to further study the spatial differentiation pattern of China’s tourism development and use the ArcGIS 10.8 tool to obtain local LISA aggregation maps of tourism development in various provinces. As can be seen from Figure 5, the overall pattern of provinces in China is relatively stable, showing a two-level differentiation pattern of H-H and L-L clustering locally. The H-H zone extends from the eastern coastal economic zone to the southern coastal and middle reaches of the Yangtze River comprehensive economic zone, and the L-L zone is concentrated in the Great Northwest comprehensive economic zone. The distribution of the H-L area in Inner Mongolia is closely related to the pilot of 113 key environmental protection cities and national environmental protection model cities in 2013 and the implementation of new ambient air standards in 2016 across the country [41]. The transformation of Sichuan into non-significant status indicates that the tourism development of the provinces in the Great Southwest comprehensive economic zone has progressed, and the gap in the development level of tourism within the region has decreased significantly. On the contrary, the differences between the Beijing Tianjin Hebei region increased in 2020.

3.4.3. Selection of Indicator Elements

The spatial differentiation of tourism development is closely related to the factors of provincial tourism development. Relevant studies show that there are many factors affecting the high-quality development of tourism, such as the cultural tourism industry, inbound tourism, tourism innovation, and tourism policies. By referring to the research of existing scholars [42,43] and excluding environmental factors [44], the following indicators are selected as the factors affecting the spatial differences of tourism development in China’s provinces: (1) Tourism innovation is represented by the general public budget expenditure on culture, tourism, sports, and media. (2) Tourism policy is reflected by the proportion of domestic tourism revenue in GDP. (3) Economic development is represented by per capita disposable income. (4) The level of internationalization is expressed by the number of inbound overnight tourists. (5) The integration of culture and tourism is replaced by the number of museum visitors per 10,000 people.

3.4.4. OLSs Model and Results

The new tourism development index in 2019 was selected as the dependent variable, and tourism innovation, tourism policy, economic development, internationalization level, and cultural and tourism integration development were taken as explanatory variables. An OLSs linear regression model was constructed. The influence degree and significance level of dependent variables on explanatory variables were observed through the OLSs linear regression model, as shown in Table 7. The Variance Inflation Factor (VIF) values are all well below 7.5, indicating that there is no redundancy in explanatory variables and no multilinearity problem between variables. The goodness of fit R2 value of the equation is 0.731, and the Koenker (BP) statistic and the joint F statistic pass the significance test at 0.01 level, indicating that there is no heteroscedasticity in the modeling equation. By observing the p-value, it can be found that the level of tourism innovation and internationalization passes the significance test at the level of 0.01, indicating that these two explanatory variables have a significant impact on the spatial difference of tourism development in China’s provinces, while tourism policy, economic development, and cultural and tourism integration fail the significance test at the level of 0.01.

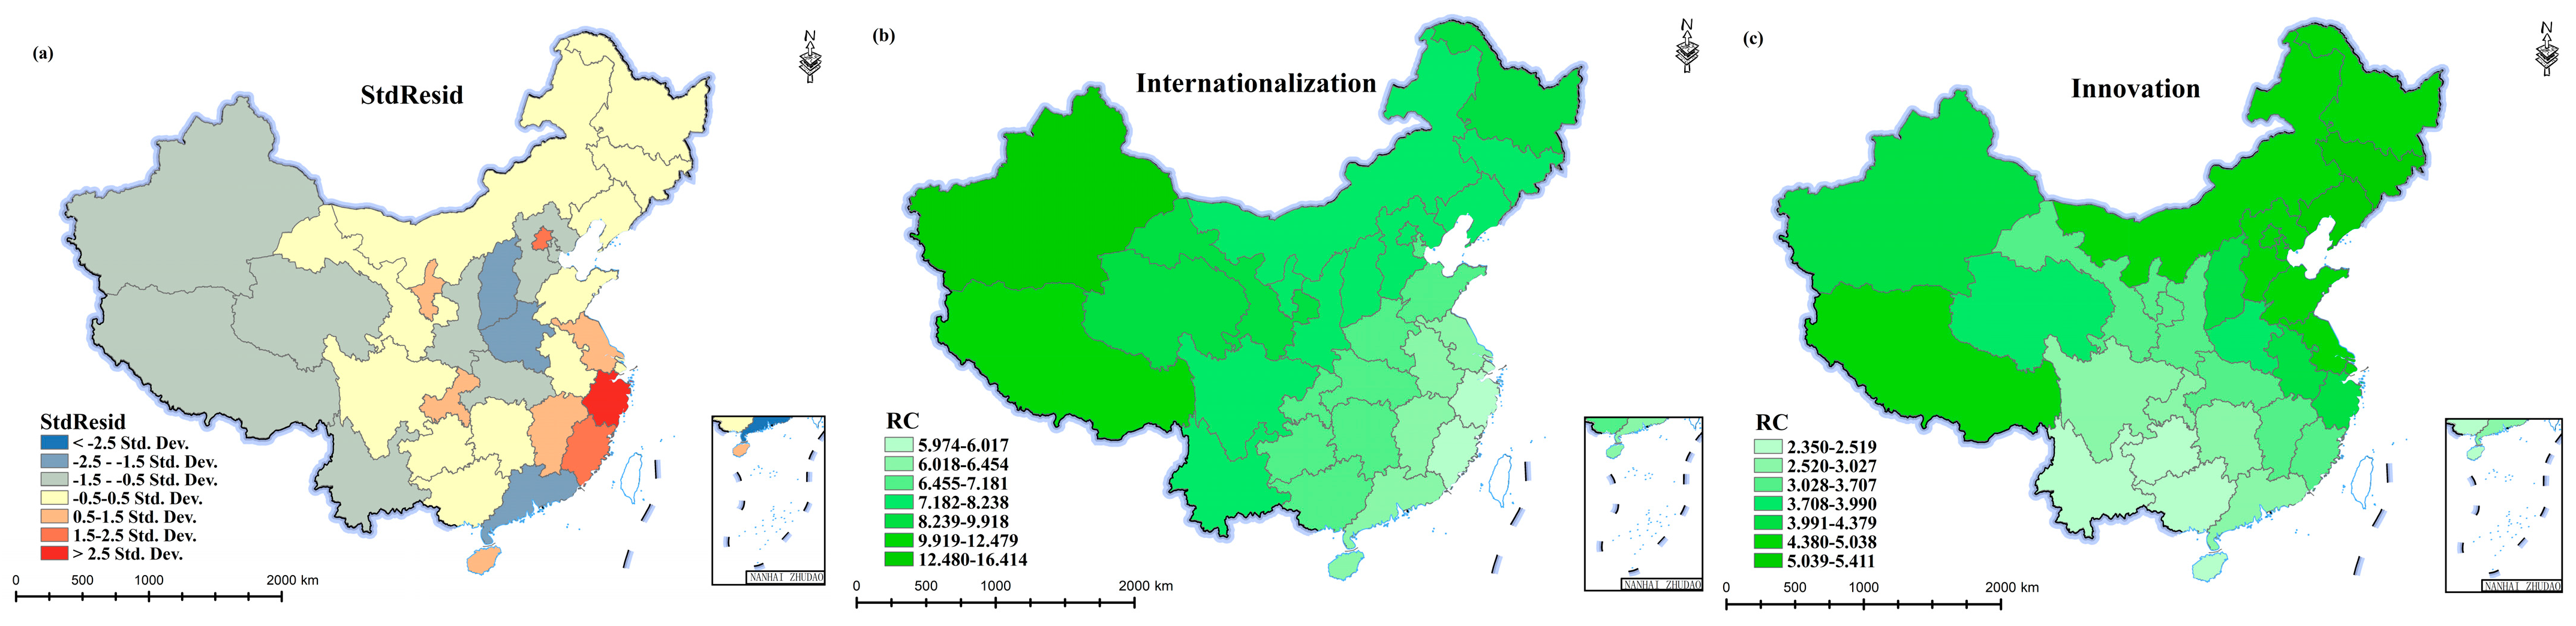
3.4.5. The GWR Model and Results

Considering the limitation of the OLSs linear regression model that only focuses on the global characteristics of regression coefficients, this paper further analyzes the local effects of factors affecting the spatial difference of tourism development in China by constructing a GWR model and uses the ArcGIS 10.8 software GWR tool to construct a geographically weighted model. Table 8 shows that the goodness of fit of the GWR model is 0.798, which is significantly improved and obviously superior to the OLSs model. The AICc value of the GWR model is 191.693, and the difference between the AICc value and the OLSs model Is much larger than 3. According to the existing research results [45], the GWR model has a better fitting effect, and the AICc value of the GWR model is lower than that of the OLSs model, which reflects the rationality of the GWR model.
As can be seen from the spatial distribution diagram of standard division residuals (Figure 6a), the range of standardized residuals of provincial local regression models is [−1.24, 2.51], and all provincial local regression models can pass the residuals test. The spatial autocorrelation test for the residuals shows that the value of Moran’ I index is 0.18 and the value of p is 0.07. The probability of randomly generating this clustering pattern is less than 10%, which indicates that the overall effect of the GWR model is good.
Further, the natural break point classification method of the ArcGIS 10.8 tool was used to visualize the regression coefficient results of the GWR model in space (Figure 6b,c) and describe the spatial differences of regression coefficients corresponding to each influencing factor. It can be seen from the spatial distribution of regression coefficients that independent variables show significant differences in space, which indicates that different independent variables have spatial heterogeneity in the development of tourism in China.
(1) According to the value of the regression coefficient, the internationalization level is the biggest factor affecting the spatial differentiation of China’s tourism development. From the spatial distribution of the regression coefficient of inbound overnight tourists (Figure 6b), the regression coefficient as a whole forms a “core–periphery” spatial distribution structure with the Northwest as the core and gradually spreading to the Southeast, indicating that the level of internationalization has a stronger influence on the development of tourism in the north than in the south. Among them, the high-value areas are concentrated in the northwest region and Heilongjiang province, indicating that the level of internationalization has a strong role in promoting the development of tourism in these provinces. The level of internationalization has a lower promoting effect on the tourism development of these provinces in the southeast region than that in the north. However, on the whole, the positive impact of the level of internationalization on the development of China’s tourism industry cannot be ignored, and it is necessary to actively integrate internationalization into the international tourism market in the future to attract more inbound tourists with cultural tourism characteristics, improve the quality of tourism services, and meet the tourism needs of tourists from different countries and regions.
(2) Tourism innovation is the second major factor affecting the spatial differentiation of China’s tourism development. From the spatial distribution of the regression coefficient of the general public budget expenditure on culture, tourism, sports, and media (Figure 6c), R&D plays a positive role in all provinces. In terms of the regression coefficient value, the south is slower than the north, the high-value area is concentrated in Tibet and provinces along the Yellow Sea and Bohai Sea coasts, the regression coefficient range is 4.380–5.411, and the Great Southwest comprehensive economic zone is a low-value area. The regression coefficient ranges from 2.350 to 3.027, indicating that the impact of the general public budget expenditure on culture, tourism, sports, and media on tourism development in the Northwest comprehensive economic zone is much greater than that in the middle Yellow River comprehensive economic zone. In the future, in the development of tourism, we should increase the investment in tourism innovation, promote the practical application of scientific and technological innovation in tourism, and improve the attractiveness of tourist destinations.

4. Conclusions and Discussion

Based on the new development concept and combined with AHP, expert consultation, Moran’s I Index, and the GWR model, we conducted an in-depth study on the spatial differences, spatio-temporal evolution, and influencing factors of tourism development in 31 provinces in China. The conclusions are as follows:
From 2010 to 2019, the development level of China’s tourism industry in the five dimensions significantly improved, and the development level of the tourism industry is at a medium to low level, but it still maintains a rapid growth trend; especially, after the new development concept is put forward, the growth rate is obvious. The tourism development of each province has a significant spatial correlation. The global space presents a spatial aggregation distribution trend of high value and low value, and the local space presents a two-level differentiation pattern of H-H and L-L aggregation. From the perspective of the TNDI value, China’s tourism development level as a whole presents a spatial distribution pattern of “high in the east and low in the west, high in the south and low in the north”. From the perspective of the AAGR-TNDI value, the western region leads, and the central and northeast regions grow faster than the eastern region.
In the two-dimensional combination matrix, the number of provinces with double excellent quality increased, and the development quality of China’s tourism industry improved, but there is still a significant disconnection between quality and quantity. The gap between the tourism development of eastern provinces and the less developed regions in the west has gradually widened, and the gaps within the western region have gradually widened.
The spatial differentiation of China’s tourism development is affected by multiple factors. Compared with the OLSs model, the GWR model is superior. The results show that tourism innovation and internationalization level are the main factors affecting the spatial differentiation of China’s tourism development, and each factor has obvious spatial differentiation in the intensity of tourism development in each province. Among them, the level of internationalization has a far greater impact on tourism development than tourism innovation.
This paper attempts to construct an evaluation index system of high-quality tourism development based on the new development concept and reveals the spatial differences, spatio-temporal evolution, and main influencing factors of high-quality tourism development in China from the scope of “nation–region–province”, which has certain reference significance for high-quality tourism development in China. There are three areas that still warrant further exploration:
(1) It is a complex and systematic process to measure the high-quality development of China’s tourism industry, and no consensus has been reached in the industry. Therefore, building a comprehensive measurement system for the high-quality development of China’s tourism industry is the biggest difficulty in the research and also the weak point of the existing research. Most studies use the entropy weight–TOPSIS model [46,47] and the multi-index comprehensive evaluation method [28] to build an index system from an objective perspective. Based on the new development concept, this paper combines the Analytic Hierarchy Process (AHP) and expert consultation to understand the high-quality development of tourism from a subjective and objective perspective, and constructs an evaluation index system for the high-quality development of tourism, which is a supplement to the existing studies. How to better and reasonably build a high-quality measurement system for tourism and the impact of the development of comparative advantages in economics [48] on the sustainable development of tourism are also worth discussing.
(2) From the perspective of spatio-temporal evolution and spatial differences in tourism development, the eastern provinces are far ahead, and their tourism development is more healthy, efficient, and reasonable. There is still a big gap between the central, western, and northeastern regions and the eastern provinces, but the high-quality level of tourism has been significantly improved, which is consistent with the results of existing studies [35,49], and the growth rate is faster than that of the eastern regions. The overall regional difference shows a narrowing trend [50], while the gap between the north and the south has the risk of widening [43], which should be paid attention to. Dai and Yang (2022) pointed out that the breakthrough in high-quality development of tourism lies in the high-quality development of advantageous industry areas of tourism [31]. Lv et al. (2021) found through the Markov transfer probability matrix that the overall mobility of China’s tourism industry is small, and the high probability maintains the original development level [46]. Zhu et al. (2019) pointed out that China’s domestic tourism economy has an obvious “path dependence” feature [51]. Therefore, priority should be given to developing regions with tourism advantages, improving the level of economic development, forming transportation networks, sustaining opening-up, and promoting regional tourism efficiency [52]. The mutual influence between neighboring provinces and cities should not be ignored.
Shi et al. (2023) used the obstacle degree model to identify the main obstacle factors to the high-quality development of China’s tourism industry [43]. Based on the GWR model, this paper preliminarily concluded that tourism innovation and internationalization level are important factors affecting the high-quality development of the tourism industry, which is to some extent a supplement to the existing research. At present, weak innovation momentum and a complex international environment have brought severe tests to the high-quality development of tourism, and digital cultural tourism has become the future development direction of tourism [18]. Tourism can be divided into two types: tourism-led and economy-driven [28]. The high-quality development of tourism not only needs to improve and balance the development of China’s tourism innovation efficiency [53] but also needs to be based on the type of tourism development (tourism-led and economy-driven) [27]. More importantly, targeted improvements should be made to the advantage and disadvantage indicators of each province [54].

5. Outlook

In the context of high-quality development, it is helpful to optimize the spatial layout of cultural tourism resources to deeply understand the characteristics of spatial and temporal evolution of tourism and explore its influencing factors. In this study, an expert consultation method and Analytic Hierarchy Process are adopted to establish a measurement system for high-quality tourism development. However, considering regional heterogeneity, the weight of indicators may affect the final high-quality tourism development index of each province to some extent, and more methods such as multivariate statistical analysis and the structural equation model can be used for interactive verification in the future. Due to the limitation of the data source, the measurement and evaluation index system may affect the perception of the cultural and tourism industry. Nowadays, digital economy and cultural and tourism integration have become popular research domains, so it is particularly important to follow the pace of the development of the cultural and tourism industry and make more representative indicators. To make the research more specific, research can be focused on small areas such as urban agglomeration, city, county, tourism city, countryside, and cultural and tourism industrial parks, and whether a single dimension within the region has a positive or negative effect on high-quality tourism development. The spillover effect of neighboring provinces on the high-quality development of regional tourism is also a promising research area.

Supplementary Materials

The following supporting information can be downloaded at: https://www.mdpi.com/article/10.3390/su162310758/s1, Table S1: Data source.

Author Contributions

Conceptualization, Y.Z. and J.W.; Methodology, J.S.; Formal analysis, X.Z. (Xin Zhang); Investigation, H.Y.; Writing—original draft, M.W.; Visualization, X.Z. (Xiaoyuan Zhang) All authors have read and agreed to the published version of the manuscript.

Funding

This research was supported by the National Natural Science Foundation of China (No: 72374017), the National Social Science Fund of China (21AGL012), the Project of Cultivation for young top-notch Talents of Beijing Municipal Institutions (No: BPHR202203055), and the Key Program of the Beijing Municipal Commission of Education (No: SZ202110011006).

Institutional Review Board Statement

The study did not require ethical approval.

Informed Consent Statement

Not applicable.

Data Availability Statement

Data are contained within the article.

Acknowledgments

We thank Liping Li at the Aerospace Information Research Institute, Chinese Academy of Sciences, for her contribution to English translation polishing, and we also thank the anonymous reviewers for their contribution to the peer review of this work.

Conflicts of Interest

The authors declare no conflict of interest.

References

  1. WTTC Global Economic Impact & Trends. 2021. Available online: https://wttc.org/ (accessed on 4 December 2024).
  2. UNWTO. UNWTO World Tourism Barometer and Statistical Annex. 2020. Available online: https://www.e-unwto.org/doi/abs/10.18111/wtobarometereng.2020.18.1.1 (accessed on 5 December 2022).
  3. Rasool, H.; Maqbool, S.; Tarique, M. The relationship between tourism and economic growth among BRICS countries: A panel cointegration analysis. Future Bus. J. 2021, 7, 1. [Google Scholar] [CrossRef]
  4. World Travel and Tourism Council (WTTC). EIR 2020 Data Tables Top 20 Final; World Travel and Tourism Council (WTTC): London, UK, 2020. [Google Scholar]
  5. World Travel and Tourism Council (WTTC). China 2020 Annual Research; World Travel and Tourism Council (WTTC): London, UK, 2020. [Google Scholar]
  6. Yan, X. Comprehensively implementing the new development concept is the only way for high-quality tourism development. Tour. Trib. 2023, 38, 3–5. [Google Scholar]
  7. Peng, H.; Zhang, J.; Lu, L.; Tang, G.; Yan, B.; Xiao, X.; Han, Y. Eco-efficiency and its determinants at a tourism destination: A case study of huangshan national park, China. Tour. Manag. 2017, 60, 201–211. [Google Scholar] [CrossRef]
  8. Khanra, S.; Dhir, A.; Kaur, P.; Mäntymäki, M. Bibliometric analysis and literature review of ecotourism: Toward sustainable development. Tour. Manag. Perspect. 2021, 37, 100777. [Google Scholar]
  9. Talwar, S.; Kaur, P.; Nunkoo, R.; Dhir, A. Digitalization and sustainability: Virtual reality tourism in a post pandemic world. J. Sustain. Tour. 2023, 31, 2564–2591. [Google Scholar] [CrossRef]
  10. Sharpley, R. Tourism, sustainable development and the theoretical divide: 20 years on. J. Sustain. Tour. 2020, 28, 1932–1946. [Google Scholar] [CrossRef]
  11. Erdoğan, S.; Gedikli, A.; Cevik, E.I.; Erdoğan, F. Eco-friendly technologies, international tourism and carbon emissions: Evidence from the most visited countries. Technol. Forecast. Soc. Chang. 2022, 180, 121705. [Google Scholar] [CrossRef]
  12. Wei, L.; Ullah, S. International tourism, digital infrastructure, and CO2 emissions: Fresh evidence from panel quantile regression approach. Environ. Sci. Pollut. Res. 2022, 29, 36273–36280. [Google Scholar] [CrossRef]
  13. Ruan, W.; Li, Y.; Zhang, S.; Liu, C.-H. Evaluation and drive mechanism of tourism ecological security based on the DPSIR-DEA model. Tour. Manag. 2019, 75, 609–625. [Google Scholar] [CrossRef]
  14. Gannon, M.; Rasoolimanesh, S.M.; Taheri, B. Assessing the mediating role of residents’ perceptions toward tourism development. J. Travel Res. 2021, 60, 149–171. [Google Scholar] [CrossRef]
  15. Eslami, S.; Khalifah, Z.; Mardani, A.; Streimikiene, D.; Han, H. Community attachment, tourism impacts, quality of life and residents’support for sustainable tourism development. J. Travel Tour. Mark. 2019, 36, 1061–1079. [Google Scholar] [CrossRef]
  16. Ramkissoon, H. Perceived social impacts of tourism and quality-of-life: A new conceptual model. J. Sustain. Tour. 2023, 31, 442–459. [Google Scholar] [CrossRef]
  17. Streimikiene, D.; Svagzdiene, B.; Jasinskas, E.; Simanavicius, A. Sustainable tourism development and competitiveness: The systematic literature review. Sustain. Dev. 2021, 29, 259–271. [Google Scholar] [CrossRef]
  18. El Archi, Y.; Benbba, B.; Nizamatdinova, Z.; Issakov, Y.; Vargáné, G.I.; Dávid, L.D. Systematic literature review analysing smart tourism destinations in context of sustainable development: Current applications and future directions. Sustainability 2023, 15, 5086. [Google Scholar] [CrossRef]
  19. Xu, C.; Li, X.; Wu, X. Evaluation of island tourism sustainable development in the context of smart tourism. J. Coast. Res. 2020, 103, 1098–1101. [Google Scholar] [CrossRef]
  20. Mousazadeh, H.; Ghorbani, A.; Azadi, H.; Almani, F.A.; Zangiabadi, A.; Zhu, K.; Dávid, L.D. Developing sustainable behaviors for underground heritage tourism management: The case of Persian Qanats, a UNESCO World Heritage property. Land 2023, 12, 808. [Google Scholar] [CrossRef]
  21. Wondirad, A.; Tolkach, D.; King, B. Stakeholder collaboration as a major factor for sustainable ecotourism development in developing countries. Tour. Manag. 2020, 78, 104024. [Google Scholar] [CrossRef]
  22. Wang, S.; Abbas, J.; Al-Sulati, K.I.; Shah, S.A.R. The impact of economic corridor and tourism on local community’s quality of life under One Belt One Road Context. Eval. Rev. 2023, 48, 312–345. [Google Scholar] [CrossRef] [PubMed]
  23. Zhang, P.; Zheng, T.; Huang, Y. Realize the transformation from economic function to comprehensive function and promote the high-quality development of tourism. Macroecon. Manag. 2022, 66–73. [Google Scholar] [CrossRef]
  24. Wang, X.; Zhang, H. Theoretical Issues on high-quality development of tourism economy in the new era. Tour. Trib. 2022, 37, 3–5. [Google Scholar]
  25. Zhu, K.; Zhou, Q.; Cheng, Y.; Zhang, Y.; Li, T.; Yan, X.; Alimov, A.; Farmanov, E.; Dávid, L.D. Regional sustainability: Pressures and responses of tourism economy and ecological environment in the Yangtze River basin, China. Front. Ecol. Evol. 2023, 11, 1148868. [Google Scholar] [CrossRef]
  26. Liu, Y.; Suk, S. Constructing an evaluation index system for China’s Low-Carbon tourism region—An example from the Daxinganling region. Sustainability 2021, 13, 12026. [Google Scholar] [CrossRef]
  27. Lin, V.S.; Yang, Y.; Li, G. Where can tourism-led growth and economy-driven tourism growth occur? J. Travel Res. 2019, 58, 760–773. [Google Scholar] [CrossRef]
  28. He, H.; Tuo, S.; Lei, K.; Gao, A. Assessing quality tourism development in China: An analysis based on the degree of mismatch and its influencing factors. Environ. Dev. Sustain. 2023, 26, 9525–9552. [Google Scholar] [CrossRef]
  29. Chen, B.; Zhu, Y.; He, X.; Zhou, C. Analysis of high-quality tourism destinations based on spatiotemporal big data—A case study of Urumqi. Land 2023, 12, 1425. [Google Scholar] [CrossRef]
  30. Liu, J.; Wang, Z.; Li, C. All-for-one tourism demonstration zones and high-quality development of tourism: Evidence from the quasi-natural experiment in China. Sustainability 2023, 15, 11626. [Google Scholar] [CrossRef]
  31. Dai, X.; Yang, M. Global tourism drives high-quality tourism development. Tour. Trib. 2022, 37, 6–8. [Google Scholar]
  32. Wei, L.; Zuqiang, J.; Jin, L. Coupling Effect and Driving Mechanisms in High-Quality Development of Rural Tourism and Rural Revitalization—Taking Hunan Province as a Case Study. J. Resour. Ecol. 2024, 15, 541–553. [Google Scholar] [CrossRef]
  33. Shen, W.; Huang, Z.; Yin, S.; Hsu, W.-L. Temporal and spatial coupling characteristics of tourism and urbanization with mechanism of high-quality development in the Yangtze River Delta urban agglomeration, China. Appl. Sci. 2022, 12, 3403. [Google Scholar] [CrossRef]
  34. Wang, Z.; Liu, Q.; Xu, J.; Fujiki, Y. Evolution characteristics of the spatial network structure of tourism efficiency in China: A province-level analysis. J. Destin. Mark. Manag. 2020, 18, 100509. [Google Scholar] [CrossRef]
  35. Liu, Y.; Tang, J. Measurement and spatio-temporal evolution of high-quality tourism development in China. Stat. Decis. 2022, 38, 91–96. [Google Scholar]
  36. Hjalager, A.M. A review of innovation research in tourism. Tour. Manag. 2010, 31, 1–12. [Google Scholar] [CrossRef]
  37. Griliches, Z. Patent statistics as economic indicators: A survey. In R&D and Productivity: The Econometric Evidence; University of Chicago Press: Chicago, IL, USA, 1998; Volume I, pp. 287–343. [Google Scholar]
  38. Wang, R.; Gao, L.; Zhu, Y.; Liu, Y.; Li, Y.; He, J. Urban–rural integration empowers high-quality development of tourism economy: Mechanism and empirical evidence. Sustainability 2023, 15, 15893. [Google Scholar] [CrossRef]
  39. Geng, S.; Wang, R. Evaluation and spatio-temporal evolution of coupling coordination level between tourism industry and high-quality economic development. Stat. Decis. 2019, 39, 120–125. [Google Scholar]
  40. Zhang, M.; Zhang, G.; Liu, H. Analysis of the impact of tourism development on the urban-rural income gap: Evidence from 248 prefecture-level cities in China. Asia Pac. J. Tour. Res. 2021, 26, 614–625. [Google Scholar] [CrossRef]
  41. Xu, T.; Wang, Z.; Zhang, B.; Yin, W.; Cheng, J.; Zhang, Y.; Huang, C.; Yuan, J. Spatiotemporal variation of air quality index in key cities of environmental protection in China. Chin. J. Public Health 2016, 32, 1027–1031. [Google Scholar]
  42. Jin, H.; Sun, G.; Zhang, X. Regional differences and convergence of high-quality tourism development in China. J. Zhejiang Univ. (Sci. Ed.) 2023, 50, 495–507. [Google Scholar]
  43. Shi, P.; Cao, Y.; Long, H.; Tian, Z.; Li, X.; Geng, B. Measurement, spatial differentiation and obstacle factor diagnosis of high-quality tourism development in China. Econ. Geogr. 2023, 43, 201–210. [Google Scholar]
  44. Li, Z.; Liu, H. How tourism industry agglomeration improves tourism economic efficiency? Tour. Econ. 2022, 28, 1724–1748. [Google Scholar] [CrossRef]
  45. Xue, M.; Wang, C.; Zhao, J.; Li, M. Spatial differentiation pattern and influencing factors of tourism economy in the Yellow River Basin. Econ. Geogr. 2020, 40, 19–27. [Google Scholar]
  46. Lv, Y.; Chen, J.; Qiu, K. Study on spatial disequilibrium and dynamic evolution of tourism development in China under the New Development Concept. J. Xinjiang Univ. (Philos. Soc. Sci.) 2021, 49, 1–9. [Google Scholar]
  47. Zhang, Z.; Hu, Z.; Zhong, F.; Cheng, Q.; Wu, M. Spatio-temporal evolution and influencing factors of high quality development in the Yunnan–Guizhou, region based on the perspective of a Beautiful China and SDGs. Land 2022, 11, 821. [Google Scholar] [CrossRef]
  48. Zhao, Q.; Wan, C.; Zhang, Q. The impact of comparative Advantage on inclusive sustainable development: A new structural economics perspective. South China J. Econ. 2023, 47–65. [Google Scholar] [CrossRef]
  49. Zhong, Y.; Li, Y. Analysis of regional differences and convergence characteristics of high-quality tourism development level. Stat. Decis. 2022, 38, 107–112. [Google Scholar]
  50. Lv, C.; Cui, Y. Study on regional disparity and spatiotemporal convergence of high-quality development in China. J. Quant. Technol. Econ. 2020, 37, 62–79. [Google Scholar]
  51. Zhu, H.; Sun, G.; Li, J. A spatial econometric study on the influencing factors of domestic tourism economic disparity in 31 provinces and cities in China. J. Arid Land Resour. Environ. 2019, 33, 197–202. [Google Scholar]
  52. Liu, Z.; Lu, C.; Mao, J.; Sun, D.; Li, H.; Lu, C. Spatial–temporal heterogeneity and the related influencing factors of tourism efficiency in China. Sustainability 2021, 13, 5825. [Google Scholar] [CrossRef]
  53. Zheng, Y.; Zhang, K. A study on the evaluation of green innovation efficiency and influencing factors of the Chinese tourism industry. Sustainability 2022, 14, 16458. [Google Scholar] [CrossRef]
  54. Wei, M.; Li, S.; Xu, J. Re-measurement of China’s inter-provincial tourism competitiveness in the context of high-quality development: Based on PROMETHEE method. Bus. Res. 2020, 35, 91–100. [Google Scholar]
Figure 1. TNDI and AAGR–TNDI in the integrated economic zone in China (2010–2019). (a,d) show the TNDI in 2010 and in 2019, respectively. Figure 1 (b,c) show the AAGR–TNDI of 2010–2015 and 2015–2019, respectively.
Sustainability 16 10758 g001
Figure 2. Spatial and temporal distribution of TNDI and AAGR–TNDI of each province. (a,d) show the TNDI in 2010 and in 2019, respectively. (b,c) show the AAGR–TNDI of 2010–2015 and 2015–2019, respectively.
Sustainability 16 10758 g002
Figure 3. Five development indices in 2019 and their average annual growth rate between 2015 and 2019. (a1e1) show the TIDI, THDI, TGDI, TODI and TSDI in 2019, respectively. (a2e2) show the AAGR–TIDI, AAGR–THDI, AAGR–TGDI, AAGR–TODI and AAGR–TSDI in 2015–2019, respectively.
Sustainability 16 10758 g003aSustainability 16 10758 g003b
Figure 4. The relationship between quality and quantity of China’s tourism development level. (a) shows the relationship between TNDI and Per Capita Tourism Income in different time periods (colored circles represent different provinces). (be) show the Q–Q relationship of tourism in different years.
Sustainability 16 10758 g004
Figure 5. LISA spatial cluster maps for 2010, 2015, 2019, and 2020. (ad) show the Local Moran’s I in 2010, 2015, 2019, and 2020.
Sustainability 16 10758 g005
Figure 6. Spatial distribution of standardized residual and regression coefficients of the GWR model.
Sustainability 16 10758 g006
Table 1. Evaluation index system of the new development level of China’s tourism industry based on the NDC.
System LayerW1/%Index LevelW2/%Sub LayerStatsW3/%W/%Reference
Innovative Development21.2A1. Innovation input54.7A11. Number of students enrolled in higher tourism education institutions.+25.42.9[13]
A12. General public budget expenditure on culture, tourism, sports, and media.+33.43.9
A13. R&D expenditure of cultural manufacturing enterprises above the designated size.+41.24.8[38]
A2. Innovation output45.3A21. Number of annual tourism patents published by the region.+504.8[11]
A22. Number of authorized patent applications for cultural and related industries.+504.8
Coordinated development10.2B1. Economic development68.1B11. Domestic tourism revenue/GDP.+27.21.9[13]
B12. Number of tourists received by scenic spots.+29.82.1[25]
B13. Per capita disposable income.+32.22.2[30]
B14. Travel e-commerce sales.+10.80.8[23]
B2. Urban–rural structure31.9B21. Urbanization rate of permanent resident population.+31.11.0[11]
B22. Ratio of per capita disposable income of urban and rural residents.-68.92.2[30]
Green development34.2C1. Ecological construction54.7C11. Forest coverage rate.+48.29.0[13]
C12. Per capita urban green park area.+51.89.7
C2. Environmental governance45.3C21. Harmless treatment rate of municipal solid waste.+29.64.6
C22. Number of days with air quality reaching or better than Grade II in the provincial capital accounting for the proportion of the whole year.+70.410.9[26]
Open development22D1. Domestic tourism46.8D11. Domestic tourism revenue.+30.13.1[13]
D12. Number of domestic tourists.+25.92.7[11]
D13. Passenger turnover.+15.61.6[28]
D14. Number of travel agencies.+8.20.8[25]
D15. Star hotel room rental rate.+20.22.1[26]
D2. International tourism53.2D21. Foreign exchange earnings from tourism.+67.27.9[12]
D22. Accommodation of inbound overnight visitors.+32.83.8
E. Shared development12.4E1. Infrastructure43.8E11. Number of mobile phone penetrations per 100 visitors.+27.11.5[35]
E12. Number of broadband Internet ports per 10,000 visitors.+33.21.8[12]
E13. Urban per capita road area.+31.41.7[26]
E14. Number of public transport vehicles per urban unit population.+8.30.5[30]
E2. Cultural welfare56.2E21. Circulation data of public libraries per 10,000 visitors.+322.2
E22. Actual use of the building area of mass cultural institutions per 10,000 visitors.+13.20.9
E23. Number of people participating in literary and artistic activities in the mass cultural service industry per 10,000 visitors.+22.81.6[35]
E24. Number of museum visitors per 10,000 visitors.+322.2
Note: “+” and “-” indicate “positive” and “negative”, respectively.
Table 2. The grade levels of TNDI and AAGR-TNDI.
TNDIGrade LevelAAGR–TNDI/%Grade Level
(70,80]Highest(7.21,10.60]Fastest
(60,70]Higher(5.32,7.20]Faster
(50,60]High(4.10,5.31]Fast
(40,50]Moderate(3.26,4.09]Medium
(30,40]Low(2.35,3.25]Slow
(20,30]Lower(0.94,2.34]Slower
(10,20]Lowest(−0.09,0.93]Slowest
Table 3. China’s TNDI and AAGR–TNDI from 2010 to 2019.
RegionProvinceTNDI
(2010)
TNDI
(2015) in 2015
TNDI
(2019) in 2019
TNDI
(2020)
TNDI
(2022)
AAGR–TNDI
(2010–2019)/%
AAGR–TNDI
(2010–2015)/%
AAGR–TNDI
(2015–2019)/%
Eastern regionBeijing33.56 37.52 46.84 39.99 40.14 3.77 2.26 5.70
Tianjin25.02 26.82 28.57 26.33 27.23 1.49 1.40 1.60
Hebei26.65 27.84 33.32 30.80 32.40 2.51 0.88 4.60
Shanghai30.10 33.04 40.59 34.94 35.53 3.38 1.88 5.28
Jiangsu37.37 42.41 48.88 45.30 50.94 3.03 2.56 3.61
Zhejiang41.26 48.20 54.98 51.33 53.68 3.24 3.16 3.35
Fujian35.77 43.20 50.02 44.98 45.74 3.79 3.85 3.73
Shandong34.67 35.88 42.56 38.90 42.95 2.31 0.69 4.36
Guangdong46.23 57.80 68.65 54.74 57.84 4.49 4.57 4.40
Hainan29.69 35.24 36.57 36.24 37.92 2.34 3.49 0.93
Central regionShanxi23.85 26.27 31.18 28.46 28.81 3.02 1.95 4.37
Anhui27.00 32.84 39.21 35.77 38.59 4.23 3.99 4.53
Jiangxi33.21 37.67 44.31 42.37 45.35 3.25 2.55 4.14
Henan25.82 25.94 33.65 31.72 31.55 2.98 0.09 6.72
Hubei25.80 30.73 37.22 36.40 39.38 4.16 3.56 4.91
Hunan30.19 34.05 41.46 39.70 41.55 3.59 2.43 5.04
Western regionInner Mongolia26.22 32.45 36.15 33.81 34.90 3.63 4.36 2.73
Guangxi31.21 37.24 45.36 41.44 41.71 4.24 3.60 5.05
Chongqing29.64 36.45 40.83 36.37 38.67 3.62 4.22 2.87
Sichuan28.80 34.04 43.73 39.48 39.92 4.75 3.40 6.47
Guizhou24.32 33.21 42.88 39.01 39.47 6.50 6.43 6.60
Yunnan29.49 35.02 43.06 37.97 40.87 4.30 3.49 5.31
Tibet17.30 23.78 26.93 28.19 31.78 5.04 6.57 3.16
Shaanxi27.12 33.60 37.54 32.44 31.08 3.68 4.38 2.81
Gansu12.84 21.25 30.69 29.15 29.32 10.17 10.60 9.62
Qinghai16.49 20.98 26.95 26.04 26.51 5.61 4.94 6.46
Ningxia26.02 26.20 34.61 32.09 34.24 3.22 0.14 7.20
Xinjiang17.23 21.06 29.25 26.36 29.42 6.05 4.09 8.56
Northeast regionLiaoning31.12 30.98 37.01 33.80 35.21 1.94 −0.09 4.55
Jilin24.82 28.75 34.38 32.49 34.60 3.69 2.98 4.58
Heilongjiang25.85 27.64 34.31 33.04 33.36 3.19 1.35 5.55
Eastern mean34.0338.7945.1040.3542.443.182.653.84
Central mean27.6531.2537.8435.7437.543.552.484.90
Western mean23.8929.6136.5033.5334.824.824.385.37
Northeast mean27.2629.1235.2333.4534.742.891.334.88
Mean28.2132.8439.4136.1237.763.783.084.66
Table 4. Five dimensions of development indicators.
Five DimensionsIndex
in
2010
Index
in
2013
Index
in
2015
Index
in
2019
Index
in
2020
Index
in
2022
Average Annual Growth Rate (2010–2019)/%Average Annual Growth Rate (2010–2015)/%Average Annual Growth Rate (2015–2019)/%
TIDI1.591.912.352.642.913.385.81 8.09 3.03
THDI2.172.803.214.223.693.867.68 8.18 7.06
TGDI19.1817.1019.5521.5522.5423.071.30 0.38 2.47
TODI3.373.874.216.012.752.596.65 4.60 9.28
TSDI1.902.893.524.984.224.8611.28 13.08 9.07
Table 5. The results of a two–dimensional matrix.
YearB-BB-WB-WW-W
2010Zhejiang, Jiangsu, Beijing, Liaoning, ShanghaiGuangdong, Shandong, Fujian, Jiangxi, Guangxi, Hunan, Chongqing, Hainan, Yunnan, Sichuan,TianjinShaanxi, Anhui, Hebei, Ningxia, Inner Mongolia, Hubei, Henan, Heilongjiang, Jilin, Guizhou, Shanxi, Xinjiang, Tibet, Qinghai, Gansu
2015Zhejiang, Jiangsu, Beijing, Shanghai, GuizhouGuangdong, Fujian, Shandong, Jiangxi, Guangxi, Chongqing, Hainan, Sichuan, Yunnan, Hunan, ShaanxiInner Mongolia, Liaoning, Jilin, Tianjin, Shanxi, TibetAnhui, Hubei, Hebei, Heilongjiang, Ningxia, Henan, Xinjiang, Qinghai, Gansu
2019Zhejiang, Jiangsu, Fujian, Beijing, Guangxi, Jiangxi, Guizhou, Yunnan, Shanghai, Chongqing,Guangdong, Shandong, Sichuan, HunanShaanxi, Inner Mongolia, Jilin, Shanxi, TianjinHubei, Liaoning, Hainan, Anhui, Henan, Heilongjiang, Hebei, Gansu, Xinjiang, Tibet, Qinghai
2020Zhejiang, Jiangsu, Fujian, Jiangxi, Guangxi, Beijing, Hunan, Guizhou, YunnanGuangdong, Sichuan, Shandong, Hubei, Chongqing, HainanShanghai, Inner Mongolia, Jilin, Tibet, Tianjin Shaanxi, Shanxi, Liaoning, Anhui, Ningxia, Henan, Heilongjiang, Hebei, Gansu, Xinjiang, Qinghai
Table 6. Global Moran’s I values in 2010, 2015, 2019, and 2020.
Year2010201520192020
Moran’s I0.46810.41590.37100.4485
P0.00000.00010.00030.0000
Z4.32373.94613.59154.1369
Table 7. The OLSs model parameter estimation and test results.
Model ParameterCoefficientTpVIF
Tourism innovation4.00602.2070.017 *2.116
Tourism policy5.7041.8950.0731.463
Economic development4.2771.3970.2521.240
Internationalization7.6804.1400.000 *1.823
Integration of culture and tourism3.7982.0700.0841.211
Intercept18.2912.8290.000 *
R2 0.731
Adjusted R2 0.677
Join F(P) 0.000 *
Koenker (BP) Test 0.030 *
Jarque–Bera Test 0.933
AICc 200.066
Note: * indicates p value less than 0.01.
Table 8. The GWR model parameters.
Model ParametersNumber
Neighbors13.418
Residual squares470.135
Effective number7.904
Sigma4.512
AICc191.693
R20.798
R2 Adjusted0.738
Disclaimer/Publisher’s Note: The statements, opinions and data contained in all publications are solely those of the individual author(s) and contributor(s) and not of MDPI and/or the editor(s). MDPI and/or the editor(s) disclaim responsibility for any injury to people or property resulting from any ideas, methods, instructions or products referred to in the content.

