1. Introduction
Environmental sustainable development (SD) has become the world’s primary focus in recent years due to carbon neutrality targets [
1]. The various activities of humans have caused a tradeoff between ECDV and SD [
2]. Several studies have utilized EFPR as a dependable indicator of EQ [
3,
4]. Humans use the EFPR as a comprehensive measure to compare their resource use and waste assembly with the Earth’s capacity to regenerate resources and absorb trash. Studies by [
5,
6] have discussed this concept. The rapid expansion of industry, ECDV, and GLZN has led to a substantial decrease in the ecological reserve and a large increase in the global EFPR [
7]. The primary and swiftly expanding element of the EFPR is the carbon footprint (CF), which quantifies the GHG emissions resulting from the use of fossil fuels [
8].
People commonly refer to the increase in carbon content in the environment as ecological debt. Currently, the CF accounts for approximately 60% of the planet’s total EFPR (GFN, 2019).
Figure 1 displays the ecological footprints of the G10 countries from 2000 to 2021, highlighting significant changes. Among these countries, the United States regularly has one of the greatest EFPRs, along with Canada and Belgium. On the other hand, Sweden, Switzerland, and the Netherlands tend to have lower EFPR. Over time, there has been a noticeable trend of EFPR increasing in most countries, particularly in Canada, the USA, and Belgium, where there is a steady upward trajectory. Nevertheless, there are sporadic declines reported in nations such as France, Italy, and Germany, although these occur within a general trend of growth. Notably, certain countries, such as Switzerland, Sweden, and the Netherlands, exhibit a consistent level of stability in their EFPR, with minimal fluctuations within a restricted range. This highlights the immediate necessity for coordinated endeavors to tackle the increasing ecological impact on a global scale and advocate for sustainable practices to guarantee the long-term well-being of our planet. The G10 countries consist of eleven industrialized nations that have similar economic goals. The main goal of the G10 is to synchronize monetary and fiscal policy to promote global ECDV.
At present, scholars are mostly concerned with the increasing EFPR. In order to develop more effective remedies, they are investigating the relationship between many economic factors and EFPR. This study aims to assess the influence of NRRS, ECDV, DGTZ, GLZN, and TCIN on EFPR in G-10 nations. To achieve this goal, the study includes yearly data on variables for the G-10 spanning from 2000 to 2021. Furthermore, in the context of the G10 countries, the green economy represents a strategic shift towards sustainable development that balances economic growth with environmental stewardship. These nations, known for their strong economies, are increasingly recognizing the importance of integrating green policies to address climate change and resource depletion. The G10’s focus on green economy includes investments in renewable energy, energy-efficient technologies, and low-carbon infrastructure, aiming to reduce carbon footprints while sustaining economic competitiveness. Furthermore, technological innovation is at the core of the G10’s green initiatives, driving advancements in clean energy, sustainable agriculture, and eco-friendly industrial practices. By embracing green finance and implementing stringent environmental regulations, the G10 countries aim to lead the global transition towards sustainability, setting a benchmark for other economies to follow. This shift not only enhances environmental quality but also creates opportunities for green jobs, technological leadership, and long-term economic resilience.
Moreover, the NRRS plays an important role in the global economy, particularly in economies in the G10 countries that heavily rely on extracting these resources for a substantial part of their ECDV [
9]. The NRRS primarily consists of key elements such as timber, natural gas, oil, minerals, and coal. However, they are not limited to these; the NRRS also includes other essential resources like freshwater, rare earth metals, agricultural land, and biodiversity, which contribute significantly to economic and environmental sustainability. Nevertheless, the relationship between NRRS and environmental degradation (EDG) is complex and supported by conflicting research. Refs. [
10,
11] have provided evidence that NRRS has a positive impact on EQ. However, Refs. [
12,
13] have found a negative relationship between NRRS and EQ. Undoubtedly, the literature exploring the relationship between NRRS and a comprehensive environmental measure such as EFPR highlights the need for more investigations in order to progress towards a sustainable environment. Economic income level directly correlates with the degree of NRRS. During the initial phase, individuals expend a greater amount of energy, such as non-renewable resources, for the purpose of development. This leads to increased economic growth while disregarding the impact on the environment. However, as the standard of living improves in later stages, people begin to adopt a more environmentally friendly approach. They prioritize NRRS protection and show a greater interest in energy-efficient products. This phenomenon is known as the Environmental Kuznets Curve (EKC). According to Grossman and Krueger, 1991, EKC suggests a quadratic relationship shown as an inverted U shape. This shows the relationship between ECDV and EDG. It implies that as the income level increases, the EDG initially worsens but eventually improves because of the maturity of economies and priorities set for environmental quality. Hence, the studies testify that NRRS has the potential to greatly improve environmental conditions and stimulate ECDV [
14].
GLZN, which reduces obstacles to the flow of goods, technology, and human capital, is a critical aspect of ECDV and EQ [
15]. The literature suggests that the GLZN process can contribute to ECDV by establishing connections between economies through foreign direct investment trade, improving NRRS efficiency, transferring technology, and exchanging people and physical capital. Ref. [
16] supports this view. Researchers conducted thorough investigations into the impact of GLZN on EQ. However, they were unable to reach a unanimous agreement on the precise importance of these variables in determining EQ. For instance, Ref. [
17] examined the influence of GLZN on EQ and found that GLZN had a beneficial impact on EQ. The literature has an ongoing and unresolved discussion over the adverse influence of GLZN on EDG, as reported by [
18].
Moreover, we chose the G10 countries for analysis due to their shared interest in ECDV. The G10 countries have experienced significant ECDV. According to the World Bank, these countries have demonstrated robust economic stability and contribute a significant portion to the global ECDV. Furthermore, the exponential expansion of the economy leads to increased consumption of NRRS and decreased generation of renewable energy (RE), resulting in a decline in climate quality. Consequently, the G10 nations have increased their financial commitments to renewable energy projects and environmental technologies in the past two decades. In addition, the nations that are members of the group collectively account for almost 48% of the world’s total ECDV, with the United States making the biggest impact at 24.08% [
19]. In addition, these countries have implemented more effective ECDV strategies to promote SD in response to monetary and economic concerns. According to the GFN’s 2020 report, out of the 11 nations in the G10, only Canada and Sweden have ecological reserves where their biocapacity exceeds their EFPR. On the other hand, the remaining nine countries are considered ecologically poor because their EFPR exceeds their biocapacity. Consequently, this group must prioritize efforts to decrease its ecological impact.
Therefore, the present study makes several valuable contributions to the existing body of literature. First and foremost, this study aims to examine the following inquiries:
- (1)
How does DGTZ influence the environmental quality in G10 countries?
- (2)
Does NRRS inherently have a negative impact on the environmental quality of G10 countries?
- (3)
What is the role of TCIN in promoting environmental quality in G10 countries?
- (4)
What is the impact of GLZN on the environmental quality of G10 countries?
- (5)
How do advanced economies in the G10 align economic development with green economy initiatives to enhance environmental quality?
Furthermore, this work utilizes robust 2nd-generation methodologies for empirical analysis. These approaches consist of the CIPS unit root test, the Westerlund test, and PMG-ARDL. These tests can effectively address panel data issues. Furthermore, this research enhances the existing body of knowledge on EFPR by making both empirical and theoretical contributions, namely by incorporating the aspect of GLZN. There is currently no published research that examines this connection specifically for G10 countries. This study will continue by conducting a literature review, outlining the methodology, presenting the results and discussion, and concluding with policy implications.
3. Material and Methods
The objective of this study is to examine the correlation between the dependent variable EFPR and the independent variables GLZN, DGTZ, TCIN, NRRS, and ECDV. The carbon footprint (CF), the primary and rapidly expanding component of the Ecological Footprint (EFPR), quantifies greenhouse gas (GHG) emissions from fossil fuel consumption. It can be measured in two ways: in kilograms of CO2-equivalent or per unit of activity annually, such as per capita or per mile. Using kilograms of CO2 equivalent provides a standardized measure of total emissions, which simplifies comparisons and enhances clarity when assessing the overall environmental impact across different studies and sectors. In contrast, measuring emissions per unit of activity—like per capita or per mile—allows for a more precise evaluation of emissions efficiency across diverse sectors, activities, or populations, facilitating a better understanding of relative environmental performance. Therefore, we choose kilograms of CO2-equivalent when focusing on total emissions while opting for per unit of activity when comparing efficiency.
Prior studies have examined various connections, such as the linkages between ENC, ECDV, and carbon emissions [
63,
64], as well as the relationships between ENC, carbon emissions, and urbanization [
65]. A comparison between ENC and GLZN can be valuable, particularly in examining their combined impact on EFPR or ECDV. However, the significance of this comparison relies on clearly defined system boundaries, including geographic, temporal, and sectoral limits. Our study integrates GLZN along with other key variables to assess their impact on EFPR within the G10 context. Additionally, the interplay among carbon emissions, ECDV, urbanization, and ENC has been investigated [
66]. In addition, the study was carried out by [
67] to examine the relationship between SD and ECDV. Moreover, GLZN can have dual effects, as it promotes economic integration and trade, which may lead to both increased environmental strain due to higher production demands and the spread of sustainable practices across borders. Whereas DGTZ, through advanced data analytics and efficient energy use, offers the potential to reduce environmental impacts, it may also result in higher energy consumption and e-waste generation, complicating its role in sustainability. However, TCIN stands as a critical factor in G10 economies, where the development and implementation of green technologies could significantly curb ecological footprints by advancing resource-efficient solutions. While NRRS is valuable for ECDV, they tend to increase ecological strain due to resource extraction and consumption, but with sustainable management, they could support a circular economy. ECDV in G10 countries often correlates with a higher EFPR, as increased wealth typically drives consumption and production, yet this growth also enables investments in sustainable technologies and environmental policies. Studying these factors in G10 countries is crucial because their economic actions and environmental policies significantly influence global sustainability. As leaders in trade, innovation, and resource use, G10 can either drive or hinder global ecological progress. Examining how GLZN, DGTZ, TCIN, NRRS, and ECDV impact the EFPR in these nations provides valuable insights into how advanced economies can lead the way in balancing growth with environmental responsibility.
This study provides an inaugural analysis of the impact of GLZN, DGTZ, TCIN, NRRS, and ECDV on EFPR in a panel data model encompassing G10 nations from 2000 to 2021. The data is analyzed using the PMG-ARDL estimate method. The PMG-ARDL approach was chosen for its ability to do panel data analysis that includes both common long-term relationships and individual-specific short-term dynamics. PMG-ARDL was selected after confirming cross-sectional dependence, smoothness, and co-integration among the variables by suitable tests. The PMG-ARDL is the most suitable option for this research since it effectively captures both the similarities and disparities among the entities within the G10 economies. CS-ARDL distinguishes itself from alternative methodologies by positing long-term correlations unique to each individual, potentially overlooking common traits. The PMG-ARDL’s ability to aggregate information from several entities while accounting for disparities in short-term dynamics renders it advantageous for evaluating panel data. Furthermore, PMG-ARDL is resilient with variables of various integration orders, accommodating both I(0) and I(1) variables, which is beneficial when the model’s variables are integrated at varying levels. Furthermore, we utilized the Hausman test to ascertain whether to employ the MG or PMG approach. The Hausman test results validate the suitability of the Panel Mean Group (PMG) model for the analysis of the dataset under examination. The model and equations being discussed are as follows:
The logarithmic transformation of variables has been employed to ensure a consistent level of variability in the time series.
The PMG-ARDL methodology is designed to mitigate the bias resulting from the correlation between the main variable and the mean-differenced independent variables. The presence of this bias presents a difficulty for the ARDL estimation approach when trying to evaluate bias in panel dataset models that include individual effects. The proposed methodology by [
68] integrates the ARDL model with the PMG estimator, as introduced by [
69]. The equation for PMG-ARDL is provided in this document.
In the above model, the coefficient of the dependent variable is represented by ∅. The short-run coefficients are
,
,
,
,
and
while the long-run coefficients are denoted by
β1 to
β6. Prior to applying the PMG-ARDL approach to examine the relationship between the study variables, the study employs the CSD test to verify the presence of cross-sectional dependency. The CSD test holds significant importance in panel data analysis, particularly for interconnected countries such as the G10, due to their interconnected economic activities and policies. Studying globalized economies like the G10 further enhances the significance of this test. This is because the interconnections in trade, technologies, and finance can create dependencies. Furthermore, understanding CSD also helps policymakers recognize the broader regional or global impacts of their actions. Therefore, disregarding CSD can lead to biased and inconsistent results. Therefore, the CSD test enhances both the reliability of results and the accuracy of the model studied. Additionally, the study utilizes the slope test to assess the uniformity of parameters. The CIPS unit root test and the [
70] method were used to assess the stationarity of variables and their co-integration. The CIPS test is explicitly formulated to address CSD, which is prevalent in global studies such as those concerning the G10. Disregarding CSD in unit root testing may result in erroneous interpretations of variable dynamics. The CIPS test guarantees that stationarity is accurately evaluated across all nations in the panel. Whereas the Westerlund test is essential for ascertaining the existence of a long-term equilibrium relationship between variables. The Westerlund test, in contrast to conventional cointegration tests, is specifically formulated to accommodate panel data exhibiting CSD, a crucial aspect in global analyses where nations are interrelated. It yields more robust results when examining cointegration between variables such as EFPR and ECDV in nations with interconnected markets and economies. Here are the equations for the tests described earlier.
Equations (5) and (6) are utilized to depict the slope homogeneity test, which aids in ascertaining whether the panel data exhibits heterogeneity or homogeneity.
Hausman’s specification test is used to compare the estimators of random and fixed effects. We conducted this test to determine whether to employ MG or PMG for subsequent analysis. The equation for the Hausman test is as follows:
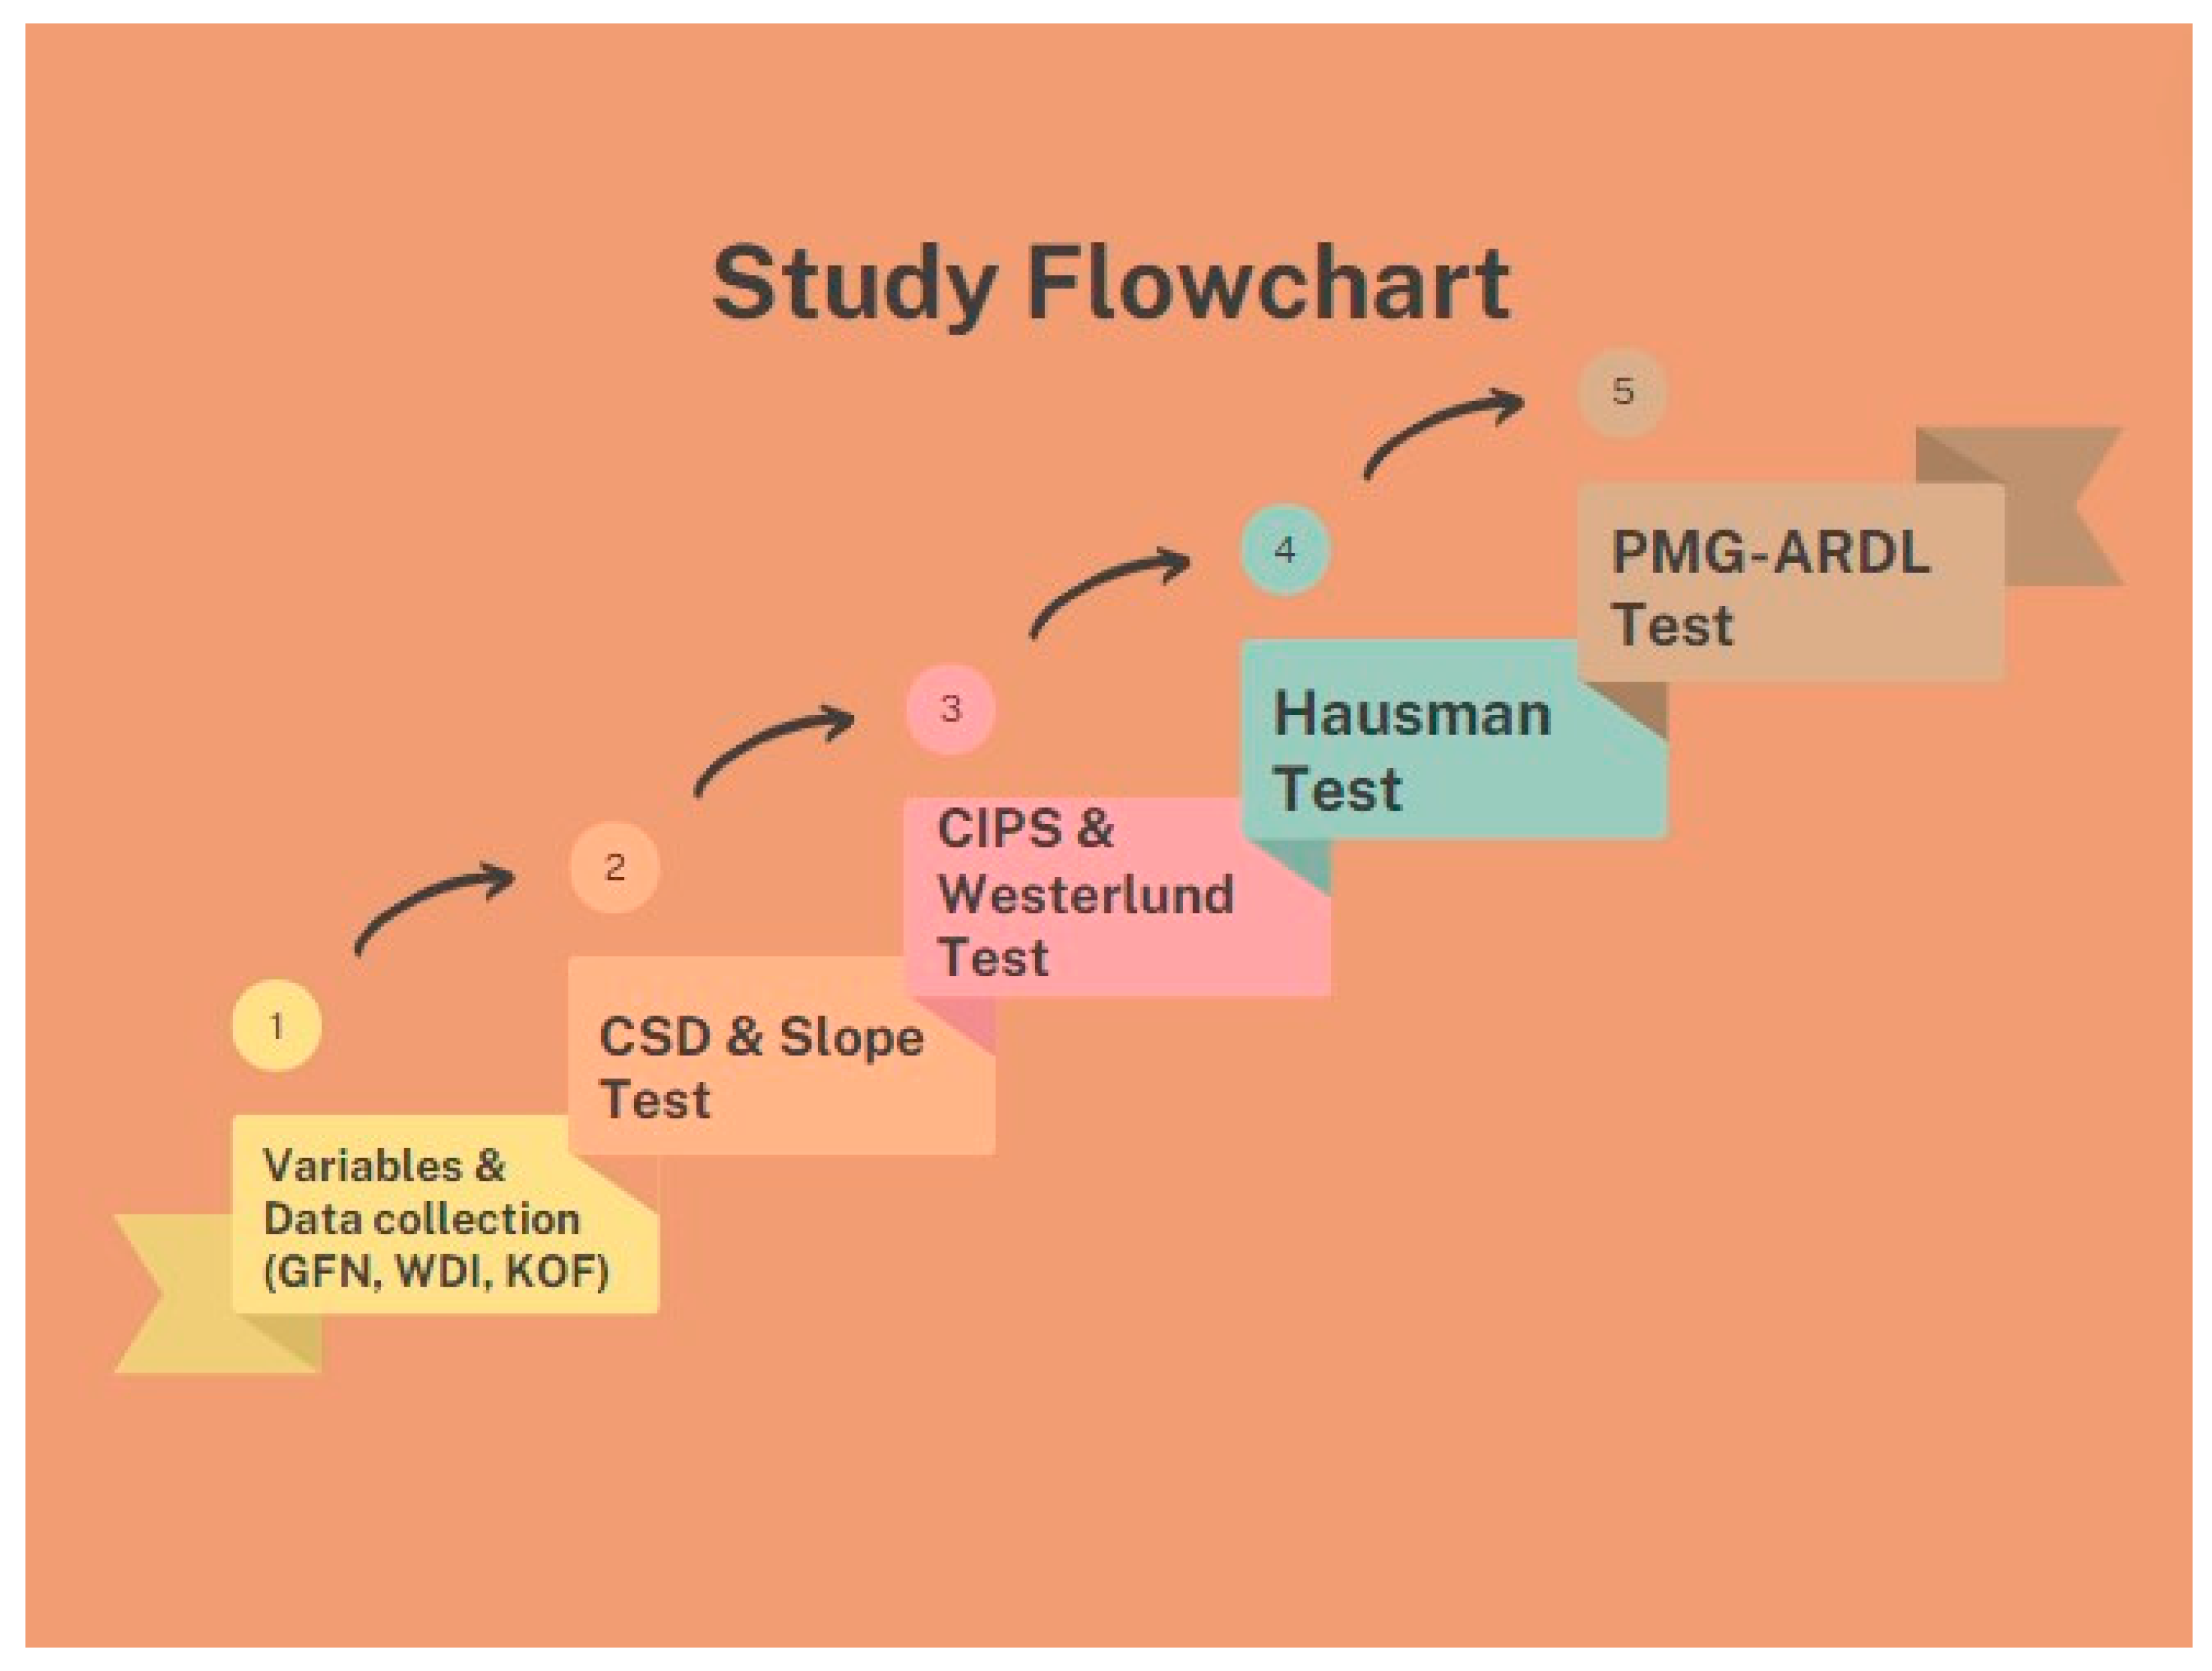
The study’s flowchart is depicted in
Figure 2, illustrating the parameters and empirical tests employed to examine the relationship between the variables being investigated.
The list of study variables, their abbreviations, and sources are shown in
Table 1.
4. Results and Discussions
This section presents the outcomes of data analysis using various econometric methods. We arranged the steps in chronological order. The tests included in this analysis are the CSD test, slope test, unit root test, co-integration test, Hausman test, and PMG-ARDL test.
Table 2 provides a comprehensive overview of the descriptive statistics for each variable, including measures of central tendency, dispersion, and distribution characteristics. These statistics offer insights into the distribution and variability of the variables in the dataset. Beginning with EFPR, it is evident that the mean stands at 6.217213, with a median of 5.815026, indicating a relatively moderate distribution. On the other hand, the skewness value of 0.733954 suggests a slight rightward skew, while the kurtosis of 2.807674 indicates a moderately peaked distribution. Moving to ECDV, the statistics reflect considerable variability, with a mean of 44,880.18 and a wide range from a minimum of 29,375.04 to a maximum of 88,520.32. The skewness value of 1.769301 indicates a significant positive skew, implying an asymmetric distribution toward higher ECDV values. Meanwhile, DGTZ displays a mean of 27.17317 with a relatively low standard deviation of 13.31155, suggesting a moderate level of dispersion around the mean. GLZN is characterized by a mean value of 84.66435, indicating a relatively high level of GLZN across the dataset. However, the negative skewness (−1.271311) suggests a leftward skew, indicating a concentration of higher GLZN scores. NRRS exhibits notable variability, with a mean of 0.552351 and a wide range from a minimum of 0.008028 to a maximum of 5.564819. A high kurtosis of 13.83268 indicates a heavily tailed distribution with potentially significant outliers. Lastly, TCIN demonstrates substantial variability, with a mean value of 93,940.98 and an extensive range from 480.0000 to 621,453.0. The skewness of 1.883994 suggests a notable positive skew, indicating an asymmetrical distribution with a tail towards higher TCIN values. These descriptive statistics provide valuable insights into the distributional characteristics and variability of the variables under examination, helping to understand their respective impacts and relationships within the dataset.
The world has undergone a process of GLZN, resulting in increased interconnectedness and interdependence among nations [
71]. The swift rise of industrialization has led to TCIN, which has increased the level of dependency across countries [
72]. Hence, the study can effectively communicate the impacts of any favorable or unfavorable shocks to other countries. Therefore, accurately identifying the CSD issue in panel data is the essential and vital initial step to prevent obtaining misleading results in subsequent estimations of the group of G10 countries. The panel data analysis commences by using the [
73] test to assess the existence of CSD. Similar socio-economic policies could explain this CSD, with fluctuations in one country’s data influencing those in other nations. Consequently, the CSD test assists the study in selecting the appropriate unit root test and regressions. According to
Table 3, the results of the CSD test indicate that the probability values are statistically significant at a significance level of 1%. Therefore, we reject the null hypothesis that there is no CSD. This indicates that a volatile shock in one country will have an impact on other countries within the G10 zone. Therefore, we have verified the presence of CSD in the chosen panel data, which requires the use of a unit root test and a co-integration estimator from the 2nd generation [
71].
After examining the CSD, the next step involves assessing the homogeneity of the slope within the panel dataset.
Table 4 displays the results of the slope test. The results show a significant level of 1%, which rejects the null hypothesis about the slope’s homogeneity. This analysis focused on utilizing the second-generation unit root tests CADF and CIPS to determine the integration order of the variables after confirming the presence of slope heterogeneity and CSD in the data.
The estimation results of
Table 3 and
Table 4 were utilized to apply the CIPS second-generation unit root test to assess the stationarity of the variables. The results from
Table 5 indicate that not all the variables except EFPR and DGTZ exhibit stationarity at level. Consequently, we cannot reject the null hypothesis. Nevertheless, all the variables exhibit stationarity at level I(1), leading to the rejection of the null hypothesis at a significant level of 1%. The findings demonstrate the stationarity of all study variables, thereby justifying the assessment of long-term co-integration among them.
After confirming stationarity using the CIPS unit root test, the next step involves examining co-integration among the data of the G10 nations. Thus, the Westerlund test is utilized. This test produces efficient results by integrating CSD into the data. The Westerlund test results are shown in
Table 6. They show that the panel data of EFPR, GLZN, DGTZ, TCIN, NRRS, and ECDV are strongly co-integrated. This is evident from the significant Gt and Pt values at the 1% level.
We conduct a Hausman test to assess the ARDL model before estimating it using the PMG method. The Hausman panel data analysis of the Hausman test is very important for choosing the right estimation method, like PMG, mean group (MG), or dynamic fixed effects (DFE) models. Panel data analysis frequently employs these models, integrating time-series and cross-sectional elements. Panel estimation involves three tests: MG, PMG, and DFE. The Hausman test is a valuable tool for determining the most suitable panel estimation method among the three options.
Table 7 presents the results of the Hausman test, which evaluates the suitability of the PMG test relative to the MG and DFE tests. Therefore, we chose the PMG-ARDL method to examine the short-run and long-run relationships among the study variables.
To evaluate the strength of the relationship between EFPR, GLZN, DGTZ, TCIN, NRRS, and ECDV for G10 countries, the following stage involves analyzing the long-run and short-run coefficient values. In order to achieve this objective, we employed the PMG-ARDL approach, as recommended by the Hausman test. This test is effective in delivering the coefficient values because it compensates for the panel data’s collinearity issues.
Table 8 presents the results of the PMG-ARDL model. The results clearly indicate that DGTZ and TCIN have a negative correlation with EFPR, while ECDV, NRRS, and GLZN have a positive correlation with EFPR, both in the long term and the short term. The emergence of DGTZ has expedited technical advancement while inhibiting the utilization of outdated, manual manufacturing techniques.
Table 8 demonstrates a strong and enduring negative correlation between DGTZ and EFPR. It shows that a 1% decrease in DGTZ corresponds to a 1.538% increase in EFPR. This implies that DGTZ contributes to the mitigation of environmental consequences through a variety of means. For instance, DGTZ increases the number of online commercial transactions and improves accessibility, intelligent GPS, and environmental friendliness. Industrial process retooling enhances energy efficiency and decreases ENC intensity. The significant negative relationship between DGTZ and EFPR supports our hypothesis H1, indicating that DGTZ plays a crucial role in enhancing the environmental quality of G10 countries. Additionally, the findings of our study are consistent with those reported in [
20,
74]. They concur that DGTZ exhibits a negative correlation with EFPR. Ref. [
28] supports these findings, asserting that advancements in DGTZ contribute to ecological governance, hence aiding in the reduction of pollutants. However, the findings of [
75] are not consistent with this one.
There is a strong and positive correlation between the NRRS and the EFPR in G10 countries. Therefore, a 1% rise in NRRS in G10 economies results in an increase of approximately 0.0177% in EFPR. The G10 economies are putting pressure on NRRS reserves to meet energy demand, thereby increasing the environmental burden. Based on these statistics, it is evident that investing in clean energy is crucial for reducing the EFPR. These conclusions are corroborated by [
76] with polar states and [
77] regarding E7. In addition, Ref. [
78] argued that the abundance of NRRS in the country provides greater opportunities and financial incentives to transition manufacturing to a less emission-intensive energy source. The results of our study support hypothesis H2, demonstrating that NRRS has a negative impact on the environmental quality of G10 countries. This negative relationship may stem from factors such as resource over-exploitation, inefficient extraction methods, and a strong dependence on fossil fuel-based resources. These practices tend to increase pollution, deforestation, and habitat loss, thereby degrading environmental quality despite the economic advantages of resource extraction.
TCIN exhibits a strong negative correlation with the EFPR in the G10 nations. TCIN’s preference for EQ in G10 nations is evident, as an increase in TCIN leads to a decrease in EFPR. The findings demonstrate that a 1% rise in the TCIN will lead to a fall in the EFPR of 0.0048% at a 1% level of significance in G10 countries. The negative relationship can be explained by the fact that TCIN enhances environmental quality by driving the development of cleaner, more efficient technologies and sustainable practices. This includes advancements in renewable energy, which lower dependence on fossil fuels and reduce greenhouse gas emissions. Our study’s findings also support hypothesis H3, confirming that TCIN positively influences the adoption of renewable energy sources in G10 countries, thereby contributing to improved environmental quality. Previous research by [
30,
79] in China and [
80] in Brazil aligns with the inverse correlation between TCIN and EFPR. However, it contradicts the findings of [
81] in Pakistan.
The GLZN has a positive effect on the EFPR in G10 countries, with a coefficient value of 0.04349. It means a 1% increase in GLZN will result in a 0.04349% increase in the EFPR in G10 countries. Consequently, we may assert that the increase in GLZN in the G10 countries is detrimental to the EQ in these nations. Therefore, authorities should promote foreign direct investment to incentivize investors to introduce environmentally sustainable technology and enterprises that do not contribute to pollution. The study’s outcome aligns with hypothesis H4, indicating that GLZN negatively impacts the environmental quality of G10 countries by increasing EFPR. These findings align with the results reported by [
52,
82]. The findings are also consistent with those of [
45] for Turkey and [
48] for the USA. However, they do not align with the study results of [
51] for 130 nations and [
52] for Japan.
Furthermore, the long-term correlations between the ECDV and the EFPR are significant and positive. The activities linked to ECDV are a significant factor in EDG [
83]. The long-term association between ECDV and EFPR is highly positive, with a correlation coefficient of 2.267. This indicates that a 1% rise in ECDV will result in a corresponding increase in EFPR of 2.267%. The increased availability and utilization of energy resources contribute to the substantial expansion in ECDV, subsequently leading to a rise in EFPR in G10. Multiple studies, such as [
84,
85,
86], provide evidence that the coefficient value is positive. The results reveal significant and positive long-term correlations between ECDV and EFPR, indicating that ECDV has not been effectively integrated with green economy policies and initiatives in G10 countries. This finding challenges hypothesis H5, as the expected positive impact on environmental quality has not materialized. Instead, the results underscore the importance of better aligning economic development with green policies to ensure that ECDV plays a constructive role in enhancing environmental sustainability.
The error correction term (ECT) measures the rate at which a system rectifies itself from a transient imbalance to a steady, long-term equilibrium. Recent research predicts a markedly negative value for the ECT parameter. The PMG estimate indicates a negative value for the ECT, demonstrating statistical significance at the 1% level. The ECT coefficient, which measures the speed at which the PMG estimate approaches equilibrium, has a value of −0.737355. This indicates that the transition of variables from a transient imbalance to a permanent equilibrium is a notable process, with an annual adjustment rate of 0.74% for the G10 countries. The short-run results of PMG-ARDL show similar relationships as shown in the long run. In the short run, DGTZ and TCIN have a negative association with EFPR, causing a reduction in EFPR and improving the EQ in G10 countries. Whereas ECDV, GLZN, and NRRS have shown a positive association with EFPR, causing an increase in EFPR and hence deteriorating the EQ. The graphical abstract of the study is shown in
Figure 3.
Finally,
Table 9 presents the results of the Dumitrescu Hurlin causality test, which examined the causal relationships between the study variables. The test results reveal complex and varied relationships between EFPR and key economic and technological factors in G10 countries. The results indicate that NRRS has a unidirectional influence on EFPR, implying that resource extraction directly influences EQ. However, the opposite effect is not significant, suggesting that environmental conditions currently do not influence decisions about resource exploitation. Conversely, GLZN and EFPR share a bilateral relationship, highlighting how global economic integration drives ecological impacts and, simultaneously, how environmental factors can influence global policies and trade dynamics. Digital advancements improve environmental management in DGTZ’s unidirectional relationship with EFPR, but environmental pressures do not significantly drive digital adoption. ECDV and TCIN both have bidirectional influences with EFPR, emphasizing a feedback loop: economic growth and technological progress can increase environmental strain, but heightened ecological concerns can also spur more sustainable economic practices and innovative solutions. These findings underscore the interconnectedness of economic and technological progress with environmental sustainability, indicating areas where policy interventions and sustainable practices can make a difference.
5. Conclusions and Policy Implications
The growing magnitude of the ecological footprint is a concerning predicament for the global community. Multiple studies have identified the variables that contribute to EDG escalation. This study aims to assess the combined influence of NRRS, GLZN, TCIN, DGTZ, and ECDV on the EFPR of the G10 countries from 2000 to 2021. For analysis purposes, we used EViews-13 and Stata software-18. The CSD test, developed by [
87], has validated the presence of the CSD issue in the study’s data. [
88] developed the CIPS unit root test to investigate the presence of a unit root. After taking the first difference, we determined that the data for all variables were stationary. This finding prompted the use of the Westerlund (2007) panel co-integration test, which confirmed the existence of co-integration between EFPR, GLZN, DGTZ, TCIN, NRRS, and ECDV. We also used the Hausman test to determine which regression analysis method to use: MG, DFE, or PMG. The Hausman test results indicate that the G10 data set in our study favors the PMG method. We finally used the PMG-ARDL method to examine the long-term and short-term associations between the EFPR, GLZN, DGTZ, TCIN, NRRS, and ECDV. The PMG-ARDL results indicate that DGTZ and TCIN improve the EQ, as both are causing a reduction in EFPR in the long term as well as in the short term in G10 countries. On the other hand, the ECDV, GLZN, and NRRS demonstrate a positive influence on EFPR, suggesting that they all contribute to a decrease in EQ over both the long and short term in G10 countries. More specifically, a 1% increase in DGTZ will cause a reduction in EFPR at a rate of 1.5389% in the long term and 0.1460% in the short term. Similarly, a 1% increase in TCIN will reduce the EFPR at a rate of 0.00488% in the long run and 0.1168% in the short run. On the other hand, a 1% increase in ECDV, GLZN, and NRRS will increase the EFPR at rates of 2.2672%, 0.04349%, and 0.017772%, respectively, in the long run. A 1% increase in ECDV, GLZN, and NRRS will increase the EFPR to 0.46967%, 0.43523%, and 0.21268%, respectively, in the short run.
Opportunities and difficulties for sustainable growth are shown by the connections between environmental quality and economic factors in the G10 context. TCIN and DGTZ have demonstrated a negative relationship with EFPR, indicating that they have the potential to enhance environmental quality through waste reduction, process simplification, and the promotion of environmentally friendly solutions. However, there is a positive correlation between EFPR and GLZN, ECDV, and NRRS. This suggests that these processes may exacerbate EDG if they are not well managed. This dynamic emphasizes the necessity for policies that balance reducing the ecological effects of GLZN, NRRS, and ECDV with maximizing the environmental benefits of digital and technical advancements. The study outcomes align with hypotheses H1, H2, H3, and H4, while the expected results for hypothesis H5 were not obtained. This discrepancy suggests that G10 countries need to further strengthen their environmental policies to simultaneously improve economic conditions and enhance environmental quality. A more integrated approach that aligns economic growth with sustainable practices is essential for achieving the desired outcomes. Based on the study results, the following are the recommendations for G10 countries.
As DGTZ and TCIN improve the EQ of G10 countries, these countries should increase investments in digital infrastructure to support eco-friendly technologies and data-driven environmental solutions.
They should encourage the use of digital tools in industries to reduce waste and optimize resource use, thus minimizing EFPR.
In support of TCIN, the G10 countries should provide incentives for green technology research and development to foster innovations that reduce environmental impact.
Moreover, they should implement subsidies and grants for industries adopting low-emission technologies to accelerate green innovation.
On the other hand, GLZN, NRRS, and ECDV are causing deterioration to the EQ of G10 countries therefore, they should establish policies that ensure sustainable trade practices, encouraging imports and exports of environmentally friendly goods.
To regulate the GLZN, the G10 countries should implement green tariffs or regulations that discourage the import of high-emission goods, thus reducing cross-border ecological footprints.
Furthermore, there is a need to promote the sustainable use of NRRS, and hence, they should develop stringent policies for NRRS that include limits on depletion rates and require eco-friendly practices.
Moreover, they could promote sustainable resource management through economic incentives for conservation, renewable resource use, and restoration projects.
As ECDV plays a crucial role in the growth of any economy, G10 countries must advance their green economy initiatives to align with sustainability goals. This can be achieved by promoting green growth strategies, incorporating sustainability into economic policies, and supporting industries that prioritize low environmental impact. The results highlight the need for G10 countries to strengthen the integration of environmental policies with economic development, ensuring that ECDV not only drives growth but also contributes positively to environmental quality.
Furthermore, steps can be taken to promote a green economy by introducing tax breaks or financial benefits for businesses that follow sustainable practices, helping align economic progress with environmental preservation goals.
These recommendations aim to support a balanced approach in the G10 countries by leveraging DGTZ and TCIN advancements to drive sustainability while carefully managing GLZN, NRRS, and ECDV. The goal is to minimize EDG and actively promote green economic development, aligning ECDV with ecological responsibility for a sustainable future.
This work contributes to the current knowledge by illustrating the relationship between GLZN, DGTZ, TCIN, NRRS, and ECDV with EFPR in G10, using data from 2000 to 2021. It additionally offers significant insights to the scientific community and assists politicians in making prompt judgments. Nonetheless, it is crucial to acknowledge that the study possesses limitations regarding its selection of specific variables, temporal scope, and methodological approach. One of the limitations of our study is the difficulty in correlating broad concepts like EFPR, GLZN, and TCIN, given their diverse interpretations and measurement challenges. While several studies have explored these relationships, caution is needed due to the complexities involved. Future research should aim to refine these definitions and develop more precise indicators to better capture their specific environmental impacts. Future studies may investigate the correlation between EFPR and factors including economic complexity, trade openness, financial development, and human capital. Researchers may employ diverse methodologies, including CS-ARDL, MMQR, and quantile-on-quantile procedures, to analyze correlations among the study variables and investigate distinct groups of countries such as OBOR and the G20. The CS-ARDL technique identifies both short-term and long-term relationships while accounting for cross-sectional dependence. The MMQR analyzes variable effects across several quantiles, whereas Quantile-on-Quantile investigates interactions across quantiles for enhanced understanding. These studies may efficiently address environmental degradation. Future studies should be undertaken to address the research deficit and provide new insights into society worldwide.


