Article

Enhancement Effect of Phragmites australis Roots on Soil Shear Strength in the Yellow River Delta

College of Resources and Environment, Qingdao Agricultural University, Qingdao 266109, China
*
Author to whom correspondence should be addressed.
Sustainability 2024, 16(23), 10657; https://doi.org/10.3390/su162310657
Submission received: 11 October 2024 / Revised: 26 November 2024 / Accepted: 2 December 2024 / Published: 5 December 2024

Abstract

:
Soil erosion is one of the causes of ecosystem fragility in the Yellow River Delta. Plant roots can improve soil shear strength and effectively prevent soil erosion. However, there are no studies on soil shear strength in the Yellow River Delta. In this study, Phragmites australis (PA) root–soil composites with different root area ratios (RARs) (RARs = 0%, 0.06%, 0.14%, 0.17%, 0.19%, 0.24%, 0.36%) were prototypically sampled from the Yellow River Delta. Direct shear tests of root–soil composites were performed by a ZJ-type (three-speed) strain-controlled direct shear apparatus. The normal stresses were 25, 50, 100, and 200 kPa, and the shear rate was 1.2 mm/min. The results showed that PA roots significantly increased soil shear strength and cohesion with maximum growth rates of 219.0% and 440.1%, respectively. An optimal RAR of 0.14% in the range of 0~0.36% maximized the shear strength and cohesion of the root–soil composites. The internal friction angles of root–soil composites with different RARs did not differ significantly from those of the rootless soil. This indicates that the increase in shear strength was mainly due to an increase in cohesion. In addition, overall shear failure was the primary failure mode of rootless soil, with the roots pulled out of the soil in the root–soil composite failure mode. It is important to note that the root is deflected during shear in the direction opposite to the direction of the shear stress. These findings deepen our understanding of the effect of vegetation roots on soil shear characteristics and provide a scientific basis for the protection of bank slopes, soil and water conservation, and vegetation restoration in the Yellow River Delta.

1. Introduction

The Yellow River Delta has silty-mud tidal flats composed of silty silt, fine sand, silty clay, and organic matter, which are easily eroded. Erosion has brought great losses to the soil resources of the Yellow River Delta. Plants are central to maintaining a wide range of ecosystem functions [1,2]. The Yellow River Delta has a large amount of salt marsh vegetation, with important ecological functions of cementing the sediment and preventing erosion of tidal channel banks and beaches. Plants rely on their roots in providing a significant mechanical reinforcement effect to the topsoil of the slope [3,4], which enhances soil resistance to shear stress by introducing tension reinforcement to the soil [5,6,7,8]. The interaction between the roots and soil can limit the displacement and deformation of the soil, increase its shear strength, and prevent soil erosion. Therefore, studying the effect of roots on soil shear strength can allow us to better understand the interaction between soil and roots and provide support for sustainable development. Moreover, soil shear strength is a key index with which to evaluate soil stability, which plays an important role in flood control, landslide prevention, and other natural disasters.
Plant roots can form a root–soil composite with the soil, significantly increasing soil shear strength [9,10,11,12,13], where the increase in shear strength is mainly caused by an increase in cohesion [14,15,16]. Different vegetation root types enhance soil shear strength differently [17]. Typical Mediterranean herbaceous plants such as Helictotrichon filifolium (HF) can increase the cohesive strength of topsoil from 100 kPa to 244 kPa, and shrubs such as Anthyllis cytisoides (AC) can also increase topsoil shear strength to a large extent (up to 160 kPa). Compared with rootless soil, average increases in peak shear strength of 693%, 515%, and 530% were observed with Lotus corniculatus (LC), Trifolium pratense (TP), and Medicago sativa (MS) in the Fabaceae family, respectively [18]. The influence of roots in the root–soil composite on shear strength is related to a variety of factors, and numerous studies have shown that apart from the root type, root traits are closely related to shear strength and cohesion [19,20,21,22]. The shear strength of the soil increases steadily with an increasing root content in the soil [23], and the cohesion of the root–soil composite shows a layer-by-layer increase as the root content decreases or increases [24]. In addition, the shear strength of soil is inextricably linked to fundamental soil properties, such as the water content [25,26,27].
Roots can disperse the shear force and increase the anchored soil area [28,29], which can cause changes in the mode of shear failure that occurs when the soil is subjected to external forces. Studies have shown that the failure mode of rootless soil is primarily overall shear failure, in which the failure plane is not completely horizontal, whereas in root–soil composite failure, the root is pulled out of the soil, and the root–soil interfaces are significantly displaced relative to each other [30]. Different distributions of roots in the soil have completely different effects in increasing soil shear strength [31,32]. Gray and Leiser proposed a simple formula for estimating the increase in shear strength caused by sloping roots in soil, and the results showed that root orientation significantly affected the shear strength provided by roots in soil [33].
Phragmites australis (PA), a perennial herbaceous plant of the Phragmites genus in the Poaceae family, is widely distributed in the Yellow River Delta. It is extremely resilient and adaptable, with well-developed creeping rhizomes and four root cloths, which have the functions of embankment fixing and slope protection. It is among the first-choice plants for the ecological restoration of wetlands. Studies have shown that the shear strength of a PA root–soil composite is significantly greater than that of rootless soil [34], and its roots can take on the role of shallow reinforcement. When compared with five dominant saline herbaceous plants such as Leymus secalinus (LS), the enhancement of soil shear strength provided by PA roots is second only to that of Triglochin maritima (TM) [35]. Based on in situ sampling, Yu et al. [36] used the Bank Stability and Toe Erosion Model (BSTEM) to simulate the additional cohesion (ΔS) of the roots of three vegetation species. The results showed that the ΔS values supplied by the different root types were ordered in the sequence of PA > Populus euphratica (PE) > Tamarix ramosissima (TR), indicating that PA roots had the greatest reinforcing effect on the riverbank. From the above analysis, it can be seen that when compared with LS, PE, TR, and other plants, PA has superiority in soil consolidation and slope protection. Therefore, it is of great significance to study the effect of PA on soil shear strength in the Yellow River Delta.
Currently, most studies focus on the effect of root traits on the shear strength of root–soil composites. Meanwhile, there are few studies that analyze the shear failure process of root–soil composites and the effects of different root distributions on their shear strength. Therefore, a shear test was conducted on the root–soil composite of PA, a typical salt marsh vegetation in the Yellow River Delta. The effects of the RAR on soil shear strength, cohesion, and internal friction angle are discussed, and the differences in the shear failure process between a root–soil composite and rootless soil are analyzed. Moreover, the changes in root–soil composite shear strength under different root distributions are investigated to provide a reference for studying the effects of similar vegetative roots on soil shear strength.

2. Materials and Methods

2.1. Study Area

The study area is located in the Yellow River Delta in Dongying, Shandong Province, between 37°35′ N~38°12′ N and 118°33′ E~119°20′ E, with the backland facing the sea (Figure 1). Under the joint influence of the Eurasian continent and the Pacific Ocean, the region has a warm temperate climate with semi-moist continental monsoon climate zones. Throughout the four seasons, the temperature differs significantly, with the average annual temperature ranging from 11.7 to 12.6 °C, and the annual precipitation ranging from 530 to 630 mm.
The soil is mainly composed of silty silt, fine sand, silty clay, and organic matter. The organic matter content is lower than 0.5%, corresponding to the silty mud tidal flat, which is the main site for the development of tidal creeks. A large amount of salt marsh vegetation is distributed on the tidal flats near the tidal creeks and herbaceous plants, such as PA, Suaeda salsa (SS), Spartina alterniflora (SA), and Limonium sinense (LS). The dominant species in the Yellow River Delta region is PA, which is widely distributed spatially, mainly on both sides of the old and new channels of the Yellow River’s Qingshui Gou and Qing 8, with an area of 76.4286 km2 as of 2023 (Figure 1).

2.2. Sample Collection and Determination of Basic Physical Indices

In September 2023, two prototype sampling points were set up in the study area to obtain rootless soil and PA root–soil composites with different root contents. Root content is expressed as the root area ratio (RAR), which is calculated as follows [37].
R A R = A r A = i = 1 n r π d i 2 / 4 A
where Ar is the root cross-sectional area (cm2); A is the shear plane area (cm2); di is the root diameter (mm); and nr is the number of roots (roots).
The root diameter was measured with digital calipers with a resolution of 0.1 mm. The diameters of the upper, middle, and lower parts of each root were measured with digital calipers, and the average value was taken as the diameter of the root. The shear plane area is equal to the cross-sectional area of the ring knife, 30 cm2.
In this study, a tin bucket (Φ12 cm × 20 cm), scissors, rubber hammer, shovel, and cling film were used to obtain rootless soil and PA root–soil composites. Before sampling, remove weeds and other debris on the soil surface that may interfere with sampling. During cleaning, be careful not to disturb the soil surface and not to pull plants. To obtain a root–soil composite, the plant stems and leaves exposed on the ground surface are cut off with sharp scissors. Subsequently, the tin bucket is pointed at the plant roots and slowly pressed into the soil with a rubber hammer until it is filled with the root–soil composite completely. Immediately thereafter, the shovel is used to slowly excavate the whole plant roots from 10 cm outside of the tin bucket extending inside as far as possible, and the roots outside the tin bucket are cut off with sharp scissors. Finally, the bucket is sealed with cling film to prevent the dissipation of effective water in the specimen. It is important to note that the root integrity can impact the shear results. We guaranteed root integrity by (1) slowly pressing a tin bucket into the soil; (2) digging out the entire plant roots; and (3) using sharp scissors to prune plant stems, leaves, and excess roots to avoid disturbing the root–soil composites as much as possible. Rootless soil was obtained in the same manner. In addition, soil samples were collected at each sampling point using a ring knife (Φ6.18 cm × 2 cm) with a volume of 100 cm3 to determine the basic physical soil indices.
Following the “Standard for Geotechnical Testing Method GB/T50123-2019” [38], the ring knife method was used to determine the natural density of the soil; the drying method was used to determine the water content of the soil; and the sieve analysis method was used to analyze the particle composition of the soil.
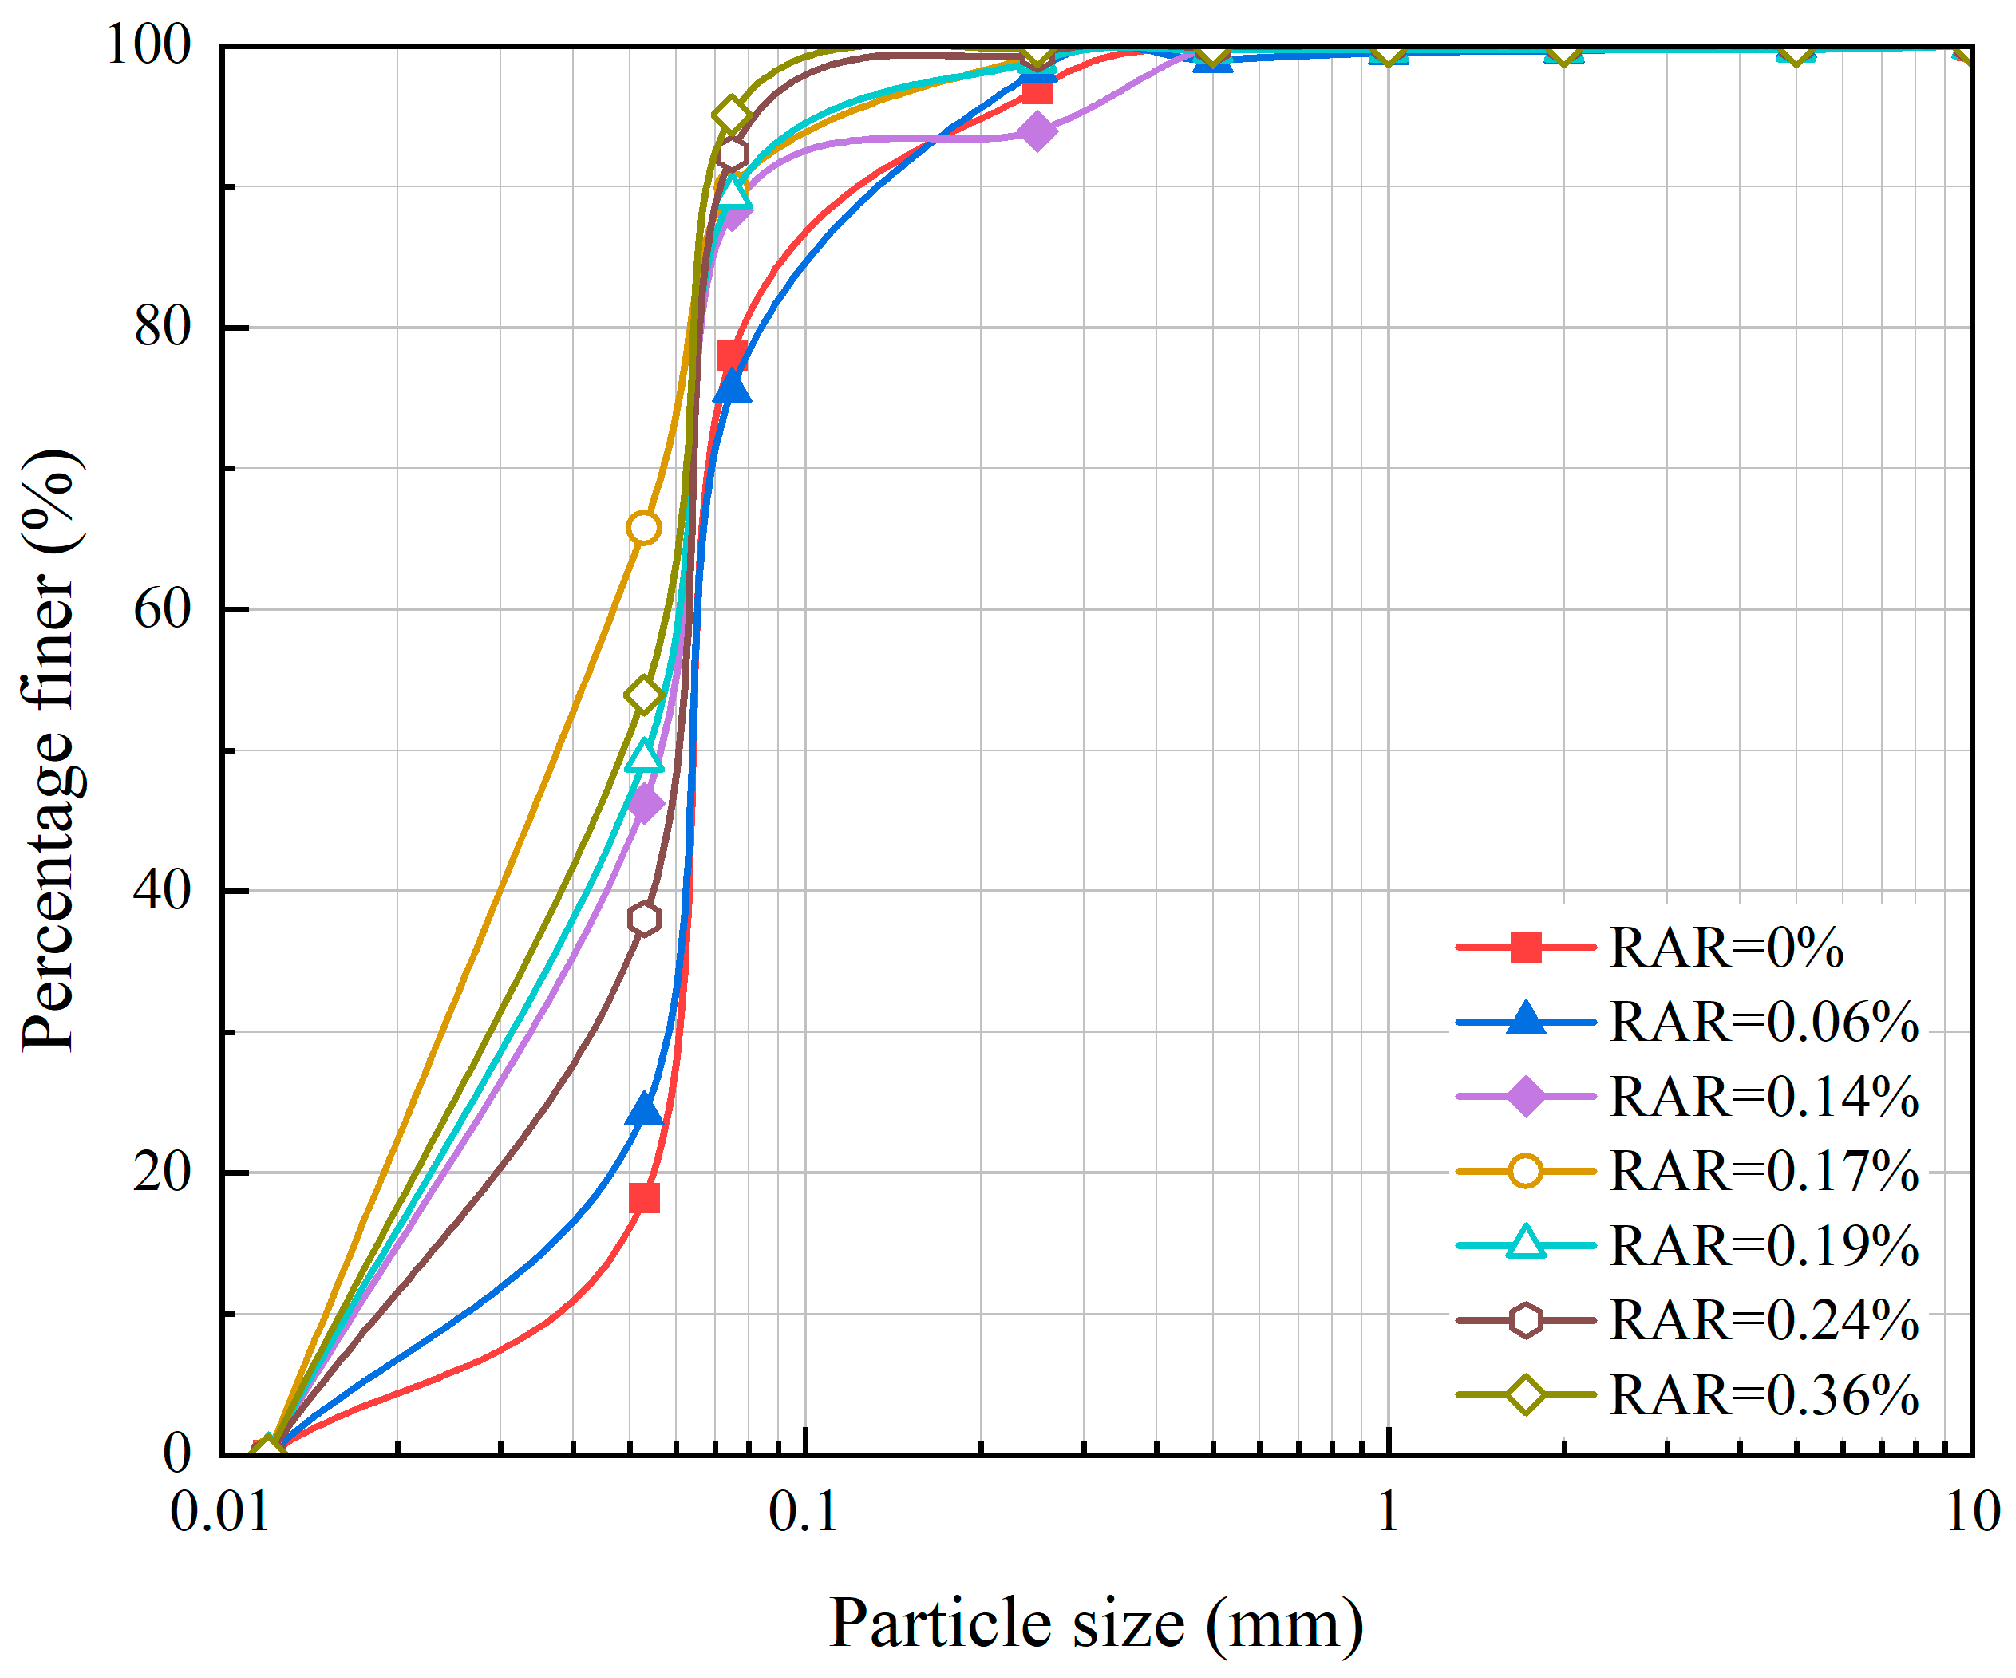
The results of the basic physical indices measured at each sampling point are shown in Table 1, and the soil particle distribution is depicted in Figure 2. In Table 1, the minimum dry density of the test samples is 1.49 g/cm3, the maximum is 1.58 g/cm3, the average value is 1.54 g/cm3, the minimum water content is 21.3%, the maximum is 26.5%, and the average value is 23.9%. Note that the special characteristics of field sampling preclude the control of variables. From the data, we determined that the dry density and water content of each sample differed slightly. This study assumed the dry density and water content of each sample to be consistent within the permitted ranges. The effect of these factors on shear strength and shear indices (cohesion and internal friction angle) was not considered in this study. As shown in Figure 2, the soil particle size was less than 1 mm. The average contents of coarse sand, fine sand, and silt were about 1.88%, 55.84%, and 42.28%. The soil was mainly composed of silt and sand. Existing studies have also found that the soil particle size composition in the Yellow River Delta is mainly composed of silt particles [39,40].

2.3. Direct Shear Test of Root–Soil Composite

Four test samples were obtained sequentially from top to bottom in a tin bucket using a ring knife (Φ6.18 cm × 2 cm). First, a layer of petroleum jelly was applied to the inner wall of the ring knife to reduce the friction between the soil sample and the ring knife’s inner wall. The ring knife was pressed into the soil by aligning the plant roots. Finally, the specimens were removed using a chipper knife and branch scissors, ensuring as much as possible that the roots would not be disturbed in the process of taking the samples. A ZJ-type (three-speed) strain-controlled direct shear apparatus (Nanjing Soil Instrument Factory Co., Ltd., Nanjing, China) was used to carry out the direct shear test of the root–soil composite and rootless soil, at four levels of normal stress (25, 50, 100, and 200 kPa). The shear rate was set at 1.2 mm/min, and the specific test procedure was conducted according to the “Standard for Geotechnical Testing Method GB/T50123-2019” [38].

2.4. Calculation of Mechanical Indices

The dynamometer readings were taken during the direct shear test, in calculating the shear displacement Δ L and shear stress τ produced by the specimens using Equations (2) and (3), respectively. The shear stress–displacement curves were plotted. The peak value of the shear stress on the curve, or the shear stress corresponding to a shear displacement of 4 mm, was used as the shear strength τ f . The shear strength at four normal stress levels was linearly fitted, and the cohesion c and internal friction angle φ were calculated using Coulomb’s equation (Equation (4)). The shear displacement is expressed as follows:
Δ L = n × 20 R
where Δ L is the shear displacement (0.01 mm); n denotes the number of handwheel revolutions (r); and R is the force gauge reading (0.01 mm).
τ = C R
where τ is the shear stress (kPa), and C is the force gauge coefficient (kPa/0.01 mm).
τ f = σ tan φ + c
where τ f is the shear strength (kPa); σ is the positive stress (kPa); φ is the internal friction angle (°); and c denotes cohesion (kPa).

2.5. Determination of Root Distribution

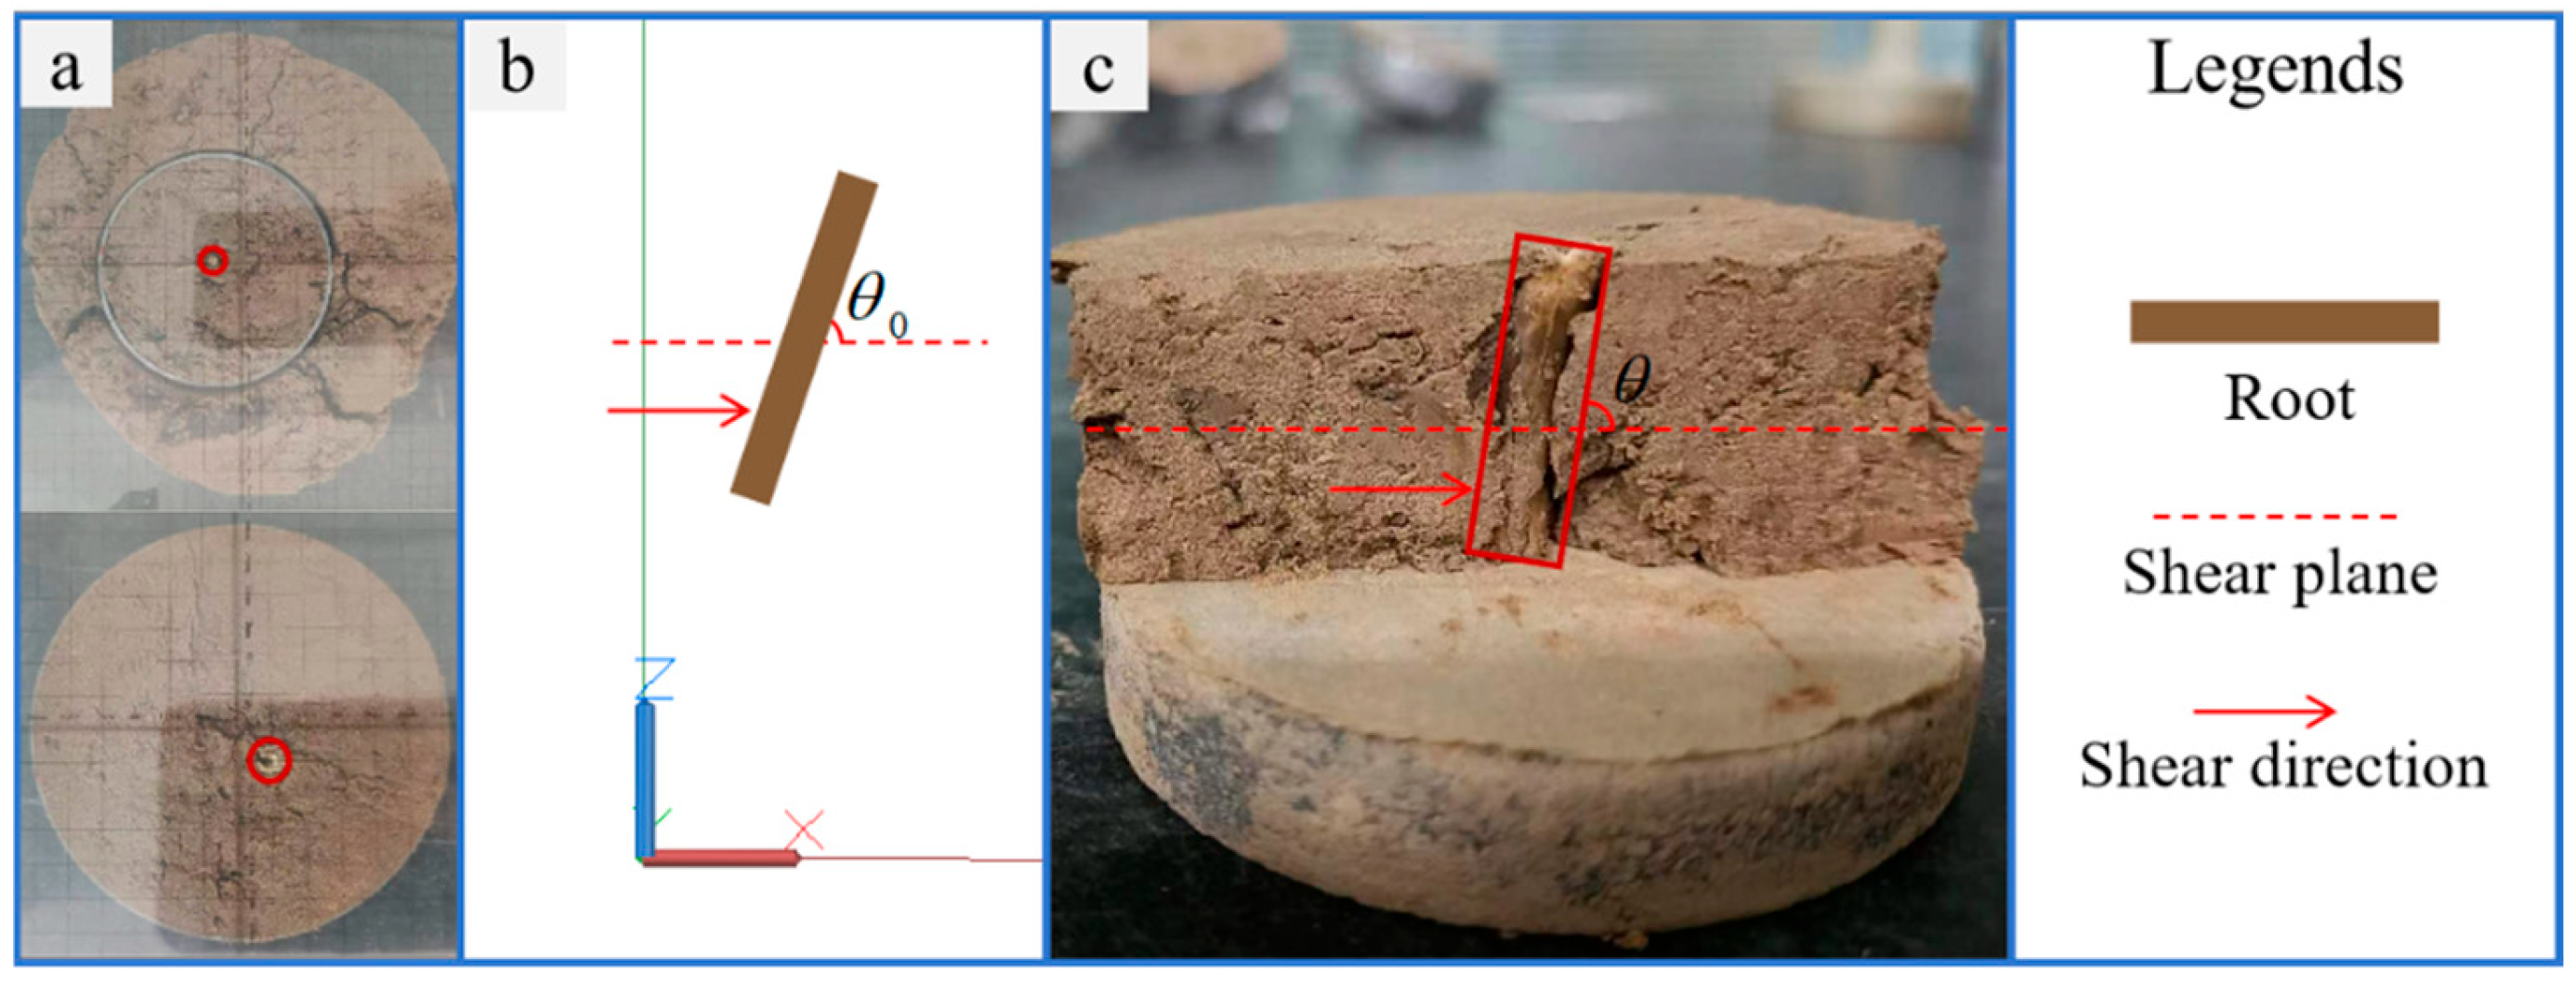
In this study, root distribution was quantified as the angle between the root and shear plane. According to the geometric definition of the angle, the angle between the root and shear plane is divided into (a) θ 0 < 90°; (b) θ 0 = 90°; (c) θ 0 > 90°. Before shearing, a transparent chequered-cross standard was placed on the front and back of the shear sample, and the coordinates of a single root were recorded, respectively (Figure 3a). A simple model of the root was constructed in AutoCAD based on the coordinates obtained, and the angle ( θ 0 ) between the root and shear plane was measured (Figure 3b). After shearing, the profile of the specimen was obtained by dismantling, and the angle ( θ ) between the root and shear plane (Figure 3c) was measured, thereby determining the distributions of the roots in the soil before and after shearing. It is important to note that the shear direction needs to be specified and marked before shearing. Place the specimen in a predetermined shear direction for shearing, thereby preventing the incorrect measurement of the angle between the root and the shear plane due to improper specimen placement.

2.6. Single-Root Model

Assuming that during the shearing process, the root is a rigid body and does not produce horizontal displacement, the angle between the root and the shear plane is generally divided into three cases: θ 0 < 90°, θ 0 = 90°, and θ 0 > 90°, as shown in Figure 4. Let the root length above the shear plane be l, the angle of the root offset in the shearing process be θ x , the angular displacement of the root in the shearing process be Δ x , the angle between the root and shear plane before shearing be θ 0 , the angle between the root and shear plane after shearing be θ , and the projection length of the root in the horizontal direction before shearing be a.
Then, a can be calculated as follows:
For θ 0 < 90°:
a = l × cos θ 0
For θ 0 = 90°: a = 0
For θ 0 > 90°:
a = l × cos θ 0
The angle of the root offset in the shearing process can be calculated as follows:
For θ 0 < 90°:
θ x = arccos a Δ x l θ 0
For θ 0 = 90°:
θ x = arcsin Δ x l
For θ 0 > 90°:
For Δ x + a < l :
θ x = 180 ° θ 0 arccos Δ x + a l
For Δ x + a > l :
θ x = 180 ° θ 0 arccos l Δ x + a

3. Results and Analysis

3.1. Relationship Between Shear Stress and Shear Displacement

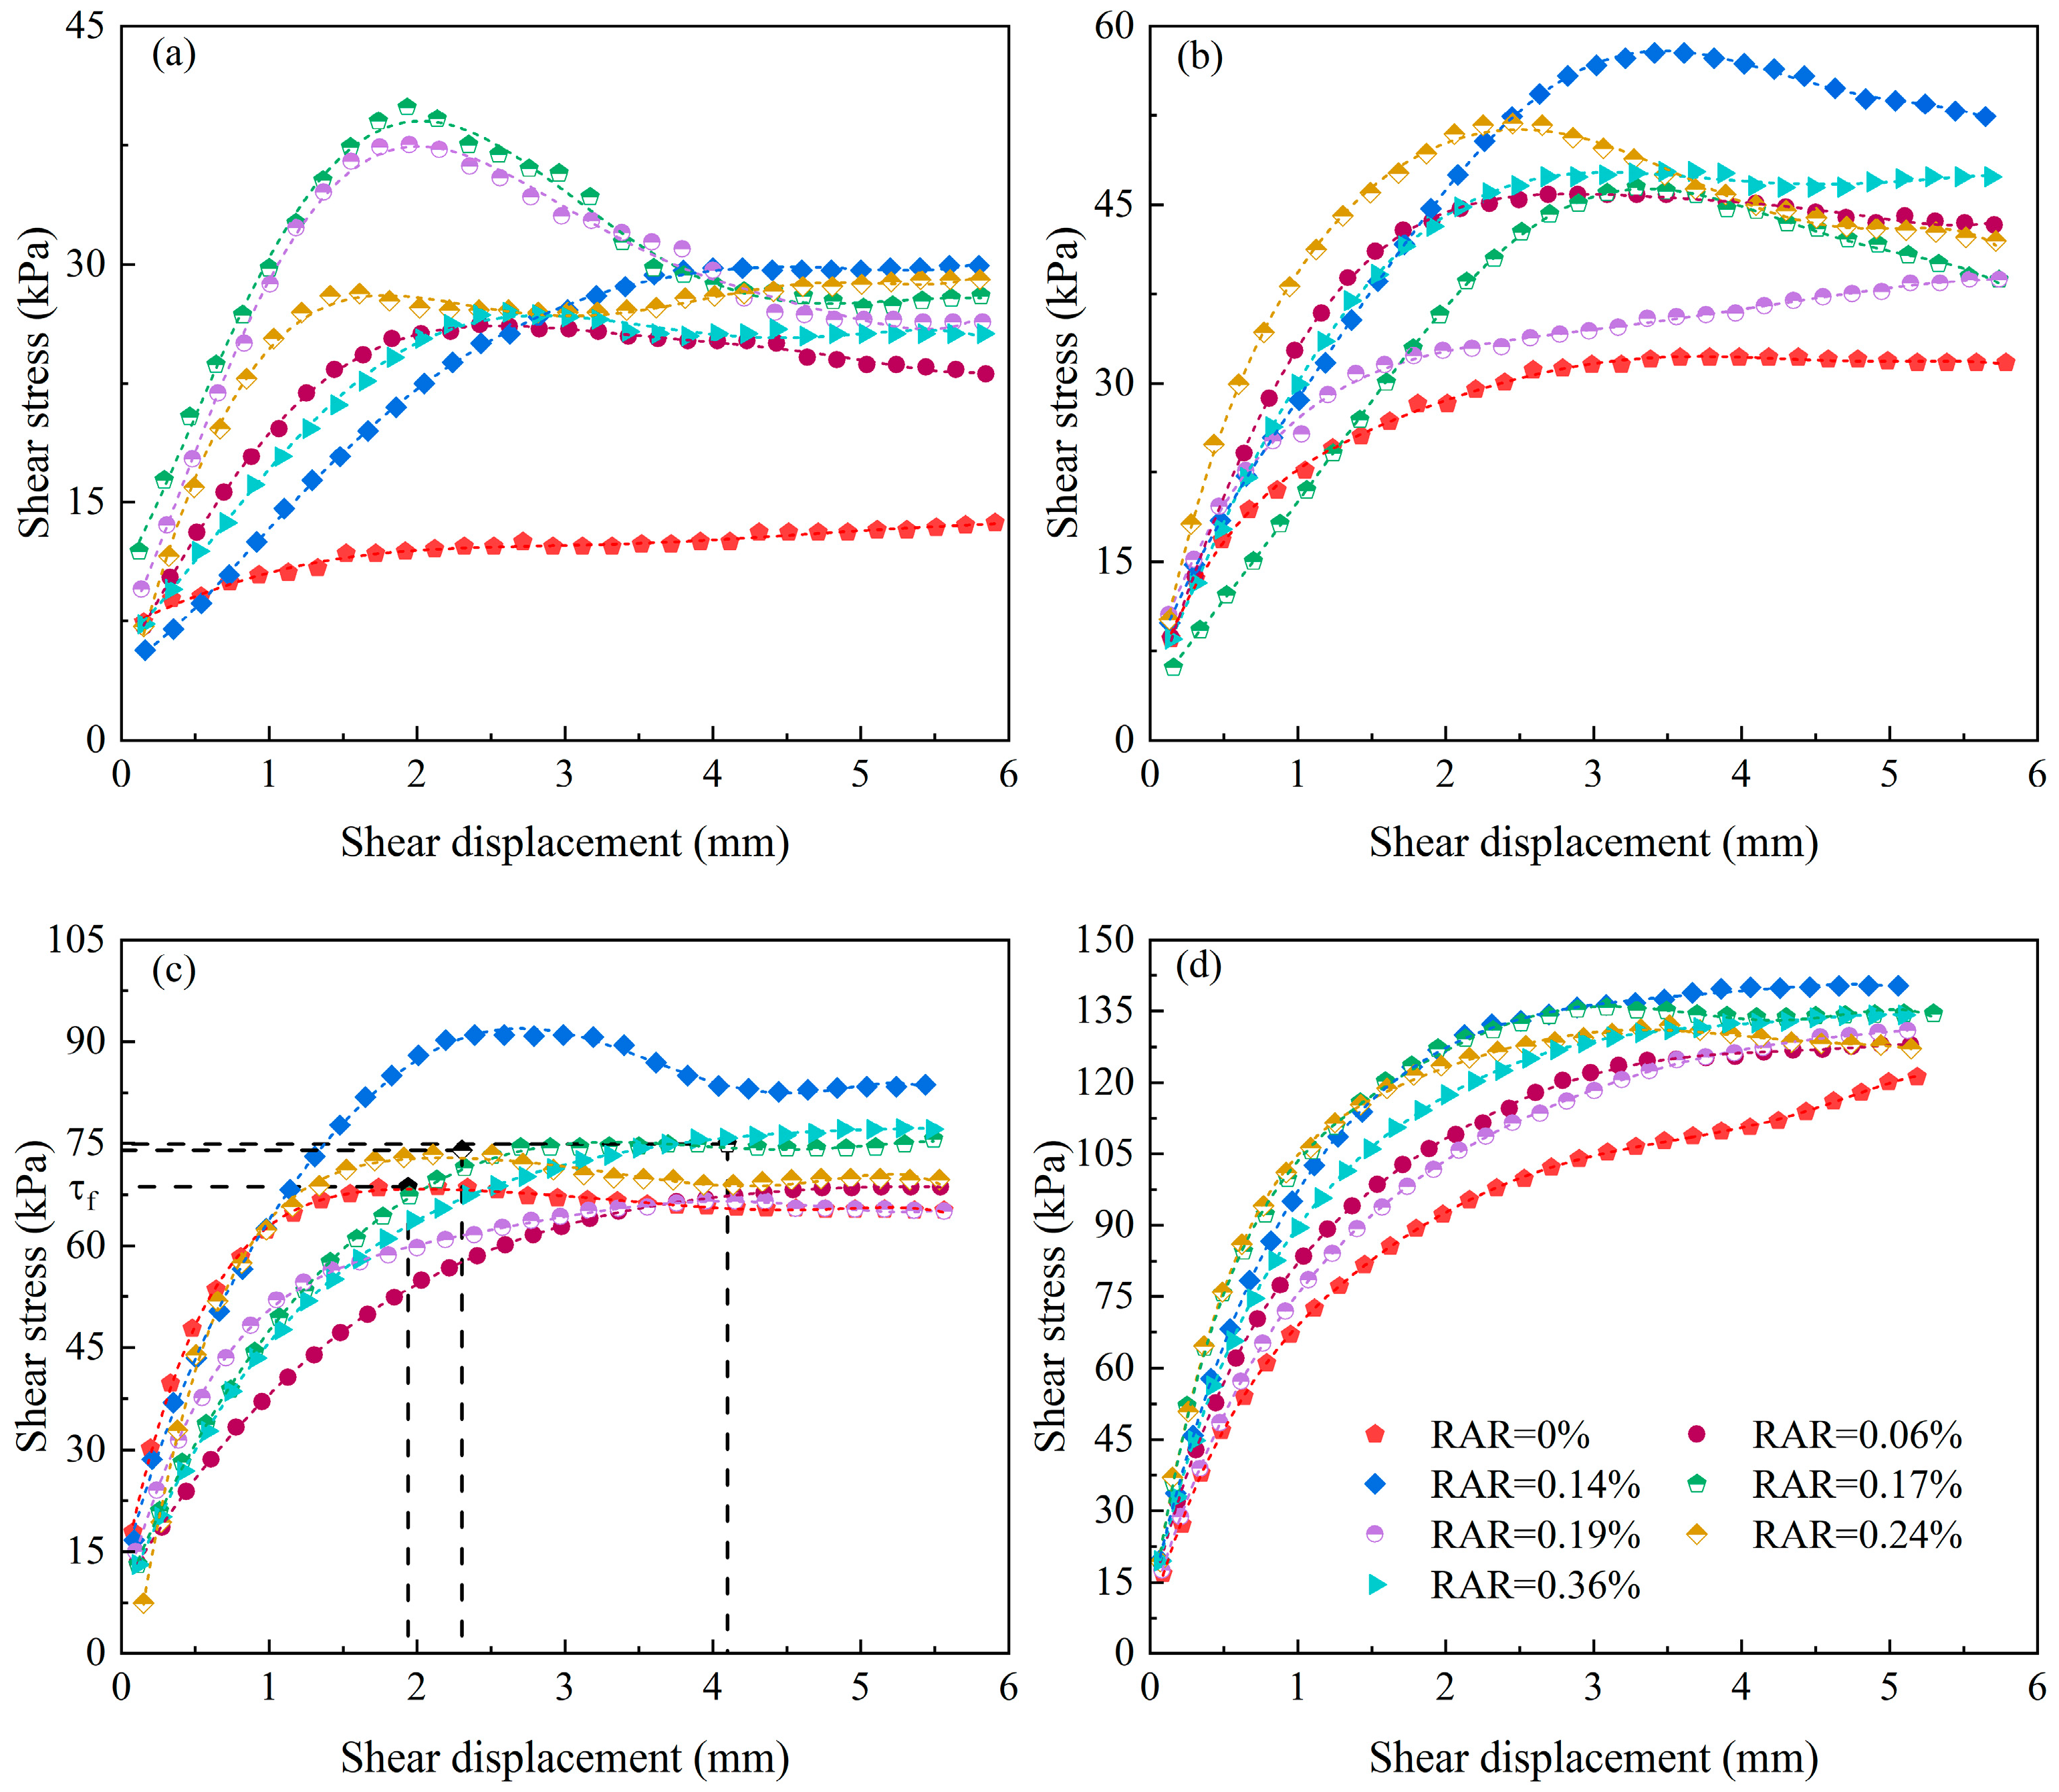
The shear stress–displacement curves of the rootless soil and PA root–soil composite specimens with different root contents under four levels of normal stress (25, 50, 100, and 200 kPa) were obtained via direct shear tests, as shown in Figure 5. The curves can be divided into two types: (i) In the “hardening type”, the shear stress gradually increases with an increase in shear displacement or tends to a certain stable value, and there is no obvious peak. (ii) In the “softening type”, with increasing shear displacement, the shear stress first shows an increasing and then decreasing trend and then tends to stabilize; the shear stress has a peak. The shear stresses of the rootless soil and root–soil composite under each root content both increase with an increase in normal stress, albeit in a nonlinear manner. Under the same normal stress, the shear stresses gradually increase with an increase in shear displacement before shear failure, and the growth rate changes from fast to slow.
The shear displacements corresponding to the arrival of the shear strength of rootless soil and root–soil composites are different, that is, they have different resistances to shear deformation. For example, under normal stress of 100 kPa (Figure 5c), the shear displacement is 1.94 mm for soil that has reached shear strength, whereas the corresponding shear displacement for the root–soil composite is at least 2.30 mm and at most 4.10 mm, both larger than that of the rootless soil at the time of destruction. In addition, under normal stress of 200 kPa (Figure 5d), when the shear displacement is 4 mm, the shear stress of the root–soil composites is greater than that of the rootless soil. This shows that when the same shear displacement is generated, the root–soil composites can withstand more shear stress, that is, the ability of the root–soil composites to resist deformation is greater than that of the rootless soil. The results show that the existence of the roots transfers the shear stress in the soil, which causes a greater displacement of the shear plane soil before reaching the shear strength, thereby improving the slope stability.

3.2. Shear Strengths of Root–Soil Composites with Different Root Contents

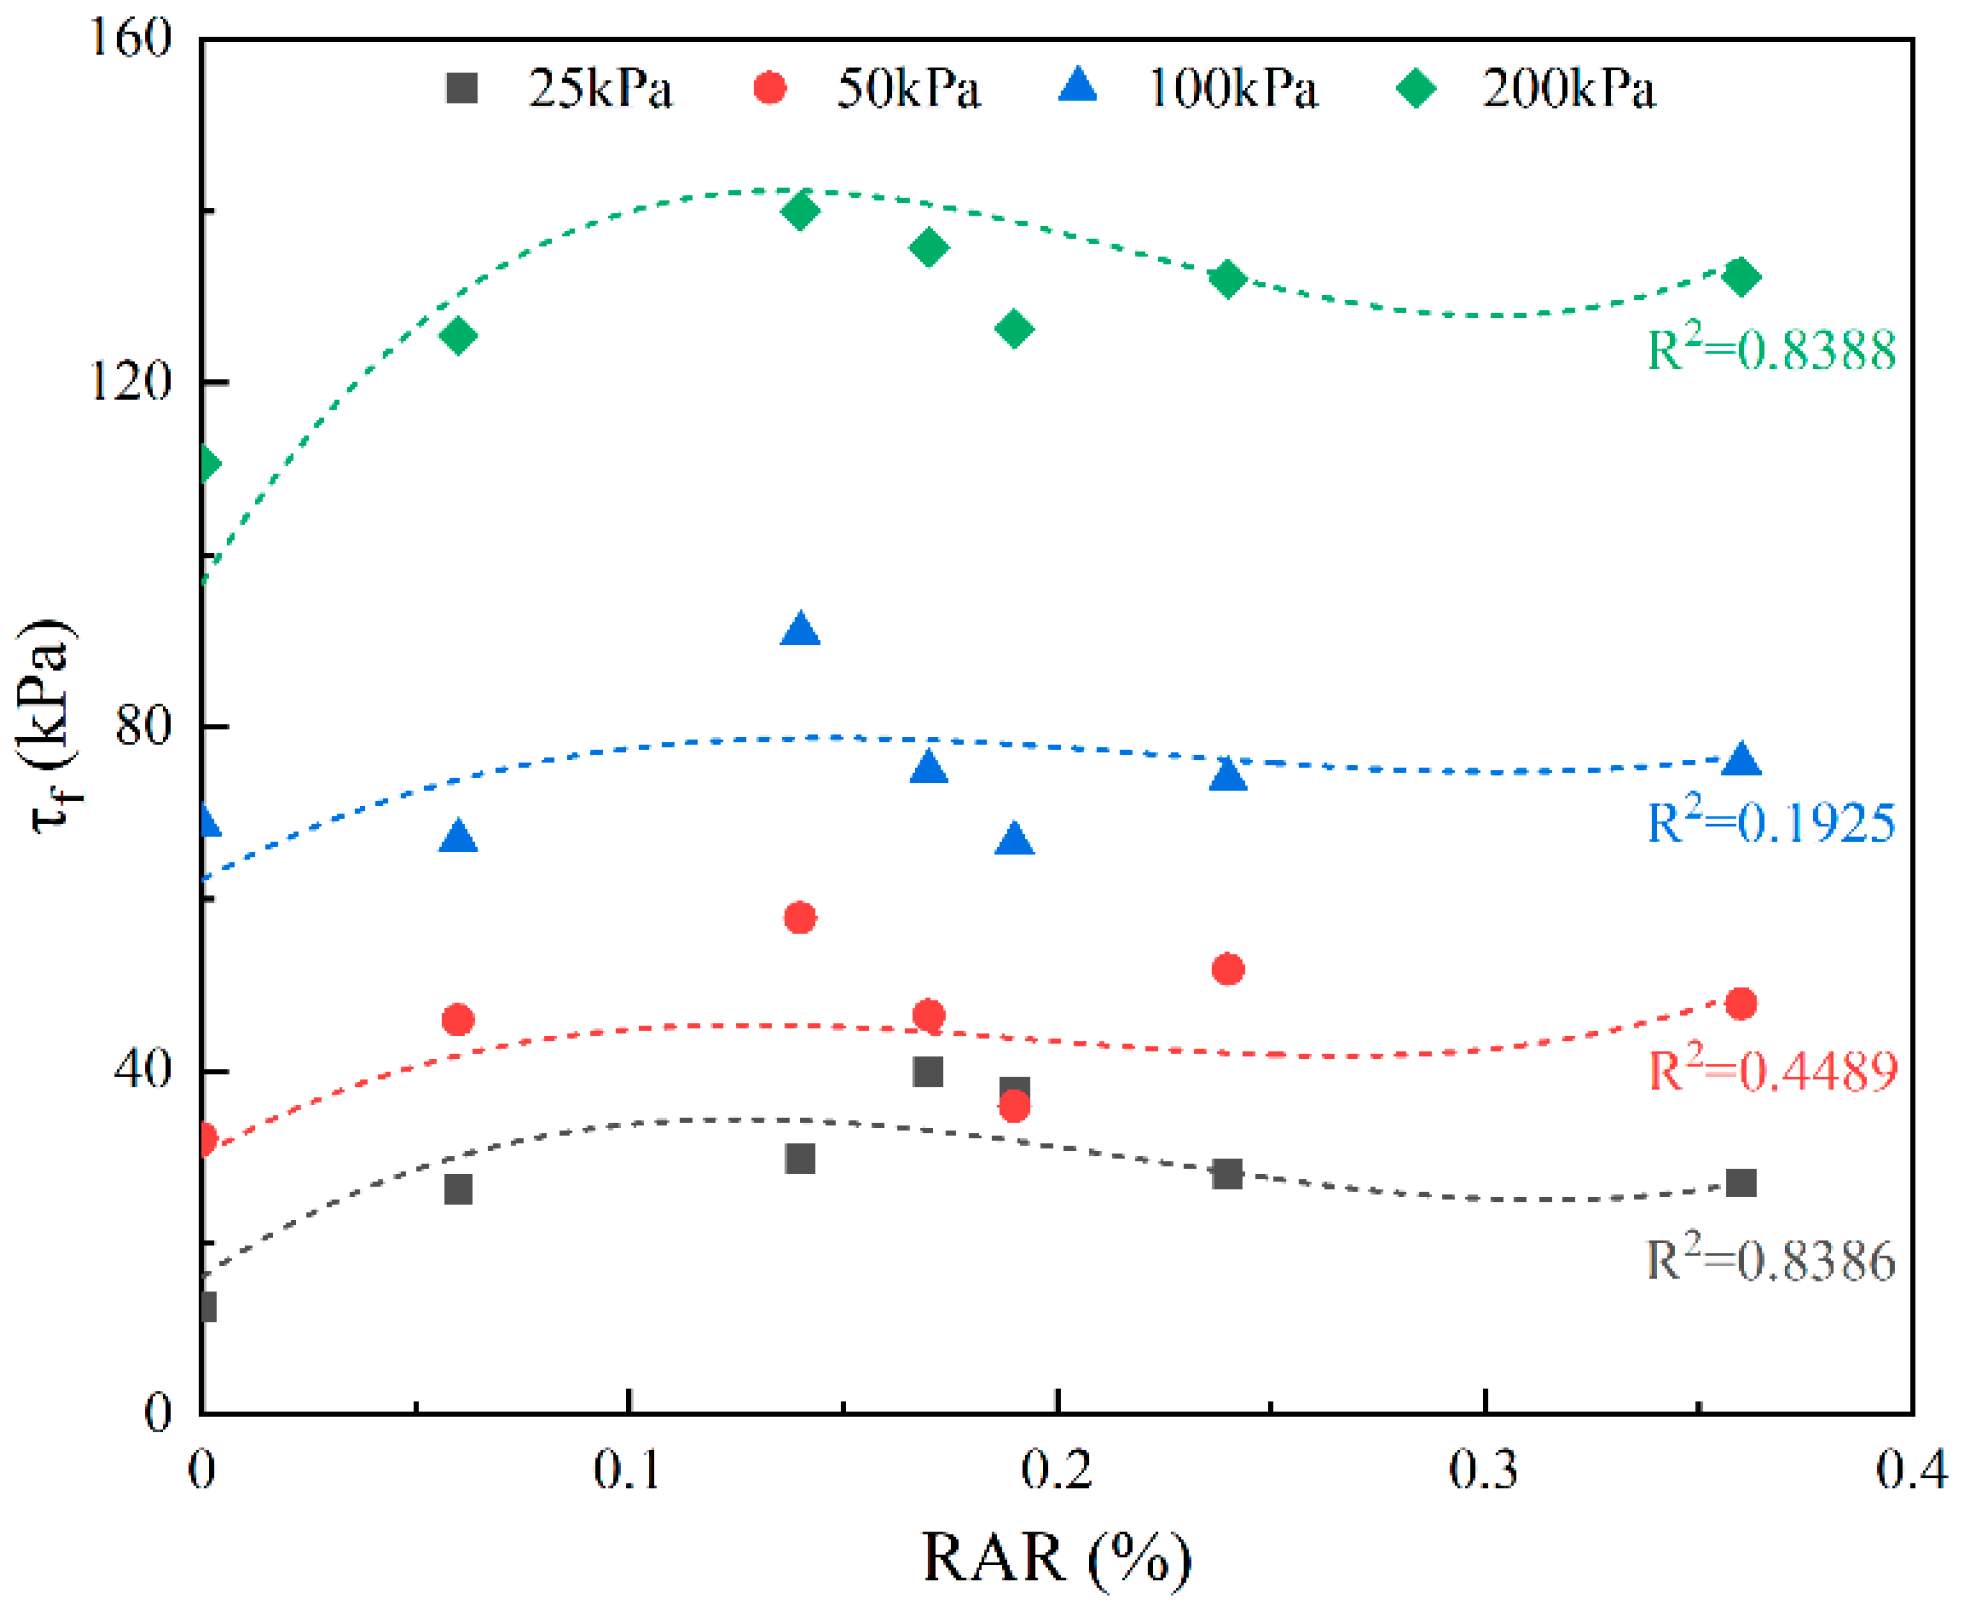
The relationship between the shear strength of rootless soil and root–soil composite to RAR is shown in Figure 6 at four levels of normal stress (25, 50, 100, and 200 kPa). The shear strength of the rootless soil and root–soil composites increases with an increase in normal stress. With an increase in RAR, the changing trend of shear strength under the four levels of normal stresses is more consistent. Except for 25 kPa, the shear strength reaches its maximum value at RAR = 0.14%. When RAR ≤ 0.14%, the shear strength of the root–soil composite increases with an increase in RAR, and when RAR > 0.14%, the shear strength of the root–soil composite gradually decreases with an increase in RAR. Although there is an increasing trend in the later period, the later increases do not exceed the maximum value of the earlier period. This indicates that the RAR significantly affects the shear strength of the soil, and there is an RAR of 0.14% in the range of 0% to 0.36%, maximizing the shear strength of the root–soil composite. In other words, there is a root content that results in the roots having the best effect on soil consolidation.
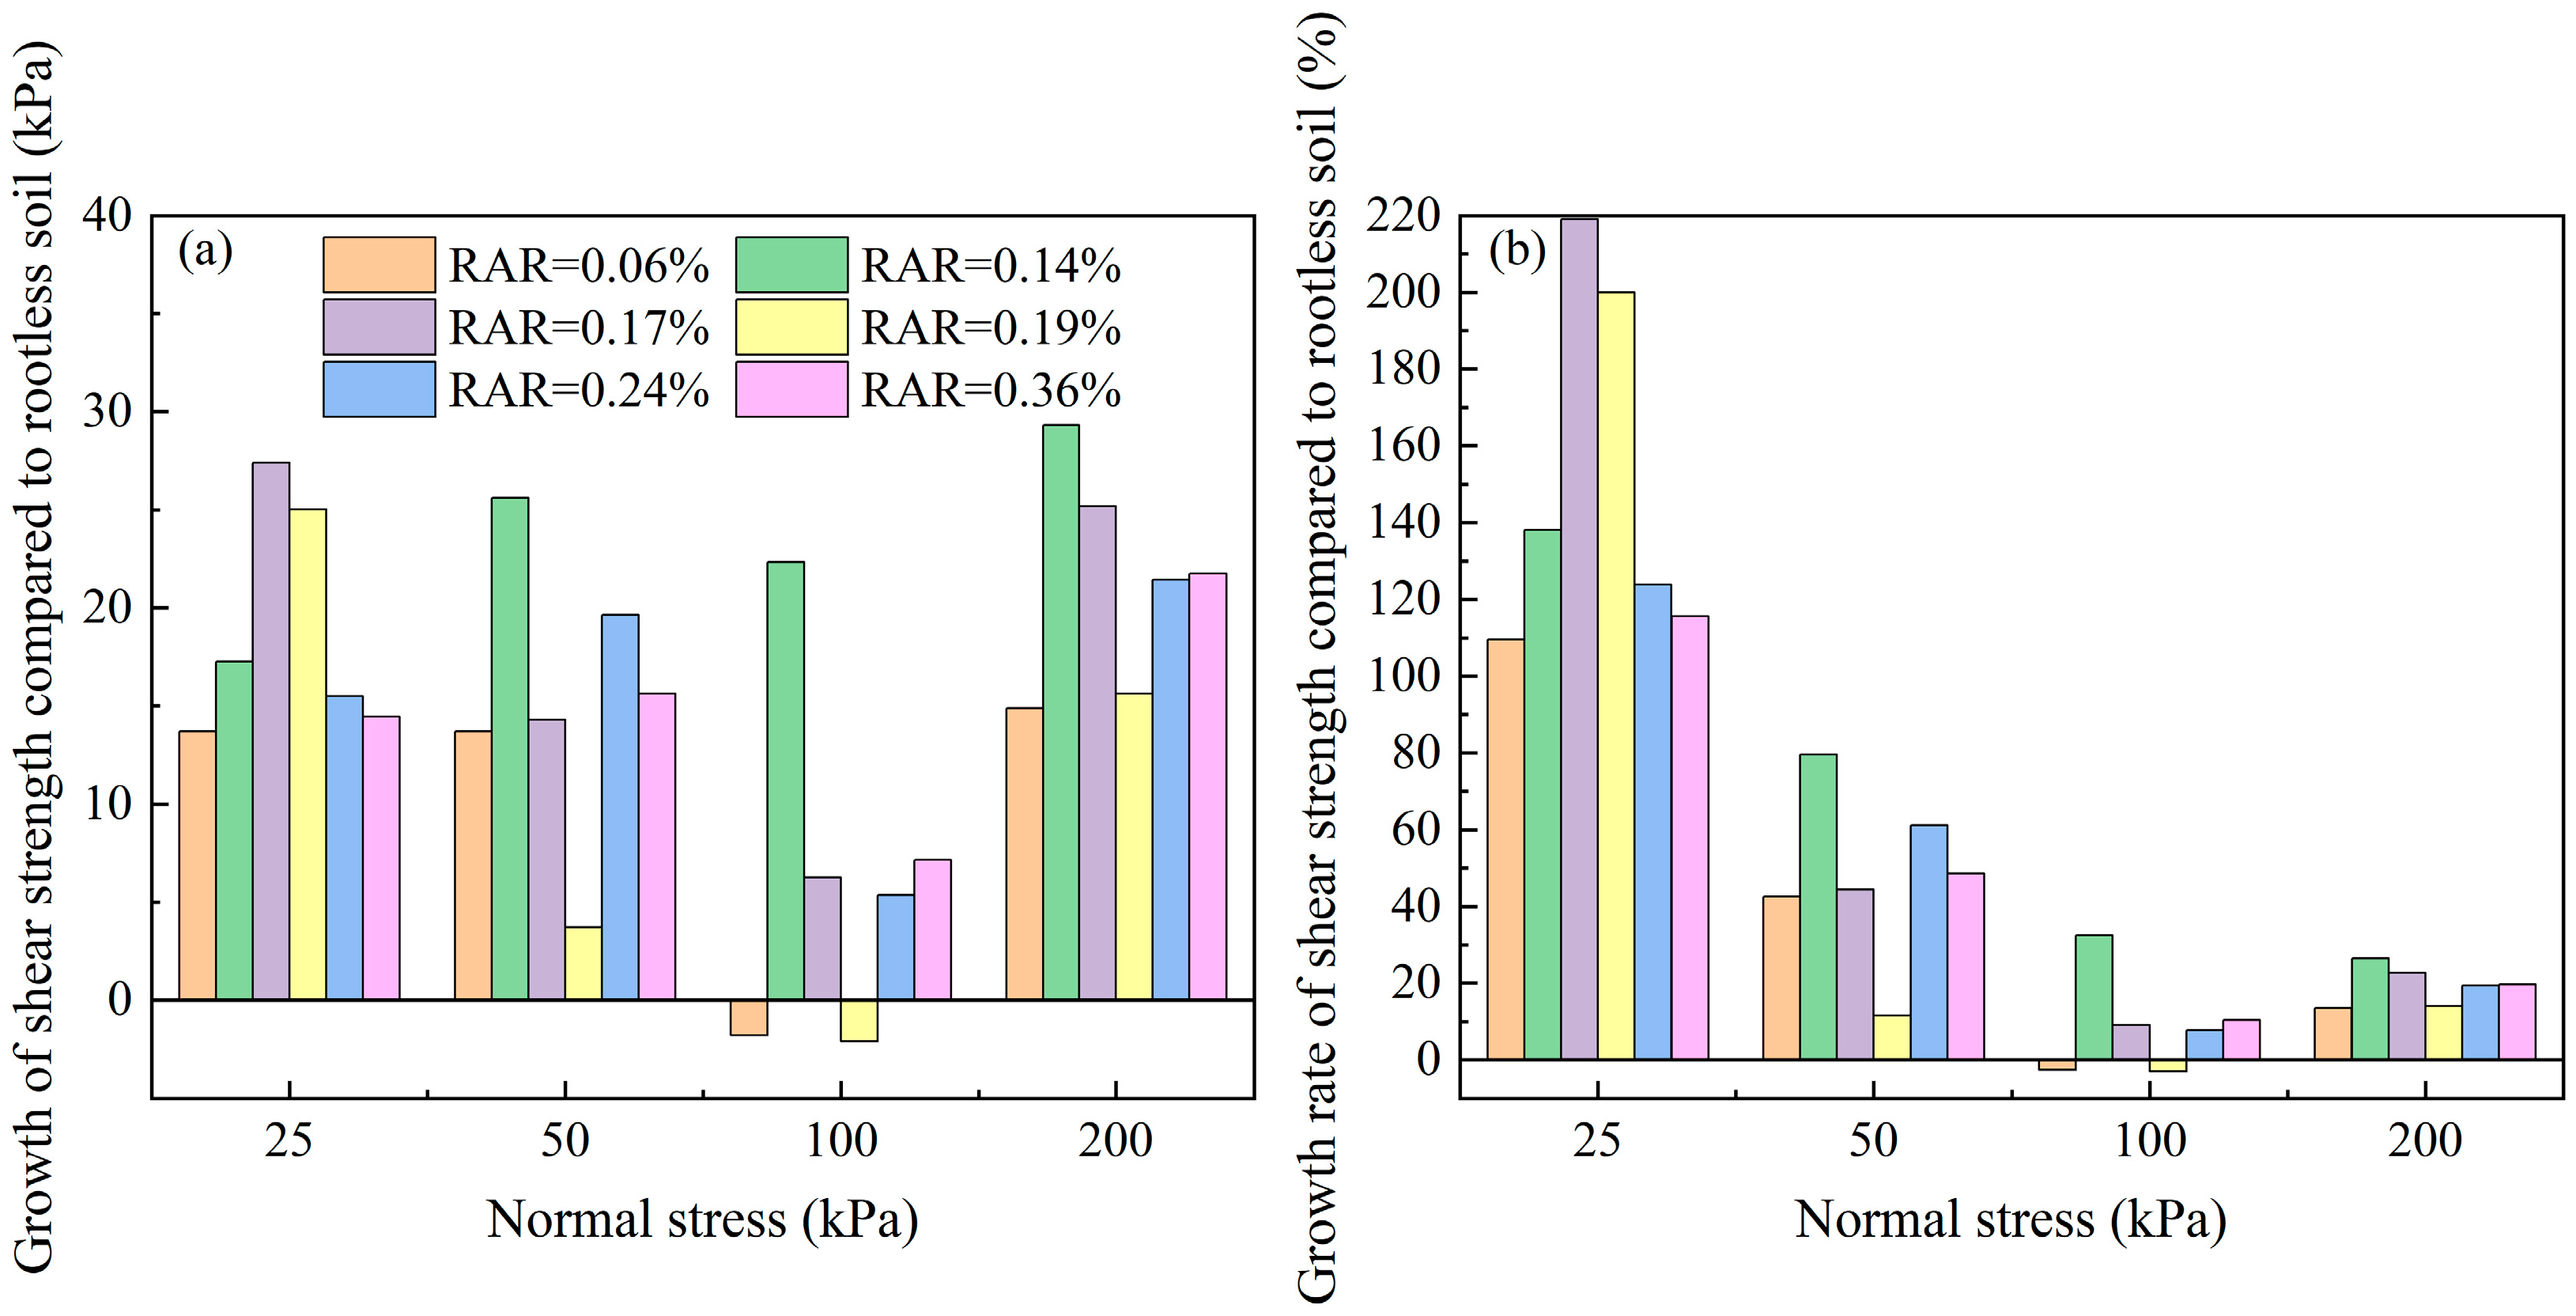
Figure 7a,b give the growth and growth rate of the shear strength of root–soil composites with different RARs relative to rootless soil. The shear strength of the majority of the root–soil composite specimens is higher than that of the rootless soil under the same normal stress. Compared to the shear strength of the rootless soil, those of the root–soil composite specimens increased by 13.70 to 27.40 kPa (25 kPa), by 3.72 to 25.61 kPa (50 kPa), by 5.36 to 22.34 kPa (100 kPa), and by 14.89 to 29.33 kPa (200 kPa) (Figure 7a). The growth rates of the shear strength under normal stresses of 25, 50, 100, and 200 kPa ranged at 109.5~219.0%, 11.6~79.6%, 7.8~32.5%, and 13.5~26.5%, respectively (Figure 7b). This indicates that PA roots can greatly improve the shear strength of soil.
As shown in Table 2, the growth rate of the shear strength of rootless soil gradually decreases with an increase in normal stress. For example, the shear strength increases by 157.1% with an increase in normal shear strength from 25 to 50 kPa, by 113.4% when normal shear strength increases from 50 to 100 kPa, and by 61.2% when normal shear strength increases from 100 to 200 kPa. The growth rate of the shear strength of root–soil composites under the same root content does not show a clear pattern of change with an increase in normal stress increments. For example, when RAR = 0.06%, the growth rates of shear strength are 75.0%, 45.8%, and 87.8% when normal stress increases from 25 to 50 kPa, 50 to 100 kPa, and 100 to 200 kPa, respectively; the growth rates decrease and then increase. At RAR = 0.24% and 0.36%, the growth rate similarly decreases and then increases. When RAR = 0.14%, as shear strength increases from 25 to 50 kPa, 50 to 100 kPa, and 100 to 200 kPa, the shear strength growth rates are 94.0%, 57.5%, and 53.8%, respectively. The growth rate gradually decreases, which is consistent with the change rule of rootless soil. In contrast, when RAR = 0.17%, as shear strength increases from 25 to 50 kPa, 50 to 100 kPa, and 100 to 200 kPa, the shear strength growth rates are 16.4%, 61.2%, and 81.3%, respectively; the growth rate increases gradually. When RAR = 0.19%, the growth rate of shear strength also increases gradually. This further indicates that the RAR significantly affects the shear strength of the soil.

3.3. Shear Indices of Root–Soil Composites with Different Root Contents

Linear fitting of the shear strength of the rootless soil and root–soil composite was performed under four levels of normal stress, and the fitting results (Table 3) are consistent with Coulomb’s equation (Equation (4)). This indicates that the shear relationship obeys the Mohr–Coulomb criterion of rock failure. Cohesion and the internal friction angle can be deduced from the Mohr–Coulomb criterion of rock failure. As shown in Table 3, the cohesion of the root–soil composites with different root contents is greater than that of the rootless soil. When compared with the rootless soil, the minimum growth in the cohesion of the root–soil composites is 9.97 kPa, and the maximum growth is 18.69 kPa. The minimum growth rate is 234.8%, and the maximum growth rate is 440.1%, indicating that the roots can increase the cohesion of the soil to a greater extent.
When RAR ≤ 0.14%, the cohesion of the root–soil composite gradually increases with an increase in RAR. When RAR > 0.14%, the cohesion of the root–soil composite gradually decreases with an increasing RAR. Therefore, from the perspective of cohesion, the RAR ranges from 0% to 0.36%, and there is an optimum RAR of 0.14% that maximizes the cohesion of the soil. This is consistent with the optimal root content obtained from the perspective of shear strength. The internal friction angle of different RAR root–soil composites is at most 2.3° different from that of rootless soil, and the difference between them is small. Moreover, the internal friction angle of different RAR root–soil composites has no obvious change rule when compared with that of rootless soil. According to Mohr Coulomb theory, the shear strength is composed of cohesion strength and frictional strength. Combined with the analysis in the previous section, the roots can greatly improve the cohesion of the root–soil composites, while the internal friction angle of the root–soil composites with different RARs changes little. This indicates that the increase in shear strength of the root–soil composite is mainly caused by an increase in cohesion. This finding is consistent with Li et al., Huang et al., and Song et al. [14,15,16].

4. Discussion

4.1. Enhancement Effect of PA Roots on Soil Shear Resistance

In this study, it was found that PA roots could significantly improve the shear strength and cohesion of soil, with a maximum growth rate of 219.0% for shear strength and 440.1% for cohesion. However, studies have shown that different plant species have different enhancement effects on soil shear strength and cohesion [41,42]. Su et al. [21] found that the presence of Bothriochloa ischaemum (BI) roots and Artemisia gmelinii (AG) roots increased the cohesion by 13.34~115.05%, which was smaller than the growth rate of the cohesion of PA in this study. Docker et al. [43] measured the shear strength of root–soil composites of Casuarina equisetifolia (CE), Eucalyptus amplifolia (EA), Eucalyptus robusta (ER), and Acacia floribunda (AF) in the field. The results showed that the roots of trees could also significantly improve the shear strength of soils. Therefore, it is of significant value to further study the effects of shrubs and trees on soil shear strength in the Yellow River Delta. The comparison of the enhancement effects of herbaceous plants (such as PA), shrubs (such as Suaeda salsa (SS)), and trees (such as Tamarix chinensis (TC)) on soil shear strength is of guiding significance for the selection of tree species for soil and water conservation in the Yellow River Delta.
Plant roots improve the soil shear strength through the friction characteristics of the root–soil interface, and the root content directly determines the root–soil contact area. Therefore, the root content is an important factor affecting the shear strength of root–soil composites. In this study, it was found that there was a critical value of RAR = 0.14% in the range of 0~0.36%, which created the largest shear strength and cohesion of the root–soil composites. This is different from the findings of Mahannopkul et al. [44] and Hamidifar et al. [45], who conducted direct shear tests on Vetiveria zizanioides (VZ) root–soil composites and found that the shear strength, cohesion, and internal friction angle increased with the increase in root contents. This difference may be due to the different ranges of root contents studied. In future studies, the greatest root content possible should be selected to ensure the accuracy of the optimal root content.

4.2. Differences in Shear Failure of Rootless Soil and Root–Soil Composites

According to the Mohr–Coulomb theory, the shear strength of soil is composed of two parts: cohesion strength (c) and frictional strength (tan φ). Frictional strength is generated by the frictional resistance formed by the relative motion, occlusion, and collision of soil particles. During the entire shearing process, the shear stress of the rootless soil is borne by the cementation between soil particles and frictional resistance between grains. In the shearing process of root–soil composites, in addition to the cementation between soil particles and frictional resistance between grains, the roots also bear part of the shear stress (plant roots can absorb water in the soil to reduce pore water pressure and improve the shear strength of the soil through anchoring and soil reinforcement). The amount of shear stress borne by the roots of the composites with different root contents differs depending on the normal stress. For example, under a normal stress of 25 kPa, the roots bear the highest shear stress of 27.40 kPa when RAR = 0.17%. At normal stresses of 50 kPa, 100 kPa, and 200 kPa, the roots bear the highest shear stresses of 25.61 kPa, 22.34 kPa, and 29.33 kPa, respectively, when RAR = 0.14%. Therefore, the amount of shear stress borne by the roots is not only related to the root content but also inseparable from the normal stresses of the composite. Generally, with an increase in normal stress, the tighter the arrangement of soil particles, the greater the shear strength of the sample.
In addition, at 100 kPa normal stress, the shear stresses borne by the roots are observed to be −1.79 kPa and −2.08 kPa when RAR = 0.06% and 0.19%, respectively (Figure 7a). That is, compared with rootless soil, the shear strength of the root–soil composite has decreased by 1.79 kPa and 2.08 kPa, respectively. In this study, the decrease in shear strength is attributed to the fact that as shear displacement increases, the shear strength of the soil increases to a greater extent than that of the soil with roots.
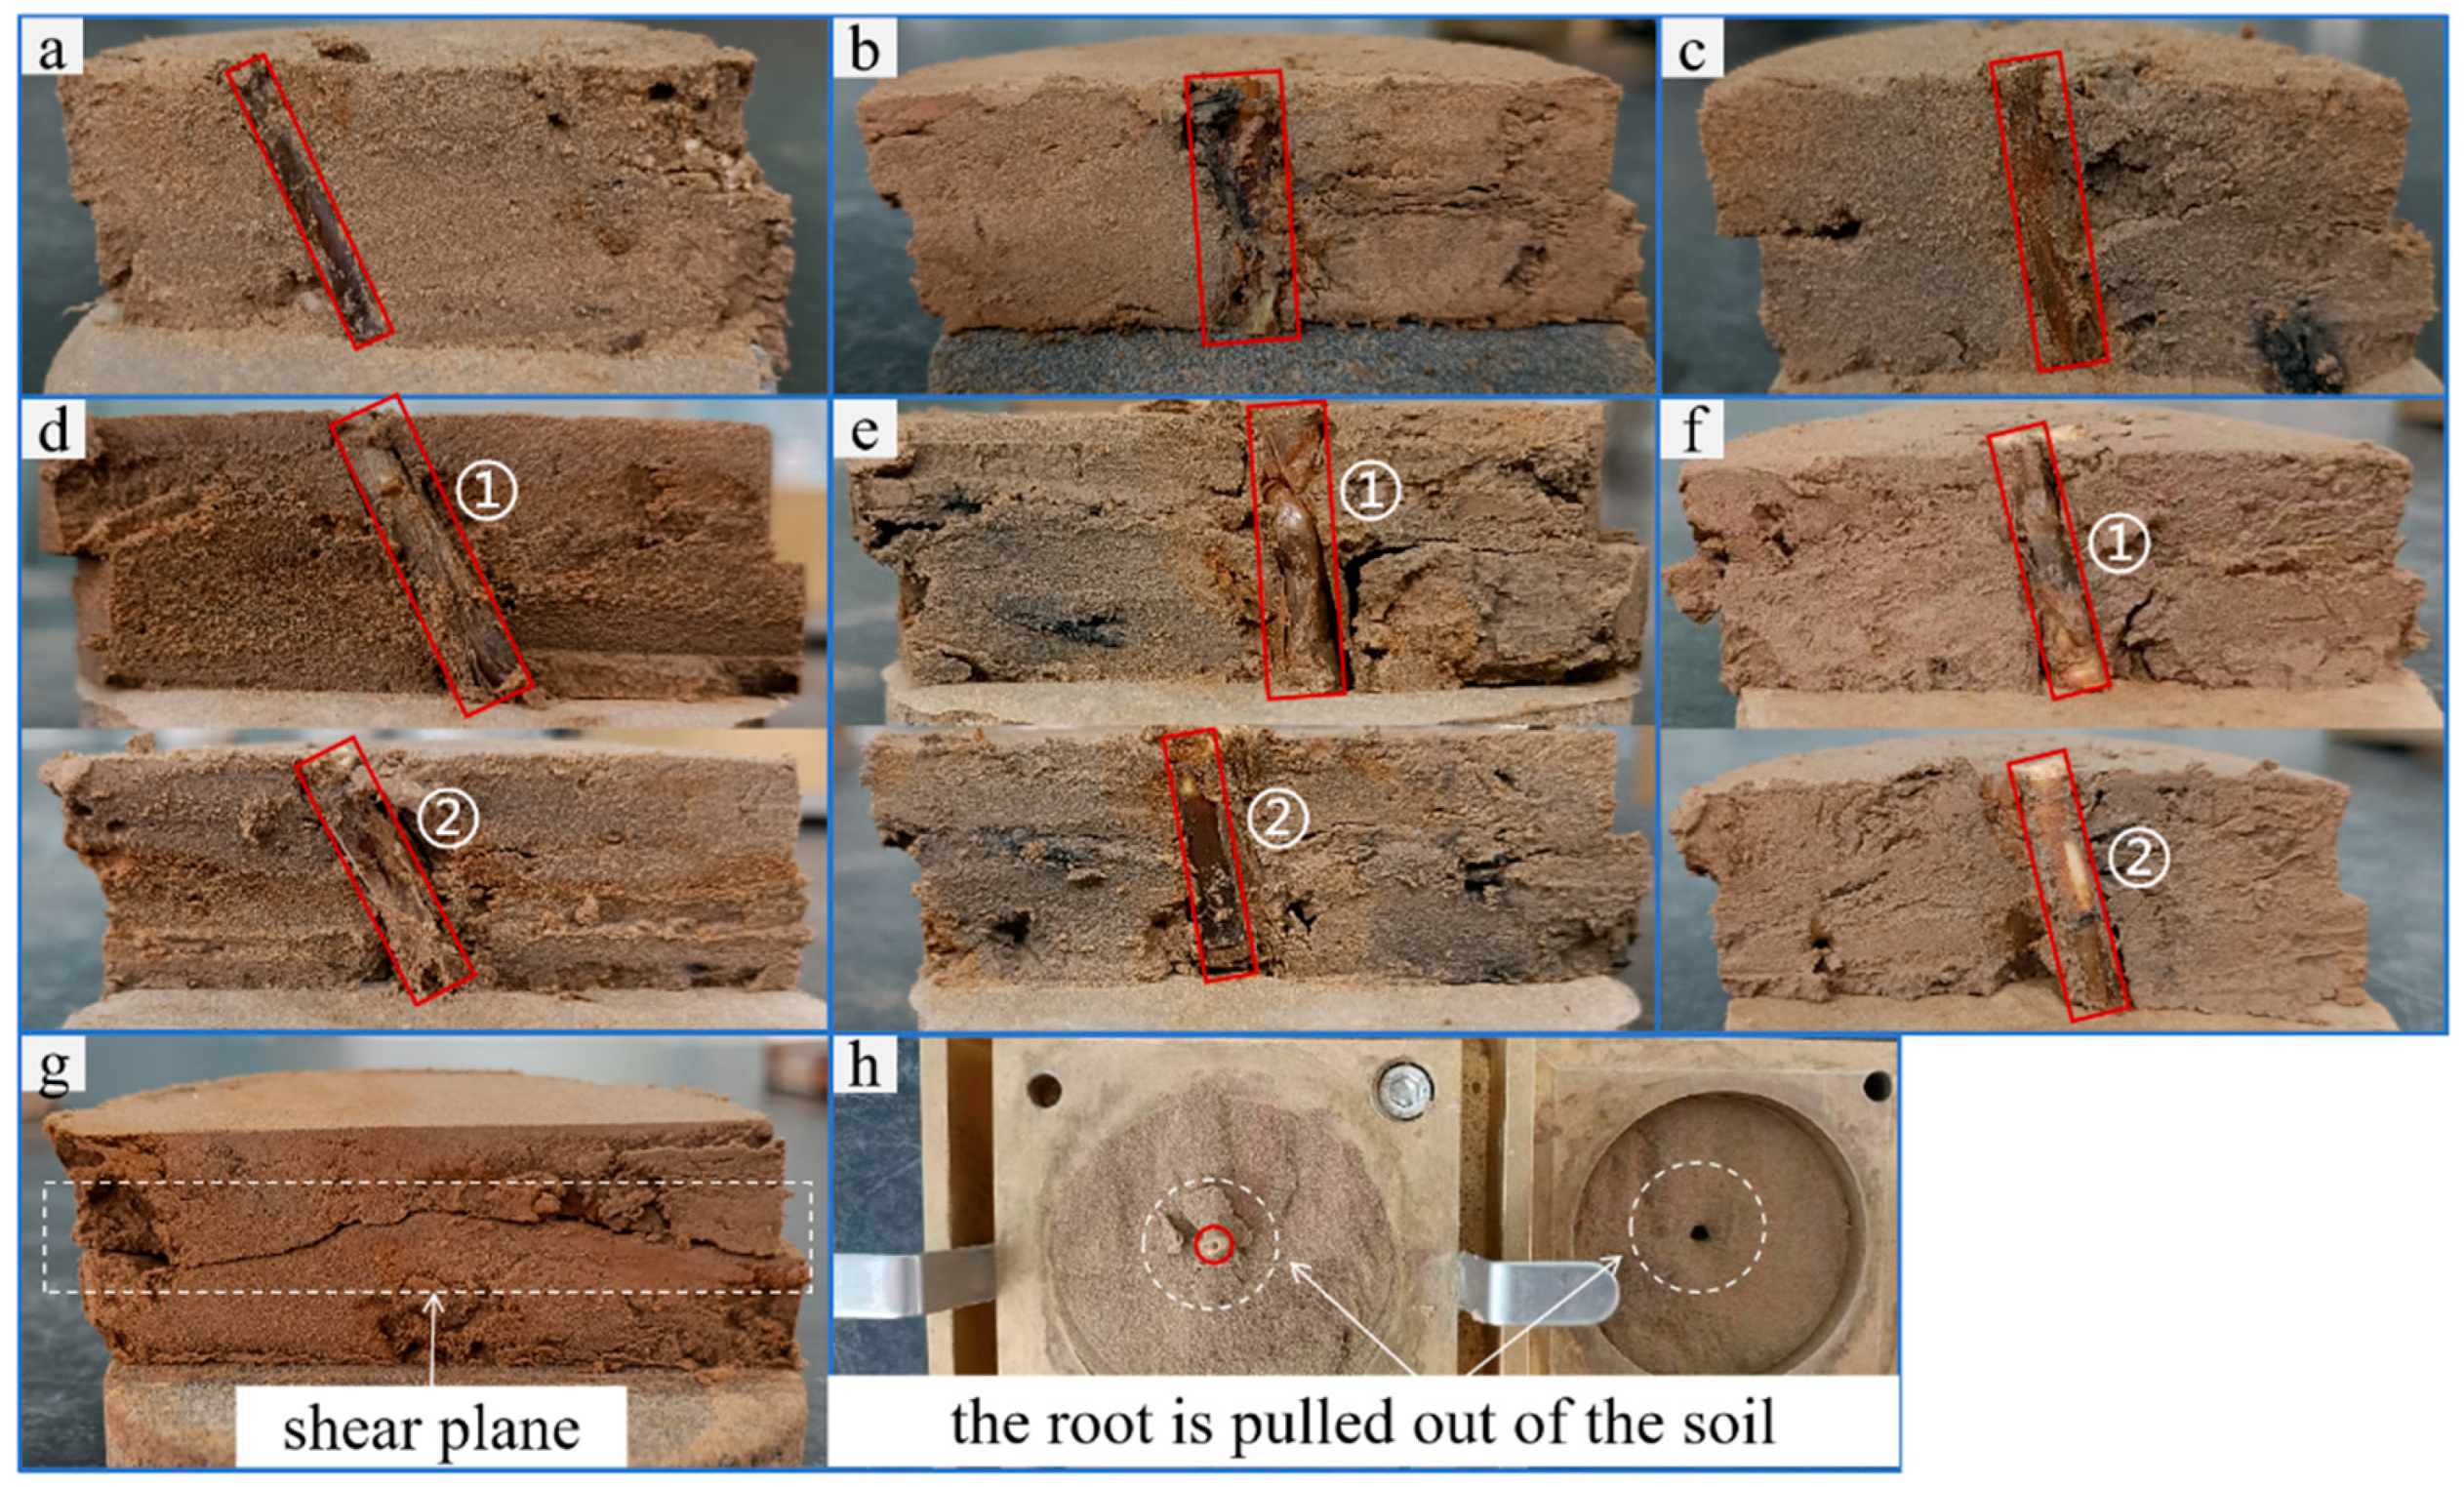
After the direct shear test, the shear-failure sample was disassembled. Figure 8 shows the shear failure diagram of the PA root–soil composite and rootless soil samples under normal stress of 25 kPa. It found that the failure mode of rootless soil is an overall failure, and the failure forms a shear plane along the upper and lower box interfaces, albeit not completely horizontal (Figure 8g). However, in the profile of the root–soil composite, no obvious through-shear plane is formed at the upper and lower box interfaces because of the presence of the root (Figure 8a–f). It was observed that the root was not broken, and it was pulled out of the soil when the root–soil composite was destroyed (Figure 8h), which is consistent with the findings of Zong et al. [46].

4.3. Influence of Root Distribution on Shear Strength

The shear strength of root–soil composites is not only affected by the characteristics of the soil itself (water content, dry density, clay content, etc.) but also by root factors such as root distribution. To study the influence of root distribution on the shear strength of the root–soil composite, the shear profile of the test soil sample was observed after the direct shear test, as shown in Figure 9.
In this study, a more typical specimen was selected for analysis. According to the profile, under normal stress of 50 kPa, when the root is parallel to the shear plane (Figure 9a), the shear strength of the composite increases by 19.65 kPa when compared with that of rootless soil. When the root is perpendicular to the shear plane (Figure 9b), the shear strength increases by 4.32 kPa when compared with that of rootless soil. The increase in shear strength is greater when the roots are distributed in parallel than when they are distributed perpendicularly. Contrary to the results of Hu et al. [47], this may have been caused by a large difference in the root diameters of the two specimens for vertically distributed roots (d = 5.0 mm) and roots distributed in parallel (d = 6.9 mm).
In addition, under normal stress of 200 kPa, when two roots are both perpendicular to the shear plane (Figure 9c), the shear strength increases by 25.16 kPa when compared with that of rootless soil. When there are two roots on the shear plane, one perpendicular to the shear plane and the other at a certain angle to the shear plane (Figure 9d), the shear strength increases by 12.21 kPa when compared with that of rootless soil. This is less than the increase in shear strength when all roots are perpendicularly distributed. In general, the shear strength of roots in the composite distribution state is greater than that of the roots in the single distribution state when other conditions are consistent. However, the root forces generated during shearing may be influenced by root orientation, root length, root diameter, and the position of the roots relative to the direction of soil movement [48,49]. It is precisely because of the difference in root length and root diameter in this study that the shear strength of the roots in the composite distribution state is smaller than that of the roots in the single distribution state.
We used a small sample size and prototype sampling. However, the growth of plants in nature is not controlled by humans. The distribution of plant roots is complex, and the interaction between plant roots and soil is also complex. Therefore, only some of the effects of root distribution on soil shear strength were analyzed in this study, and the effects of other root distributions on soil shear strength require further investigation. For such studies, we have demonstrated that a good method is to construct a root model, take the root angle as a variable, and study the effect of the root angle on the shear strength using numerical simulation.

4.4. Calculation and Verification of Root Deflection Angle During Shearing

Under the action of shear stress, the roots are deflected in the direction opposite to that of shear stress. With an increase in shear displacement, the angle between the roots and the shear plane increases gradually. In this study, the deflection angle of the roots during the shear process of a typical specimen was calculated and verified by the measured values. The results are shown in Figure 10. As shown in the figure, the minimum relative error between the calculated value and the measured value is 0.02 and the maximum relative error is 0.16, which is considered to be within the allowable range in this study. Therefore, the magnitude of the root deflection angle during shearing can be calculated using Equations (5)–(10).
In this study, the root deflection angle of a single specimen during shearing was projected according to Equations (5)–(10). Figure 11 shows the relationship between the variation in Δ x and the variation in θ x during the shearing process for different initial root angles. The variation in Δ x is directly proportional to that in θ x . The larger the variation in Δ x , the larger the variation in θ x .

5. Conclusions

In this study, direct shear tests were conducted under four levels of normal stress on rootless soil and PA undisturbed root–soil composites with different root contents. The effects of different root contents on shear strength, cohesion, and internal friction angle of the root–soil composite were investigated. The main conclusions are as follows:
(1)
The shear stress–displacement curves of the rootless soil and PA root–soil composite specimens are of hardened and softened types. Before shear failure, the shear stress increased with the shear displacement, but the growth rate changed from fast to slow. In addition, the shear deformation resistances of rootless soil and root–soil composite specimens are different, with the root–soil composite having a stronger shear deformation resistance than rootless soil.
(2)
The shear strength of both rootless soil and the root–soil composite increased with increasing normal stress. The trend of shear strength with RAR under four levels of normal stress was more consistent, and an RAR of 0.14% was optimal in maximizing the shear strength of the root–soil composite within the range of 0~0.36%. Under the same normal stress, the shear strength of most root–soil composite specimens was higher than that of rootless soil, with growth rates ranging at 109.5~219.0% (25 kPa), 11.6~79.6% (50 kPa), 7.8~32.5% (100 kPa), and 13.5~26.5% (200 kPa).
(3)
The cohesion of root–soil composites with different root contents was greater than that of rootless soil, with a maximum growth rate of 440.1%. There is an optimum RAR of 0.14%, which maximizes the cohesion of the soil in the range of 0~0.36%. The internal friction angles of root–soil composites with different root contents did not differ significantly from that of the rootless soil. The increase in the shear strength of the root–soil composite was mainly due to the increase in cohesion.
(4)
The overall failure mode of the rootless soil is shear failure, in which the shear plane is not completely horizontal. Root–soil composite failure occurs when the root is pulled out of the soil. Under the action of shear stress, the roots are deflected in the direction opposite to the shear stress. With an increase in shear displacement, the angle between the roots and the shear plane gradually increases. The variation in Δ x is proportional to that of θ x .
The results deepen our understanding of the effect of vegetation roots on soil shear characteristics. Moreover, the determination of the optimal root content in root–soil composites can play a scientific role in guiding plant planting in the process of vegetation restoration. Through effective control of plant density and plant spacing, plant roots can reach or approach the optimal root content in the soil, which is helpful to maximize the soil consolidation and slope protection ability of plant roots. However, this study did not explore the internal mechanism of the roots affecting the cohesion of root–soil composites, and relevant research should be strengthened in the future.

Author Contributions

All of the authors contributed to the conception and design of this research. The material preparation, data collection, and analysis were performed by X.L. and Q.Z. X.L. wrote the first draft of the manuscript, which was revised by Q.Z. The visualization, data curation, and editing were performed by K.J., P.Q., C.L., X.Z. and Y.Z. All authors have read and agreed to the published version of the manuscript.

Funding

This research was supported by the Natural Science Foundation of Shandong Province (No. ZR2021ME167), the Government-sponsored Study Abroad Program of Shandong Provincial Education (No. 2024-13), the Key R&D Project of Xinjiang Production and Construction Corps (No. 2024AB074), the Key R&D Project of Shandong Province (No. 2022CXGC010401), and the Postgraduate Innovation Program of Qingdao Agricultural University (Grant QNYCX23031).

Institutional Review Board Statement

Not applicable.

Informed Consent Statement

Not applicable.

Data Availability Statement

The data presented in this study are available upon request from the corresponding author.

Conflicts of Interest

The authors declare that there are no conflicts of interest.

References

  1. Bardgett, R.D.; Mommer, L.; Vries, F.T.D. Going underground: Root traits as drivers of ecosystem processes. Trends Ecol. Evol. 2014, 29, 692–699. [Google Scholar] [CrossRef] [PubMed]
  2. Freschet, T.G.; Roumet, C. Sampling roots to capture plant and soil functions. Funct. Ecol. 2017, 31, 1506–1518. [Google Scholar] [CrossRef]
  3. Bassanelli, C.; Bischetti, G.B.; Chiaradia, E.A.; Rossi, L.; Vergani, C. The contribution of chestnut coppice forests on slope stability in abandoned territory: A case study. J. Agric. Eng. 2013, 44, 68–73. [Google Scholar] [CrossRef]
  4. Bordoni, M.; Meisina, C.; Vercesi, A.; Bischetti, G.B.; Chiaradia, E.A.; Vergani, C.; Chersich, S.; Valentino, R.; Bittelli, M.; Comolli, R.; et al. Quantifying the contribution of grapevine roots to soil mechanical reinforcement in an area susceptible to shallow landslides. Soil Tillage Res. 2016, 163, 195–206. [Google Scholar] [CrossRef]
  5. Brooks, H.; Möller, I.; Carr, S.; Chirol, C.; Christie, E.; Evans, B.; Spencer, K.L.; Spencer, T.; Royse, K. Resistance of salt marsh substrates to near-instantaneous hydrodynamic forcing. Earth Surf. Process. Landf. 2020, 46, 67–88. [Google Scholar] [CrossRef]
  6. Gyssels, G.; Poesen, J.; Bochet, E.; Li, Y. Impact of plant roots on the resistance of soils to erosion by water: A review. Prog. Phys. Geogr. 2005, 29, 189–217. [Google Scholar] [CrossRef]
  7. Mao, Z.J.; Bi, Y.L.; Geng, M.M.; An, N. Pull-out characteristics of herbaceous roots of alfalfa on the loess in different growth stages and their impacts on slope stability. Soil Tillage Res. 2023, 225, 105542. [Google Scholar] [CrossRef]
  8. Rossi, R.; Picuno, P.; Fagnano, M.; Amato, M. Soil reinforcement potential of cultivated cardoon (Cynara cardunculus L.): First data of root tensile strength and density. Catena 2022, 211, 106016. [Google Scholar] [CrossRef]
  9. Alam, S.; Manzur, T.; Borquist, E.; Williams, J.; Matthews, J.C. In-situ assessment of soil-root bonding strength to aid in preventing soil erosion. Soil Tillage Res. 2021, 213, 105140. [Google Scholar] [CrossRef]
  10. Docker, B.B.; Hubble, T.C.T. Quantifying root-reinforcement of river bank soils by four Australian tree species. Geomorphology 2008, 100, 401–418. [Google Scholar] [CrossRef]
  11. Ghestem, M.; Veylon, G.; Bernard, A.; Vanel, Q.; Stokes, A. Influence of plant root system morphology and architectural traits on soil shear resistance. Plant Soil 2014, 377, 43–61. [Google Scholar] [CrossRef]
  12. Wang, T.Y.; Guo, Q.L.; Pei, Q.Q.; Chen, W.W.; Wang, Y.W.; Zhang, B.; Yu, J. Destruction or protection? Experimental studies on the mechanism of biological soil crusts on the surfaces of earthen sites. Catena 2023, 227, 107096. [Google Scholar] [CrossRef]
  13. Xiong, D.W.; Chen, F.Q.; Lv, K.; Tan, X.Q.; Huang, Y.W. The performance and temporal dynamics of vegetation concretes comprising three herbaceous species in soil stabilization and slope protection. Ecol. Eng. 2023, 188, 106873. [Google Scholar] [CrossRef]
  14. Huang, M.; Sun, S.; Feng, K.; Lin, M.; Shuai, F.; Zhang, Y.; Lin, J.; Ge, H.; Jiang, F.; Huang, Y. Effects of Neyraudia reynaudiana roots on the soil shear strength of collapsing wall in benggang, southeast China. Catena 2022, 210, 105883. [Google Scholar] [CrossRef]
  15. Li, C.; Jia, Z.H.; Peng, X.N.; Zhai, L.; Zhang, B.; Liu, X.; Zhang, J.C. Functions of mineral-solubilizing microbes and a water retaining agent for the remediation of abandoned mine sites. Sci. Total Environ. 2021, 761, 143215. [Google Scholar] [CrossRef]
  16. Song, X.H.; Tan, Y. Experimental study on the stability of vegetated earthen slopes under intense rainfall. Soil Tillage Res. 2024, 238, 106028. [Google Scholar] [CrossRef]
  17. Baets, S.D.; Poesen, J.; Reubens, B.; Wemans, K.; Baerdemaeker, J.D.; Muys, B. Root tensile strength and root distribution of typical mediterranean plant species and their contribution to soil shear strength. Plant Soil 2008, 305, 207–226. [Google Scholar] [CrossRef]
  18. Comino, E.; Marengo, P.; Rolli, V. Root reinforcement effect of different grass species: A comparison between experimental and models results. Soil Tillage Res. 2010, 110, 60–68. [Google Scholar] [CrossRef]
  19. Forster, M.; Ugarte, C.; Lamandé, M.; Faucon, M.P. Root traits of crop species contributing to soil shear strength. Geoderma 2022, 409, 115642. [Google Scholar] [CrossRef]
  20. Liu, Y.F.; Meng, L.C.; Huang, Z.; Shi, Z.H.; Wu, G.L. Contribution of fine roots mechanical property of Poaceae grasses to soil erosion resistance on the Loess Plateau. Geoderma 2022, 426, 116122. [Google Scholar] [CrossRef]
  21. Su, X.M.; Zhou, Z.C.; Liu, J.E.; Wang, P.P.; Liu, J.Y.; Li, Q.J.; Zhao, F.W. The role of roots traits of climax community species to shear strength in the Loess Hilly Region, China. Soil Tillage Res. 2022, 221, 105417. [Google Scholar] [CrossRef]
  22. Wang, Y.; Jin, Y.L.; Liang, X.L.; Liu, X.; Tan, B.; He, S.Q.; Zheng, J.K.; Hou, G.R.; Zhang, Y.Q. Fragmentation of soil-root complexes in sloping landscapes during tillage and soil translocation. Biosyst. Eng. 2022, 223, 116–128. [Google Scholar] [CrossRef]
  23. Gobinath, R.; Ganapathy, G.P.; Akinwumi, I.I. Stabilisation of natural slopes using natural plant root as reinforcing agent. Mater. Today Proc. 2021, 39, 493–499. [Google Scholar] [CrossRef]
  24. Zhu, H.B.; Zhao, H.R.; Bai, L.Z.; Ma, S.A.; Zhang, X.; Li, H. Mechanical characteristics of rice root-soil complex in rice-wheat rotation area. Agriculture 2022, 12, 1045. [Google Scholar] [CrossRef]
  25. Brooks, H.; Moeller, I.; Spencer, T.; Royse, K.; Price, S.; Kirkham, M. How strong are salt marshes? Geotechnical properties of coastal wetland soils. Earth Surf. Process. Landf. 2022, 47, 1390–1408. [Google Scholar] [CrossRef]
  26. Gonzalez-Ollauri, A.; Mickovski, S.B. Plant-soil reinforcement response under different soil hydrological regimes. Geoderma 2017, 285, 141–150. [Google Scholar] [CrossRef]
  27. Zhu, J.Q.; Mao, Z.; Wang, Y.Q.; Wang, Y.J.; Li, T.; Wang, K.; Langendoen, E.J.; Zheng, B.F. Soil moisture and hysteresis affect both magnitude and efficiency of root reinforcement. Catena 2022, 219, 106574. [Google Scholar] [CrossRef]
  28. Burak, E.; Dodd, I.C.; Quinton, J.N. Do root hairs of barley and maize roots reinforce soil under shear stress? Geoderma 2021, 383, 114740. [Google Scholar] [CrossRef]
  29. Bengough, A.G.; Mckenzie, B.M.; Hallett, P.D.; Valentine, T.A. Root elongation, water stress, and mechanical impedance: A review of limiting stresses and beneficial root tip traits. J. Exp. Bot. 2011, 62, 59–68. [Google Scholar] [CrossRef]
  30. Xu, Z.H.; Zhang, Y.; Tao, Z.P.; Zha, L.L.; Chen, Y.Y. Mechanical characteristics of undisturbed roots soil composites from the Source Area of Lanniqing Landslide, Zhaotong. J. Soil Water Conserv. 2022, 36, 128–134. (In Chinese) [Google Scholar]
  31. Chen, Y.; Thompson, C.E.L.; Collins, M.B. Saltmarsh creek bank stability: Biostabilisation and consolidation with depth. Cont. Shelf Res. 2012, 35, 64–74. [Google Scholar] [CrossRef]
  32. Chirol, C.; Spencer, K.L.; Carr, S.J.; Mller, I.; Evans, B.; Lynch, J.; Brooks, H.; Royse, K.R. Effect of vegetation cover and sediment type on 3d subsurface structure and shear strength in saltmarshes. Earth Surf. Process. Landf. 2021, 46, 2279–2297. [Google Scholar] [CrossRef]
  33. Gray, D.H.; Leiser, A.T. Biotechnical Slope Protection and Erosion Control; Van Nostrand Reinhold Co.: New York, NY, USA, 1982. [Google Scholar]
  34. Xu, T.; Liu, C.Y.; Hu, X.S.; Zhou, L.H.; Shen, Z.Y.; Yu, D.M. Study on the Mechanical Properties of Roots and the Shear Strengths of Four Halophytic Plants in Qaidam Basin. Res. Soil Water Conserv. 2021, 28, 101–110. (In Chinese) [Google Scholar]
  35. Qi, Z.X.; Yu, D.M.; Liu, Y.B.; Fu, J.T.; Hu, X.S.; Li, S.X.; Zhao, D. Experimental research on factors affecting shear strength of halophyte root-soil composite systems in cold and arid environments. J. Eng. Geol. 2017, 25, 1438–1448. (In Chinese) [Google Scholar]
  36. Yu, G.A.; Li, Z.W.; Yang, H.Y.; Lu, J.Y.; Huang, H.Q.; Yi, Y.J. Effects of riparian plant roots on the unconsolidated bank stability of meandering channels in the Tarim River, China. Geomorphology 2020, 351, 106958. [Google Scholar] [CrossRef]
  37. Ni, J.J.; Leung, A.K.; Ng, C.W.W. Influences of plant spacing on root tensile strength of Schefflera arboricola and soil shear strength. Landsc. Ecol. Eng. 2019, 15, 223–230. [Google Scholar] [CrossRef]
  38. GB/T 50123-2019; Standard for Geotechnical Testing Method. Ministry of Housing and Urban-Rural Development of the People’s Republic of China: Beijing, China, 2019; pp. 8–20. (In Chinese)
  39. Meng, X.; Jia, Y.; Shan, H.; Yang, Z.; Zheng, J. An experimental study on erodibility of intertidal sediments in the yellow river delta. Int. J. Sediment Res. 2012, 27, 240–249. [Google Scholar] [CrossRef]
  40. Liu, H.L.; Jia, Y.G.; Zhang, S.T.; Shan, H.X.; Xue, L.; Sun, Z.W.; Quan, Y.Z.; Li, Z.H.; Chen, T.; Tian, Z.C.; et al. Field measurement of the erosion threshold of silty seabed in the intertidal flat of the Yellow River Delta with a newly developed annular flume. Front. Mar. Sci. 2023, 10, 1177241. [Google Scholar] [CrossRef]
  41. Tan, H.M.; Chen, F.M.; Chen, J.; Gao, Y.F. Direct shear tests of shear strength of soils reinforced by geomats and plant roots. Geotext. Geomembr. 2019, 47, 103491. [Google Scholar] [CrossRef]
  42. Wang, X.H.; Ma, C.; Wang, Y.Q.; Wang, Y.J.; Li, T.; Dai, Z.S.; Li, M.Y. Effect of root architecture on rainfall threshold for slope stability: Variabilities in saturated hydraulic conductivity and strength of root-soil composite. Landslides 2020, 17, 1965–1977. [Google Scholar] [CrossRef]
  43. Docker, B.B.; Hubble, T.C.T. Modelling the distribution of enhanced soil shear strength beneath riparian trees of Southeastern Australia. Ecol. Eng. 2009, 35, 921–934. [Google Scholar] [CrossRef]
  44. Mahannopkul, K.; Jotisankasa, A. Influences of root concentration and suction on Chrysopogon zizanioides reinforcement of soil. Soils Found. 2019, 59, 500–516. [Google Scholar] [CrossRef]
  45. Hamidifar, H.; Keshavarzi, A.; Truong, P. Enhancement of river bank shear strength parameters using Vetiver grass root system. Arabian J. Geosci. 2018, 11, 611. [Google Scholar] [CrossRef]
  46. Zong, Q.L.; Feng, B.; Cai, H.B.; Chen, Z.K.; Wang, J.X. Mechanism of riverbank protection by desert riparian vegetation roots in Tarim River basin. Chin. J. Rock Mech. Eng. 2018, 37, 1290–1300. (In Chinese) [Google Scholar]
  47. Hu, M.; Li, W.P.; Shi, H.B.; Liang, J.C. Effects of Root Layout and Diameter on Shear Performance in Root-Soil Composite. Bull. Soil Water Conserv. 2012, 32, 42–44. (In Chinese) [Google Scholar]
  48. Schwarz, M.; Cohen, D.; Or, D. Root–soil mechanical interactions during pullout and failure of root bundles. J. Geophys. Res. 2010, 115, F04035. [Google Scholar] [CrossRef]
  49. Fan, C.C. A displacement-based model for estimating the shear resistance of root-permeated soils. Plant Soil 2012, 355, 103–119. [Google Scholar] [CrossRef]
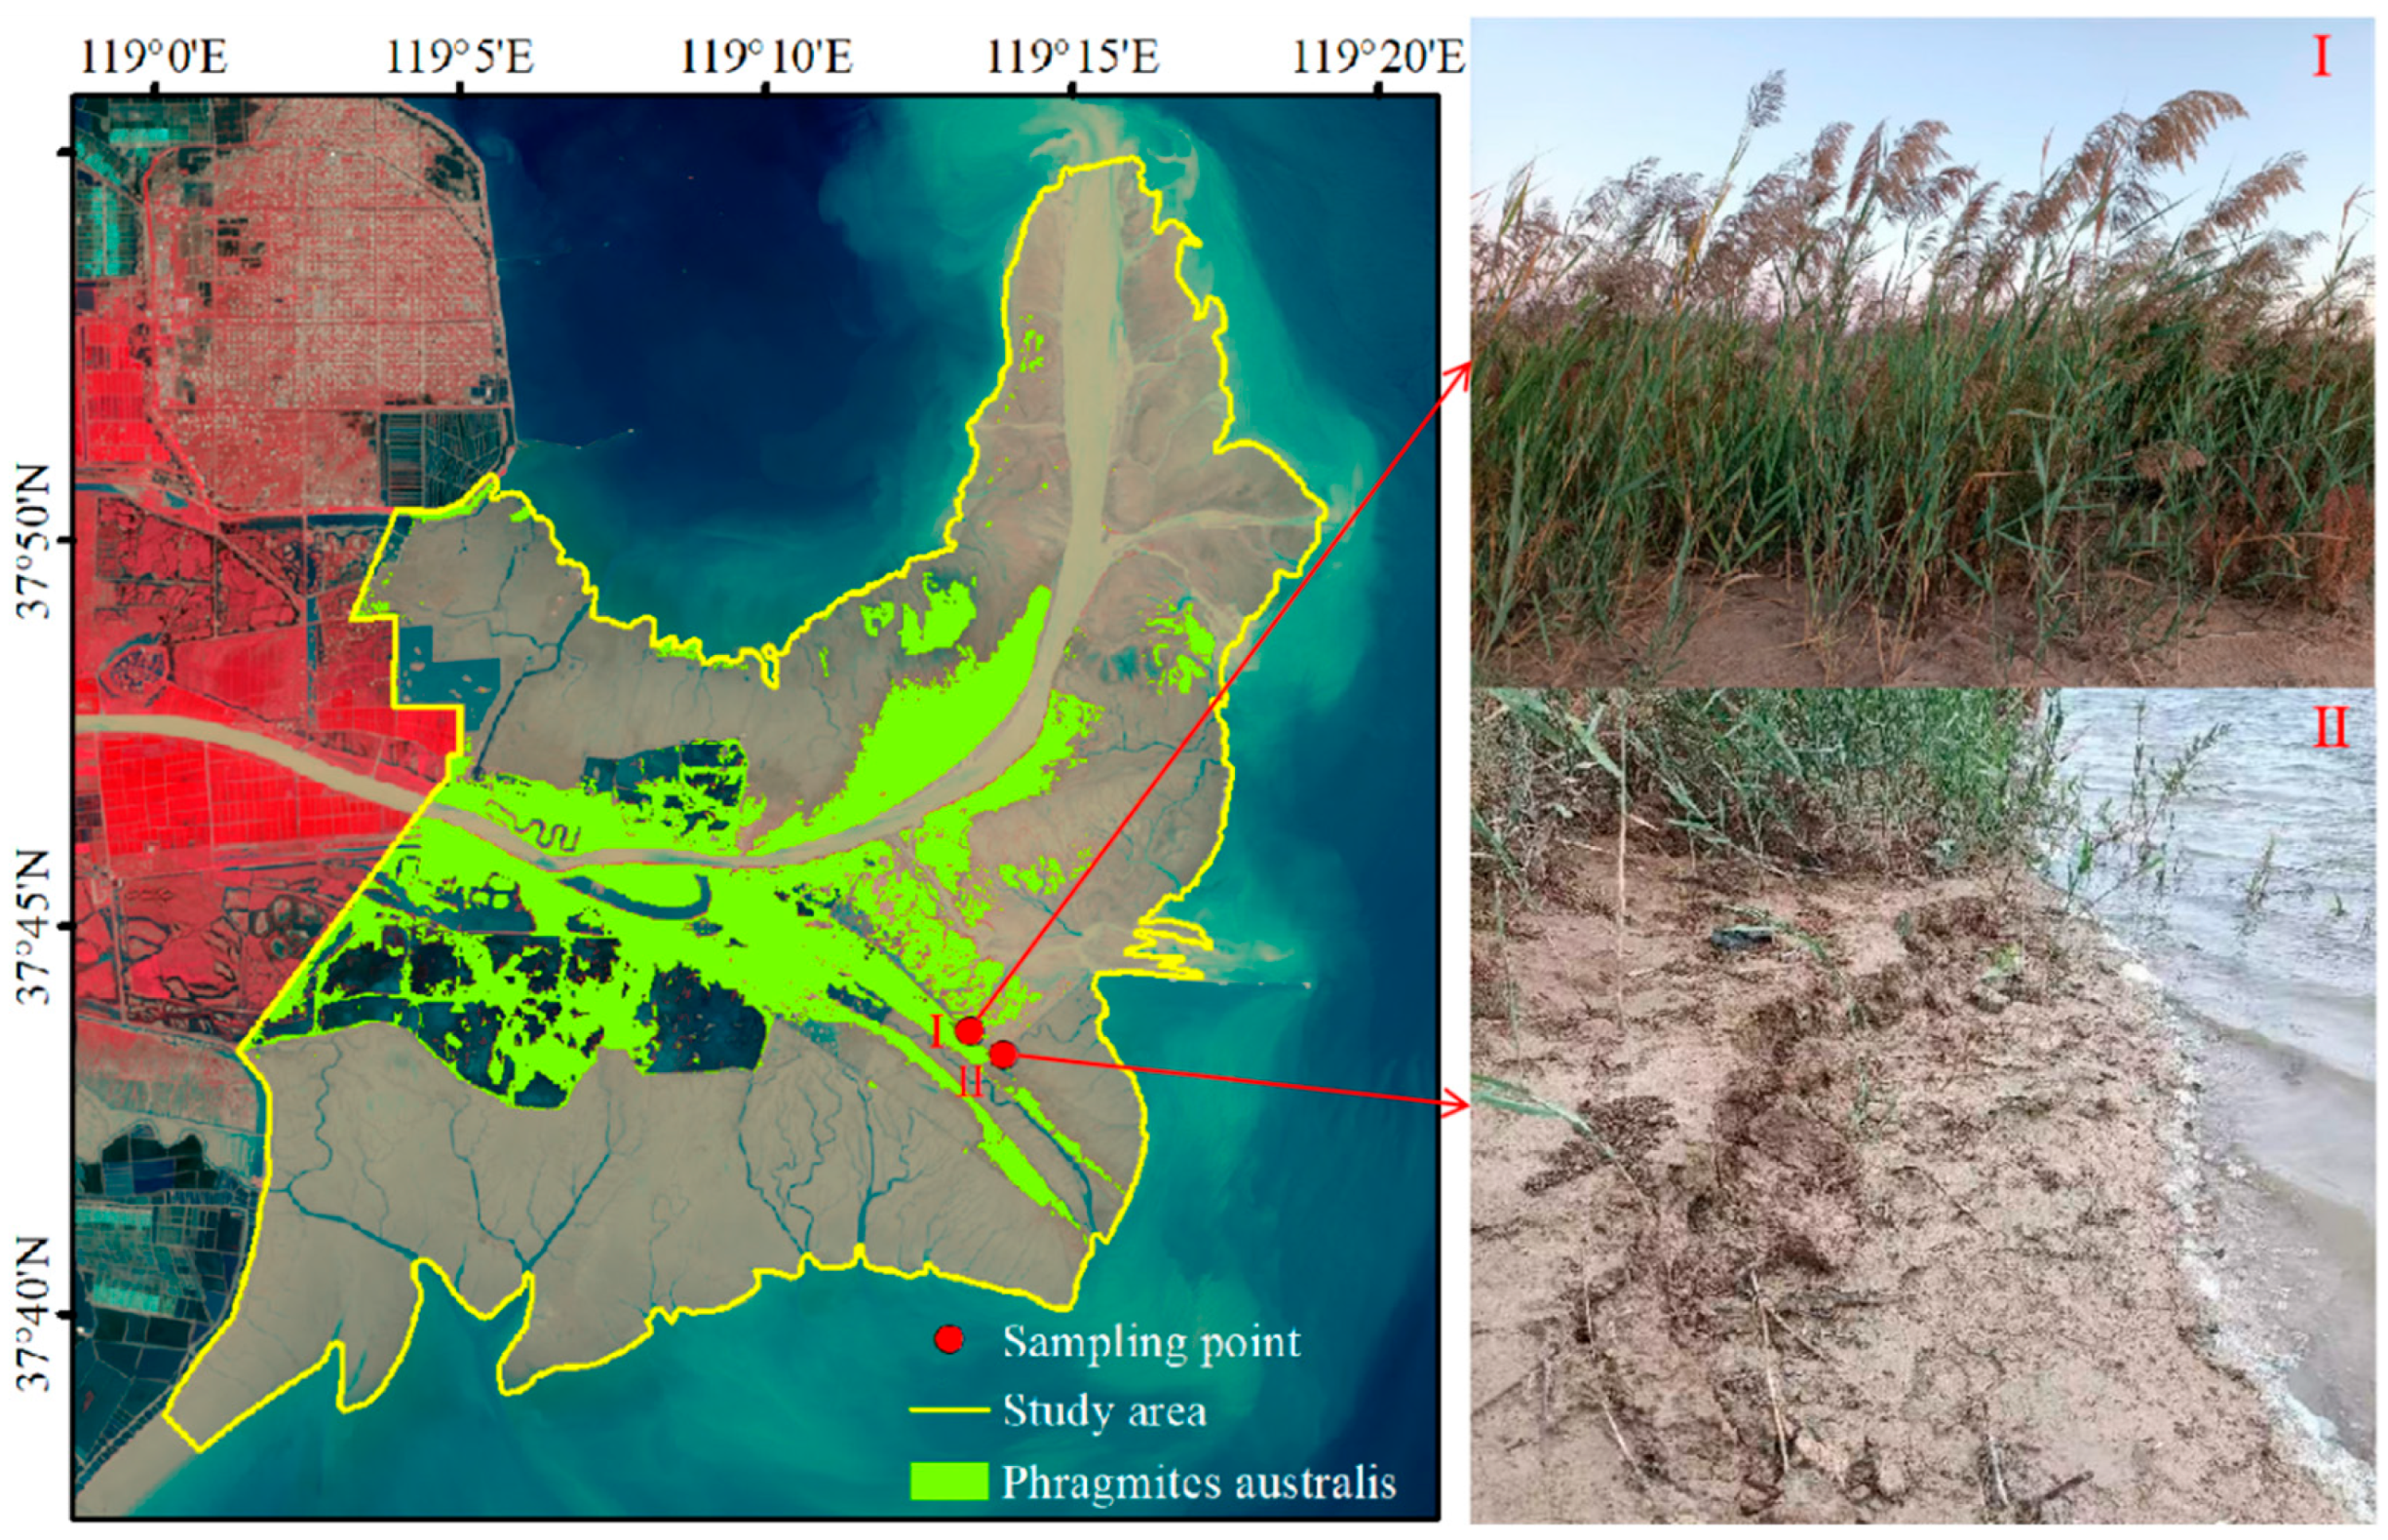
Figure 1. Study area and distribution of the sampling points.
Sustainability 16 10657 g001
Figure 2. Soil particle distribution at the test site.
Sustainability 16 10657 g002
Figure 3. Determination of root distribution: (a) recording root coordinates; (b) measuring the angle before shearing; (c) measuring the angle after shearing. Roots are marked by red circles and boxes.
Sustainability 16 10657 g003
Figure 4. Single root distribution model: (a) θ 0 < 90°; (b) θ 0 = 90°; (c) θ 0 > 90°.
Sustainability 16 10657 g004
Figure 5. Shear stress–displacement curves for σ of (a) 25 kPa; (b) 50 kPa; (c) 100 kPa; (d) 200 kPa.
Sustainability 16 10657 g005
Figure 6. Relationship between shear strength and RAR for each normal stress. RAR = 0%: rootless soil; RAR > 0%: root–soil composites.
Sustainability 16 10657 g006
Figure 7. (a) Growth and (b) growth rate of shear strength when compared with rootless soil. The growth rate is the ratio of the shear strength’s growth in the root–soil composites relative to the rootless soil and the shear strength of the rootless soil, and the normalizing control group is the rootless soil.
Sustainability 16 10657 g007
Figure 8. Shear failure of the sample under 25 kPa normal stress for root diameter d of (a) 3.4 mm; (b) 4.4 mm; (c) 5.2 mm; (d) ① 5.9 mm; ② 4.7 mm; (e) ① 6.3 mm; ② 5.3 mm; (f) ① 3.7 mm; ② 5.3 mm; (g) rootless soil; (h) 3.2 mm. In (df), the composite contains two roots.
Sustainability 16 10657 g008
Figure 9. Root distribution for θ of (a) 0°; (b) 90°; (c) ① 90°; ② 90°; (d) ① 90°; ② 65°.
Sustainability 16 10657 g009
Figure 10. Calculated and measured values of the model.
Sustainability 16 10657 g010
Figure 11. The relationship between the variation in Δ x and θ x .
Sustainability 16 10657 g011
Table 1. Field sampling of basic physical indices.
Serial NumberCoordinates of Sampling PointRoot NumberAverage Root Diameter (mm)RAR (%)Dry Density (g/cm3)Water Content (%)
I119°12′58″ E, 37°43′23″ N0001.4921.3
53.320.061.5622.8
II119°13′31″ E, 37°43′4″ N64.640.141.5522.5
74.710.171.5026.5
65.370.191.5624.6
85.150.241.5625.3
105.760.361.5824.3
Note: RAR (root area ratio) stands for root content (%).
Table 2. Growth rate of shear strength with normal stress for the same root content.
RAR/%Growth Rate/%
25 50 kPa50 100 kPa100 200 kPa
0157.1113.461.2
0.0675.045.887.8
0.1494.057.553.8
0.1716.461.281.3
0.19−4.485.589.7
0.2485.142.878.5
0.3677.358.674.7
Note: The growth rate is the ratio of the shear strength’s growth of the latter normal stress relative to the former normal stress and the shear strength of the former normal stress.
Table 3. Shear indices of rootless soil and root–soil composites.
RAR/%Relationship Between Normal Stress and Shear StrengthR2c/kPac Growth
/kPa
c Growth Rate/%φ
0 τ f = σ tan 2 8.9 + 4.25 0.97654.250028.9
0.06 τ f = σ tan 2 9.0 + 14.22 0.995114.229.97234.829.0
0.14 τ f = σ tan 3 1.2 + 22.94 0.975922.9418.69440.131.2
0.17 τ f = σ tan 2 9.4 + 21.46 0.993021.4617.21405.329.4
0.19 τ f = σ tan 2 8.3 + 16.04 0.975316.0411.80277.728.3
0.24 τ f = σ tan 2 9.8 + 17.71 0.992117.7113.47317.129.8
0.36 τ f = σ tan 3 0.5 + 15.45 0.996615.4511.21263.930.5
Note: The growth rate is the ratio of the cohesion’s growth in the root–soil composites relative to the rootless soil and the cohesion of the rootless soil, and the normalizing control group is the rootless soil. RAR: root area ratio; c: cohesion; φ: internal friction angle.
Disclaimer/Publisher’s Note: The statements, opinions and data contained in all publications are solely those of the individual author(s) and contributor(s) and not of MDPI and/or the editor(s). MDPI and/or the editor(s) disclaim responsibility for any injury to people or property resulting from any ideas, methods, instructions or products referred to in the content.