Abstract
In order to improve the sustainability of manufacturing enterprises and solve the problem of “excess production capacity in the off-season and insufficient production capacity in the busy season”, this study investigates the optimal practices for supply chain dynamic pricing and capacity co-ordination when there are differences in product cost and product demand during nonbusy seasons, and it proposes the optimal capacity decision-making method for manufacturers. The results show the following: (1) A manufacturer in a high-capacity state has lots of excess capacity, so no strategic inventory co-ordination is required. (2) When a manufacturer is in a medium-capacity state, it can co-ordinate the production capacity in the nonbusy season through capacity allocation, achieve balanced production scheduling, and improve the sustainability of the manufacturer’s operation; the lower the manufacturer’s capacity, the higher the manufacturer’s strategic inventory quantity. (3) When the manufacturer is in a state of low capacity, the manufacturer uses all production capacity but still cannot satisfy off-season and busy season demand at the same time; the manufacturer will reduce product demand by increasing product prices and according to the unit product marginal income of the decision-making capacity allocation in the nonbusy season, the distribution ratio is related to the manufacturer’s capacity and product parameters. (4) Three optimal production capacity decision schemes for manufacturers under different production costs and inventory costs are obtained.
1. Introduce
The market demand for seasonal products will fluctuate significantly over different periods due to social, cultural, and ecological causes. There will be a clear off-season and busy season. When it comes to products such as ice cream [1] and other items where demand varies significantly during nonbusy seasons, manufacturers who have high capacity will waste a significant amount of capacity while those that have medium capacity will typically experience an imbalance between supply and demand, resulting in “overcapacity in the off-season and insufficient capacity in the busy season” [2]. When the capacity of manufacturers is too low, they often face a situation where the off-season and busy season cannot meet market demand. Whether supply exceeds or falls short of demand, there is still an imbalance of supply and demand [3]. At the manufacturer level, the imbalance between supply and demand will cause enterprises to produce a lot of capacity waste or lose more orders. Manufacturing enterprises will even show the phenomenon of “overcapacity in the off-season, insufficient capacity in the busy season”, which is not conducive to the sustainable development of enterprises. At the supply-chain level, the imbalance between supply and demand will destabilize the supply chain, destabilizing the supply capacity and reducing supply chain resilience. An unstable supply chain will make consumers quickly lose interest in it, making the whole supply chain system unable to develop sustainably.
To solve this problem, manufacturers usually adopt the production model of “production in the off-season and sales in the busy season” and realize capacity allocation between the off-season and busy seasons through strategic inventory management [4] to achieve two-period supply chain operation to balanced production [5]. Through inventory co-ordination, we can reduce production capacity waste in the off-season and improve capacity utilization, which can improve the profitability of manufacturing enterprises and improve the sustainable development of enterprises. However, the corresponding product raw material prices, product sales costs, and product sales price discrepancies will vary with different production and sales times. This is because manufacturers often adopt the strategy of increasing product prices when there is high demand, while they frequently resort to price reduction sales during periods of low demand [6]. The disparity in product demand between busy and off-seasons necessitates the implementation of two distinct pricing models for the same product. Additionally, the production cost of a product is influenced by both its demand and raw material characteristics. For instance, ice cream products have a sales season from May to October and an off-season from November to April; however, raw milk experiences its busy season in February and March annually. Consequently, ice cream products exhibit lower production costs during the off-season but higher production costs during the busy season. Different circumstances lead to three different forms of product profit: the difference between the off-season price and cost, the busy season price and cost, and the busy season price and the sum of off-season cost and inventory cost. These possible situations are caused by changes in the product cost and price between the off-season and busy season. Second, the prices of products during the nonbusy period will influence consumer demand, which will subsequently have an effect on the manufacturer’s plans for production. Therefore, it has become necessary to find an equilibrium for how to allocate production capacity between the nonbusy season while taking into account the manufacturer’s capacity scale, inventory costs, market demand, production costs, and other factors when determining the nonbusy season product prices.
Furthermore, possessing too much capacity will increase capacity waste in the off-season and decrease capacity shortage during the busy season. Conversely, manufacturers with low capacity will waste less of their off-season capacity, tightening capacity during the busy season. These additional costs include fixed losses and equipment maintenance costs. This makes it more difficult for manufacturers to satisfy market demand and finish their production plans. A reasonable and scientific capacity decision scheme will improve the sustainability of manufacturing enterprises. Therefore, one of the main research issues at hand is how to determine capacity when the supply and demand of seasonal products are out of balance.
However, the literature is mainly based on the state where the production capacity of the manufacturer is fully sufficient [7,8,9,10,11,12,13,14] or completely insufficient [15], but the change in the production capacity of the manufacturer caused by an excessive difference in product demand in different periods is a problem that has rarely been studied. In actual production, decision-makers mainly rely on historical data and experience to solve the above problems and lack corresponding quantitative analysis methods. Based on the above research background, this study incorporates the capacity inco-ordination problem into the busy and nonbusy supply chain system, and it uses the manufacturer’s inventory strategy to achieve capacity adjustment between busy and nonbusy periods. At the same time, the impact of factors such as the manufacturer’s capacity change, inventory cost, market demand difference in the busy and nonbusy seasons, and product cost change in the busy and nonbusy seasons on supply chain pricing and inventory strategy is considered. The optimal capacity maintenance quantity of manufacturers is analyzed to provide a theoretical reference for manufacturing enterprises to make relevant decisions.
In summary, in view of the shortcomings of previous studies, this study takes into account the demand difference for seasonal products between the busy and nonbusy seasons, as well as the manufacturers’ capacity constraints. It also establishes a two-period supply chain with an off-season and busy-season period, uses the manufacturer’s strategic inventory to achieve capacity allocation, and investigates the influence of demand and product cost differences on supply chain members’ decision-making. According to whether there will be a supply and demand imbalance and whether a strategic inventory can be used to achieve capacity allocation in the nonbusy season, the capacity of manufacturers is divided into three states in this study: high, medium, and low. This study intends to solve the following problems:
- (1)
- For manufacturers, where is the crucial threshold where there is “overcapacity in the off-season and insufficient capacity in the busy season”?
- (2)
- How should manufacturers decide on product prices, production plans, and the quantity of inventory during the off-season when using strategic inventory to achieve off-season capacity allocation, given the problem of “overcapacity in the off-season and insufficient capacity in the busy season”? How do retailers determine their retail prices?
- (3)
- How do manufacturing capacity, manufacturer profit, and manufacturer strategic inventory relate to each other?
- (4)
- How do changes in product production parameters affect manufacturers’ optimal capacity decisions?
2. Literature Review
There are many studies on two-period supply chains in academia, but most of them do not consider the large demand difference between different cycles, and in the studies considering the demand difference in different cycles, the impact of supply and demand imbalance on supply chain decision-making is rarely considered. For example, Ahn et al. [11] studied the influence of the price reference effect on product pricing and production pricing between multiple cycles. Maiti et al. [12] compared and analyzed the influence of two different pricing strategies adopted by manufacturers in a two-cycle supply chain on retailers’ decision-making and supply chain product demand. The above studies assume that market size is fixed in different cycles and did not consider the large differences in product demand of seasonal products in different cycles. Zhao et al. [13] studied the influence of information sharing and information flaws between retailers and manufacturers on the decision-making of supply chain members in the context of two-cycle demand fluctuations. Li and Chen et al. [14] divided the game period into the parity period and the price reduction period, in which the retailer sold the returned or replaced products during the price reduction period and studied the impact of the retailer’s implementation of the product return or exchange policy. Dey and Saha [15] studied the pricing decision of a two-stage supply chain and its impact on the green level of products under three different production and sales situations: production in the first cycle, storage of surplus products after sale in the first cycle, production in the second cycle, and sale of new products and inventory in the second cycle. The first and second cycles are produced, but they are sold in this cycle, and there is no inventory. The first cycle of production contains one and two cycles of sales, but the second cycle does not produce any. While they take into account the differences in demand between cycles, their studies are based on manufacturers having sufficient capacity to meet all production needs and do not take into account the capacity constraints of manufacturers. Fattahi et al. [16] studied the design and planning of the multi-period, multi-level, and multi-product supply chain network with price-sensitive demand, and they proposed a method to decide product price and capacity based on the relationship between price and demand. However, their model did not take into account the production waste caused by overcapacity and did not consider the use of strategic inventory to achieve balanced production scheduling and reduce production waste. Under the condition of uncertain demand, Ariningsih et al. [17] used the two-stage stochastic programming method to study the replenishment cycle and capacity expansion of perishable vaccines between different distribution networks by using strategic inventory to buffer demand uncertainty. However, the impact of the replenishment cycle and strategic inventory quantity on production capacity has not been studied. CAI et al. [18] established a competitive two-phase supply chain model consisting of one supplier and two retailers, and they studied the capacity allocation problem of suppliers under the condition of a minimum order quantity of retailers. However, they assumed that suppliers have insufficient capacity in both cycles and do not consider the imbalance between supply and demand and the existence of excess capacity between different cycles.
In terms of seasonal product research, most of the literature focuses on optimal production [19], pricing [20], order management [21], and forecasting [22] under demand fluctuations, but the supply–demand imbalance of seasonal products is rarely considered in conjunction with multi-cycle operational decisions. For example, Chen et al. [2] established a single-cycle game supply chain consisting of a single supplier and a single retailer in the context of resource constraints for manufacturers, and they studied the co-ordination problem of the supply chain of seasonal products with out-of-stock penalties. Sisley et al. [23] established a fresh food supply chain model considering multiple cycles, levels, and types to study the impact of the seasonal characteristics of fresh food on product demand. However, the above studies use a year as the production planning decision-making cycle or game cycle, and they do not consider the internal demand difference between the busy and low seasons of the year. Liu [24] considered the different prices of seasonal products in different sales cycles, studied the impact of price changes on supply chain decision-making, and analyzed the use of the price commitment strategy in dynamic contracts with multiple cycles and a limited time range. However, all studies were based on the fact that the production capacity of manufacturers could independently meet the demand in the current quarter. They do not take into account the fact that manufacturers may have to raise the wholesale price of busy-season products due to the imbalance between supply and demand. Guo et al. [22] used a hybrid approach combining the Prophet and SVR models to forecast seasonal product demand and provide support for manufacturer planning, capacity, and inventory control decisions. Borucka and Anna [25], respectively, used the seasonal autoregressive comprehensive moving average (ARIMA) model and ARIMA with the Fourier term to forecast seasonal product demand. However, the above prediction models do not consider the impact of product price changes on product demand, while in actual production and operation, manufacturers often use the method of price control to control demand, and price decisions and capacity decisions affect each other. Peng et al. [26] took the three-channel supply chain under the dual price regulation as the research object, conducted dual pricing between nonbusy and busy seasons, and studied the co-ordination and risk sharing among multiple channels when a certain channel had insufficient capacity in busy seasons. It does not consider the use of off-season excess capacity to make up for the lack of production capacity in the busy season, and the problem of high production waste in the off-season has not been solved.
As shown in Table 1, we summarize the literature regarding the seasonal product supply chain.

Table 1.
Summary of the related literature regarding seasonal product supply chain.
The existing literature on two-period supply chains is mainly based on the state that the production capacity of the manufacturer is fully sufficient or completely insufficient and rarely studies the problem of the production capacity of the manufacturer caused by the excessive difference in product demand in different periods. Most studies on seasonal products take product demand fluctuations into account, but few studies combine product demand fluctuations with sales periods. According to the characteristics of sales periods, this paper considers the differences in price, demand, and cost between different periods and adopts an inventory strategy to realize the overall planning of production and supply in different cycles so as to realize the sustainable development of manufacturers.
3. Model Description
3.1. Problem Description
This section establishes a two-period supply chain model in which producers use strategic inventory to deal with capacity inco-ordination and take notice of the differences in product costs during nonbusy seasons. Our model consists of a single manufacturer () and a single retailer (). is the dominating player in the Stackelberg game and sells products wholesale to the retailer, while is a follower and sells the product to customer . The supply chain system engages in a two-period Stackelberg game during the busy and low seasons.
Busy-season products are in high demand, while off-season products are in low demand. The manufacturer’s capacity is constant for both busy and off-seasons. A manufacturer that faces the challenge of having “overcapacity in the off-season and insufficient capacity in the busy season” determines what inventory to carry in the off-season, produces and stores the surplus capacity, and then sells it during the busy season.
We model the decision problem as a two-period supply chain with nonbusy season demand differences. In the off-season, , the manufacturer produces a single type of product at a cost of per unit and sells it to the retailer at a wholesale price, , per unit. The retailer sells the product to customers at a selling price, , per unit. In the peak season, , the manufacturer produces the same type of product as in the off-season at a cost of per unit and then sells all of the strategic inventory product and the product that was produced in the busy season to the retailer at a wholesale price, . The retailer sells the product to customers at a selling price, . The manufacturer should decide jointly on off-season output, , busy season output, , and strategic inventory quantity, , based on nonbusy season demand and manufacturer capacity to prevent the issue of capacity inco-ordination. The supply chain structure is shown in Figure 1.
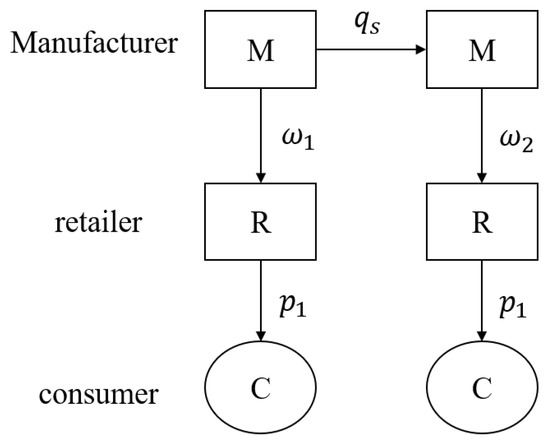
Figure 1.
Two-period supply chain model.
If the manufacturer has “overcapacity in the off-season and insufficient capacity in the busy season”, the manufacturer needs to adopt the pressure mode and use strategic inventory to achieve off-season capacity allocation. The products sold in the busy season include strategic stock products and new products, the costs of which are and , respectively. Therefore, manufacturers need to comprehensively consider the cost of strategic inventory products and new products to decide the wholesale price of busy season products. Therefore, the average cost of products sold in the busy season is , where is the proportion of strategic inventory products in the total number of products sold in the busy season.
The parameters and decision variables used in the proposed model are listed in Table 2:

Table 2.
List of notations.
3.2. Assumptions
- 1.
- The market demand is deterministic and linearly dependent on the selling price of the product, and the selling price is negatively related to the market. Thus, we take market demand as follows [27]:where and (, off-season; , busy season) are the product consumer effect and price sensitivity coefficients, respectively. The product consumer effect in the busy season is higher than that in the off-season, ; we refer to the views of the authors of [28,29], making the price sensitivity coefficients in the busy season lower than those in the off-season ().
- 2.
- Remanufacturing a product in the off-season is less costly than manufacturing a product in the busy season, The price of raw materials will fluctuate due to the different demands for raw materials during the busy and off-seasons, which is also influenced by the seasonal characteristics of raw materials. As a result, the production costs of products during the busy and off-seasons differ, with busy season costs being higher than off-season costs.
- 3.
- The manufacturer produces the same products during the off-season and busy season. Additionally, because the product has a lengthy shelf life, fluctuations between the two seasons will not diminish its practical value, meaning that the inventory products sold during the busy season are consistent with the new products.
- 4.
- The capacity that we are discussing is specific to a single product and is not applicable to the production of other types of products. Furthermore, when determining the optimal strategic inventory, we do not take the manufacturer’s maximum storage capacity into account.
- 5.
- The total production and inventory costs during the off-season are higher than the production costs during the busy season, . If it is not necessary, the manufacturer will not overproduce during the off-season. can ensure that, even at a busy season price of , demand will remain higher than zero, meaning that a product manufactured in the off-season will still turn a profit when sold during the busy season.
4. Model Formulation and Analysis
Based on the above analysis, the objective function of manufacturer is given by
The objective function of retailer is given by
We use the inverse solution method to solve the problem. By solving for , we obtain
Firstly, the manufacturer makes a decision on the wholesale prices in the off- and busy seasons, respectively. By substituting expressions (7) and (8) into the manufacturer’s objective function, and according to the optimal condition of the manufacturer’s objective function, we obtain
Secondly, by substituting (9) and (10) into (7) and (8), we obtain the retail price as follows:
By substituting (11) and (12) into (1) and (2), we obtain the market demand functions as follows:
Expressions (9)–(14) are all functions with respect to ; the solution of is directly related to capacity, ; upon substituting these into (3)–(6), we obtain the manufacturer’s objective function with respect to and the retailer’s objective function with respect to .
The manufacturer’s objective function with respect to is as follows:
The retailer’s objective function with respect to is as follows:
where ; and .
By taking the partial derivative of (15) with respect to and setting it to zero, we obtain ; taking the second partial derivative of (15) with respect to , we obtain . Therefore, is a monotonically decreasing convex function with respect to over the interval [0, 1]. The optimal solution of is the minimum of the feasible regain.
Expression (15) shows that, under the condition of , if , the feasible region of (15) with respect to is ; if , the feasible region of (15) with respect to is ; and if , the feasible region of (15) with respect to is . In addition, as can be seen from (18), (17) always has a solution.
4.1. Manufacturer’s High-Capacity State
In a high-capacity state, the manufacturer can satisfy seasonal demand for its products with its off- and busy-season capacity, respectively. The manufacturer also avoids the issue of insufficient capacity during the busy season, negating the need for strategic inventory to co-ordinate off- and busy-season capacity. However, manufacturers have significant overcapacity during the off-season and even during the busy season.
Proposition 1.
If , the manufacturer is in a high-capacity state. The optimal proportion of strategic inventory products sell in the busy season , that is, strategic inventory . The wholesale price during the off- and busy seasons, respectively, is
and , and the selling price during the off- and busy seasons is and , respectively. The optimal product demand during the off- and busy seasons, respectively, is and . The optimal profit for the retailer is , and that for the manufacturer is .
Proof.
If , the feasible region of (15) with respect to is ; because the optimal solution of is the minimum value of its feasible region, we can obtain . In addition, by substituting into expressions (9), (11)–(15) and (17), we can obtain , , , , , , , and . □
According to Proposition 1, a manufacturer can satisfy the product demand for the corresponding season when their capacity exceeds . In a state of high capacity, the manufacturer will not produce more than the demand in the off-season and will have no strategic inventory because the cost of products produced in the off-season and sold in the busy season is more than the cost of product production in the busy season. In addition, the manufacturer’s capacity is higher than the optimal demand in the busy season.
Corollary 1.
If , , , , , , , , and .
Proof.
By taking the first-order derivative of with respect to , we can obtain the above results. □
As demonstrated by Corollary 1, if , the relationship between the manufacturer’s capacity change and the optimal profit of the retailer, the manufacturer’s optimal profit and the retailer, the optimal market demand during the nonbusy season, and the manufacturer’s optimal profit is negative. When , the manufacturer’s capacity is sufficient; however, the manufacturer cannot utilize its whole capacity during either the busy or off-seasons, resulting in production waste during the off-season. Manufacturers can decrease production capacity and production waste, which will increase profits, but they also have to pay higher maintenance costs for that capacity. Consequently, at this point, the manufacturer’s optimal capacity is .
4.2. Manufacturer’s Medium-Capacity State
In a medium-capacity state, the manufacturer has the issue of “overcapacity in the off-season and insufficient capacity in the busy season”. It can also be solved by using strategic inventory co-ordination to meet the optimal product demand quantity during the busy season and the optimal product demand quantity during the off-season.
Proposition 2.
Based on the condition of , if , the optimal proportion of strategic inventory products in the busy season sell as . The wholesale price during the off- and busy seasons, respectively, is and
; the selling price during the off- and busy seasons is
and
, respectively; the optimal product demand during the off- and busy seasons, respectively, is
and
; the optimal strategic inventory is
; and the optimal profit for the retailer is
, and for the manufacturer, it is
.
Proof.
When , the feasible region of (15) with respect to is . Because the optimal solution of is the minimum value of its feasible region, we can obtain . In addition, by substituting into expressions (9), (11), (12), (13), (14), (15), and (17), we can obtain , and , and because of , we can obtain . □
Proposition 2 indicates that, based on the condition of , when , the manufacturer has the issue of capacity inco-ordination, necessitating the partial production and storage of products during the off-season. Therefore, at this threshold, the optimal demand in the busy season is related to the capacity of the manufacturer, and the strategic inventory , indicating that the product production in the busy season is , and the manufacturers’ capacity is not wasted during the busy season, while production for , if and only if , establishes the equal sign—which is the capacity of full use during the off-season. If , there are still manufacturers with off-season capacity waste. The profit of the manufacturer and retailer in the off-season is consistent with the optimal solution under the state of high capacity. This is because the manufacturer can still meet optimal demand in the off-season while making up for the shortage of capacity in the busy season, and the wholesale price, selling price, and optimal demand during the off-season are unaffected by the shortage of capacity in the busy season. The wholesale price, selling price, and optimal demand in the busy season are all affected by the manufacturer’s capacity.
Corollary 2.
Based on the condition of
, when
,
,
.
Proof.
By taking the first-order derivative of , and with respect to , we can obtain the above results. □
Corollary 2 shows that, based on the condition of , when , the wholesale price, selling price, and optimal product demand of the off-season are unaffected by the manufacturer’s capacity. There exists a negative correlation between the manufacturing capacity and the wholesale price of products during the busy season. This is due to the fact that the lower their capacity, the more serious the capacity shortage during the busy season. Therefore, there is a need to raise the wholesale price of products to decrease demand and reduce the manufacturer’s insufficient capacity during the busy season. There is a negative correlation between the busy season product retail price and the manufacturer’s capacity change. This is because the manufacturer will decide to increase the wholesale price when there is a shortage of capacity during the busy season, and the retailer must follow suit by raising the product’s retail price. Similarly, when a manufacturer’s production capacity is reduced, and the product’s retail price rises, there will be a corresponding decline in product demand during the busy season. Consequently, there will be a positive link between the manufacturer’s reduced production capacity and a decrease in the optimal product demand during the busy season. Profit for the retailer is positively connected with the manufacturer’s capacity, and profit for the retailer declines when the manufacturer’s capacity is reduced. This is because the quantity of the retailer’s product sales reduces when the manufacturer’s capacity is reduced.
Proposition 3.
Based on the condition of
, if
, then
, and if
, then
. There is
,
, making
, and
is a function of
, where
represents the only maximum points in the real number field.
Proof.
because hypothesis 6 sets and . If , always stands up, making , and we can solve , . By taking the second-order derivative function of with respect to , we can determine that is a function of , where represents the only maximum points in the real number field. □
Corollary 3.
Because
, if
,
. If
, when,
, and
. When
, the maximum points inside the feasible region of the
function is
, and
. When
,
and
.
Proof.
According to Proposition 3, and because , if , we have , so is the increasing function of , and we can obtain . If , and . When , and . When , is a function of , where represents the maximum points in the real number field, and . When , and . □
There is an optimal capacity to optimize the manufacturer’s profit, and, in accordance with Propositions 1 and 3 and Inference 3, the manufacturer must prudently control the total capacity in accordance with product production characteristics and market conditions. The market demand, as well as the supply chain members’ production and sales costs, influence the optimal quantity of capacity. Based on the condition of , when or when and , the manufacturer’s profit increases monotonically with respect to capacity in the medium-capacity state and falls monotonically with respect to capacity in the high-capacity state. As a result, the crucial value between the medium- and high-capacity states is the optimal quantity of the manufacturer’s capacity, that is, . This phenomenon is caused by the manufacturer’s relatively low cost of capacity and high cost of production and storage. Consequently, there will be situations in which the manufacturer must increase capacity in the medium-capacity state. When and , the manufacturer’s profit function is concave in the medium-capacity state and monotonically decreases in the high-capacity state. The point of equilibrium of the manufacturer’s optimal capacity is the manufacturer’s maximum profit point, , where the manufacturer’s marginal profit per unit of capacity is equal to the manufacturer’s marginal cost per unit of capacity. When and , the manufacturer’s profit with respect to capacity declines monotonically in the medium- and high-capacity states, . This situation frequently occurs under high precision, high maintenance costs, and the high operating environment requirements of the equipment. Such equipment maintenance costs are high, and the direct profit is low, but the majority of this type of equipment has testing, research and development, and other functions. This study only considers product production and profit, which mainly represent the previous two cases.
4.3. Manufacturer’s Low-Capacity State
When the manufacturer is in a low-capacity state, there is a substantial deficit in their capacity; they are unable to co-ordinate their off- and busy-season capacity without impacting off-season product supply, and even with their remaining capacity during the off-season, they are still unable to adequately make up for the shortage of capacity during the busy season.
Proposition 4.
Based on the condition of
, if
,
has no solution.
Because the manufacturer’s capacity is too low in the low-capacity state, the off-season surplus capacity cannot completely make up for the manufacturer’s lack of capacity in the busy season. Moreover, the manufacturer cannot maintain the off-season optimal demand to achieve the optimal demand in the busy season. When the manufacturer is in the low-capacity state, they should think about raising the price of off-season products, decreasing product demand, or increasing inventory to satisfy busy season demand. The manufacturer is unable to simultaneously meet optimal demand during the nonbusy season, even if it employs all of its capacity. As a result, manufacturers frequently adjust the price to achieve the following distribution of capacity between the off- and busy seasons:
Upon substituting expression (19) into expressions (1) and (2), we obtain
Upon substituting expressions (7) and (8) into expressions (20) and (21), we obtain
Upon substituting expressions (19), (22), and (23) into expression (3), we obtain the manufacturer profit function as follows:
where .
By solving for , we obtain
Because , the manufacturer profit function is concave, and is the maximum point on the real number field.
Proposition 5.
(i) If
,
,
,
,
,
,
,
, and
.
(ii) If
or
,
,
,
,
,
,
,
,
, and
.
(iii) If
or
,
,
,
,
,
,
,
,
, and
.
Corollary 4.
(i) If
,
,
, and
.
(ii) If or
,
,
, and
.
(iii) If
or
,
,
, and
.
Propositions 4 and 5 demonstrate that a manufacturer has a significant issue with insufficient capacity in the busy period of a year when they are in a low-capacity state. The manufacturer cannot satisfy optimal demand during the busy season, even if it employs all of its excess capacity during the off-season. In this situation, the manufacturer frequently raises the product’s price in an effort to lower demand. Furthermore, in situations where the manufacturer is unable to satisfy busy and nonbusy season demand simultaneously, it is frequently necessary to analyze the marginal profit per unit of product between these two periods. The manufacturer must decrease supply in the off-season and raise it in the busy season when the marginal profit per unit product in the busy season exceeds the marginal profit in the off-season. The manufacturer can maximize their overall profit in both the busy and off-season periods, even if it damages their profits during the off-season. This is because more profits can be made during the busy season. The manufacturer does not need to adjust the percentage of capacity distribution when the unit product’s marginal profit in the busy season equals the unit product’s marginal profit in the off-season. At this point, the manufacturer’s overall profit has reached its optimum amount. In the same way, in order to increase overall profits, a manufacturer must decrease strategic inventory, increase off-season supply, and decrease busy season supply when the marginal profit per unit product during the busy season is lower than the marginal profit during the off-season. The manufacturer’s capacity, inventory costs, and product specifications all affect the product’s marginal profit both during the off- and busy seasons.
Corollary 4 demonstrates that there is a negative correlation between the manufacturer’s capacity and the wholesale and retail prices of the product when the manufacturer is in the low-capacity state. Because the manufacturer’s capacity is too low and the product is in short supply, the manufacturer and the retailer will raise the product price correspondingly. The lower the manufacturer’s capacity, the higher the wholesale price and retail price of the product. The growth rate of wholesale and retail prices of products in the busy season is not lower than that in the off-season, albeit when the manufacturer’s capacity is reduced. This is because consumers are more price-sensitive during the busy season than they are during the off-season, and the demand fluctuation that results from raising unit prices during the busy season is less than that during the off-season. As a result, manufacturers typically raise prices during the busy season in an attempt to decrease demand.
5. Numerical Analysis
This study uses numerical examples to analyze the optimal strategy of action and profit under various conditions. It also focuses on the effects of changes in manufacturers’ capacity on supply chain pricing and capacity co-ordination in busy and off-seasons. We use ice cream as an example [30] and combine the online data of USA ice cream firms [31]. Ice cream is a product that is consumed and appreciated globally [32]. Affected by seasonal factors, ice cream exhibits a clear alternating pattern of off- and busy seasons, with the busy season occurring from April to October and the remaining months being off-season. Ice cream products can be stored for a long time; however, their shelf life is typically around 18 months. Cream is the primary ingredient in ice cream products, and its supply increases in March each year, coincidentally with the demand for ice cream. As a result, ice cream product production costs are higher during the busy season and lower during the off-season due to fluctuations in the raw material supply cycle.
The supply chain parameters of product A are standardized to guarantee the presence of the solution; the parameters and assignments are displayed in Table 3.

Table 3.
Assignment table of production parameters of ice cream.
According to the above assignment, the example is composed of three parts: the high-capacity state, with the influence of changes in the manufacturers’ capacity on product price, manufacturing quantity, sales quantity, surplus capacity, manufacturers’ profit, and retailers’ profit; the medium-capacity state, with the impact of changes in the manufacturers’ capacity on product prices, manufacturing quantity, sales quantity, inventory quantity, manufacturers’ surplus capacity, manufacturers’ profits, and retailers’ profits during nonbusy seasons; and the low-capacity state, with the impact of changes in the manufacturers’ capacity on product prices, manufacturing quantity, sales quantity, inventory quantity, manufacturers’ profits, and retailers’ profits during nonbusy seasons.
5.1. High-Capacity State
As per the high-capacity state threshold value of in the model mentioned above, in this calculation example, the high-capacity state is reached when .
Figure 2, Figure 3 and Figure 4 demonstrate that when a manufacturer is operating at maximum capacity, changes in the manufacturer’s capacity have no effect on the optimal wholesale and retail prices of the product during the off-season or during the busy season. Accordingly, changes in the manufacturing capacity of manufacturers have no effect on the demand for products throughout the busy and off-seasons with regard to wholesale and retail prices. When a manufacturer has a substantial capacity, there is no need to employ inventory to keep products during the off-season because optimal product demand is lower throughout the busy and off-season periods than the manufacturer’s capacity. As a result, in the supply chain, the quantity of items produced during the off-season and busy season is equal to the corresponding quantities of product demand. The optimal profit of retailers is not impacted by manufacturers’ capacity constraints since the demand, retail price, and wholesale price of products in a high-capacity state remain unaffected. Conversely, the manufacturer’s profit from product sales remains the same, but as the manufacturer’s capacity increases, the quantity of waste the manufacturer generates during the nonbusy period and the number of maintenance costs the manufacturer must bear also increase. As a result, the manufacturer’s profit declines as production capacity rises.
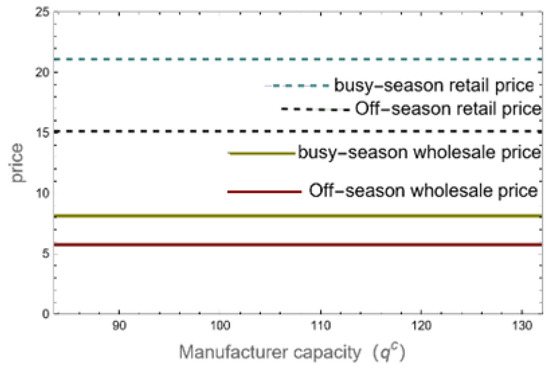
Figure 2.
Product prices in the high-capacity state during the nonbusy season.
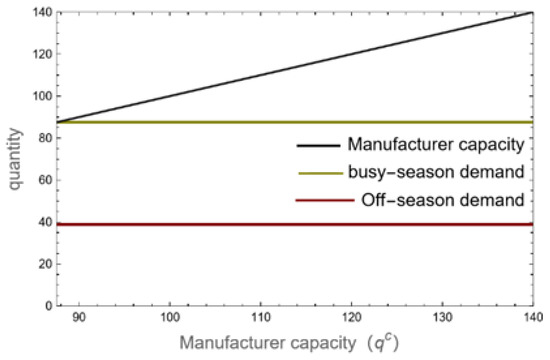
Figure 3.
Manufacturer’s capacity and product demand in the high-capacity state.
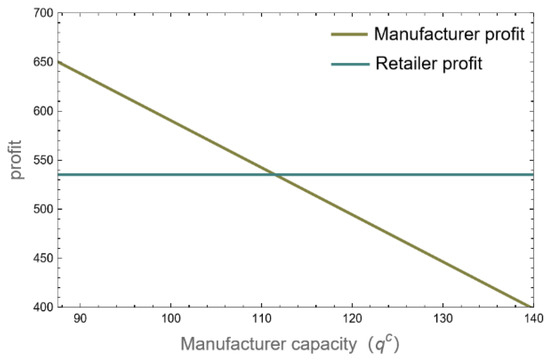
Figure 4.
Manufacturer’s profit and retailer’s profit.
5.2. Medium-Capacity State
In the model mentioned above, the threshold for the medium-capacity state is . It can be seen that in this calculation example, the medium-capacity state is when .
The wholesale price and retail price of the product during the off-season are unrelated to changes in the manufacturer’s capacity, as Figure 5 illustrates. This is especially true when the manufacturing facility is operating at full capacity. In order to make up for the shortage of capacity in the busy season, manufacturers who face the problem of “overcapacity in the off-season, capacity shortage in the busy season” will produce and store excess capacity in the off-season. However, because the cost of the products produced and stored in the off-season is higher than the production cost during the busy season, the wholesale price and retail price of the products in the busy season both increase as the manufacturer’s capacity decreases. For products that are in high demand, manufacturers will raise their wholesale pricing correspondingly. The average cost of products sold during the busy season increases with the percentage of inventory products sold. Consequently, a larger capacity shortage during the busy season means that manufacturers must produce and store a larger quantity of products during the off-season, which drives up the wholesale price of manufacturers’ products. Thus, there is a negative correlation between the retail price and the wholesale price of products during the busy season and the manufacturer’s capacity. Retailers will raise their retail prices in response to manufacturers’ increases in the wholesale price of their products during the busy season.
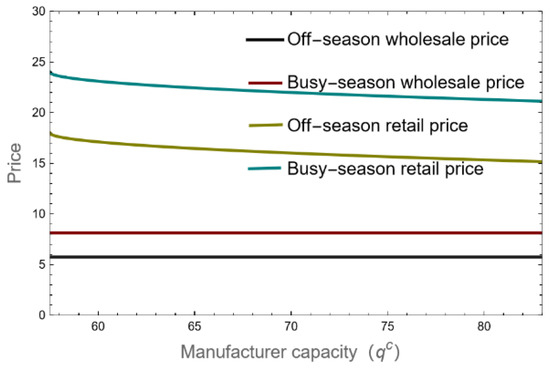
Figure 5.
The prices of products in the off- and busy seasons.
Figure 6 illustrates the supply chain’s product manufacturing quantity and demand during the busy and off-seasons while it is operating in the medium-capacity state. Among these, the manufacturer’s capacity and the busy season’s quantity of output are equal. The manufacturer’s quantity of production in the off-season will gradually rise with the decline in the manufacturer’s capacity because the lower the manufacturer’s capacity, the larger the manufacturer’s capacity gap in the busy season, and the more products the manufacturer produces and stores in the off-season. In the state of medium capacity, the demand for the optimal product in the off-season remains the same, unrelated to the change in the manufacturer’s capacity. Product demand will decline during the busy season as a result of the manufacturers’ reduced capacity, which leads to an increase in wholesale and retail prices. Manufacturers who are raising wholesale prices during this time to make up for their shortage of capacity will unavoidably experience a decline in consumer demand.
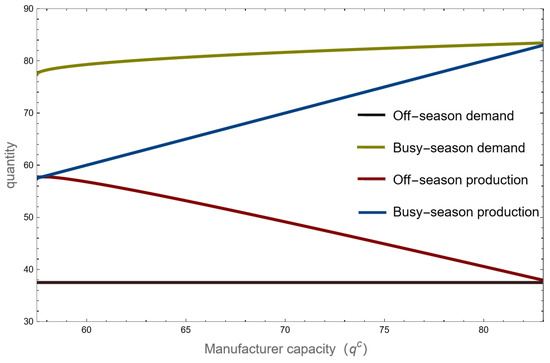
Figure 6.
Product demand and manufacturing production in the nonbusy season.
If the manufacturer’s capacity can be determined, the quantity of inventory in the off-season is equal to the difference between the demand for products during the busy season and the quantity of production of products during the busy season. In other words, all of the products produced and stored during the off-season are used to make up for the manufacturer’s shortage of capacity during the busy season. Figure 7 illustrates how the manufacturer’s excess capacity in the off-season declines in connection with the manufacturer’s declining capacity. At 57.5, the manufacturer’s capacity is fully employed in both the busy and off-seasons, and the manufacturer’s surplus capacity is entirely utilized within both time periods.
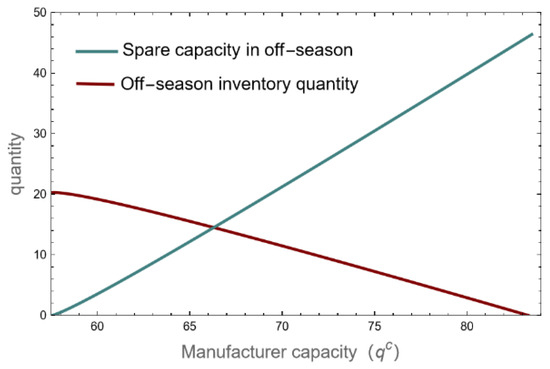
Figure 7.
Manufacturer’s inventory quantity and spare capacity in the off-season.
The retailer’s profit change in the manufacturer’s capacity state is shown in Figure 8, which illustrates this example, showing that when a manufacturer is operating at medium capacity, the retailer’s profit reduces with respect to the manufacturer’s capacity reduction, and the retailer’s profit decreases more rapidly the lower the manufacturer’s capacity is. The reduction in manufacturers’ capacity results in a decrease in retailers’ profit because, during the busy season, the manufacturers’ capacity becomes insufficient. This raises the wholesale price of products, which, in turn, decreases the optimal demand quantity of the supply chain system and the retailers’ sales quantity, thereby increasing retailers’ profit.
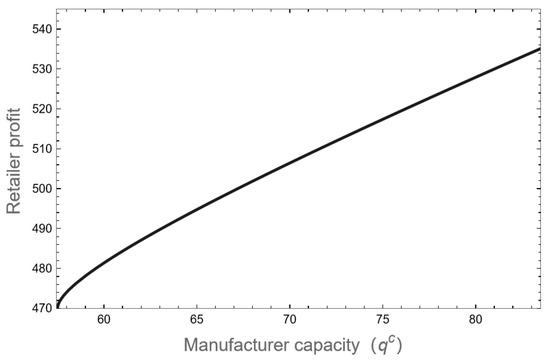
Figure 8.
Medium-capacity retailer’s profit.
Figure 9 shows the manufacturer’s profit based on the product’s capacity. A clear busy season, , is shown when the manufacturer is in the medium-capacity state. As the manufacturer’s capacity is reduced, the manufacturer’s profit initially rises and then falls. A manufacturer’s capacity of during the busy season does not eliminate the need for more capacity, but doing so will only result in capacity waste during the off-season. Nevertheless, increasing capacity during this period can still provide profits. When a manufacturer has a production capacity of , the marginal profit from an increase in unit capacity is equal to the marginal cost of maintaining that capacity, meaning less money that the manufacturer must spend during the nonbusy season. As a result, increasing capacity will not only not increase profits for the manufacturer but also increase waste from maintenance costs.
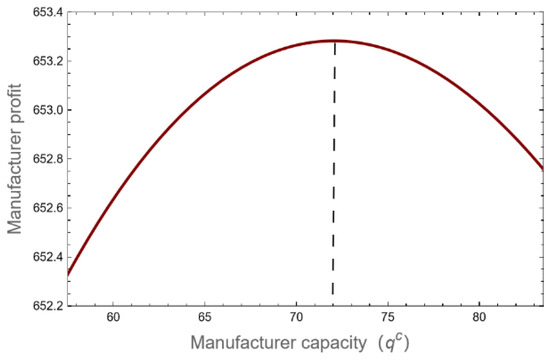
Figure 9.
Medium-capacity manufacturer’s profit.
According to Figure 4 and Figure 9, when the manufacturer’s production capacity of product A is equal to , the manufacturer’s profit is optimized. When the manufacturer’s production capacity is higher than , the manufacturer continues to increase the production capacity, which will reduce the manufacturer’s profit. From the perspective of management, production capacity that is too high will bring a heavy burden of production capacity maintenance costs for manufacturers, and production capacity that is too low will lead to manufacturers needing to pay a lot of inventory costs in nonbusy season capacity co-ordination. Therefore, manufacturers need to control production capacity according to market demand and product characteristics to avoid an excessive expansion or reduction in production capacity, bringing adverse effects on corporate profits.
5.3. Low-Capacity State
The manufacturer uses the decision-making process in Proposition 5(ii) when the capacity is ; the manufacturer uses the decision-making process in Proposition 5(iii) when the capacity is .
Figure 10 illustrates how the manufacturer’s off-season supply is 0 and how the busy season supply is 2 when the manufacturer’s capacity is too low. Because the marginal income brought in by the unit product during the off-season is significantly smaller than that during the busy season, the manufacturer gives up all of the off-season demand and uses all of its capacity to meet demand during the busy season. The manufacturers start to meet off-season demand as soon as their manufacturing capacity gradually rises. At this point, the manufacturer’s supply has reached the optimal capacity distribution ratio, meeting optimal demand in both the busy and off-seasons. However, the manufacturer’s overall profit has reached the optimal point because the marginal income per unit of product in the busy season is equal to that of the off-season.
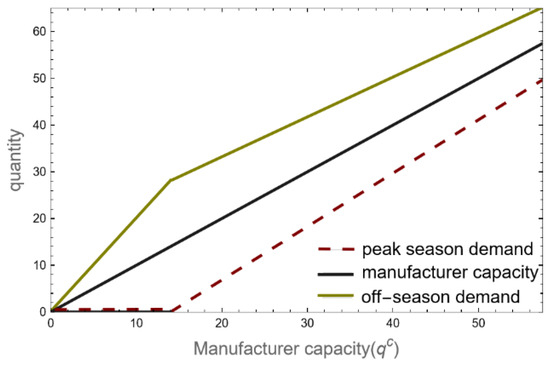
Figure 10.
Manufacturer capacity and product demand in the low-capacity state.
Figure 11 illustrates how a manufacturer will raise the wholesale price of off-season products to the maximum point to reduce consumer demand and allocate all capacity to the busy season through price control when the manufacturer gives up off-season supply due to production capacity that is too low. In reality, manufacturers will limit sales and employ other strategies to halt manufacturing, storing every product until the busy period of the year when they can sell them at a premium. The wholesale and retail prices for the product gradually decline as the manufacturers’ capacity grows, but the pace of price reduction for products during the off-season is smaller than that during the busy season. As Figure 10 illustrates, even though manufacturers start meeting demand in the off-season, the rate of increase in supply is slower than it is during the busy season. This guarantees that manufacturers who produce products such as chips and other items with limited capacity during the busy season at higher interest rates can make a greater profit. Due to the product’s low capacity and limited availability, more chip makers choose to restrict their product supply during the off-season and sell it during the period of busy demand.
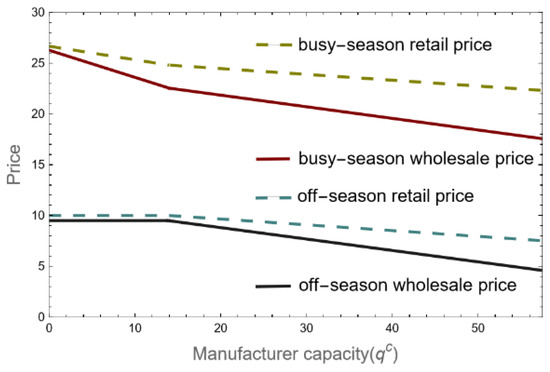
Figure 11.
The prices of products in off- and busy seasons.
Figure 12 illustrates the positive correlation between manufacturers’ capacity expansion and both manufacturers’ and retailers’ profits. However, manufacturers’ profit growth rate eventually declines while retailers’ profit growth rate gradually rises. The product is in short supply and on the seller’s market when the producer is in a low-production-capacity stage. The market, on the other hand, gradually shifts from being a seller’s market to a buyer’s market as the manufacturer’s capacity increases, and the unit profit that the manufacturer’s expanded capacity produces eventually declines. In contrast, the retailer’s profit margin per unit of goods improves as the market progressively shifts from a seller’s market to a buyer’s market, and as a result, the retailer’s profit steadily rises in connection with the manufacturer’s increased production capacity.
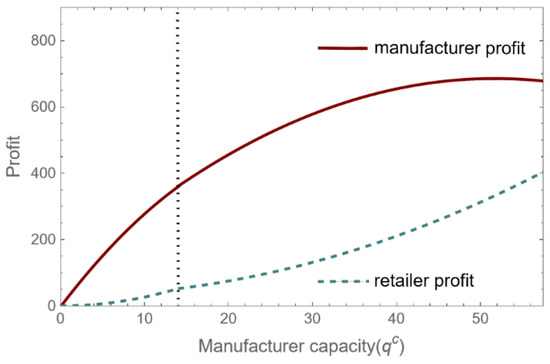
Figure 12.
The profit of the manufacturer and retailer.
6. Managerial Insights and Conclusions
Our study considers the difference in market demand and the change in product production parameters in the nonbusy season, and it integrates the capacity inco-ordination problem into the nonbusy season supply chain model. The manufacturers’ production model of “production in the off-season, sale in the busy season” examines capacity co-ordination, strategic inventory decisions made by manufacturers, and supply chain members’ price decisions. The following are our conclusions: (1) The manufacturer’s capacity is negatively correlated with the manufacturer’s profit, and when the manufacturer is in a state of high capacity, there is a large amount of excess capacity and no need to co-ordinate capacity in the nonbusy season. The manufacturer’s inventory is also zero during this time. The wholesale price, retail price, demand, and retailer profit of the products during the nonbusy season have no impact on the change in the manufacturer’s capacity. (2) The problem of “overcapacity in the off-season and insufficient capacity in the busy season” arises when a manufacturer is in the medium-capacity state. The capacity allocation model adopted by manufacturers can alleviate the shortage of production capacity in the busy season and reduce the waste of production capacity in the peak season. The manufacturer still has some capacity surplus in the off-season, even if the excess capacity is produced and stored during that time, and there is a positive correlation between the capacity surplus and the manufacturer’s capacity change. (3) The wholesale price, retail price, and production quantity of off-season products are all negatively correlated with manufacturers’ production capacity. However, when a manufacturer is operating in a medium-capacity state, the wholesale price and retail price of the product during the off-season are not affected by changes in the manufacturer’s capacity. Manufacturers must decrease their capacity co-ordination inventory as capacity increases. (4) The retailer’s profit is positively connected with the manufacturer’s capacity when the manufacturer is operating in the medium-capacity state; the manufacturer’s capacity is negatively correlated with the manufacturer’s strategic inventory. There are four distinct states that affect how a change in capacity affects a manufacturer’s profit: the market environment, product costs, sales costs, and inventory costs. The relevant conditions of the four states are examined in this study, together with the manufacturer’s choice of optimal production capacity amount under each situation. (5) Market demand, production costs during the nonbusy season, inventory costs, and capacity costs all play a role in determining the manufacturer’s optimal capacity. The manufacturer must maintain high capacity to guarantee that it can independently meet nonbusy season demand without strategic inventory and with lower costs associated with high product inventory if the difference in the manufacturer’s nonbusy season production and capacity costs is low but the inventory cost is high. The manufacturer must appropriately control capacity and use strategic inventory for the allocation of capacity between off- and busy seasons if the production cost is low-to-moderate and the difference between the production costs during these seasons is higher than the cost of inventory. To fully utilize the manufacturer’s capacity through strategic inventory, the manufacturer must raise the price of busy-season products, decreasing demand for those products.
Our research findings are as follows: In order to achieve capacity co-ordination between nonbusy seasons, manufacturers must first make production and operation plans based on the quantity of product demand and capacity in the nonbusy season. This helps to reduce production waste in the off-season, avoid the problem of “overcapacity in the off-season and insufficient capacity in the busy season”, and effectively relieve production pressure on manufacturers in the busy season. Furthermore, it is imperative for manufacturers to exercise reasonable control over capacity in accordance with product production parameters and market conditions. Excessive capacity can result in significant production costs for manufacturers, while insufficient capacity can force them to bear the burden of inventory costs during capacity co-ordination and potentially fail to meet market demand. Thus, it is more advantageous for businesses to take the initiative to manage capacity, enhance the relationship between supply and demand, and achieve a balance between production and sales.
This study only deals with situations where the manufacturer is the dominant player in the supply chain and does not consider situations where the retailer is the dominant player in the supply chain. Moreover, this research is carried out under the condition of complete information symmetry, and the situation of information asymmetry can be studied in the future. Thirdly, in this study, consumer demand is only affected by the price of products in the current season. In the future, we can study the substitution of products and price preferences between the off- and busy seasons or the off-season decision-making of the supply chain dominated by retailers.
Author Contributions
Methodology, X.-X.Y.; Software, H.-F.W.; Formal analysis, X.-X.Y.; Resources, H.-F.W.; Writing—review & editing, W.-J.L. All authors have read and agreed to the published version of the manuscript.
Funding
This research was funded by The National Social Science Fund of China grant number 20BGL017.
Data Availability Statement
Data is contained within the article.
Conflicts of Interest
The authors declare no conflict of interest.
References
- Godoi, C.N.; da Costa Filho, B.A.; Wander, A.E. Ice cream Made of Brazilian Native Fruits: Sustainable Development to Depressed and Biodiversity Areas. Int. J. Adv. Eng. Res. Sci. 2019, 6, 150–161. [Google Scholar] [CrossRef][Green Version]
- Chen, J.-H.; Guo, F.-L.; Shi, C.-D. Seasonal Product Supply Chain Coordination with Resource Constraints and Lost Sale Penalty Cost. Chin. J. Manag. Sci. 2010, 18, 76–81. [Google Scholar]
- Chai, J.; Zhang, X.; Lu, Q.; Zhang, X.; Wang, Y. Research on imbalance between supply and demand in China’s natural gas market under the double-track price system. Energy Policy 2021, 155, 112380. [Google Scholar] [CrossRef]
- Chen, K.; Xiao, T.; Wang, S.; Lei, D. Inventory strategies for perishable products with two-period shelf-life and lost sales. Int. J. Prod. Res. 2021, 59, 5301–5320. [Google Scholar] [CrossRef]
- Huang, K.L.; Kuo, C.W.; Lu, M.L. Wholesale price rebate vs. capacity expansion: The optimal strategy for seasonal products in a supply chain. Eur. J. Oper. Res. 2014, 234, 77–85. [Google Scholar] [CrossRef]
- Bitran, G.R.; Mondschein, S.V. Periodic pricing of seasonal products in retailing. Manag. Sci. 1997, 43, 64–79. [Google Scholar] [CrossRef]
- Ferrer, G.; Swaminathan, J.M. Managing new and remanufactured products. Manag. Sci. 2006, 52, 15–26. [Google Scholar] [CrossRef]
- Chen, K.; Xiao, T. Ordering policy and coordination of a supply chain with two-period demand uncertainty. Eur. J. Oper. Res. 2011, 215, 347–357. [Google Scholar] [CrossRef]
- Wang, G.; Ma, C. Analysis of procurement strategies in a two-period fresh product supply chain. Kybernetes 2024, 53, 1450–1483. [Google Scholar] [CrossRef]
- He, P.; He, Y.; Zhou, L. Channel strategies for dual-channel firms to counter strategic consumers. J. Retail. Consum. Serv. 2023, 70, 103180. [Google Scholar] [CrossRef]
- Ahn, H.S.; Gümüş, M.; Kaminsky, P. Pricing and manufacturing decisions when demand is a function of prices in multiple periods. Oper. Res. 2007, 55, 1039–1057. [Google Scholar] [CrossRef]
- Maiti, T.; Giri, B.C. Two-period pricing and decision strategies in a two-echelon supply chain under price-dependent demand. Appl. Math. Model. 2017, 42, 655–674. [Google Scholar] [CrossRef]
- Zhao, Y.; Hou, R.; Lin, X.; Lin, Q. Two-period information-sharing and quality decision in a supply chain under static and dynamic wholesale pricing strategies. Int. Trans. Oper. Res. 2022, 29, 2494–2522. [Google Scholar] [CrossRef]
- Li, D.; Chen, J.; Liao, Y. Optimal decisions on prices, order quantities, and returns policies in a supply chain with two-period selling. Eur. J. Oper. Res. 2021, 290, 1063–1082. [Google Scholar] [CrossRef]
- Dey, K.; Saha, S. Influence of procurement decisions in two-period green supply chain. J. Clean. Prod. 2018, 190, 388–402. [Google Scholar] [CrossRef]
- Fattahi, M.; Mahootchi, M.; Govindan, K.; Husseini, S.M.M. Dynamic supply chain network design with capacity planning and multi-period pricing. Transp. Res. Part E: Logist. Transp. Rev. 2015, 81, 169–202. [Google Scholar] [CrossRef]
- Ariningsih, P.K.; Irawan, C.A.; Paulraj, A.; Dai, J. A multi-period vaccines supply chain network design with capacity expansion and different replenishment cycles under uncertain demand. Comput. Oper. Res. 2024, 167, 106660. [Google Scholar] [CrossRef]
- Cai, X.; Li, J.; Song, X.; Yuan, F.; Luo, X. Capacity allocation with minimum order quantity: Fixed allocation and turn-and-earn allocation. Comput. Ind. Eng. 2022, 172, 108507. [Google Scholar] [CrossRef]
- Li, J.C.; Zhou, Y.W.; Huang, W. Production and procurement strategies for seasonal product supply chain under yield uncertainty with commitment-option contracts. Int. J. Prod. Econ. 2017, 183, 208–222. [Google Scholar] [CrossRef]
- Peng, H.; Pang, T.; Cao, F.; Zhao, J. A Mutual Subsidy Mechanism for a seasonal product supply chain channel under double price regulation. Asia-Pac. J. Oper. Res. 2018, 35, 1850047. [Google Scholar] [CrossRef]
- Herbon, A. Single-versus two-opportunity price postponement and ordering strategies of a seasonal product. Decis. Sci. 2018, 49, 901–931. [Google Scholar] [CrossRef]
- Guo, L.; Fang, W.; Zhao, Q.; Wang, X. The hybrid PROPHET-SVR approach for forecasting product time series demand with seasonality. Comput. Ind. Eng. 2021, 161, 107598. [Google Scholar] [CrossRef]
- Sisley, H.; Dik, G.; McGree, J.; Corry, P. Multi-product multi-region supply chain optimisation for seasonal crops. Int. J. Prod. Res. 2023, 61, 5704–5722. [Google Scholar] [CrossRef]
- Liu, Y.; Qin, F.; Fry, M.J.; Raturi, A.S. Multi-period modeling of two-way price commitment under price-dependent demand. Eur. J. Oper. Res. 2012, 221, 546–556. [Google Scholar] [CrossRef]
- Borucka, A. Seasonal methods of demand forecasting in the supply chain as support for the company’s sustainable growth. Sustainability 2023, 15, 7399. [Google Scholar] [CrossRef]
- Peng, H.-J.; Zhou, M.-H.; Wang, F.-D. Multi-Period Risk Sharing Contract for There-Channel Supply Chain of Seasonal Products Under Double Price Regulation. Oper. Res. Manag. Sci. 2016, 25, 18–24. [Google Scholar]
- McGuire, T.W.; Staelin, R. An industry equilibrium analysis of downstream vertical integration. Mark. Sci. 1983, 2, 161–191. [Google Scholar] [CrossRef]
- Rios, J.H.; Vera, J.R. Dynamic pricing and inventory control for multiple products in a retail chain. Comput. Ind. Eng. 2023, 177, 109065. [Google Scholar] [CrossRef]
- Ehrenthal, J.C.F.; Honhon, D.; Van Woensel, T. Demand seasonality in retail inventory management. Eur. J. Oper. Res. 2014, 238, 527–539. [Google Scholar] [CrossRef]
- Öztürk, H.İ.; Demirci, T.; Akın, N. Production of functional probiotic ice creams with white and dark blue fruits of Myrtus communis: The comparison of the prebiotic potentials on Lactobacillus casei 431 and functional characteristics. LWT–Food Sci. Technol. 2018, 90, 339–345. [Google Scholar] [CrossRef]
- USDA ERS (USDA Economic Research Service). Dairy Data. 2022. Available online: https://www.ers.usda.gov/data-products/dairy-data.aspx (accessed on 31 January 2022).
- Góral, M.; Kozłowicz, K.; Pankiewicz, U.; Góral, D.; Kluza, F.; Wójtowicz, A. Impact of stabilizers on the freezing process, and physicochemical and organoleptic properties of coconut milk-based ice cream. LWT 2018, 92, 516–522. [Google Scholar] [CrossRef]
Disclaimer/Publisher’s Note: The statements, opinions and data contained in all publications are solely those of the individual author(s) and contributor(s) and not of MDPI and/or the editor(s). MDPI and/or the editor(s) disclaim responsibility for any injury to people or property resulting from any ideas, methods, instructions or products referred to in the content. |
© 2024 by the authors. Licensee MDPI, Basel, Switzerland. This article is an open access article distributed under the terms and conditions of the Creative Commons Attribution (CC BY) license (https://creativecommons.org/licenses/by/4.0/).