Article

Social Infrastructure During the COVID-19 Pandemic: Evaluating the Impact of Outdoor Recreation on Pandemic Dynamics in Europe

by
Mahran Gamal N. Mahran
1,2,†,
Haoying Han
1,3,4,*,
Mahmoud Mabrouk
5 and
Salma Antar A. AbouKorin
2,†
1
College of Civil Engineering and Architecture, Zhejiang University, Hangzhou 310058, China
2
Department of Architecture, El Minya High Institute for Engineering and Technology, Minya 61784, Egypt
3
Faculty of Innovation and Design, City University of Macau, Macau
4
Center for Balance Architecture, Zhejiang University, Hangzhou 310028, China
5
Faculty of Urban and Regional Planning, Cairo University, Giza 12613, Egypt
*
Author to whom correspondence should be addressed.
These authors contributed equally to this work.
Sustainability 2024, 16(23), 10343; https://doi.org/10.3390/su162310343
Submission received: 24 August 2024 / Revised: 13 November 2024 / Accepted: 14 November 2024 / Published: 26 November 2024

Abstract

:
The COVID-19 pandemic has drastically affected mental and physical well-being, leading to significant changes in daily habits and preferences. Given that pandemics require the tear down of most social ties and interactions to limit their inevitable spread, this study delved into the extent to which social infrastructures have been affected, focusing on behavioral shifts in essential services such as retail, recreation, groceries, pharmacies, public transport, parks and open spaces, workplaces, and residential areas. Notably, while most social infrastructures saw a decline in public usage, parks and open spaces experienced increased visitation despite public health measures aimed at minimizing social interactions. This striking increase in park and open space visitations has captured the interest of this study to observe the impact it had on the trajectory of the COVID-19 pandemic, as well as the underlying causes behind this trend. Since Europe was heavily affected by the pandemic, this study focused specifically on European countries over a two-year period (March 2020 to March 2022), covering the severe period of the pandemic. While parks and open spaces initially showed no direct influence on the pandemic trajectory, when closely observing visitation trends, both increases and declines, opposing insights were revealed. This study found that attempts to reduce park and open space visitation were significantly unsuccessful, leading to substantial increases in both the magnitude and duration of visits once restrictions were eased. This surge in park and open space attendance corresponded to notable spikes in new infections during periods of peak visitation. Therefore, urban planning and public health authorities must prioritize safely accommodating the increased park and open space demand while effectively minimizing virus transmission. This involves considering park sizes and proximity, along with implementing a balanced set of crucial public health strategies to support community well-being and resilience.

Graphical Abstract

1. Introduction

The COVID-19 pandemic has focused the spotlight on understanding behavioral changes in social infrastructures. Interestingly, many people have turned to parks and open spaces as a way to maintain their physical and mental health while practicing social distancing [1,2,3]. However, despite the benefits of spending time in parks and open spaces, concerns have been raised about the potential risk that these spaces become overcrowded and increase the transmission of pandemics. Some studies have suggested that the risk of outdoor transmission is relatively low compared to indoor settings [4].
Although numerous study efforts have focused on tracking these behavioral shifts and the substantial increases in parks and open spaces visits such as [5,6,7,8,9,10], this study takes a different approach. This study focusses on the repercussions of going against public demands and curbing park and open space visits, as well as seeking an explanation for the subsequent surges in park and open space visits and, in turn, the pandemic situation. This study examines how suppressing park and open space visitations enforced by public health policies, particularly during winter seasons when viral activity peaks, potentially contributed to unexpected sharp rises in visitations during subsequent desirable seasons, despite ongoing restrictions and pandemic threats. By investigating this relationship, this study attempts to understand how suppressed demand during restrictive periods (a typical response) potentially led to amplified visitation surges shortly after (an atypical response) regardless of the restrictive public health measures and persistent health risks.
Therefore, implemented public health measures, new infections, duration of visitation trends (increases and declines), and visitation magnitudes are all considered crucial factors to perceive. By exploring this less conventional angle, our aim is to unravel the intricate dynamics at play in the midst of this recent global health crisis in order to shed light on the factors that shape people’s behavioral changes toward parks and open spaces. For this study, it assumes that forcing changes towards parks and open spaces holds profound consequences that trigger adverse outcomes. This assumption was evaluated in 15 infected European countries, with different infection classifications, and within a two-year time frame from the notable hit of the COVID-19 pandemic from March 2020 to March 2022, covering the most severe phases of the pandemic where fluctuations in visitation trends were most noticeable. It is important to note that human behaviors are difficult to predict and generalize. Therefore, any significant observation is valuable and should be taken into consideration for further study and analysis.

2. Literature Review

In recent times, the 21st century has experienced numerous outbreaks that have posed significant threats to human life. These outbreaks, whether caused by viral or bacterial agents, include diseases such as SARS, MERS, Ebola, bird flu, swine flu, and the recent the COVID-19 pandemic [11,12,13,14]. Given that pandemics require social distancing to limit the spread of disease, understanding how social infrastructures are affected becomes crucial for emphasizing the need for cities to be resilient and adaptable through changing needs of their inhabitants [15].
Social infrastructures are classified by the usage of facilities by people in residential areas and the main facilities such as retail stores, grocery stores, transit stations, workplaces, and parks and open spaces. During the COVID-19 pandemic, residential areas saw increased use as individuals spent more time indoors to reduce the risk of contamination [16], leading to higher demand for home goods and services and transforming home use for work and leisure [17]. Extended periods at home had mixed effects on mental health: it provided safety and security [18], facilitated family time and closer relationships [19], and increased life satisfaction due to reduced commuting and more leisure time. However, it also led to negative mental health outcomes such as boredom, loneliness, and isolation, as well as decreasing physical health due to less social interaction and outdoor activity [20,21]. In addition, essential services such as retail, groceries, pharmacies, workplaces, and transit stations faced closures and capacity limits, leading to shifts to virtual interactions and raising concerns about virus transmission in crowing settings [22,23,24]. As public transit ridership dropped by up to 90% in some cities, this prompted agencies to modify schedules, promote contactless payments, and encourage alternative transportation [25,26,27]. And remote work offered flexibility, but also challenges such as isolation and access disparities, particularly for low-income communities, while essential workers faced increased stress and burnout [28,29,30,31,32,33]. Furthermore, the retail industry saw a 40% increase in online sales, with temporary pandemic measures becoming permanent, influencing sustainable consumption and consumer behaviors [34]. Among closures and restrictions on previously mentioned social infrastructures during the COVID-19 pandemic, parks and open spaces initially faced similar challenges. However, these measures inadvertently led to a significant increase in their use, and many countries experienced up to a 40% increase in parks and open spaces visitation rates [5,6].
In situations where vaccines and antiviral medications are unavailable or until a global vaccine distribution is achieved, the only available option to slow down and mitigate the spread of epidemic respiratory viruses is the implementation of non-pharmaceutical interventions (NPIs), also known as precautionary measures. These measures encompass a variety of social interventions aimed at reducing the transmission of respiratory infectious diseases [35,36]. Social distancing is by far the goal of NPI implementation, and it is implemented in various urban settings, i.e., schools, workplaces, and indoor and outdoor areas. Moreover, in extreme pandemic situations, quarantines are implemented to eliminate all possible social gatherings. Consequently, the implementation of strict and prolonged non-pharmaceutical interventions (NPIs) poses elevated risks to individuals, including an increased likelihood of domestic violence and severe psychological distress. Additionally, these measures can lead to physical inactivity, weight gain, behavioral addiction disorders, and inadequate exposure to sunlight [37,38,39,40].
As a result, the demand for parks and public spaces increases dramatically to avoid the negative psychological effects associated with prolonged isolation. This is supported by research in 48 countries where restrictions on social gathering, movement, and the closure of workplace and indoor recreational places have been found to be correlated with more visits to parks [41]. A study conducted by Wang in 2021 found that park usage was 63.4% higher in the weeks following the COVID-19 pandemic quarantine restrictions than in the preceding weeks of 2020 [42]. Moreover, countries that implemented early and strict measures have experienced increased visits when restrictions were eased [41]. The earlier examples reflect the effect of nature on well-being that provoked their excessive use as a driven reflex of human need. Therefore, this nature–health interaction was traced, and park visitation was found to be strongly linked to positive well-being indicators throughout life and has been shown to support well-being during the COVID-19 pandemic [43]. This is apparent in a study conducted by the UCL, the COVID-19 Pandemic Social Study, which found that going to parks and open spaces was associated with improved mental health and well-being during the COVID-19 pandemic lockdown in the UK [44]. Another study showing individuals living close to green spaces experienced much less mental distress than those who lived farther away during lockdown periods [40]. Therefore, the CDC has emphasized the importance of maintaining access to parks and green spaces during pandemics, stating that these spaces are vital to the health and well-being of individuals and can lead to healthier populations [45].
In the context of park and open space visitations during the COVID-19 pandemic, many studies have reported an overall increase in park visitation after lifting strict lockdowns imposed in the pandemic’s first wave [46]. A study conducted in Metro Vancouver reported higher than average use in 60% of its parks in the two weeks following the implementation of physical distancing measures [47]. Another study reported a 20.2% increase in park visitation in 97 western US counties from April to June 2020 [43]. However, when outdoor restrictions start waning, a surge in visitations to parks and open spaces corresponds with this, despite the ongoing conditions of the pandemic. With the prevailing fear of contracting an infection, certain activities involving engaging with nature that require less social interactions, such as camping and hiking, have experienced significant increases. Camping in the US Yellowstone National Park increased by 93% in May 2021 compared to May 2019. Backcountry camping increased by 117%, reflecting the desire of people with isolation preferences to live outdoors to confine the possibilities of infection [48]. This highlights the healing role of nature in psychological distress at critical times of sustained isolation. Pouso et al. found that people under strict lockdowns in Spain perceived that nature helped them to cope with lockdown measures, and emotions were more positive among individuals with accessible parks and open spaces and blue-green elements in their views [49].
The significant increase in park and open space visitations prompted the research to explore its impact on pandemic statistics. Some found that the therapeutic benefits of parks and public spaces promisingly do not affect the pandemic impact. This is because outdoor visits generally pose a lower risk of transmission due to increased space [37]. A study of parks in Philadelphia and New York found no correlation between park use and confirmed cases in surrounding neighborhoods [50]. Another study found that the availability of parks was associated with lower risk of COVID-19 pandemic transmission [42]. It was also confirmed that park use declined prior to the peak of the COVID-19 pandemic infection rate [51]. Although parks and public spaces did not appear to increase infected cases, a study found that the accessibility metric for these places had a significant impact on pandemic spread [39]. The results of Spano et el. demonstrate that highly connected green spaces with high choice measure were associated with a high risk of infection transmission [52]. This is supported by the findings that national parks located closer than 347 km to individuals exhibited more visitations than parks requiring longer visitation distances, therefore increasing the likelihood of new infections [38].
Moreover, the notable changes in park and open space visitation patterns are primarily driven by social behaviors. It is crucial to track additional factors relevant to social behaviors that are influential in terms of the COVID-19 pandemic. Therefore, visitation magnitudes, durations of the behavioral changes resulting in different visitation trends, and implemented public health restrictions attempting to constrain social behaviors are essential factors to monitor. As Kinzig et al. note, when behavioral changes persist over extended periods, they can evolve into new social norms [53]. Once established, these norms become resistant to change, even in the face of new policies. This underscores the importance of understanding the effect of visitation duration corresponding to behavioral shifts in parks and open spaces on implemented public health restrictions and, consequently, the pandemic situation. Additionally, Casari and Tagliapietra demonstrate that the size and diversity of groups complicate enforcement, as larger populations face communication and coordination challenges [54]. On this basis, compliance with enacted public health restrictions is heavily impacted by visitation magnitudes. Larger visitation groups may require more time to enforce shifts to their behavioral patterns, explaining the impact of visitation magnitudes on the duration required for behavioral shifts. Thereby, the magnitude of these visitation changes influences both compliance with enforced public health measures and the time required to alter behaviors and enforce shifts in visitation patterns. Accordingly, assessing these associated behavioral factors is essential to understand the clear impact park and open space visitations have on a pandemic trajectory, especially in the context of the COVID-19 pandemic where rapid transmission rates make understanding and managing parks and open spaces gathering behaviors a critical factor in controlling the spread of the virus.

3. Materials and Methods

Given that pandemics severely restrict social interactions, social infrastructure is thus heavily impacted. Therefore, understanding behavioral shifts towards different daily services is essential to seek ways to accommodate these shifts and promote resilient social infrastructure willing to thrive in such critical times. Since parks and open spaces were among the social infrastructures to have witnessed a surge in visitations during the COVID-19 pandemic while strict measures were induced, it is thus essential to trail the driving force behind this dramatic increase in human behaviors. The study utilizes a mixed-methods framework, integrating both qualitative and quantitative methodologies. It begins with a comprehensive review and synthesis of existing literature. Data were subsequently collected from credible and official sources using a compiled data collection method. These data were then subjected to thorough numerical analysis and interpretation through a variety of qualitative analytical techniques and statistical tests. This comprehensive approach enhances the depth and precision of the study’s examination of the subject matter by providing a richer, more nuanced understanding. Furthermore, chat-gpt 4o was used to improve the manuscript’s grammar and academic English.

3.1. Sampling Procedure and Research Timeframe

Since Europe was heavily struck with the COVID-19 pandemic when compared to other global regions, this study took the opportunity to trace the changes in human behavior towards social infrastructures, specifically in parks and open spaces, covering the critical timeframe of the pandemic. This study thereby conducted a comparative study across 15 European countries with varying infection rates. The selection of these countries was based on the availability of data for all study factors included. Spanning from the early pandemic phase in March 2020 to March 2022, this study covers the acute timeframe of the pandemic activity, providing a thorough examination of its impacts over time. The collected data are presented in Table A1 and Table A2 in the Appendix A.

3.2. Measures of Variables

This study mainly trails the driving forces behind the changes in human behaviors towards parks and open spaces during the COVID-19 pandemic in Europe, and several key variables were selected to achieve this particular objective.
  • Visitation trends: In response to the primary aim of this study, in order to assess the changes in public demand for social infrastructures driven by the COVID-19 pandemic. This study thereby recognizes the increase and decline in the six studied social infrastructure visitations to pre-pandemic visitation levels. The Google mobility report was thus assigned to indicate the visitation trends in social infrastructures based on the baseline for mobility changes (median value for the corresponding day of the week during 3 January–6 February 2020) [55].
  • Infection rate: Taking into account variations in a country’s size and scale characteristics, disease transmission is interpreted through its propagation rate rather than using absolute case numbers. In epidemiology, rates are employed to quantify how frequent specific events occur within a designated population over a particular timeframe [56]. This method is admitted to address how the pandemic impacted social infrastructure demands. Consequently, the infection rate is determined by the number of daily new cases per million inhabitants [57].
  • NPI stringency index: In order to track the effect of public health interventions on parks and open space visitations, this study employed the scoring system developed by the Oxford COVID-19 Pandemic Government Response Tracker (OxCGRT) from Oxford University in order to determine the stringency index of implemented public health measures amid the observed trends of increased and declined visitations. This index measures the intensity of ‘lockdown-type’ policies that mainly limit public behavior. It combines nineteen response indicators, such as school and workplace closures, as well as travel restrictions, into a composite measure. This stringency index is scaled from 0 to 100, where higher values represent more severe restrictions (with 100 being the most stringent) [58].
  • Duration of behavioral change: This variable is essential in determining whether the period exhibiting a specific visitation trend holds an impact on the following trend in terms of visitation levels, i.e., whether prolonged visitation declines that are forced by implemented public health interventions might have provoked significant increased visitations towards parks and open spaces once the restrictions were eased. Therefore, durations of visitation increases and declines are demonstrated as x , x , respectively.
  • Visitation magnitude: The inclusion of this variable was to determine the visitation magnitude that is reached during both behavioral trends (increases and declines). Therefore, visitation magnitudes for visitation increases and declines are demonstrated as y , y , respectively.

3.3. Data Quality and Limitations

This study utilized data from three primary sources, each with their inherent characteristics and limitations that warrant careful consideration when interpreting the results.
  • World Health Organization’s dashboard: This data source enables comprehensive cross-national analysis of COVID-19 patterns, providing standardized metrics for infection rates and temporal trends. However, significant data quality limitations exist as case detection, testing strategies, and reporting practices vary across jurisdictions. These variations, stemming from differences in healthcare systems, testing capacities, and case definitions among countries, affect data consistency. Additionally, true case counts may be under- or overestimated due to testing availability constraints, varying reporting protocols, and healthcare system capacity limitations during peak infection periods.
  • Google Community Mobility Reports: These reports provide valuable high-frequency data on population movement patterns, enabling detailed analysis of behavioral changes during the pandemic. The data allow for comparative analysis across different location types and temporal patterns. However, the data represent only users with enabled Google location history on their devices, introducing potential selection bias. This limitation may underrepresent certain demographic groups, particularly those less likely to use smartphone technology or Google services.
  • Oxford COVID-19 Government Response Tracker (OxCGRT): This tracker offers systematic and comparable data on policy responses across jurisdictions, enabling quantitative analysis of intervention strategies. The Oxford Stringency Index provides standardized metrics for cross-national comparison of policy measures. However, the index faces limitations in capturing implementation nuances. While it effectively records the presence and strictness of policies, it cannot account for actual enforcement levels, public compliance variations, or local policy adaptations.

3.4. Methodology and Analytical Framework

Upon gathering data for the previously outlined variables, this study moves forward with descriptive and statistical analyses. These analytical processes are employed to extract meaningful results and develop effective recommendations. The descriptive analysis is designed to first examine how the COVID-19 pandemic has pushed forward behavioral shifts towards social infrastructure demands across the targeted case studies. This is carried out by observing the average changes in visitations, both increases and declines during the study period. This study utilizes compound charts, combining bar and line graphs to visually represent the trends in visitations across the six social infrastructures in the 15 European countries studied and the COVID-19 pandemic cases. This is to identify which social infrastructure showed the greatest demand from people and which showed the least. Also, we observed whether certain visitation trends had an initial impact on the COVID-19 pandemic and thus would require further statistical confirmation. This study then directs its focus towards the social infrastructure that experienced a distinguished outcome: parks and open spaces. Therefore, a detailed analysis was conducted, presenting additional compound charts in order to examine the potential impact of open spaces on the COVID-19 pandemic. This study incorporated a series of important factors along with the daily reports of the COVID-19 pandemic cases, some of which are the implemented public health measures in places to restrict public demand, as well as the magnitude and durations observed in the different visitation trends. This additional analysis was conducted to investigate potential factors that have possibly contributed to the unexpected increase in parks and open space visitation patterns, despite the prevailing fear of disease contraction during the COVID-19 pandemic. Furthermore, it examines how enforcing shifts to public demand by containing visitation levels for parks and open spaces through public health restrictions might have led to unintended consequences when these restrictions were subsequently eased. These charts were created using OriginPro 2021 and Microsoft Excel to illustrate visitation fluctuations from the pre-pandemic visitation baseline.
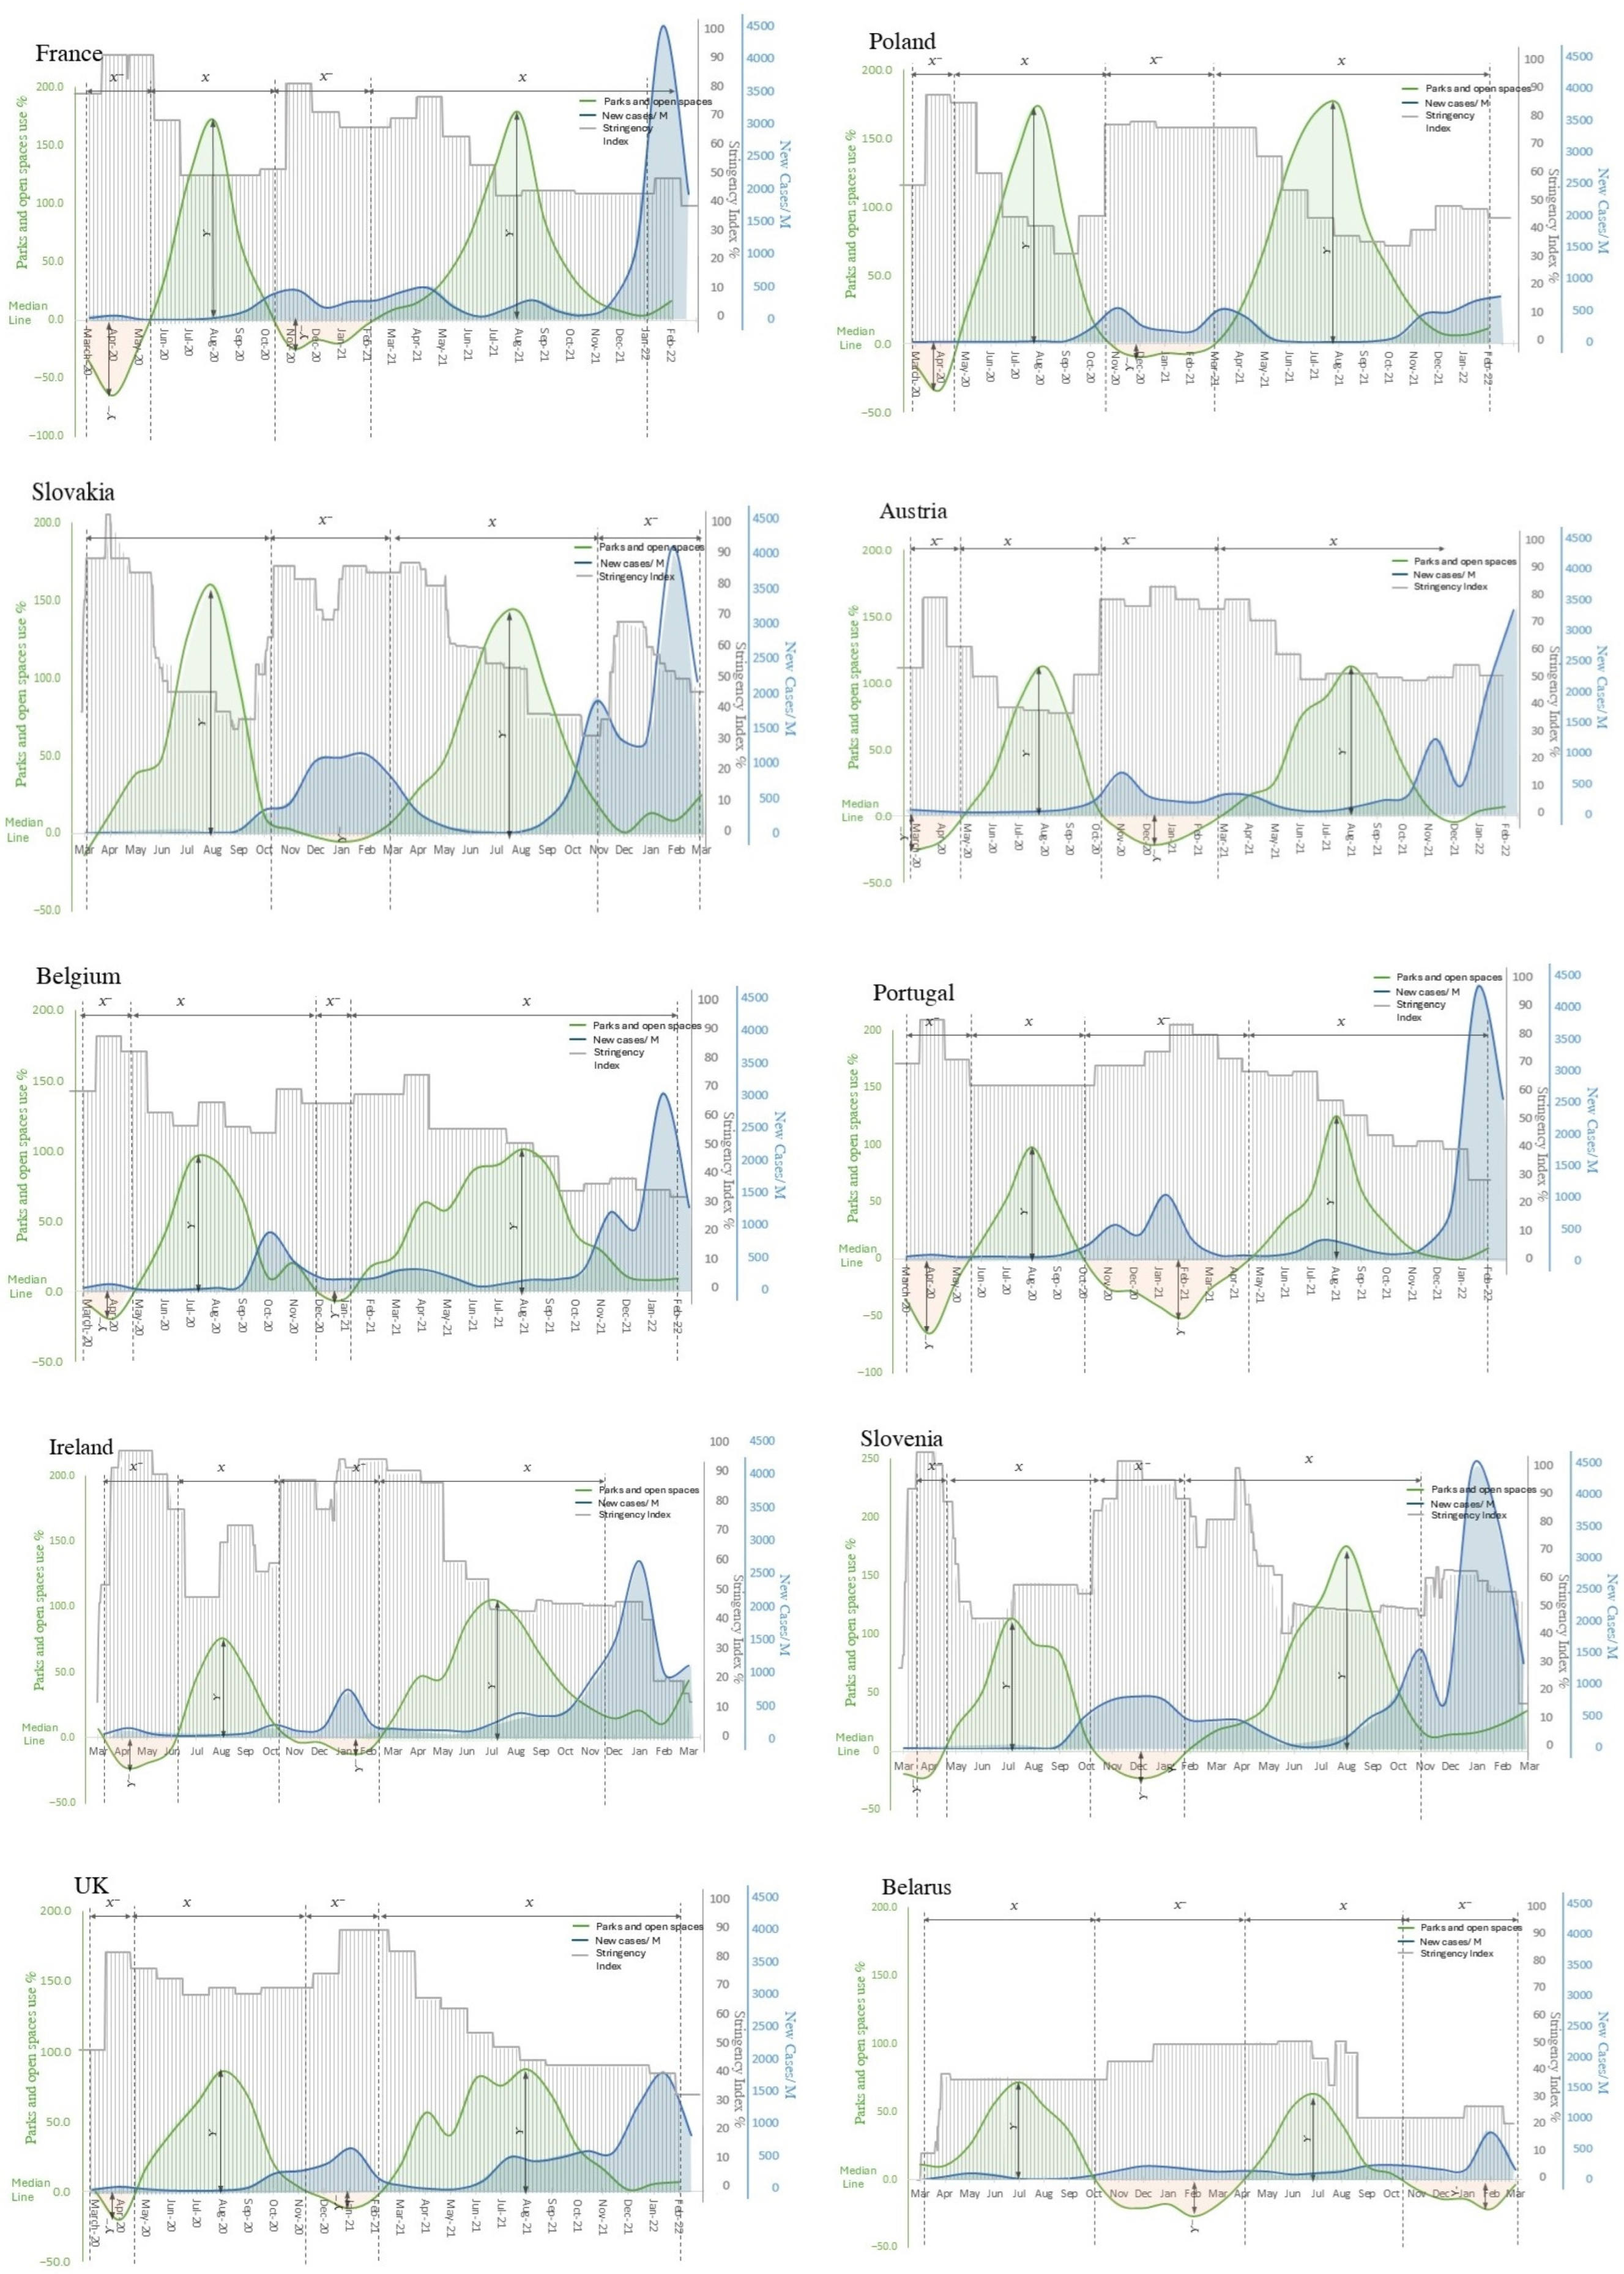
Following the initial analysis of changes in social infrastructure usage patterns during the COVID-19 pandemic, with more focus on parks and open spaces as shown in Figure 1, this study conducted a series of statistical tests to quantify these changes and assess their significance across the targeted case studies. The statistical analysis comprised three main components:
  • Hausman test: This test was applied to determine the most appropriate model (fixed or random effects) for analyzing the impact of the new COVID-19 pandemic cases on demands for various social infrastructures, with separate tests conducted for each infrastructure type. Fixed-effects models (used when p < 0.05) focused on how changes in the COVID-19 pandemic cases relate to changes in visitation within specific infrastructures over time, controlling for time-invariant characteristics. Random-effects models (used when p > 0.05) examined how differences in the COVID-19 pandemic cases relate to differences in visitation both within and between time periods, allowing for broader generalization across similar infrastructure types. This approach allows for tailored analysis of each infrastructure type, acknowledging potential variations in how daily the COVID-19 pandemic new cases affect visitation trends across different social infrastructures.
  • t-test: This test was conducted to check for the significant effect of the new COVID-19 pandemic cases on the six social infrastructures studied.
  • Regression analysis and robustness checks: A combination of multiple and linear regression analyses was performed to assess the impact of various study factors influencing the dramatic increase in visitations to parks and open spaces relative to the new COVID-19 pandemic cases, from the presented Equation (1). And to model the relationships between different visitation trend factors in order to identify underlying influential variables, utilizing Equation (2). Then, multiple tests were carried out to verify the reliability and validity of the regression results, ensuring that the conclusions are not sensitive to specific conditions or outliers.
Equation (1): Multiple linear regression to assess the impact of influential factors on infection rates during increased visitation periods:
NIi = β0 + β1X1 + β2X2 + β3X3 + ... + ε
where
  • β0: Intercept (baseline level of new infections when all XXX factors are zero).
  • β1, β2, β3, …: Coefficients representing the effect of each study factor on new infections.
  • X: The chosen and most influential study factors.
Equation (2): Simple linear regression to assess the cross-impact of study factors in both visitation trends:
FI = β0,i + β1,i·FD + ϵi
where
  • β0,i is the intercept for each specific factor’s effect during declines.
  • β1,i is the coefficient indicating the impact of each study factor during increases on its corresponding factor during declines.
  • FI represents the value of the study factor during the increased visitation trend.
  • FD represents the value of the study factor during the declined visitation trend.
  • ϵi is the error term capturing unobserved influences and random variation.

4. Data Collection and Analysis

As previously emphasized, this section will provide a comprehensive overview of the key findings from the descriptive analysis illustrating the impact of the COVID-19 pandemic on changes in the use of essential social infrastructures, out of which special interest will target the impact of parks and open spaces on the COVID-19 pandemic.

4.1. The Impact of the COVID-19 Pandemic on Social Infrastructure Demands

This section analyzes the changes in the use of residential places, workplaces, transit stations, groceries and pharmacies, retail and recreation sites, and parks and open spaces to determine the main effect of the COVID-19 pandemic on social infrastructure in each country.

4.1.1. The Impact of the COVID-19 Pandemic on Demand for Residential Places

Generally, in previous years, since the start of the COVID-19 pandemic, and with the implementation of precautionary measures by governments and countries to limit the spread of the virus, the percentage of time people spent in their homes and various residential places increased. As the precautionary measures were eased and people started to return to work and school, this percentage began to return to its normal levels. The percentage of people’s use of residential places varied from country to country.
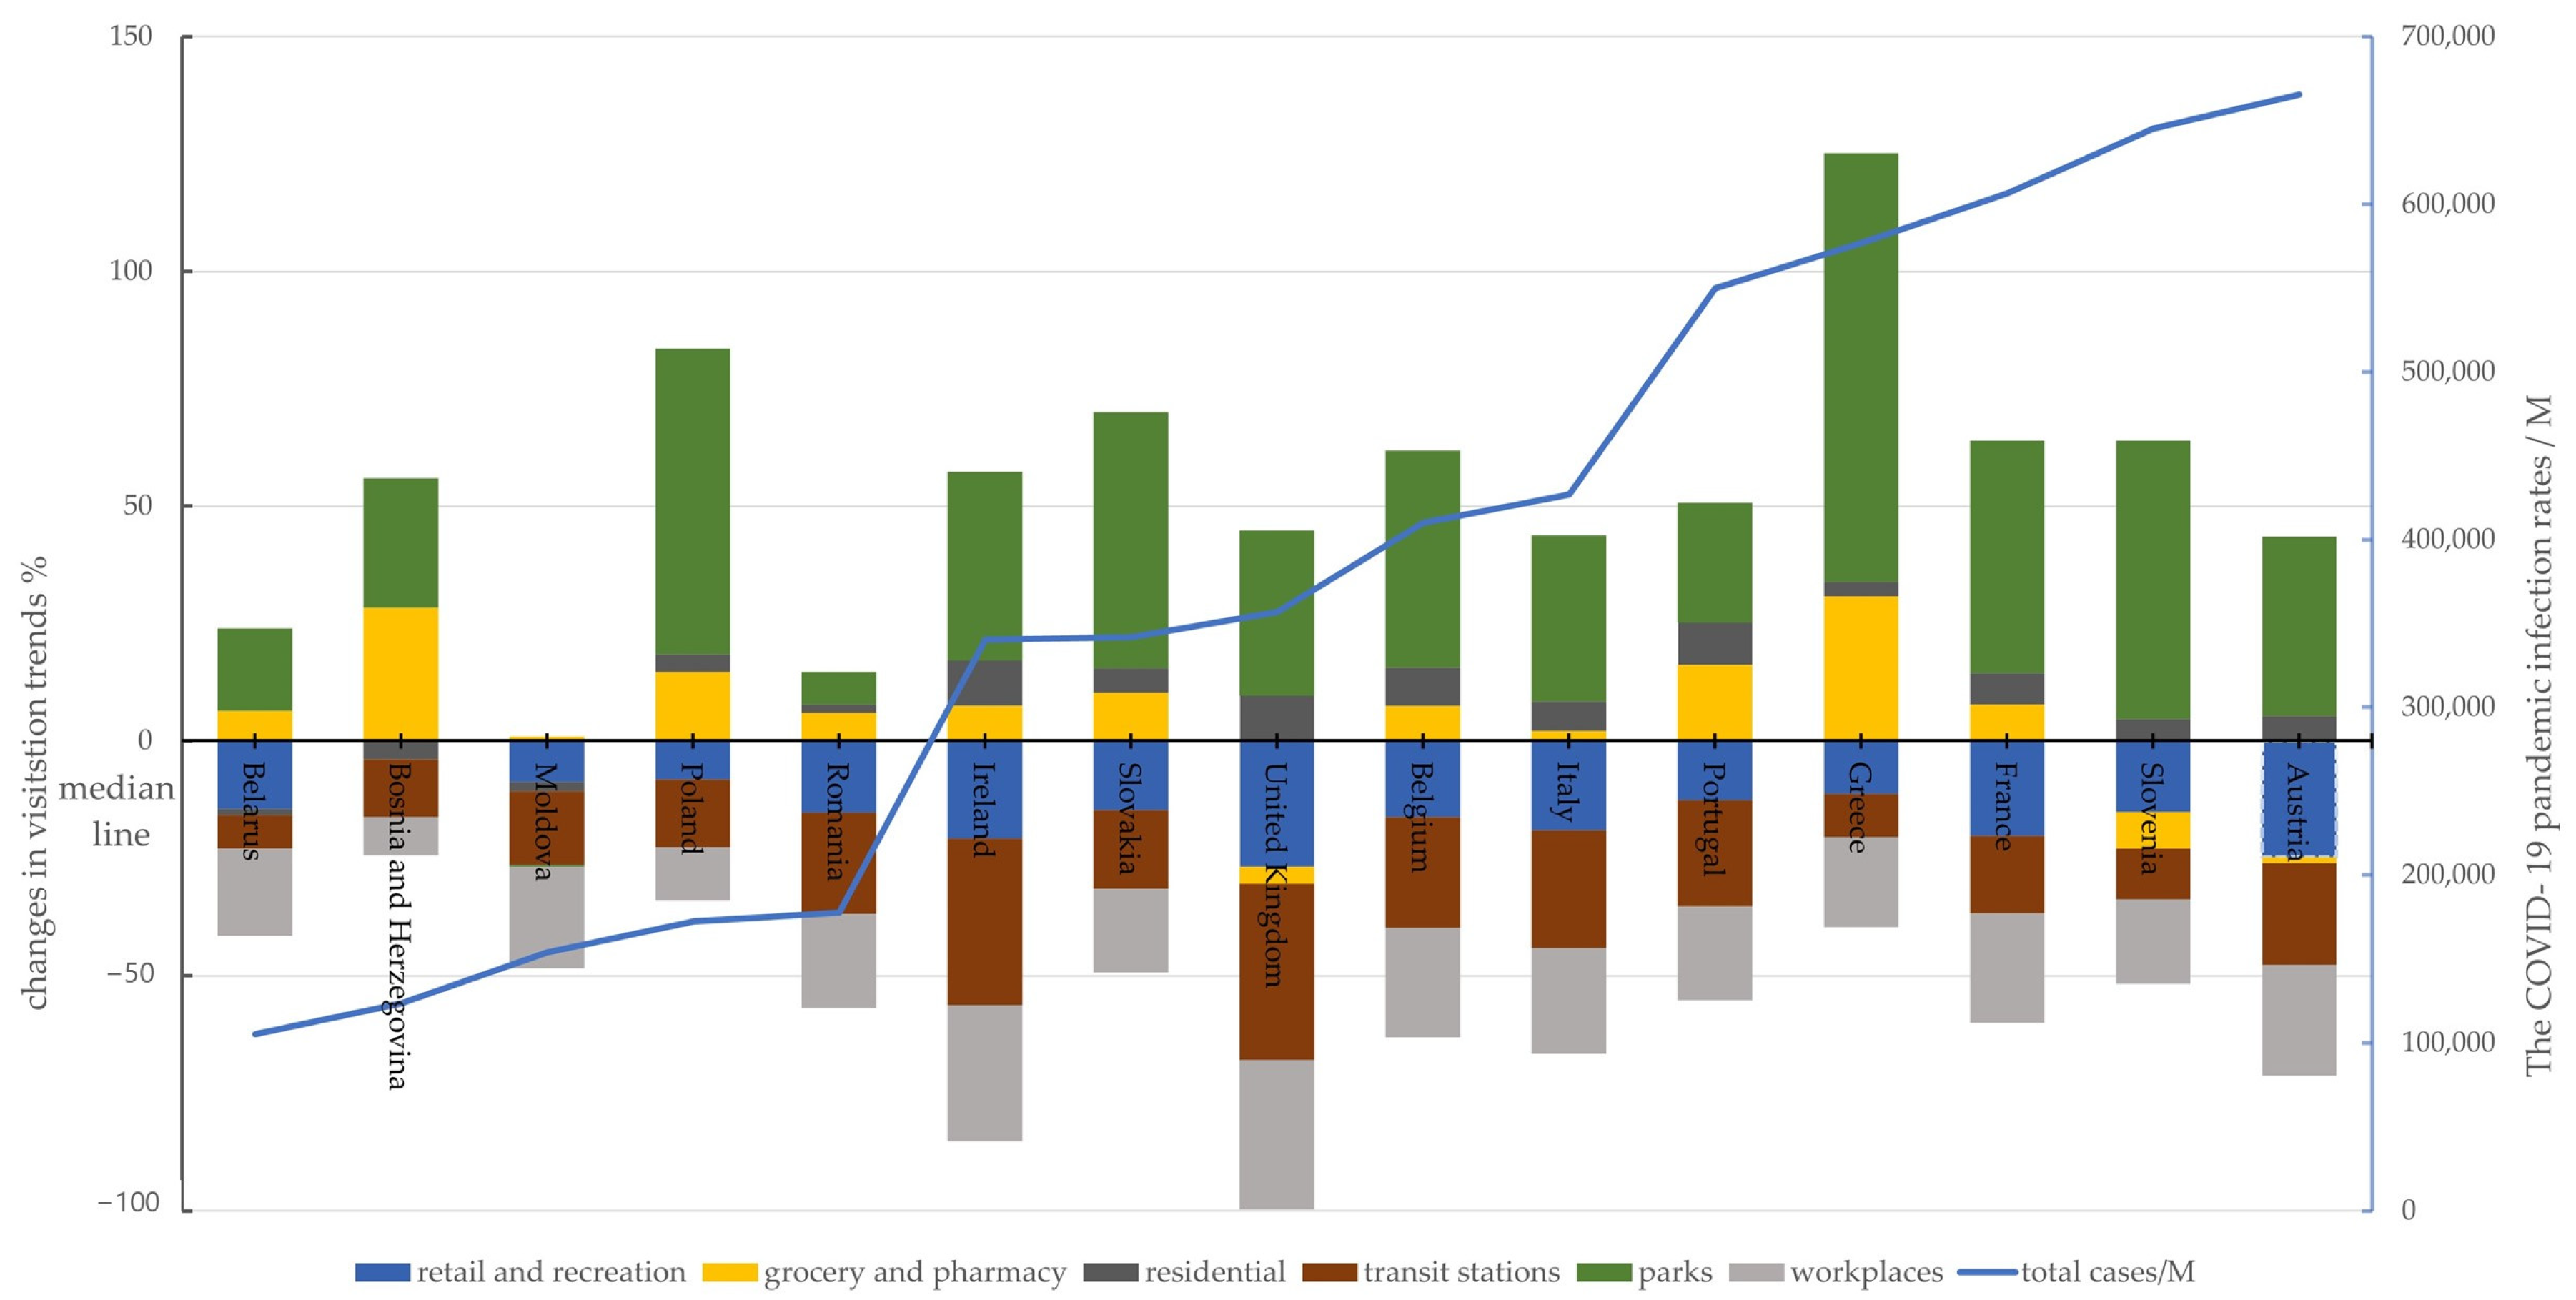
Figure 2 reveals that the average time spent at home has significantly increased especially in the United Kingdom, Ireland, and Portugal. This could be attributed to the fact that these countries had the highest percentage of work-from-home policies during the same period. Conversely, Moldova, Bosnia and Herzegovina, and Belarus had the lowest average time spent at home, possibly due to their greater reliance on retail and indoor recreation venues. These changes have led to increased housing demand, with people seeking larger homes or residences with more outdoor space for remote work and social distancing [59]. Housing preferences have also shifted, with a focus on home offices and access to parks. Additionally, urbanization patterns have changed as people move from densely populated urban areas to suburban or rural regions to reduce infection risk [60].

4.1.2. The Impact of the COVID-19 Pandemic on Demand for Retail and Indoor Recreation Places

During the initial phase of the pandemic, several European countries implemented closures of non-essential retail stores and recreational venues as part of their response measures. Even after these establishments were permitted to reopen, capacity restrictions and other regulations remained in place, limiting the number of visitors allowed at any given time. The analysis presented in Figure 2 indicates that the percentage changes in the utilization of retail and recreation facilities have been influenced by the rise of COVID-19 pandemic infections. As seen in Austria and the United Kingdom, significant declines in the use of retail places have been experienced. However, Bosnia and Herzegovina did not observe a decline in the utilization of retail spaces. Overall, the impact of the COVID-19 pandemic on the utilization of retail and recreation places in European countries has been substantial, resulting in significant challenges for businesses striving to sustain themselves during the pandemic [34].

4.1.3. The Impact of the COVID-19 Pandemic on Demand for Groceries and Pharmacies

The COVID-19 pandemic has brought about notable changes in how people shop for groceries and essential items. To avoid crowds and minimize the risk of exposure to the virus, many individuals have shifted to online shopping and click-and-collect services. From Figure 2, it is evident that the use of grocery stores and pharmacies has varied across European countries such as Greece, Slovakia, and Bosnia and Herzegovina, who experienced a significant increase in usage. These findings align with other study, as some sources report an increase in the usage of grocery stores and pharmacies [61], while others suggest a decrease [62]. Panic buying and stockpiling of essential goods have contributed to increased sales for grocery stores and pharmacies. Moreover, the COVID-19 pandemic has prompted a surge in e-commerce sales as consumers increasingly turn to online shopping for groceries and pharmaceuticals. However, it is important to note that the availability of online technologies may have influenced the decrease in usage observed in countries with higher online capabilities.

4.1.4. The Impact of the COVID-19 Pandemic on Demand for Transit Stations

As the pandemic persisted, many people continued to work from home or avoid public transportation altogether, leading to a prolonged decrease in ridership. The COVID-19 pandemic led to a 46% decrease in passenger traffic across European railways in 2020 compared to the previous year. Similarly, the use of buses and trams in European cities dropped by an average of 60% during the first wave of the pandemic [61].
In response to the COVID-19 pandemic, transit agencies in European countries implemented various safety measures, including the mandatory use of masks and the implementation of social distancing protocols. According to Figure 2, the COVID-19 pandemic has significantly reduced the usage of transit stations across European countries like the UK, where there was a notable 37% decline in transit station usage during the selected period. However, the impact on countries that reported lower infection rates was relatively less significant, potentially due to limited active transportation options, street design, and efforts to restore normal use of public transport. Nonetheless, despite the ongoing impact of the COVID-19 pandemic, transit agencies have taken proactive measures to ensure passenger safety, and ridership levels are gradually beginning to recover [61].

4.1.5. The Impact of the COVID-19 Pandemic on Demand for Workplaces

Strict lockdown measures implemented by many countries in response to the COVID-19 pandemic resulted in the closure of numerous businesses or the adoption of remote work practices. Consequently, a significant decrease in the use of physical workplaces was observed [63]. The emergence of the COVID-19 pandemic infections in workplaces highlighted a novel occupational risk factor associated with the virus, as workplace infections accounted for nearly one-third of the total cases. This underscores the crucial need for safety measures at workplaces to prevent COVID-19 pandemic transmission [64]. Moreover, the adoption of remote work became prevalent during the pandemic, leading to notable changes in work arrangements. Across the EU-27, the proportion of employed people who worked from home at least occasionally increased from 26% in 2019 to 37% in 2020. Additionally, a significant shift occurred, with 40% of workers in the EU reporting remote work at least some of the time during the pandemic, compared to only 10% before the outbreak [65].
Based on Figure 2, it can be inferred that the COVID-19 pandemic has had a significant impact on workplace visitors across European countries, regardless of their reported infection rates. The severity of the impact has been particularly noticeable in the UK, while Bosnia and Herzegovina has experienced a relatively lesser impact on workplace visitors due to fewer reported new cases. As vaccination rates increased and lockdown measures began to ease, some businesses started reopening their physical workplaces and transitioning back to in-person work. However, it is worth noting that the pandemic has prompted a substantial shift in work dynamics. Many companies have continued to offer remote work options or have adopted hybrid models that combine remote and in-person work. This adaptation reflects the changing preferences and needs of both employees and employers. Remote work has become more prevalent, allowing individuals to work from home or other locations, while hybrid models provide a flexible approach that combines the benefits of remote work with in-person collaboration when necessary [66].

4.1.6. The Impact of the COVID-19 Pandemic on Demands for Parks and Open Spaces

The implementation of economic and societal lockdowns has brought about physical and mental health hazards for individuals confined to their homes or working remotely. The significance of spending time in parks and open spaces has become increasingly evident during this period of confinement, with the understanding that contact with these spaces plays a crucial role in people’s mental and physical well-being, more so than before the pandemic [6]. Parks and open spaces have experienced a (re)discovery during the COVID-19 pandemic, becoming popular destinations for physical activity, stress reduction, and relaxation wherever they are available and accessible. With many indoor activities becoming limited or closed, parks and open spaces have become a refuge for individuals to exercise, unwind, and enjoy the outdoors. Consequently, parks and open spaces in urban areas have witnessed higher-than-usual usage.
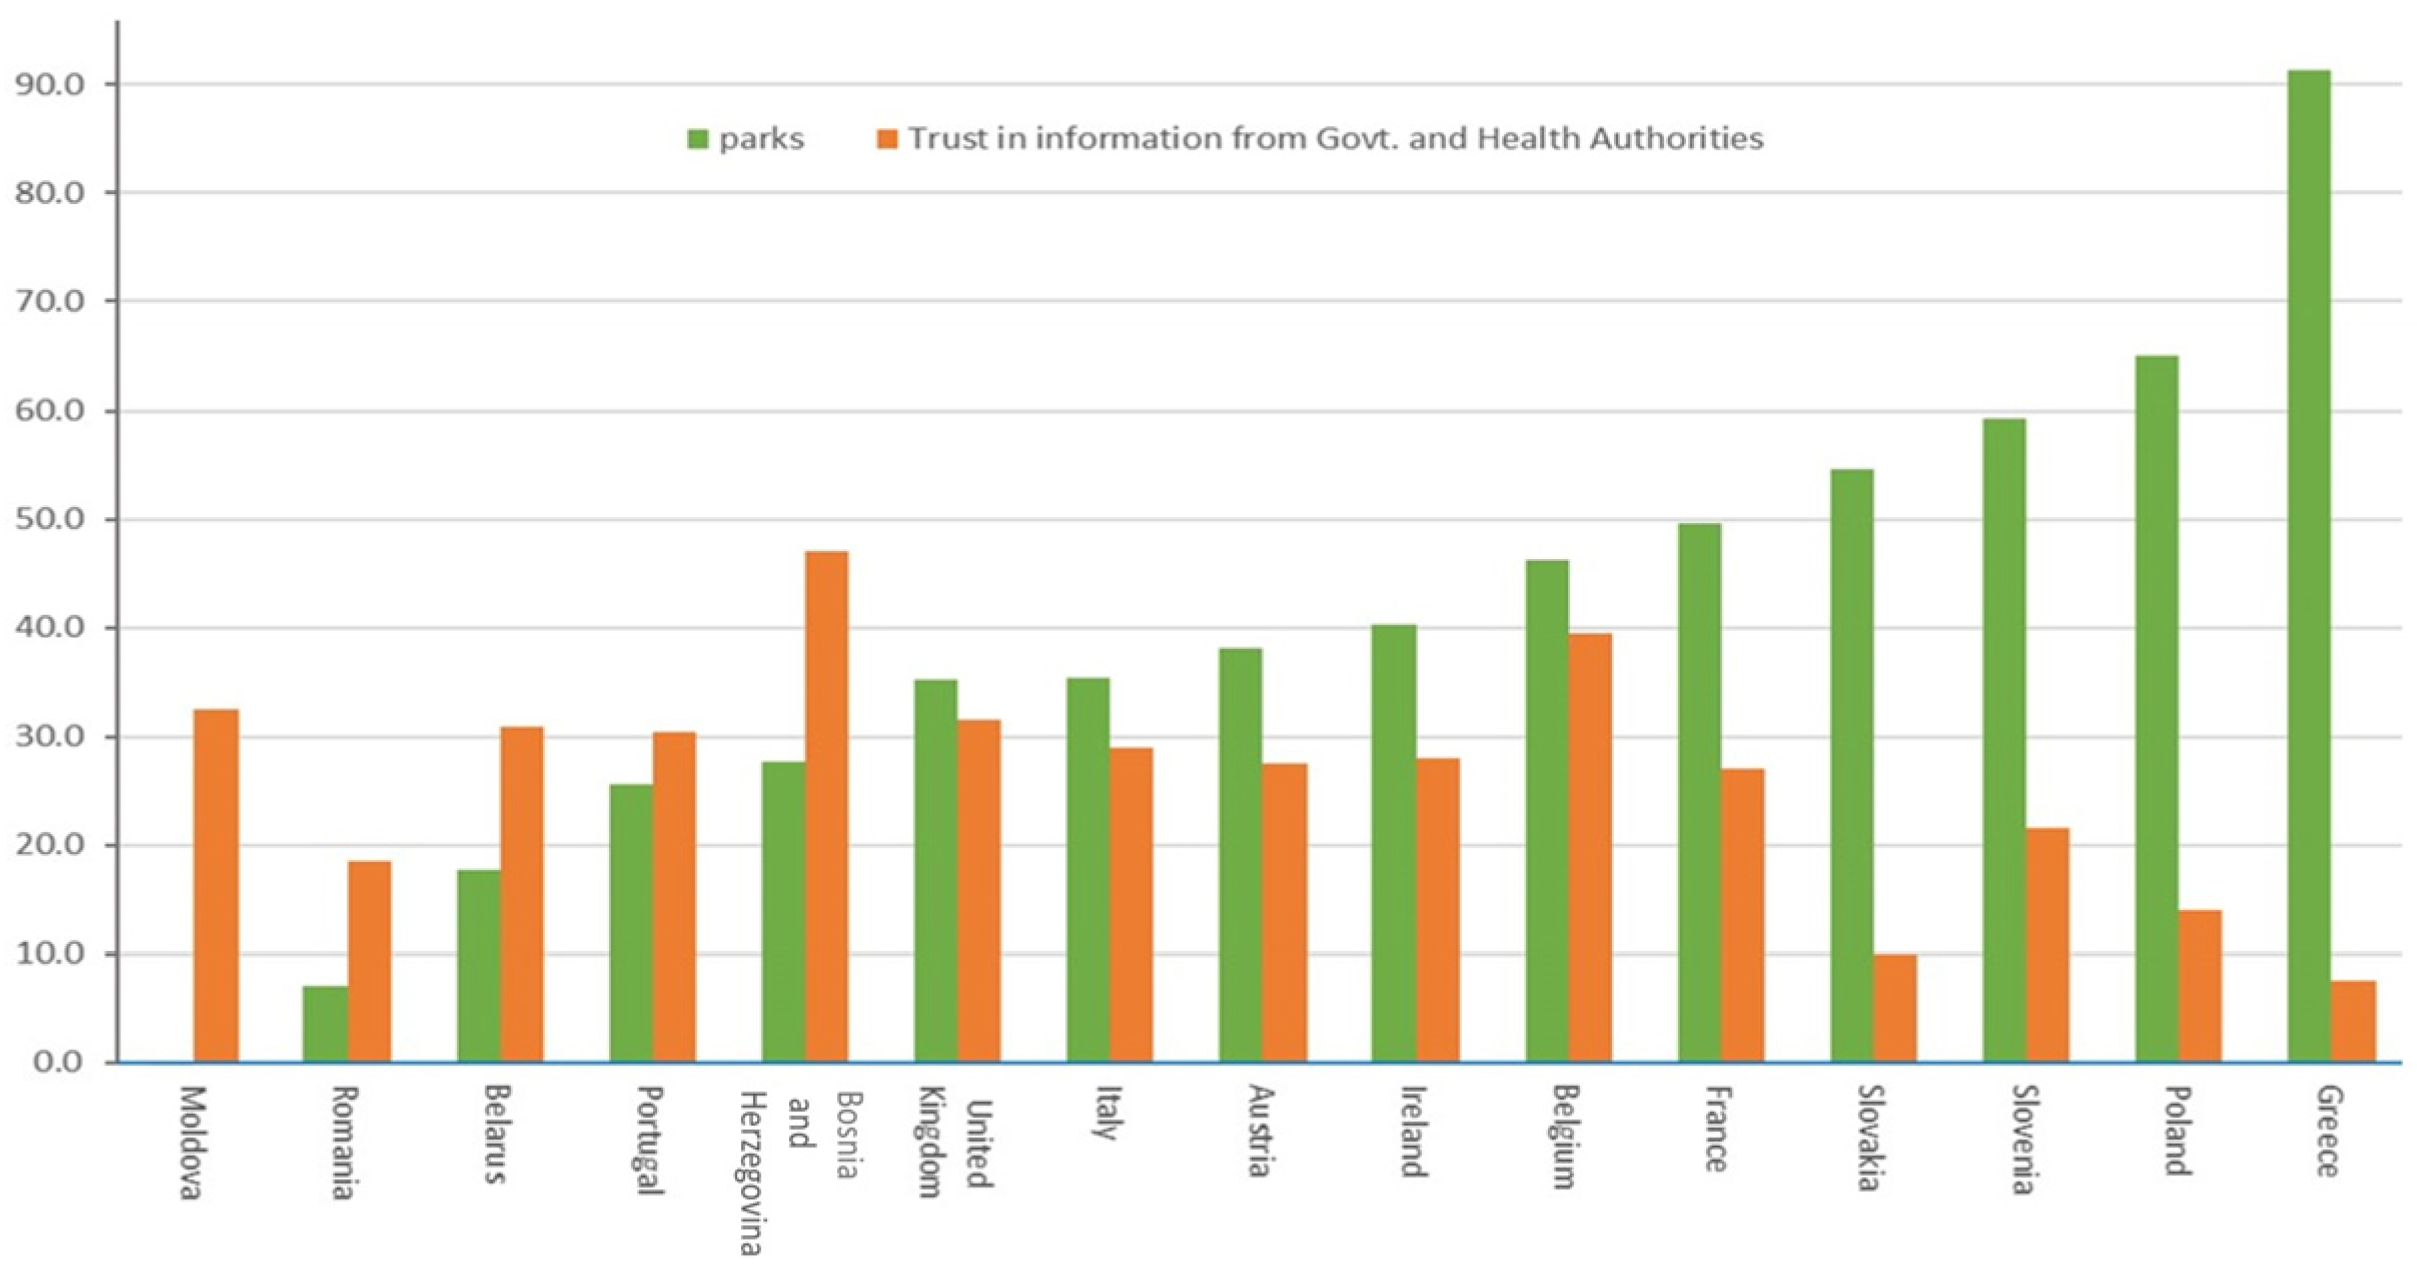
From Figure 2, it is apparent that parks and open spaces experienced a significant rise in the number of visitors during the pandemic period across all studied countries, regardless of their infection rates. However, it can be seen that the increase was not uniform across all European countries, ranging from 25% to 95% in terms of the percentage of people visiting parks and open spaces. These changes can be related to the people’s trust in the government and health authorities as a source of information, as shown in Figure 3, which presents data illustrated from [67]; the figure shows a very strong correlation between the average use of parks and the average trust of people in their government authorities’ information—the greater use of parks and open spaces, the less confident people are in government and health authorities’ information.
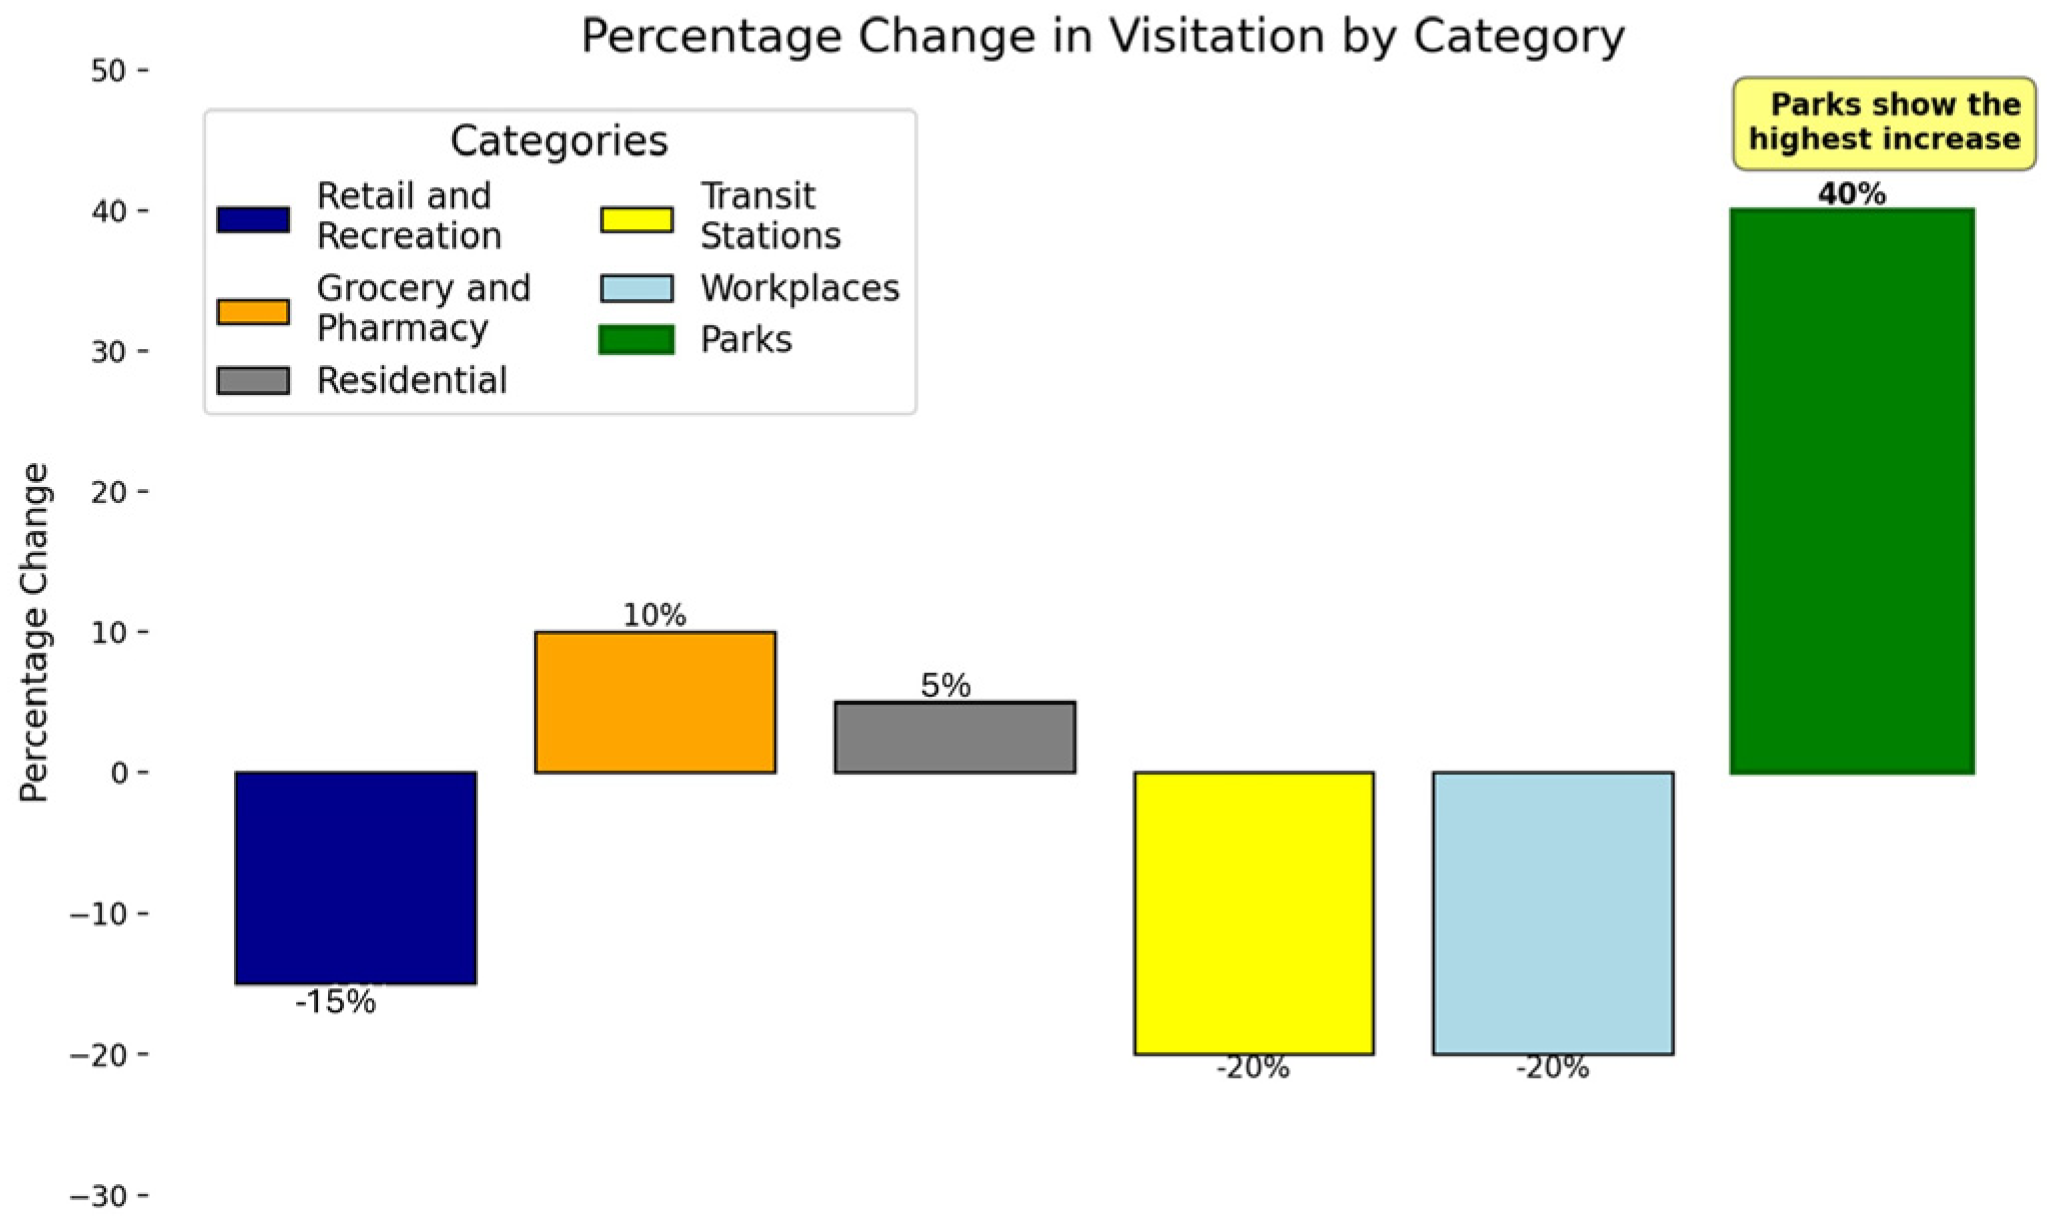
After gaining a comprehensive understanding of the individual changes in social infrastructures, the subsequent figure, Figure 4, provides a comparative illustration of the average changes across all selected social infrastructures. This comparative analysis is crucial in identifying specific infrastructures that have undergone significant transformations. Notably, parks and open spaces have experienced a substantial strike in visits during the study period, requiring further investigation into their potential influence on the trajectory of the pandemic.

4.2. The Impact of Parks and Open Spaces on the COVID-19 Pandemic

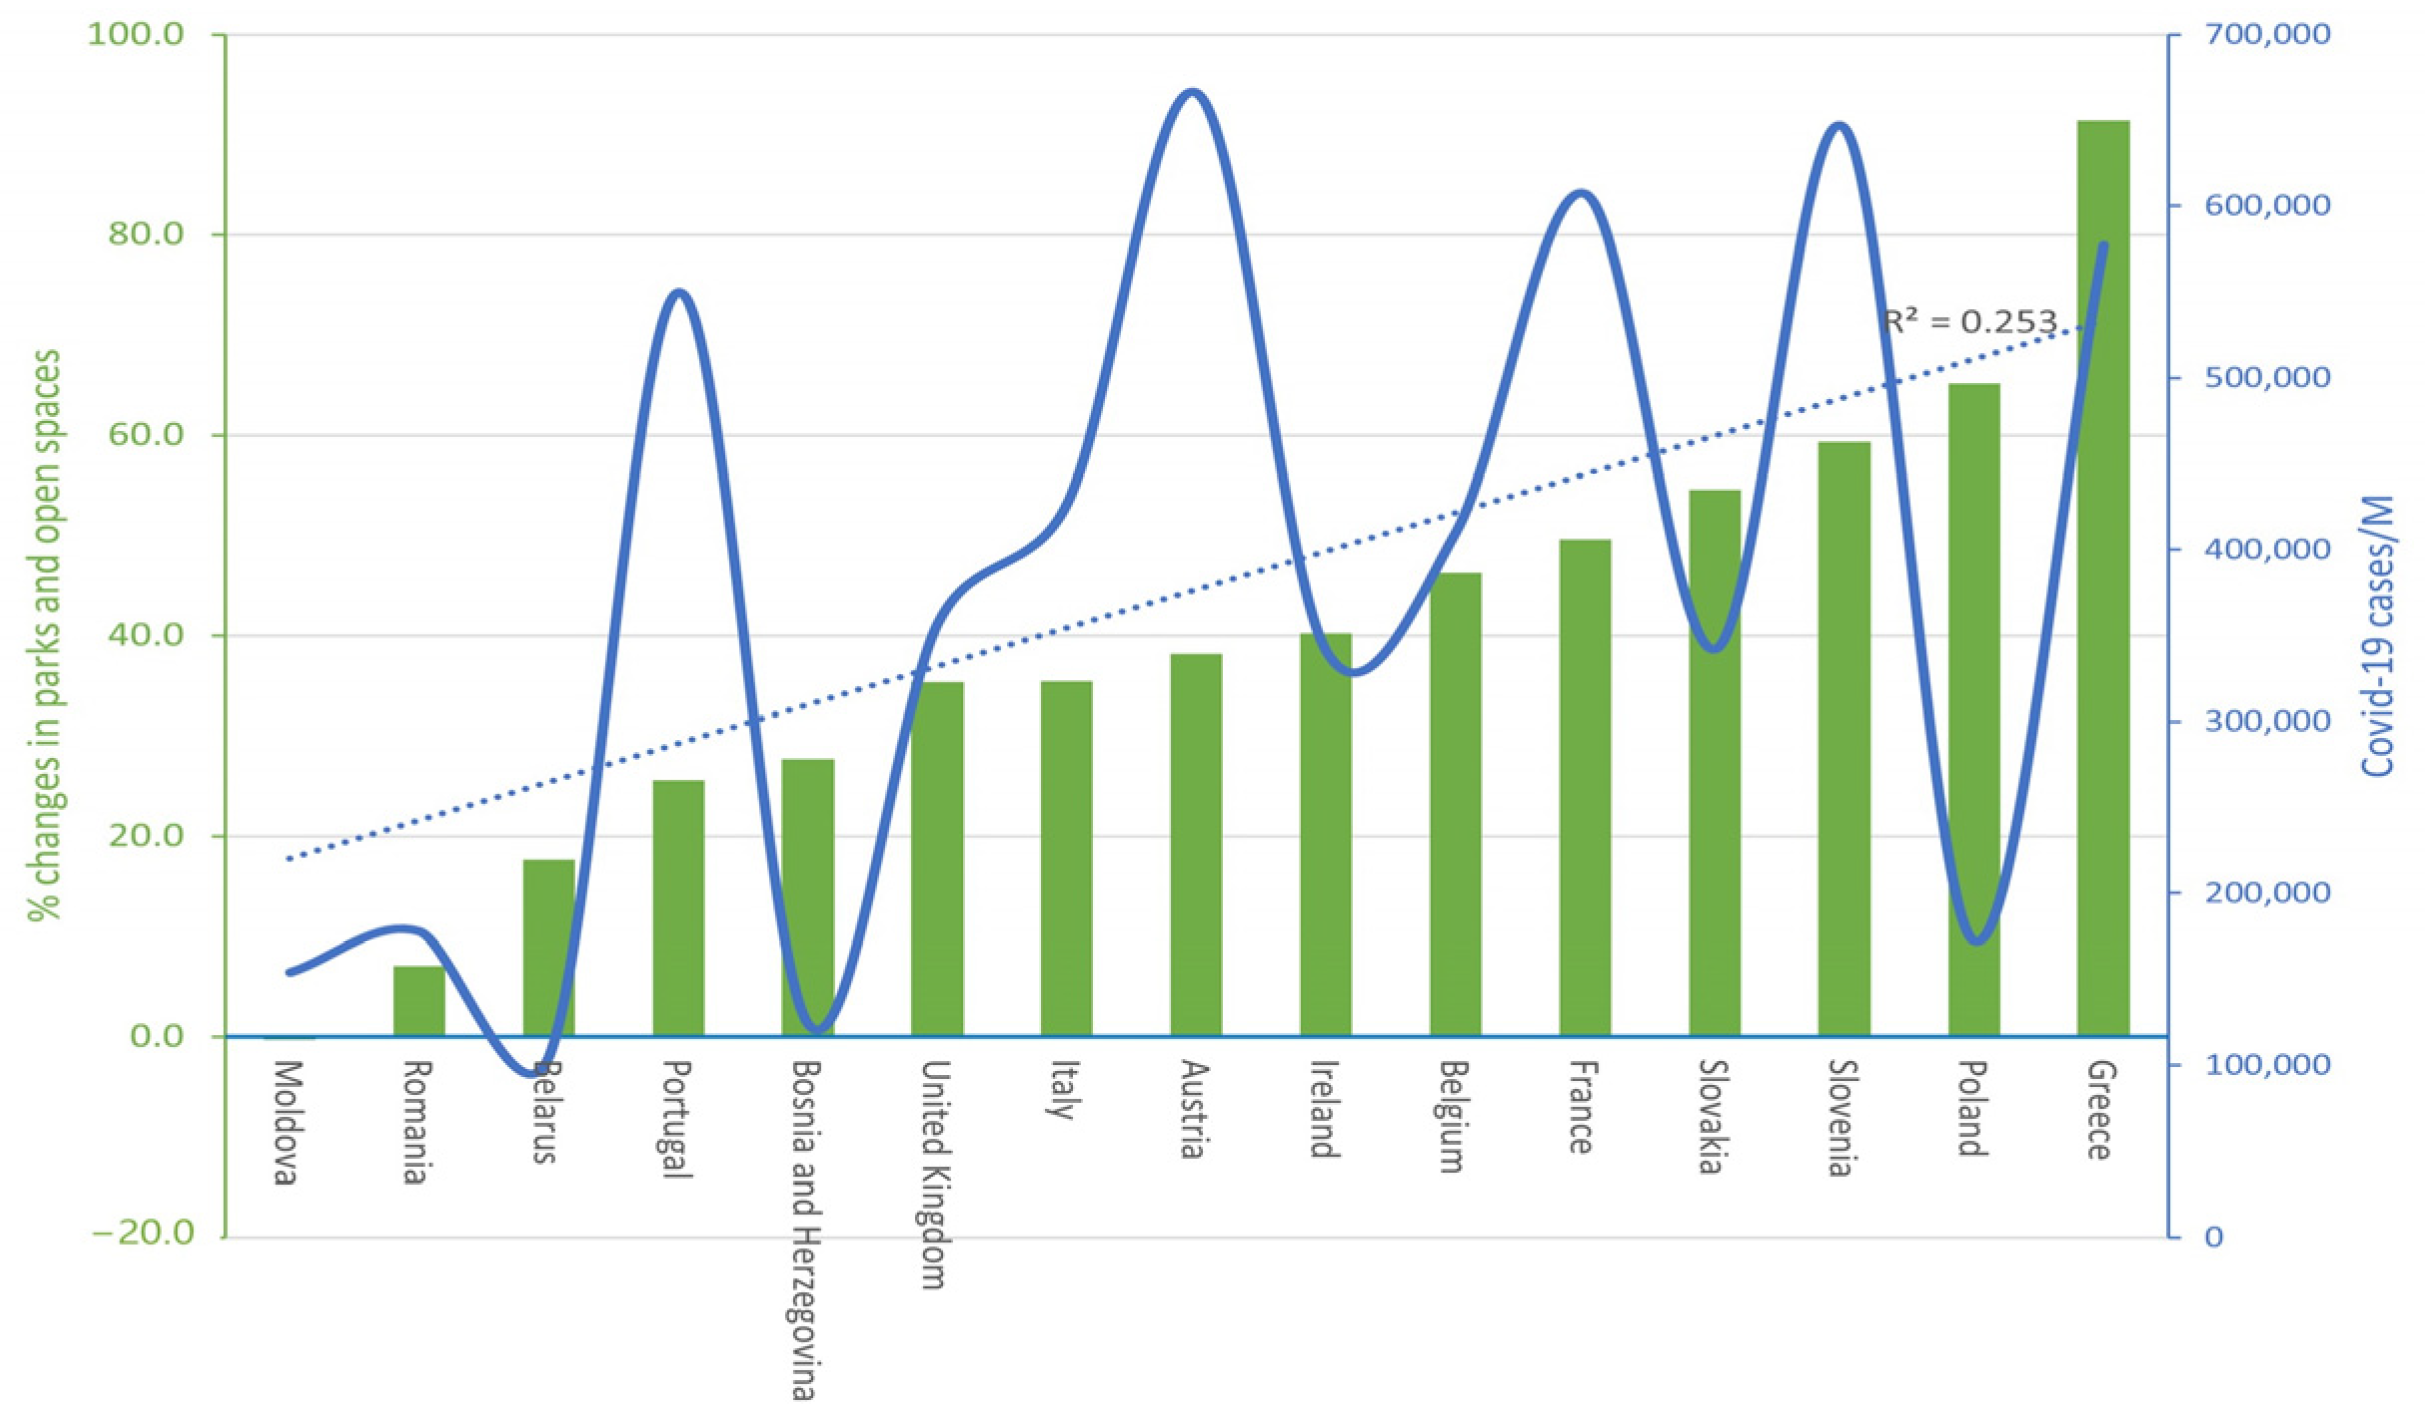
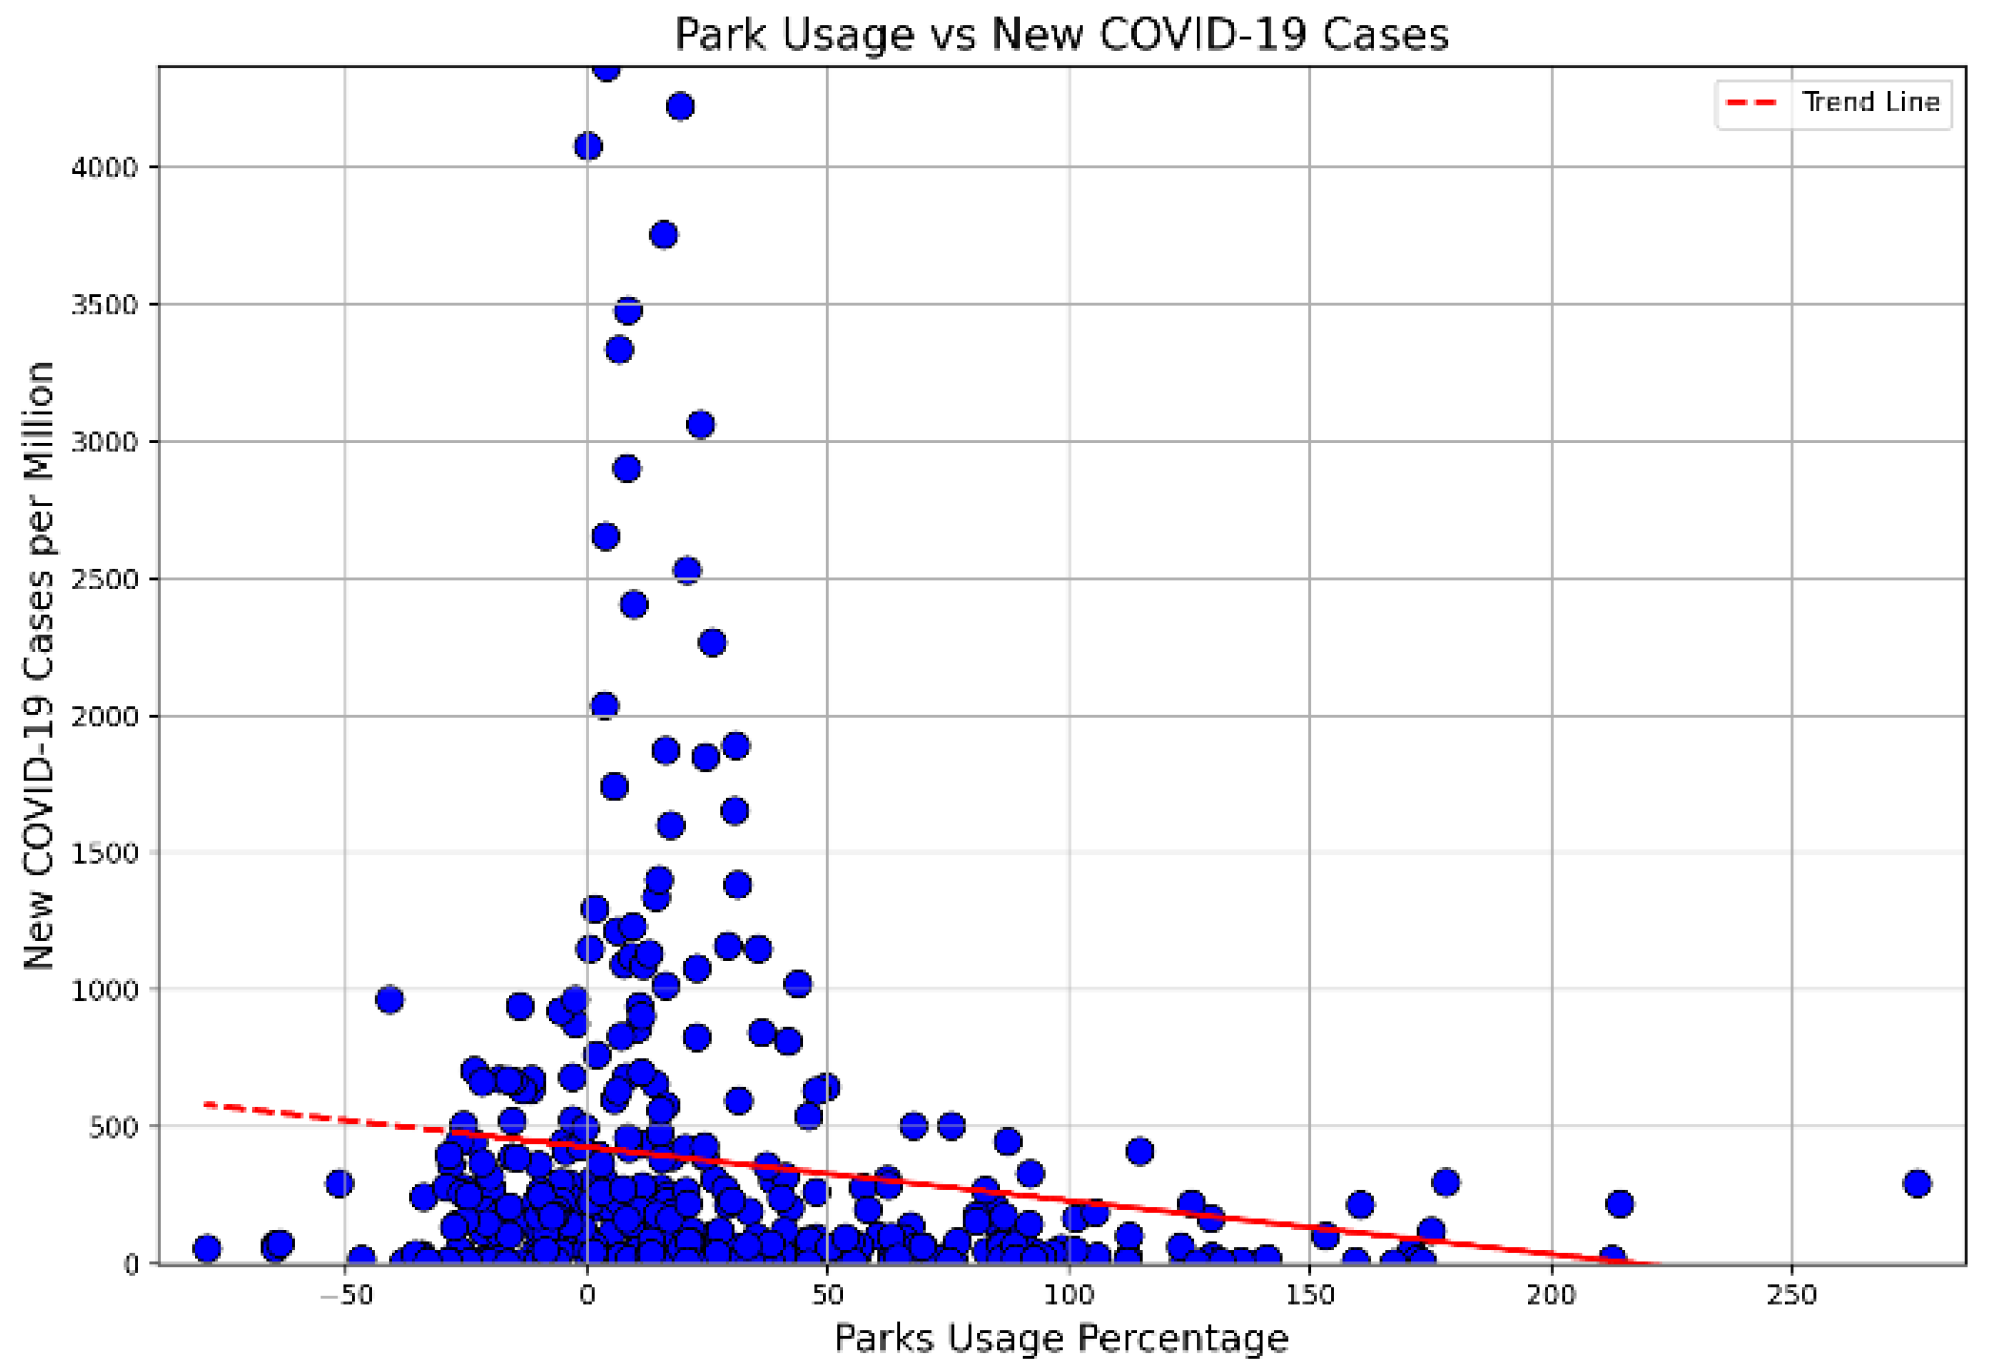
While most demands for social infrastructures have witnessed a decrease in daily visits, such as visits for retail and recreation, transit stations, and workplaces, an extraordinary spike in visits to parks and open spaces has exhibited otherwise. This significant demand for parks and open spaces has triggered interest in discovering the impact visits had on the pandemic situation, and if existent, identifying the most potent factors at play. When initially assessing the impact of average daily use for the 15 selected case studies and across the study’s time period, as shown in Figure 5, it is evident that there is a correlation between parks and open space visitation and corresponding infections.

Factors Affecting Park and Open Space Visitation During the COVID-19 Pandemic

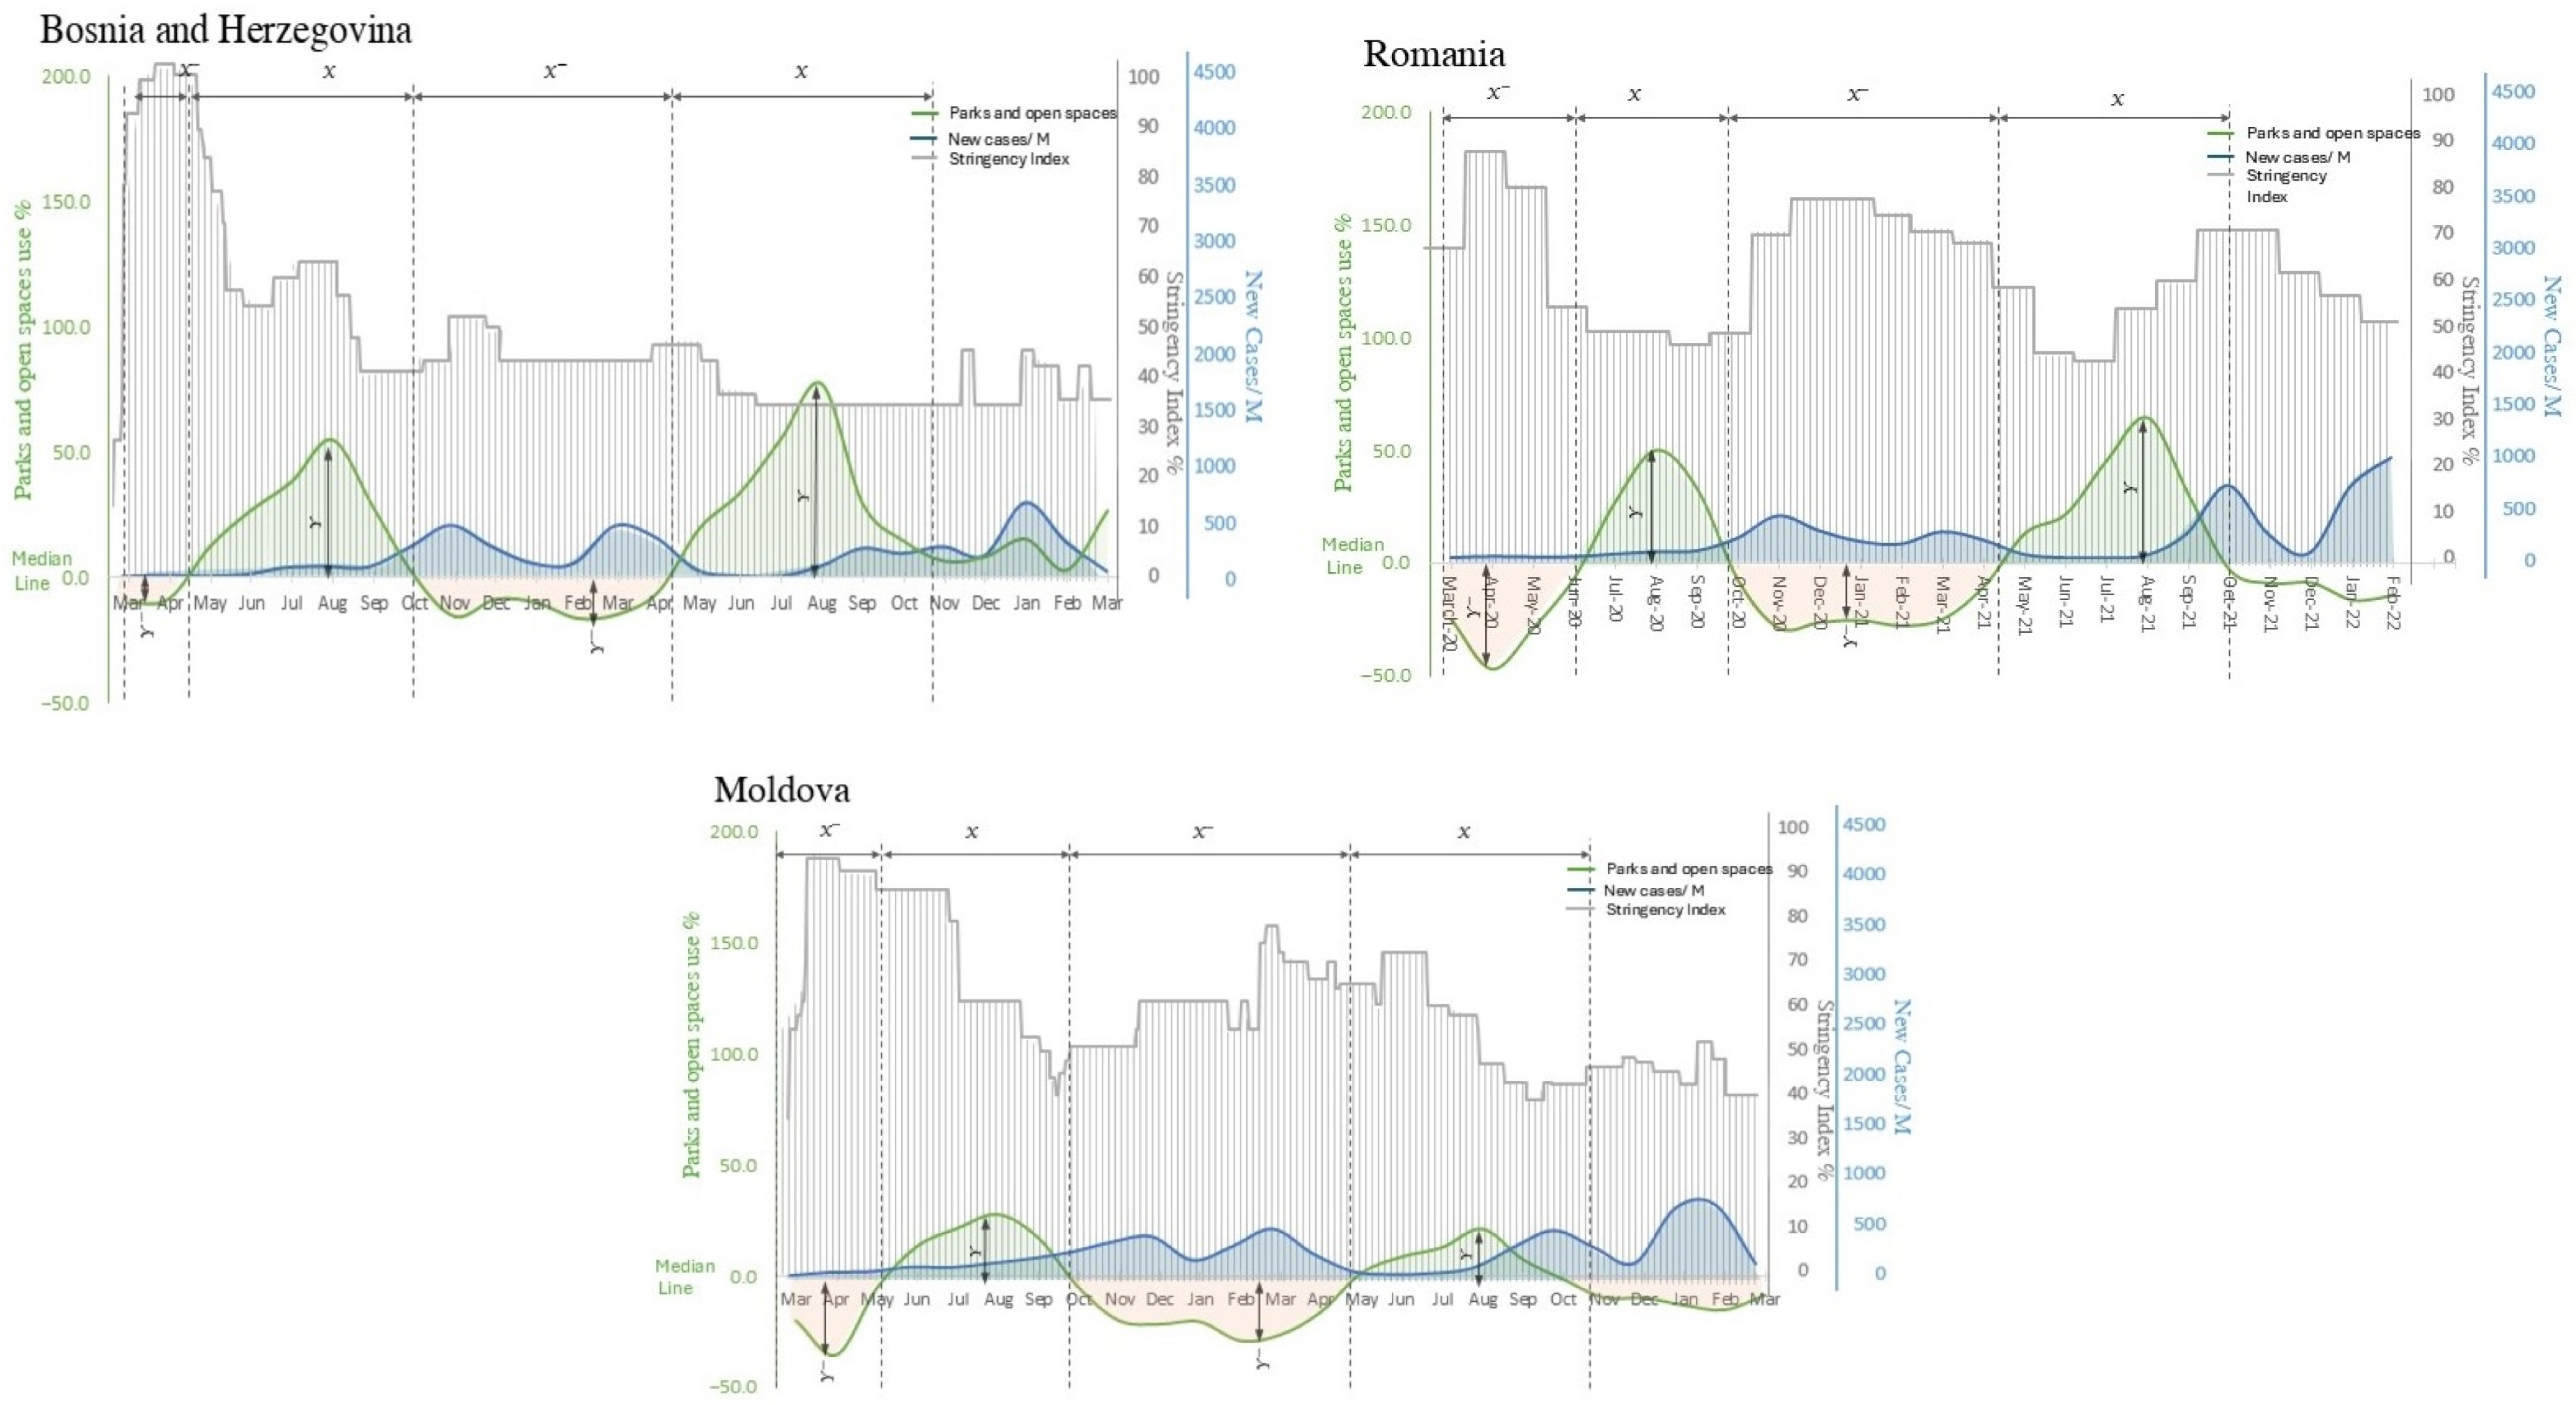
After the preliminary assumption of an existent correlation between park and open spaces visit and the pandemic spread, delving deeper into this assumption to declare a definite outcome is essential. Therefore, observing the trends of visitation increases and declines, along with reported infections and implemented public health measures, are vital factors that need to be considered. In doing so, Figure 6 provides an analysis of the relationship between the number of the new COVID-19 pandemic cases, government response measures, and the changes in park and open space visitation across the selected countries.
From the previous figure, Figure 6, it is apparent that there were two noticeable periods of fluctuation in the percentage of park and open space visitations. These fluctuations suggest that the impact of the COVID-19 pandemic and government responses varied over time and influenced people’s decisions to visit parks and open spaces [68]. Moreover, a noteworthy observation across the selected case studies is evident: even the slightest decline in parks and open space visitations, likely due to restrictions imposed by public health authorities, was followed by a significant amount of visits once restrictions were slightly eased.
In Greece, park and open space visitations surged nearly fourfold following a brief period of barely noticeable decline, unaffected by current government measures. This observation is also confirmed by Larson et al. as a study utilizing cell phone location data, which indicated a 30% increase in visits to urban park in Athens during the summer of 2020 compared to the previous year [69]. Similarly, Poland, France, Italy, Slovakia, and Slovenia also exhibited an approximate threefold increase in visitations after a 40% averaged decline in park and open space visitation. Moreover, Austria, Belgium, Portugal, Ireland, and the UK all encountered double the number of visitors as compared to the regular daily visits before the COVID-19 pandemic. Other countries experienced a more modest increase in park and open space visitation such as Belarus, Bosnia and Herzegovina, Romania, and Moldova, reaching a 50% increase from the pre-pandemic baseline visits. This modest increase is probably linked to the better adherence to implemented governmental restrictions, as indicated by Niță et al. An evaluation of urban park usage in Bucharest, Romania, during the COVID-19 pandemic, utilizing data extracted from public social media platforms, revealed a strong correlation between park visitation patterns and pandemic-related restrictions [70].
Moreover, from a preliminary observation, and given the study’s interest regarding the strike in parks and open space visitations, an intriguing pattern when examining the average two-period increase in park and open space visitation was noticed. Notably, countries with the highest rates of visitation increase were also the highest in reporting numbers of the COVID-19 pandemic daily new cases. Slovakia, Belgium, Portugal, Austria, and Greece stood out in this regard, with visitations increasing by an average of 150% over an 9.5-month period compared to pre-pandemic levels. This means these countries saw their parks and open space visitations more than double. Interestingly, these countries maintained relatively stringent public health restrictions, with an average stringency score of 55.5 out of 100. Conversely, countries exhibiting the lowest increases in visitations to parks and open spaces tended to report lower daily COVID-19 pandemic cases. Romania, Bosnia, Belarus, Moldova, and Poland, for instance, saw an average increase of only 77% in visits to parks and open spaces spanning over an averaged 6.5-month period. However, the relationship between visitation increases and the strictness of public health measures was not straightforward. Despite the significantly lower increase in parks and open space visitations, these countries implemented public health restrictions with an average stringency score of 47, which is not substantially different from the higher-visitation group.
The visitation trends shifted, potentially aligned with seasonal shifts and low public desire for outdoor recreation. The group of countries that initially experienced the highest visitation increase (150%) subsequently saw a 20% decline in parks and open space usage over a 2.5-month period, coinciding with the implementation of stricter public health measures (stringency score increased to 72). Conversely, the group with the lowest initial increase (77%) experienced a more substantial 25% decline in visitation over an average of 6-month period, despite implementing less stringent measures (stringency score of 59).
Based on these observations, we can draw several initial conclusions about the relationship between the park and open space visitation trend, the duration of visitation trend, public health policies, and the COVID-19 pandemic cases. Countries with the highest increases in park and open space visitations demonstrated a complex pattern: during the visitation increase trend, they initially had less strict public health policies and significantly higher visitation rates over extended periods, as well as reporting notably higher daily new COVID-19 pandemic cases compared to the group with the lowest visitation increase. Interestingly, in the opposing visitation trend most likely respective to seasonal preferences, the group with the highest initial visitation increase required more stringent implementation of public health measures to achieve even a modest decline in visitations. This decline occurred over a significantly shorter duration, despite the severe implementation of public health policies. In contrast, the group that initially experienced the lowest visitation increases subsequently saw greater declines in visitation with less stringent public health interventions required.
Therefore, tracking the magnitudes of visitation trends (y, y) and their respective durations (x, x) and implemented public health measures has become an essential factor to be drawn for statistical validation to explore the contributing factors behind the significant increases in visitations and their impact on the pandemic trajectory.

5. Results

There were notable changes in visits to social infrastructures, and towards parks and open spaces in particular. The main objective of this study was to first validate the impact of the COVID-19 pandemic statistically on the behavioral shifts towards social infrastructures. Secondly, we assessed the impact of park and open space visitations on the COVID-19 pandemic, while considering vital factors at play during different visitation trends in order to identify the root causes behind such impact, if existent.

5.1. The Impact of the COVID-19 Pandemic on Behavioral Shifts Towards Social Infrastructures

In this section, we conducted a Housman test, which is a statistical tool used to select the optimal model, with the null hypothesis favoring the random-effects model and the alternative hypothesis favoring the fixed-effects model, typically decided based on the p-value. As depicted in Table 1, the fixed/random-effects model was applied to explore the relationship between the new COVID-19 pandemic cases (independent variable) and the demand for different social infrastructures (dependent variable). Significance testing of the independent variables was conducted using t-tests, where a p-value less than 0.05 indicated statistical significance, while a p-value greater than 0.05 suggested a lack of significance. From Table 1, the data read as follows:
  • For the impact of the new COVID-19 pandemic cases on retail and recreation, the fixed effects panel data model was deemed appropriate. A significant negative effect was observed with a p-value of 0.00 (p < 0.05) and an estimated coefficient of B = −15.49.
  • For the impact of the new COVID-19 pandemic cases on groceries and pharmacies, the random effects panel data model was deemed appropriate. A significant positive effect was observed with a p-value of 0.00 (p < 0.05) and an estimated coefficient of B = 7.42.
  • For the impact of the new COVID-19 pandemic cases on residential areas, the fixed effects panel data model was deemed appropriate. A significant positive effect was observed with a p-value of 0.00 (p < 0.05) and an estimated coefficient of B = 4.16.
  • For the impact of the new COVID-19 pandemic cases on transit stations, the fixed effects panel data model was deemed appropriate. A significant negative effect was observed with a p-value of 0.00 (p < 0.05) and an estimated coefficient of B = −19.73.
  • For the impact of the new COVID-19 pandemic cases on workplaces, the fixed effects panel data model was deemed appropriate. A significant negative effect was observed with a p-value of 0.00 (p < 0.05) and an estimated coefficient of B = −20.94.
  • For the impact of the new COVID-19 pandemic cases on parks, the fixed effects panel data model was deemed appropriate. A significant positive effect was observed with a p-value of 0.00 (p < 0.05) and an estimated coefficient of B = 41.17.

5.2. The Impact of Parks and Open Spaces on the COVID-19 Pandemic

As indicated in Table 1, the COVID-19 pandemic resulted in notable increases in park and open space visits across selected case studies. However, when carrying out a preliminary assessment of the impact of parks and open spaces on the COVID-19 pandemic, as presented in Figure 7, it reveals a significant weak negative correlation (r = −0.1511), with p < 0.0001, t-statistic = −10.1946. This suggests that as park and open space usage increased, there was a slight tendency for the new COVID-19 pandemic cases to decrease. This contradicting outcome was further assessed by incorporating essential factors that influence park and open space visitation during both increased and declined visitation trends: visitation duration, implemented public health measures, and visitation magnitudes, in order to perform further analyses and delve deeper into accurate readings.

5.2.1. ANOVA and Post Hoc Test

The following ANOVA analysis was conducted to identify factors that are most influential in affecting the two visitation trends, presented in Table 2.
Readings of the ANOVA analysis in Table 2 read as follows:
  • The visitation magnitude factor showed a highly significant effect on the visitation trends, with an F-statistic of 171.0662 and a p-value of 0.0. This suggests that changes in visitation magnitudes were a key driver of the observed trends.
  • Visitation duration was another significant factor, with an F-statistic of 29.5272 and a p-value of 0.0. This suggests that the length of time (in months) was an important differentiator between the groups, contributing to the trends observed.
  • Public health stringency also showed a significant effect, with an F-statistic of 26.8124 and a p-value of 0.0. This indicates that the level of public health measures was a significant factor in differentiating the groups, impacting the trends.
  • The factor of new infections per million was not statistically significant, with an F-statistic of 1.3991 and a p-value of 0.2417. This suggests that infection rates did not strongly differentiate between the groups and were not a key driver of the trends.
After conducting the ANOVA analysis, the post hoc test was then carried out to provide a clearer understanding of how the visitation trends affected the detected significant factors from the previously conducted ANOVA analysis.
From Table 3, significant differences were found between the following factors for the two visitation trends of visitation increases and declines:
  • Park and open space visitations with increasing trends showed significantly higher visitation magnitude values (MD = 143.15, p < 0.001), with an average of 143.15 percentage points higher than in the visitation decline trend. The tight confidence interval [121.24, 165.06] indicates that this is a very reliable difference.
  • Park and open space visitations with increasing trends demonstrated significantly lower public health stringency measures (MD = −16.49, p < 0.001), with stringency levels 16.49 percentage points lower than in locations with declining visitation trends. The narrow confidence interval [−22.87, −10.12] confirms this inverse relationship was consistent.
  • Park and open space visitations with increasing trends maintained significantly longer durations (MD = 4.23, p < 0.001), extending to 4.23 months longer than in declining visitation trends. The narrow confidence interval [2.67, 5.79] demonstrates that this is a reliable pattern.

5.2.2. Correlation Analysis

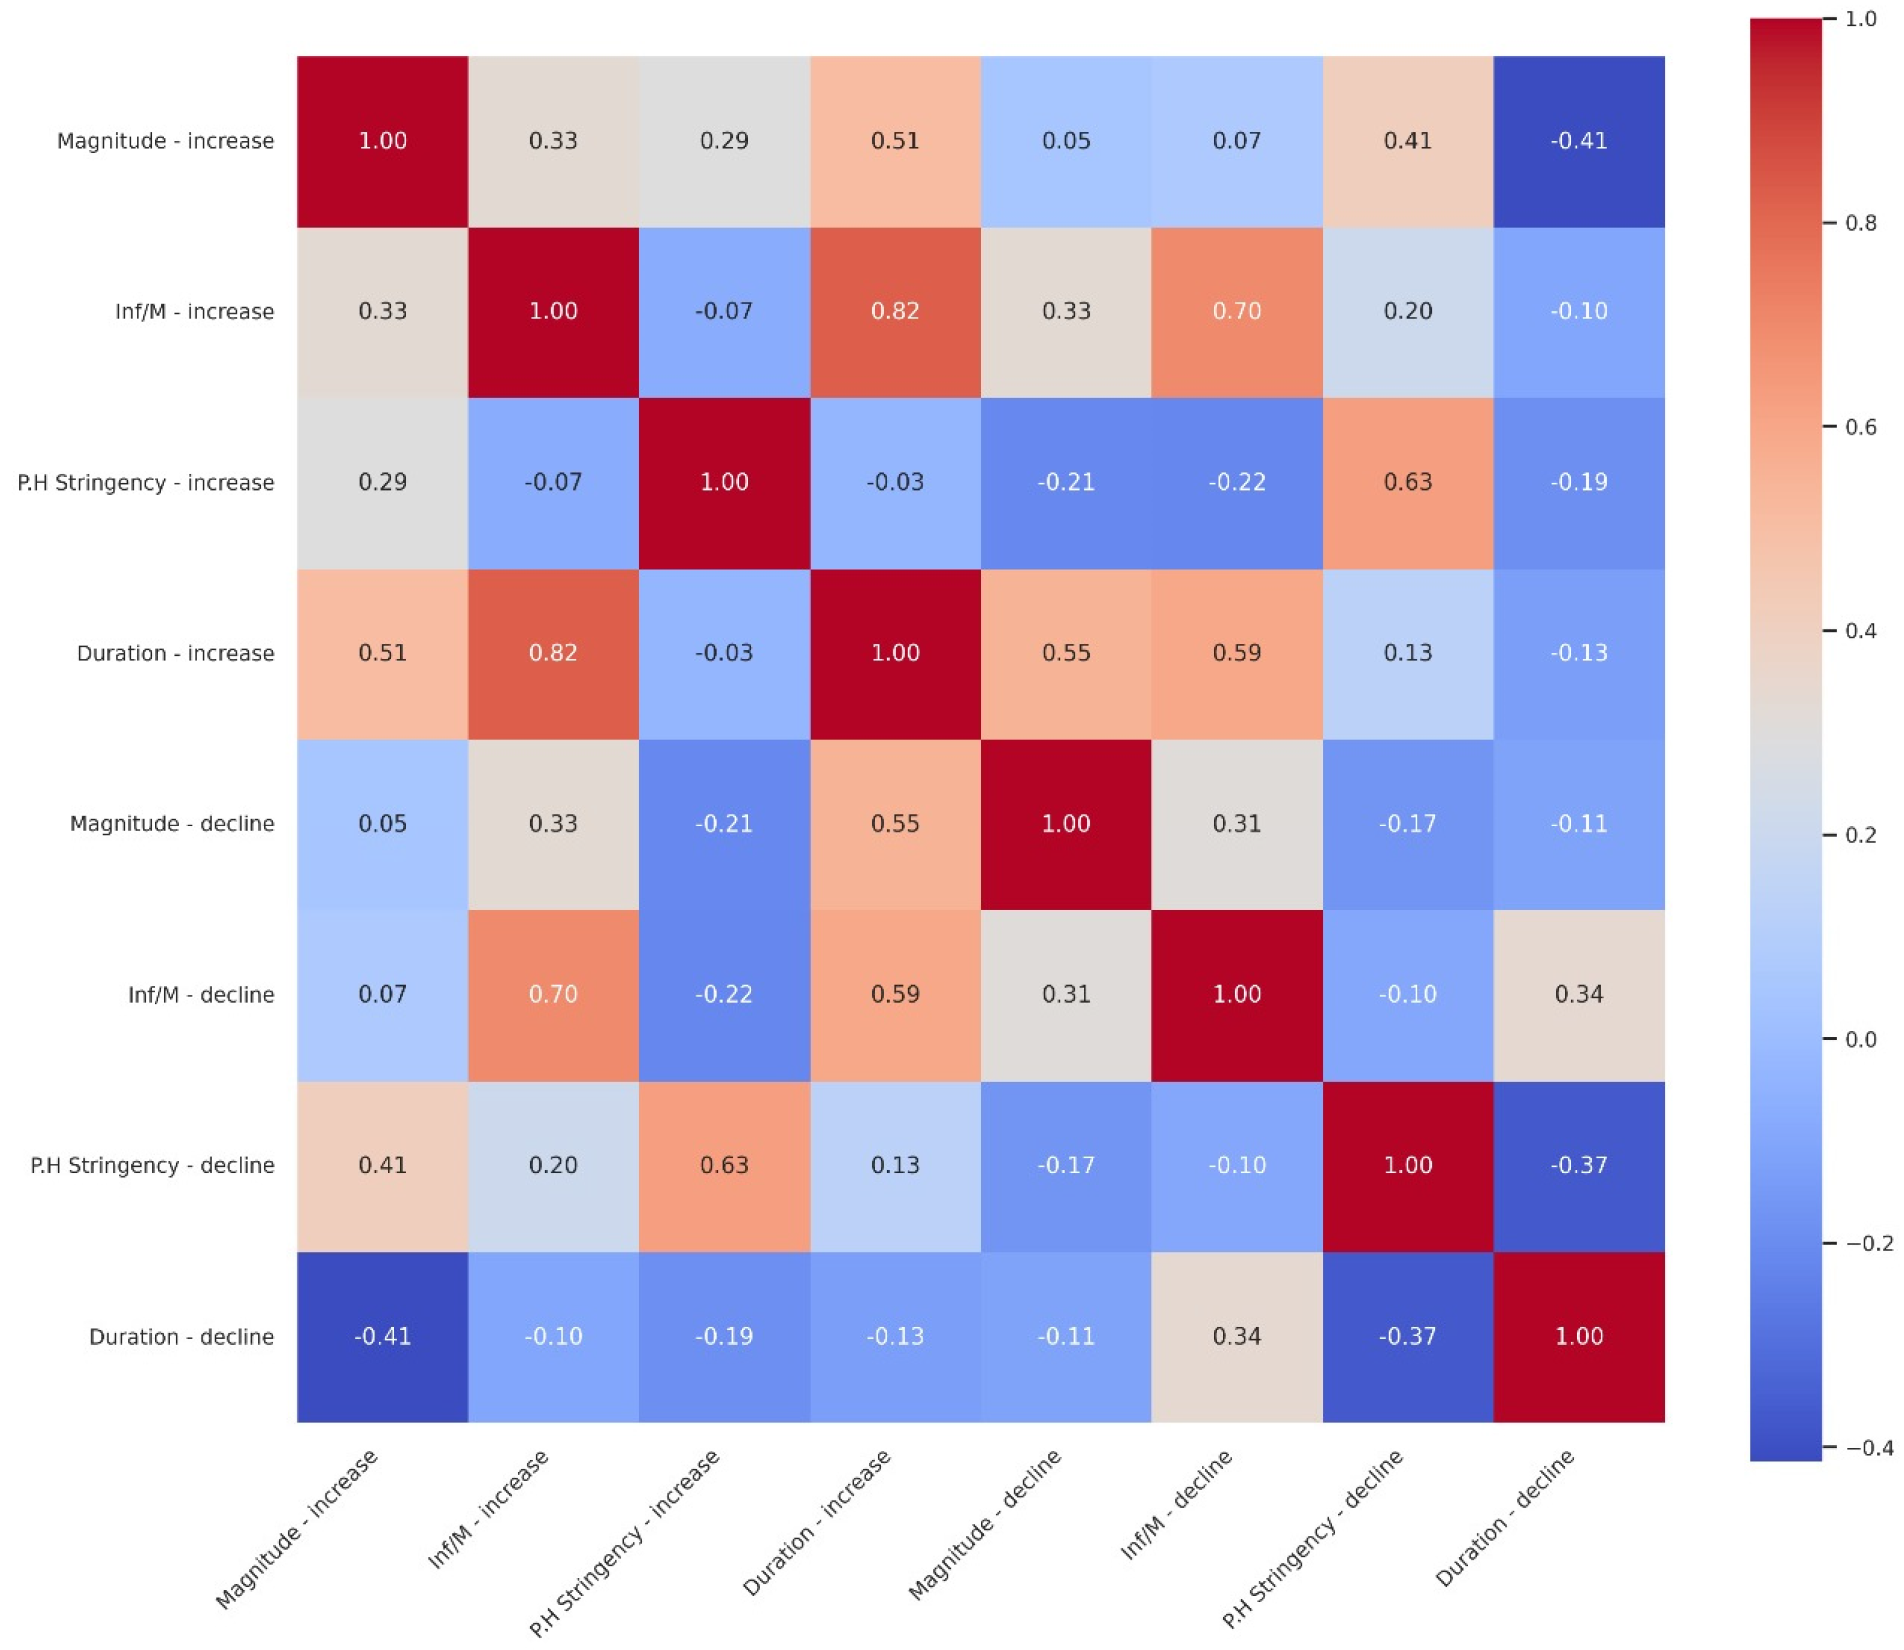
To examine the relationship between study factors within different visitation trends to parks and open spaces and across the selected case studies, Pearson correlation was conducted and presented in Figure 8, which reads as follows:
Strong positive correlations (r > 0.6):
  • Infection rates during increased visitation periods strongly correlated with the duration (x) of the same visitation trend (r = 0.82), suggesting that longer visitation periods during increased visitation trends correlated with higher infection rates.
  • Infection rates showed strong consistency between increase and decline periods (r = 0.70), indicating persistent infection patterns across both visitation trends.
  • Public health measures maintained a strong correlation between increase and decline visitation trends (r = 0.63), reflecting consistent policy implementation.
Moderate positive correlations (0.3 < r < 0.6):
  • Visitation magnitude during increased visitation trends (y) moderately correlated with visitation duration (x) of the same trend (r = 0.51), showing that higher visitation magnitudes tended to last longer, also possibly reflecting that a longer period of increased visitations had an impact on increasing the total number of visits.
  • Visitation duration during the increased trend (x) showed a moderate relationship with the visitation magnitude of the following declined trend (y) (r = 0.55), suggesting that the longer the increased trend persisted, the lower the visitations that occurred in the opposing trend, likely due to the stringent implementation of public health measures.
  • Visitation magnitude during the increased trend (y) showed moderate correlation with stringent public health measures implemented in the visitation decline trend (r = 0.41), likely indicating the counter effect of implementing stringent public health attempting to suppress visitation levels on the visitation flows once restrictions were eased.
Moderate negative correlations (r < −0.3):
  • Visitation magnitude during increased visitation trends (y) negatively correlated with visitation duration of the opposing trend (x) (r = −0.41), indicating that shorter visitation decline periods triggered higher rebound levels of visitation surges when implemented restrictions were eased.
  • The stringency of implemented public health measures during visitation decline trends negatively correlated with the corresponding visitation duration of the same trend (r = −0.37), suggesting that stricter measures may have shortened visitation decline phases.

5.2.3. Regression Analysis

After gaining an understanding of how study factors correlate with varying visitation trends and across the selected case studies, it is crucial to highlight significant robust outcomes using regression models. Initially, regression analysis was performed to validate the influence of parks and open space visitation on infection spread. Subsequently, another regression analysis was undertaken to explore the relationships between study factors during periods of both increased and declined visitation trends, aiming to identify factors associated with earlier findings.
The following OLS regression analysis was conducted to indicate the impact of study factors during increased visitation periods on associated new infections. From Table 4, the data read as follows:
  • The independent variables (implemented public health measure, visitation duration, and visitation magnitude) managed to explain 69.2% of the variance in dependent variables (associated new infections/M).
  • There was a significant effect of visitation duration when p-value < 0.05.
  • There was no significant effect of visitation magnitudes when p-value > 0.05. This outcome could have been due to the nature of parks and open spaces, which typically have ample airflow that minimizes disease transmission, making the number of visitors less impactful. Additionally, the factor of parks and open space size was not considered.
  • There was no significant effect of implemented public health measures when p-value > 0.05. This lack of significance could have been due to the study’s timeframe, which included both the pre- and post-vaccination periods.
The presented Table 4 also presents robustness checks to confirm the model’s robustness and read as the following:
  • Jarque–Bera test (for normality of residuals): The JB statistic: 0.4013 with p-value: 0.8182. The high p-value (>0.05) indicates that the residuals were likely normally distributed.
  • Breusch–Pagan test (for heteroscedasticity): The BP statistic: 5.2061 with p-value: 0.1573. The p-value was greater than 0.05, indicating that there was no strong evidence of heteroscedasticity in the model.
These robustness checks suggest that the model met the assumptions of normality of residuals and homoscedasticity, which are important for the validity of the OLS regression results.
As in Table 4, the following analysis of Table 5 was conducted to indicate the impact of study factors during periods of visitation decline on associated new infections.
To analyze the relationship between the new COVID-19 pandemic infections and study factors during the declined visitation trend, we initially conducted an ordinary least squares (OLS) regression on the raw data. To address potential issues with non-normality and heteroscedasticity, we applied several transformations to the dependent variable: logarithmic, square root, cube root, and Box–Cox. Each transformed model was evaluated using multiple criteria, including R-squared, adjusted R-squared, the Jarque–Bera (JB) test for normality, and the Breusch–Pagan (BP) test for heteroscedasticity. The Box–Cox transformation emerged as the optimal choice and was subsequently used in the final regression model with the same set of independent variables. The regression data from Table 5 read as follows:
  • The independent variables (implemented public health measure, visitation duration, and visitation magnitude) managed to explain 29% of the variance in the dependent variable (associated new infections/M).
  • There was a significant effect of visitation duration when p-value < 0.05.
  • There was a significant effect of visitation magnitude when p-value < 0.05.
  • There was no significant effect of implemented public health measures when p-value > 0.05. This lack of significance could have been due to the study’s timeframe, which included both the pre- and post-vaccination periods.
  • There was no significant effect for applied public health measures when p-value > 0.05.
  • Jarque–Bera test (for Box–Cox normality of residuals): The high p-value (>0.05) indicated that the residuals were likely normally distributed.
  • Breusch–Pagan test (for Box–Cox heteroscedasticity): The high p-value (>0.05) indicated that there was no strong evidence of heteroscedasticity in the model.
After assessing the impact of study factors on the COVID-19 pandemic infections during periods of both increases and declines of park and open space visitations, examining the interaction of study factors across these distinct visitation trends is essential. This study aimed to determine whether specific factors from one trend can influence other factors from the opposite trend, potentially impacting the trajectory of the pandemic. Therefore, the following regression analysis, illustrated in Table 6, examines the relationship between individual factors within each visitation trend and the collective impact of all factors from one trend on the individual factors of the contrasting trend. However, to derive practical recommendations from this study, the combined assessment of study factors excluded the new infections variable. This decision was based on the understanding that new infections are not a controllable variable in different scenarios. By excluding this variable, the aim was to isolate and highlight the interplay of controllable variables across varying visitation trends.
From Table 6, the following significant outcomes are derived:
  • Visitation magnitude during visitation decline trends (y) positively explained 30.2% of the variance in visitation duration of the contrasting trend (x).
  • Applied public health measures during visitation decline trends managed to explain 17% of the variance in visitation magnitude of the contrasting trend (x).
  • The duration of visitations declines managed to also explain 17% of the variance in visitation magnitude of the contrasting trend (x).
  • All study factors during visitation decline periods (except infection rates) managed to explain 25% of the variance in visitation magnitudes of the opposing visitation trend (y).
  • All study factors during visitation decline periods (except infection rates) managed to explain 35.5% of the variance in visitation duration of the opposing visitation trend (x).
  • All study factors during increased visitations (except infection rates) managed to explain 47% of the variance in visitation magnitudes of the opposing visitation trend (y).

6. Discussion and Conclusions

6.1. Discussion

The main aim of this study was to evaluate the impact of the COVID-19 pandemic on changes in social infrastructure demand. While most social infrastructures experienced significant declines given the implemented restrictions regarding social interactions to suppress infection spread, parks and open space visitations revealed contrasting outcomes, where visitation levels significantly mounted when compared to pre-pandemic baseline and across all selected case studies. This distinctive finding prompted an investigation into how parks and open space visitation patterns influenced the COVID-19 pandemic trajectory, establishing another key objective of this study.
When addressing the first research objective, the retail and recreation sectors experienced notable reductions in visitation (−15.49% average decrease), reflecting both government restrictions and voluntary behavioral changes. Groceries and pharmacies showed increased visitation patterns (+7.42% average increase), likely due to essential shopping needs and stockpiling behavior during the pandemic period. Residential use demonstrated a subtle increase (+4.16% average), indicating weak adherence to stay-at-home policies. Transit station usage showed significant decreases (−19.73% average), suggesting effective implementation of visitation restrictions and public caution regarding the use of public transportation. Workplace visitation similarly decreased (−20.94% average), reflecting the widespread adoption of remote working arrangements and business closures during the pandemic. Parks and open spaces exhibited a distinct pattern with increased visitation trends, showing a substantial average increase of (+41.17% average).
With the dramatic visitation demands for parks and open spaces, this study delved deeper to understand the impact of park and open space visitation trends on the COVID-19 pandemic. This study attempt opted for the inclusion of visitation trends to draw definitive conclusions after proving the insignificant preliminary impact of visitations on progressing the pandemic situation. To do so, both the duration and magnitudes for each visitation trend were important factors to perceive. Moreover, since park and open space visitations were significantly influenced by implemented public health measures, the public health stringency index was also another significant factor to account for. To assess the significance of the chosen study factors, an ANOVA and post hoc test were conducted to determine significant differences between study factors across the two perceived visitation trends in the specified case studies. All chosen study factors demonstrated statistical differences between the two visitation trends, confirming their successful inclusion in this study. Specifically, visitation magnitudes and durations during increased visitation trends rose by 143.15% and 4.23 months, respectively, compared to the contrasting visitation trend. Implemented public health policies, on the other hand, showed less stringent implementations by 16.49 points, possibly explaining the higher magnitudes and durations during the increased visitation trend.
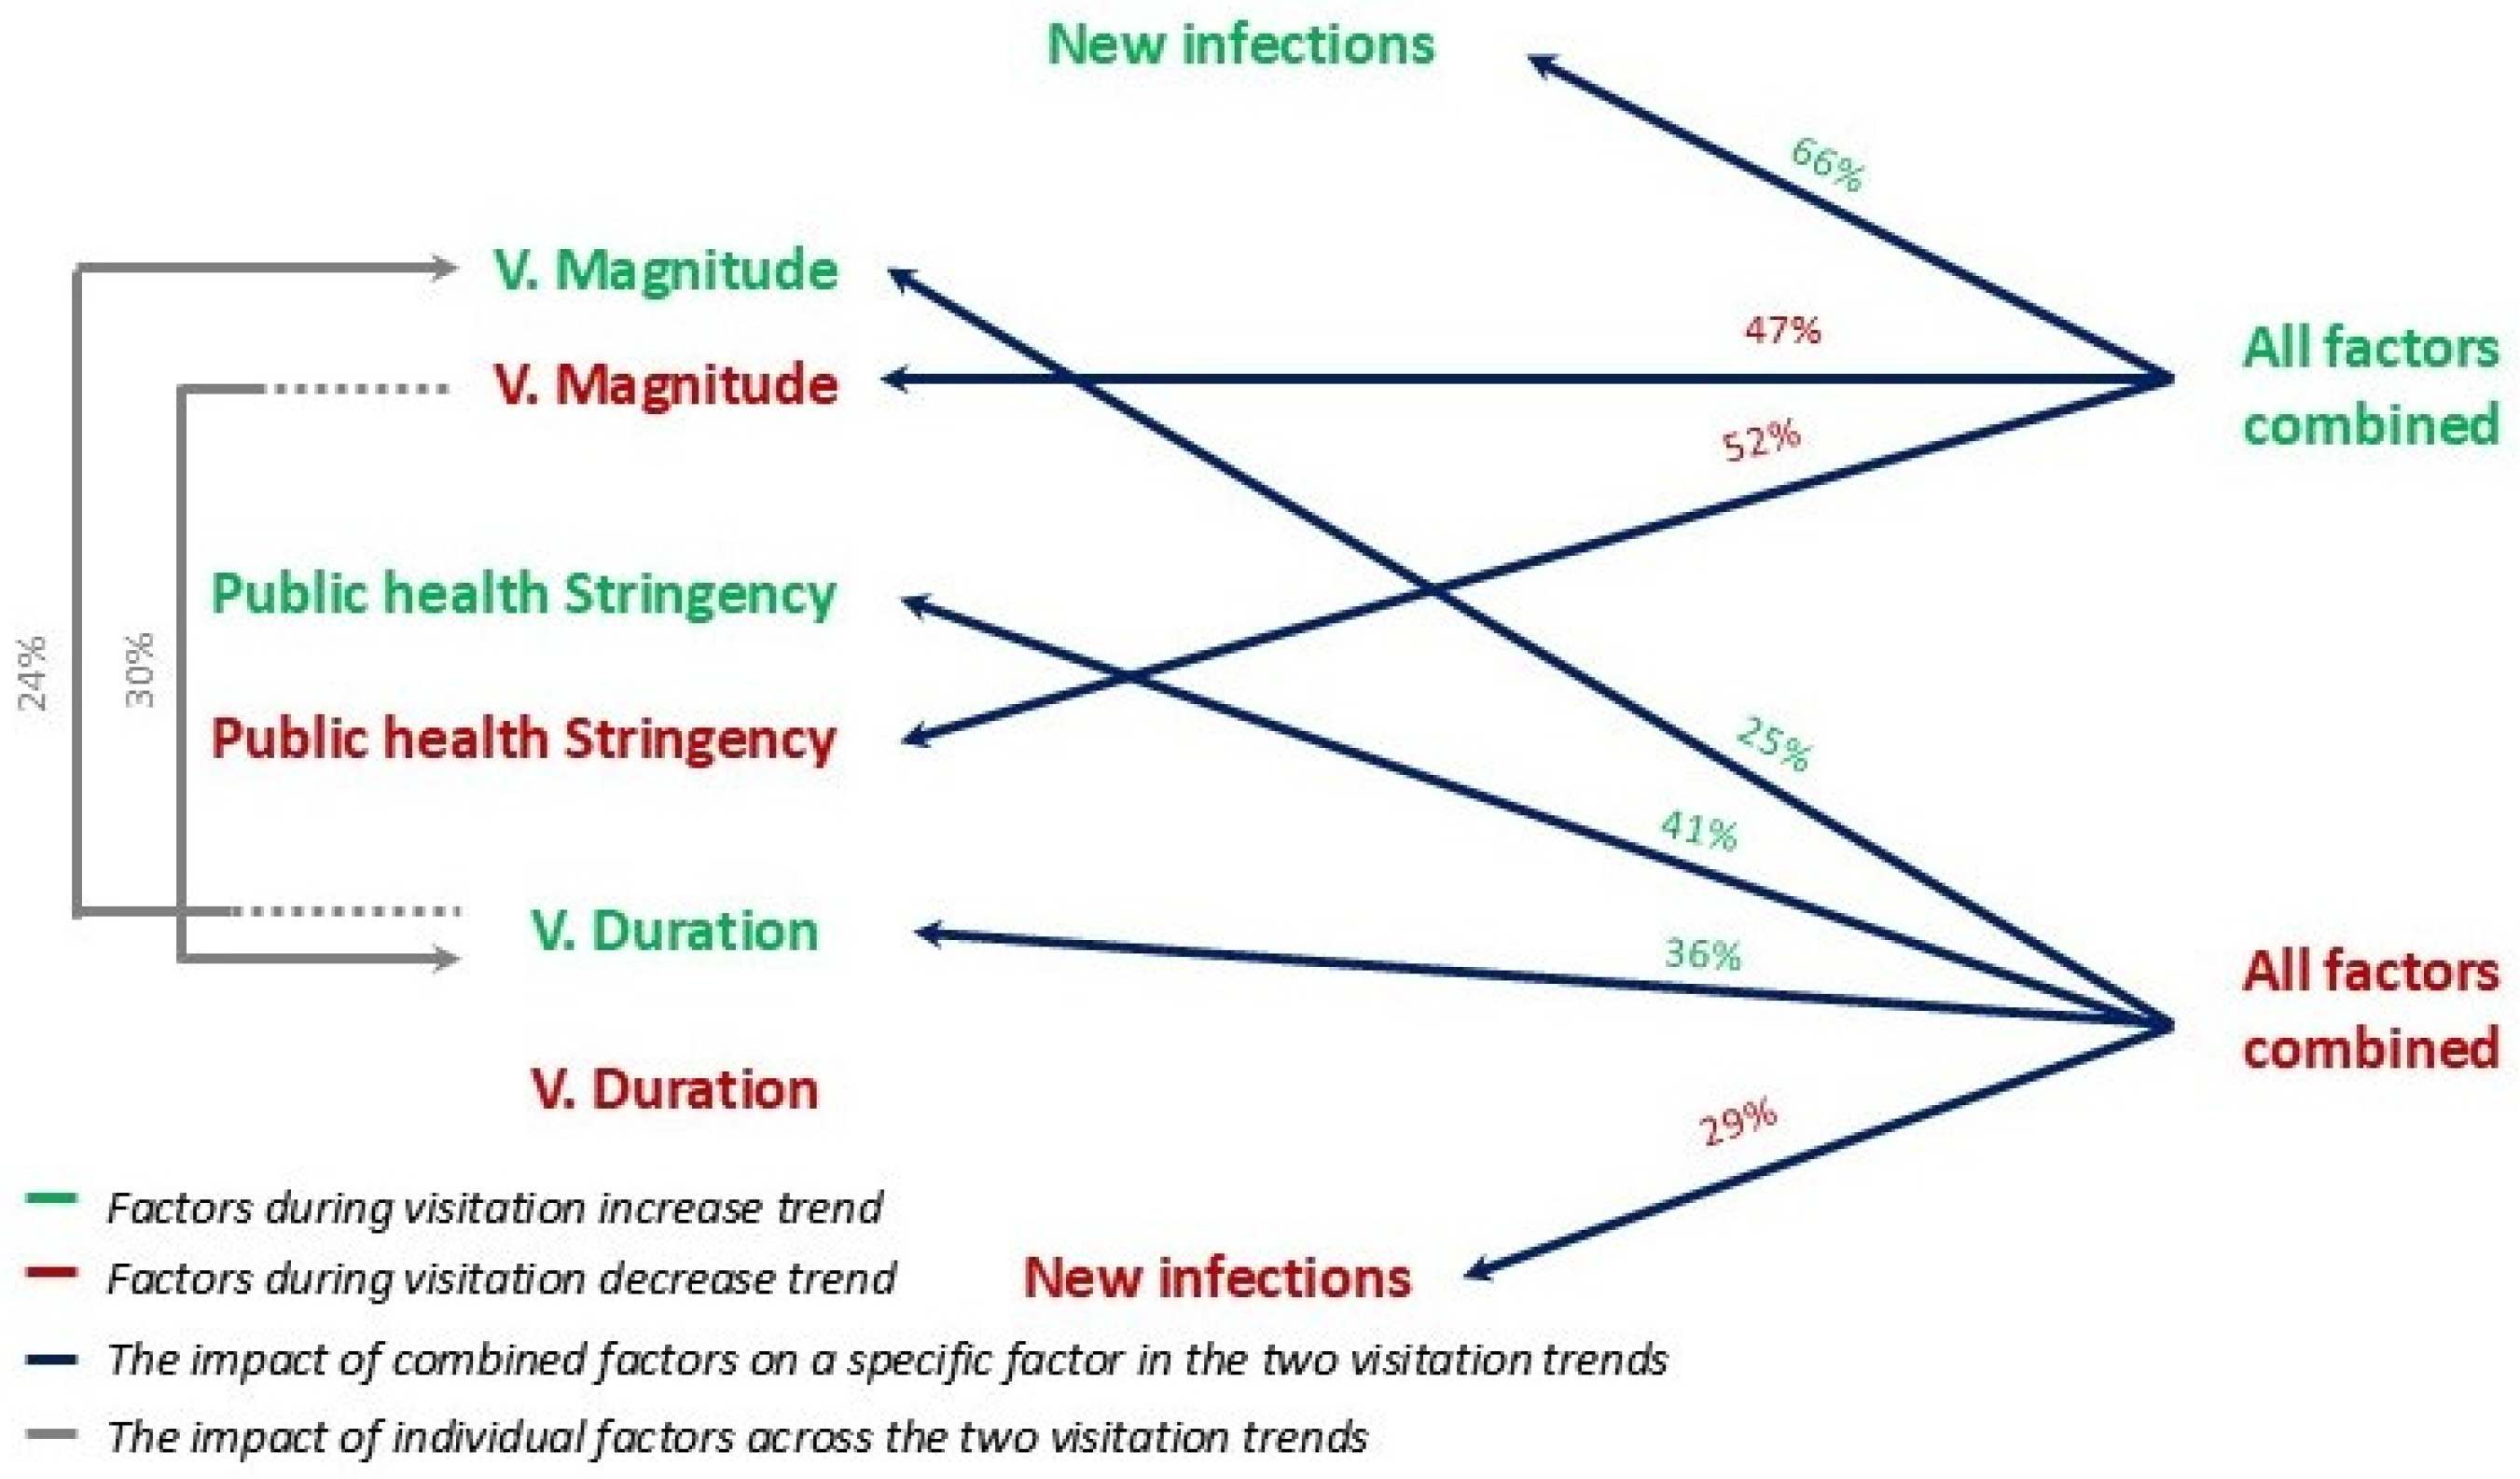
After proving the significance of the study’s chosen factors, forms of regression analysis followed to confirm robust outcomes. All study factors during periods of increased visitation, as represented in Figure 9, managed to explain 69.2% of the associated new infections reported, and only 29% during the contrasting trend. While both outcomes are considered significant, especially in the field of urban studies where human behaviors are unpredictable, the striking impact of study factors during the increased visitation trend is regarded as an indicator of the significant influence of increased visitations on the COVID-19 pandemic spread. While no previous studies directly assessed the impact of parks and open space use on the COVID-19 pandemic transmission, some have signaled an indirect influence of increased visitations on disease transmission [71]. while others denote no to negative correlations, such as Alizadehtazi et al. and Wang et al. [42,50].
Given that the duration of the increased visitation trend was the most influential in explaining the new associated infections, it was later found that the magnitudes of the visitation decline trends managed to explain 30.2% of variations in the duration of opposing visitation trends. This reflects the direct impact of curbing people’s visitation demands to parks and open spaces on prolonging the periods of increased visitations when measures are slightly eased, such as during the pandemic situation. A study conducted on parks in New Jersey found that lifting stringent public health orders, in place to suppress parks and open space visits, led to significant surges in visitation prior to their implementation [72]. Similarly, a study conducted by Tully et el. found that certain public health measures inadvertently increased park visits rather than containing them [73].
Another surprising finding revealed that all three study factors during periods of visitation declines combinedly managed to explain 35.5% and 25.3% of variations in visitation duration (x) and magnitudes (y) of the contrasting trend, respectively. This proves that while increased visitations do in fact inflame the pandemic situation, conditions to suppress people’s desire to seek refuge in parks and open space visitations have the potential to further trigger the pandemic inflammation. From another perspective, although this study found that measures reducing park visitations led to increased visits once lifted, this does not necessarily imply that parks and open spaces contribute to disease transmission. Rather, it is the overcrowding of these areas that poses the risk. While parks and open spaces may offer lower transmission risks, enforcing social distancing in these areas proved difficult. Factors such as limited space, inconsistent mask-wearing compliance, and adherence difficulty to gathering restrictions all contributed to the challenges of implementing effective distancing measures in outdoor settings that can thus ignite transmission risks [74].
Therefore, according to study findings, people are more than ever willing to face disease contraction threats for the sake of their mental well-being, regardless of the implemented health measures aimed at reducing social interactions and infection spread. It is essential to respect people’s strong desire to go out while ensuring safe accessibility and use of such infrastructure.

6.2. Conclusions

Since this study has proven that while increased park and open space visitations contributed to the progression of the COVID-19 pandemic, attempts to curb these visits through restrictive measures led to significant surges once restrictions were eased. Moreover, this pattern suggests that suppressing public demand for parks and open spaces can inadvertently lead to increased visitation and new infections. Therefore, it is recommended that the inevitable increase in visits to parks and open spaces be accommodated through a multifaceted approach including controlled access, enhancing existing facilities, promoting safe practices, creating additional temporary open spaces, and utilizing real-time monitoring systems. This balanced approach can better manage the visitations to parks and open spaces while minimizing virus transmission risks, supporting community well-being during other relevant pandemic strikes.
However, it is important to acknowledge two key limitations of this study. First, while the data sources enable robust analytical possibilities, inherent limitations in data quality, representation, and measurement precision require careful consideration when interpreting results. Second, there are research gaps including regional variations in parks and open space availability, usage patterns, the dynamic nature of the pandemic, and differences in park sizes and proximity to residential areas. These factors can significantly influence visitation patterns and associated risks. Future study should focus on country-specific analyses incorporating diverse park categories, sizes, and proximity to residential areas to accurately assess the impact of parks and open spaces visits on the COVID-19 pandemic. Additionally, post-pandemic visitation studies are crucial to determine whether behavioral changes have persisted. These focused studies would enhance the understanding of the pandemic’s long-term effects on parks and open spaces visitation habits, informing future public health strategies and urban planning decisions.

Author Contributions

Methodology, M.G.N.M. and S.A.A.A.; Software, S.A.A.A.; Validation, M.M.; Formal analysis, S.A.A.A.; Investigation, H.H.; Resources, M.M.; Data curation, M.G.N.M.; Writing—original draft, M.G.N.M.; Writing—review & editing, S.A.A.A.; Visualization, M.G.N.M.; Supervision, H.H.; Project administration, H.H.; Funding acquisition, H.H. All authors have read and agreed to the published version of the manuscript.

Funding

This research is supported by the Center for Balance Architecture of Zhejiang University (Project No: K Heng 20203512-02B, Index and planning methods of resilient cities).

Institutional Review Board Statement

Not applicable.

Data Availability Statement

The data presented in this study are available on request from the corresponding author.

Acknowledgments

We thank Han’s lab for their support, which was crucial to this study. We also acknowledge Chat-gpt 4o for its assistance in improving the manuscript’s grammar and academic English.

Conflicts of Interest

The authors declare no conflict of interest.

Appendix A

Table A1. Average changes in social infrastructure visitations and average infections.
CountriesResidentialRetail and RecreationGrocery and PharmacyTransit StationsWorkplacesParks and Open SpacesTotal Cases/M
Austria5.4−24.8−1.2−21.7−23.638.1665,539
Slovenia4.7−15.2−7.7−10.9−17.859.3645,148
France6.6−20.37.8−16.5−23.349.6606,726
Greece3.0−11.330.8−9.2−19.291.4576,922
Portugal9.1−12.616.1−22.6−19.925.6549,775
Italy6.2−19.02.1−25.1−22.535.4427,082
Belgium8.1−16.37.5−23.5−23.346.2410,241
UK9.6−26.8−3.7−37.5−31.735.3356,927
Slovakia5.2−14.710.2−16.8−17.754.6341,743
Ireland9.7−20.77.5−35.6−28.940.2340,411
Romania1.7−15.26.0−21.6−19.97.0177,649
Poland3.8−8.214.7−14.5−11.465.1172,131
Moldova−2.0−8.70.9−15.7−21.6−0.4153,952
Bosnia and Herzegovina−3.90.128.2−12.4−8.227.7123,742
Belarus−1.4−14.56.3−7.1−18.517.6105,381
Source: the researcher compiled from [55,57].
Table A2. Factors affecting visitation trends for 15 European countries.
CountryOutdoor Visitation Increase TrendOutdoor Visitation Decline Trend
Magnitude %New Inf.
/M
Public Health Stringency %Duration
(M)
Magnitude %New Inf.
/M
Public Health Stringency %Duration
(M)
Greece212.646.761.17.0−38.04.775.52.0
276.0521.472.114.0−3.0104.383.51.0
Austria112.252.146.06.0−26.034.774.12.0
112.5721.957.812.0−21.6349.772.74.0
France170.8117.152.05.0−64.837.981.03.0
178.2782.949.312.0−23.6300.568.34.0
Slovenia111.983.649.96.0−20.713.474.62.0
175.0881.251.113.0−23.4677.481.83.0
Portugal98.168.961.15.0−64.738.073.73.0
125.4823.948.710.0−51.4371.672.66.0
Belgium92.9211.559.27.0−19.075.672.82.0
101.3620.946.513.0−5.3183.860.42.0
Slovakia159.488.153.48.0−14.02.968.11.0
141.0762.748.712.0−5.4921.668.23.0
Ireland76.058.257.54.0−21.643.974.64.0
105.3597.848.412.0−11.5258.482.64.0
Italy128.649.067.05.0−78.948.682.73.0
153.1158.175.111.0−33.9312.278.97.0
UK85.8100.968.67.0−19.447.163.42.0
87.2567.349.412.0−11.7411.882.23.0
Romania50.155.848.03.0−46.711.771.84.0
64.460.151.65.0−28.6366.965.412.0
Belarus72.142.228.18.0−27.0150.541.07.0
63.0137.633.76.0−21.7287.820.94.0
Bosnia54.680.954.96.0−10.29.878.32.0
76.7176.337.310.0−16.2252.144.36.0
Moldova27.7112.463.34.0−35.628.077.93.0
21.187.754.65.0−29.3342.650.912.0
Poland172.047.349.26.0−33.15.769.02.0
173.3254.846.311.0−9.6323.873.35.0
Source: the researcher compiled from [55,57,58].

References

  1. Venter, Z.S.; Barton, D.N.; Gundersen, V.; Figari, H.; Nowell, M.S. Back to nature: Norwegians sustain increased recreational use of urban green space months after the COVID-19 outbreak. Landsc. Urban Plan. 2021, 214, 104175. [Google Scholar] [CrossRef]
  2. Lu, Y.; Zhao, J.; Wu, X.; Lo, S.M. Escaping to nature during a pandemic: A natural experiment in Asian cities during the COVID-19 pandemic with big social media data. Sci. Total Environ. 2021, 777, 146092. [Google Scholar] [CrossRef]
  3. Beery, T.; Olsson, M.R.; Vitestam, M. COVİD-19 and outdoor recreation management: Increased participation, connection to nature, and a look to climate adaptation. J. Outdoor Recreat. Tour. 2021, 36, 100457. [Google Scholar] [CrossRef] [PubMed]
  4. Bulfone, T.C.; Malekinejad, M.; Rutherford, G.W.; Razani, N. Outdoor Transmission of SARS-CoV-2 and Other Respiratory Viruses: A Systematic Review. J. Infect. Dis. 2021, 223, 550–561. [Google Scholar] [CrossRef] [PubMed]
  5. Okech, E.A.; Nyadera, I.N. Urban green spaces in the wake of COVID-19 pandemic: Reflections from Nairobi, Kenya. GeoJournal 2022, 87, 4931–4945. [Google Scholar] [CrossRef]
  6. da Schio, N.; Phillips, A.; Fransen, K.; Wolff, M.; Haase, D.; Ostoić, S.K.; Živojinović, I.; Vuletić, D.; Derks, J.; Davies, C.; et al. The impact of the COVID-19 pandemic on the use of and attitudes towards urban forests and green spaces: Exploring the instigators of change in Belgium. Urban For. Urban Green. 2021, 65, 127305. [Google Scholar] [CrossRef]
  7. Berdejo-Espinola, V.; Suárez-Castro, A.F.; Amano, T.; Fielding, K.S.; Oh, R.R.Y.; Fuller, R.A. Urban green space use during a time of stress: A case study during the COVID-19 pandemic in Brisbane, Australia. People Nat. 2021, 3, 597–609. [Google Scholar] [CrossRef]
  8. Fagerholm, N.; Eilola, S.; Arki, V. Outdoor recreation and nature’s contribution to well-being in a pandemic situation—Case Turku, Finland. Urban For. Urban Green. 2021, 64, 127257. [Google Scholar] [CrossRef]
  9. Burnett, H.; Olsen, J.R.; Nicholls, N.; Mitchell, R. Change in time spent visiting and experiences of green space following restrictions on movement during the COVID-19 pandemic: A nationally representative cross-sectional study of UK adults. BMJ Open 2021, 11, e044067. [Google Scholar] [CrossRef]
  10. Venter, Z.S.; Barton, D.N.; Gundersen, V.; Figari, H.; Nowell, M. Urban nature in a time of crisis: Recreational use of green space increases during the COVID-19 outbreak in Oslo, Norway. Environ. Res. Lett. 2020, 15, 104075. [Google Scholar] [CrossRef]
  11. AbouKorin, S.A.A.; Han, H.; Mahran, M.G.N. Role of urban planning characteristics in forming pandemic resilient cities—Case study of COVID-19 impacts on European cities within England, Germany and Italy. Cities 2021, 118, 103324. [Google Scholar] [CrossRef] [PubMed]
  12. Baker, R.E.; Mahmud, A.S.; Miller, I.F.; Rajeev, M.; Rasambainarivo, F.; Rice, B.L.; Takahashi, S.; Tatem, A.J.; Wagner, C.E.; Wang, L.-F.; et al. Infectious disease in an era of global change. Nat. Rev. Microbiol. 2021, 20, 193–205. [Google Scholar] [CrossRef] [PubMed]
  13. Grubaugh, N.D.; Ladner, J.T.; Lemey, P.; Pybus, O.G.; Rambaut, A.; Holmes, E.C.; Andersen, K.G. Tracking virus outbreaks in the twenty-first century. Nat. Microbiol. 2018, 4, 10–19. [Google Scholar] [CrossRef] [PubMed]
  14. Piret, J.; Boivin, G. Pandemics Throughout History. Front. Microbiol. 2021, 11, 631736. [Google Scholar] [CrossRef] [PubMed]
  15. Zhang, J.; Wang, T. Urban resilience under the COVID-19 pandemic: A quantitative assessment framework based on system dynamics. Cities 2023, 136, 104265. [Google Scholar] [CrossRef]
  16. Zhen, Q.; Zhang, A.; Huang, Q.; Li, J.; Du, Y.; Zhang, Q. Overview of the Role of Spatial Factors in Indoor SARS-CoV-2 Transmission: A Space-Based Framework for Assessing the Multi-Route Infection Risk. Int. J. Environ. Res. Public Health 2022, 19, 11007. [Google Scholar] [CrossRef]
  17. Oakman, J.; Lambert, K.A.; Weale, V.P.; Stuckey, R.; Graham, M. Employees Working from Home: Do Leadership Factors Influence Work-Related Stress and Musculoskeletal Pain? Int. J. Environ. Res. Public Health 2023, 20, 3046. [Google Scholar] [CrossRef]
  18. Pierce, M.; Hope, H.; Ford, T.; Hatch, S.; Hotopf, M.; John, A.; Kontopantelis, E.; Webb, R.; Wessely, S.; McManus, S.; et al. Mental health before and during the COVID-19 pandemic: A longitudinal probability sample survey of the UK population. Lancet Psychiatry 2020, 7, 883–892. [Google Scholar] [CrossRef]
  19. Xu, T.; Shao, M.; Liu, R.; Wu, X.; Zheng, K. Risk Perception, Perceived Government Coping Validity, and Individual Response in the Early Stage of the COVID-19 Pandemic in China. Int. J. Environ. Res. Public Health 2023, 20, 1982. [Google Scholar] [CrossRef]
  20. Brooks, S.K.; Webster, R.K.; Smith, L.E.; Woodland, L.; Wessely, S.; Greenberg, N.; Rubin, G.J. The psychological impact of quarantine and how to reduce it: Rapid review of the evidence. Lancet 2020, 395, 912–920. [Google Scholar] [CrossRef]
  21. Lippi, G.; Henry, B.M.; Sanchis-Gomar, F. Physical inactivity and cardiovascular disease at the time of coronavirus disease 2019 (COVID-19). Eur. J. Prev. Cardiol. 2020, 27, 906–908. [Google Scholar] [CrossRef] [PubMed]
  22. Wang, Y.; Xu, R.; Schwartz, M.; Ghosh, D.; Chen, X. COVID-19 and Retail Grocery Management: Insights from a Broad-Based Consumer Survey. IEEE Eng. Manag. Rev. 2020, 48, 202–211. [Google Scholar] [CrossRef]
  23. Rosemberg, M.A.S.; Adams, M.; Polick, C.; Li, W.V.; Dang, J.; Tsai, J.H.C. COVID-19 and mental health of food retail, food service, and hospitality workers. J. Occup. Environ. Hyg. 2021, 18, 169–179. [Google Scholar] [CrossRef] [PubMed]
  24. Kwok, K.O.; Li, K.K.; Chan, H.H.H.; Yi, Y.Y.; Tang, A.; Wei, W.I.; Wong, S.Y.S. Community Responses during Early Phase of COVID-19 Epidemic, Hong Kong. Emerg. Infect. Dis. 2020, 26, 1575–1579. [Google Scholar] [CrossRef] [PubMed]
  25. Conrow, L.; Campbell, M.; Kingham, S. Transport changes and COVID-19: From present impacts to future possibilities. N. Z. Geogr. 2021, 77, 185–190. [Google Scholar] [CrossRef] [PubMed]
  26. Hu, S.; Chen, P. Who left riding transit? Examining socioeconomic disparities in the impact of COVID-19 on ridership. Transp. Res. Part D Transp. Environ. 2021, 90, 102654. [Google Scholar] [CrossRef]
  27. Jiang, S.; Cai, C. Unraveling the dynamic impacts of COVID-19 on metro ridership: An empirical analysis of Beijing and Shanghai, China. Transp. Policy 2022, 127, 158–170. [Google Scholar] [CrossRef]
  28. Donkin, R. The Future of Work; Springer: Berlin/Heidelberg, Germany, 2009; pp. 1–272. [Google Scholar] [CrossRef]
  29. Florida, R.; Rodríguez-Pose, A.; Storper, M. Cities in a post-COVID world. Urban Stud. 2021, 60, 1509–1531. [Google Scholar] [CrossRef]
  30. Barath, M.; Schmidt, D.A. Offices after the COVID-19 Pandemic and Changes in Perception of Flexible Office Space. Sustainability 2022, 14, 11158. [Google Scholar] [CrossRef]
  31. Kassem, M.A.; Radzi, A.R.; Pradeep, A.; Algahtany, M.; Rahman, R.A. Impacts and Response Strategies of the COVID-19 Pandemic on the Construction Industry Using Structural Equation Modeling. Sustainability 2023, 15, 2672. [Google Scholar] [CrossRef]
  32. Ikegami, K.; Ando, H.; Mafune, K.; Tsuji, M.; Tateishi, S.; Odagami, K.; Muramatsu, K.; Fujino, Y.; Ogami, A. Job stress and work from home during the COVID-19 pandemic among Japanese workers: A prospective cohort study. Health Psychol. Behav. Med. 2023, 11, 2163248. [Google Scholar] [CrossRef] [PubMed]
  33. Qosaj, F.A.; Weine, S.M.; Sejdiu, P.; Hasani, F.; Statovci, S.; Behluli, V.; Arenliu, A. Prevalence of Perceived Stress, Anxiety, and Depression in HCW in Kosovo during the COVID-19 Pandemic: A Cross-Sectional Survey. Int. J. Environ. Res. Public Health 2022, 19, 16667. [Google Scholar] [CrossRef] [PubMed]
  34. Sikos, T.T.; Molnár, D.; Kovács, A. The impact of COVID-19 pandemic on the retail sector: Policy-strategy-innovation. Észak-Mo. Stratég. Füzetek 2022, 19, 76–85. [Google Scholar] [CrossRef]
  35. AbouKorin, S.A.A.; Han, H.; Mahran, M.G.N. Pandemic resilience planning: NPI measures and COVID-19 impacts in UK, Germany, and Italy. Cities 2023, 143, 104621. [Google Scholar] [CrossRef]
  36. Harris, P.; Harris-Roxas, B.; Prior, J.; Morrison, N.; McIntyre, E.; Frawley, J.; Adams, J.; Bevan, W.; Haigh, F.; Freeman, E.; et al. Respiratory pandemics, urban planning and design: A multidisciplinary rapid review of the literature. Cities 2022, 127, 103767. [Google Scholar] [CrossRef]
  37. CMS. Nursing Home Visitation—COVID-19 (REVISED). 8 May 2023. Available online: https://www.cms.gov/medicare/provider-enrollment-and-certification/surveycertificationgeninfo/policy-and-memos-states/nursing-home-visitation-covid-19-revised (accessed on 23 August 2024).
  38. Alba, C.; Pan, B.; Yin, J.; Rice, W.L.; Mitra, P.; Lin, M.S.; Liang, Y. COVID-19’s impact on visitation behavior to US national parks from communities of color: Evidence from mobile phone data. Sci. Rep. 2022, 12, 13398. [Google Scholar] [CrossRef]
  39. Pan, J.; Bardhan, R.; Jin, Y. Spatial distributive effects of public green space and COVID-19 infection in London. Urban For. Urban Green. 2021, 62, 127182. [Google Scholar] [CrossRef]
  40. Lee, K.O.; Mai, K.M.; Park, S. Green space accessibility helps buffer declined mental health during the COVID-19 pandemic: Evidence from big data in the United Kingdom. Nat. Ment. Health 2023, 1, 124–134. [Google Scholar] [CrossRef]
  41. Geng, D.C.; Innes, J.; Wu, W.; Wang, G. Impacts of COVID-19 pandemic on urban park visitation: A global analysis. J. For. Res. 2021, 32, 553–567. [Google Scholar] [CrossRef]
  42. Wang, J.; Wu, X.; Wang, R.; He, D.; Li, D.; Yang, L.; Yang, Y.; Lu, Y. Review of Associations between Built Environment Characteristics and Severe Acute Respiratory Syndrome Coronavirus 2 Infection Risk. Int. J. Environ. Res. Public Health 2021, 18, 7561. [Google Scholar] [CrossRef]
  43. Rice, W.L.; Pan, B. Understanding changes in park visitation during the COVID-19 pandemic: A spatial application of big data. Wellbeing Space Soc. 2021, 2, 100037. [Google Scholar] [CrossRef] [PubMed]
  44. Stock, S.; Bu, F.; Fancourt, D.; Mak, H.W. Longitudinal associations between going outdoors and mental health and wellbeing during a COVID-19 lockdown in the UK. Sci. Rep. 2022, 12, 10580. [Google Scholar] [CrossRef] [PubMed]
  45. Slater, S.J.; Christiana, R.W.; Gustat, J. Recommendations for Keeping Parks and Green Space Accessible for Mental and Physical Health During COVID-19 and Other Pandemics. Prev. Chronic Dis. 2020, 17, E59. [Google Scholar] [CrossRef] [PubMed]
  46. Csomós, G.; Borza, E.M.; Farkas, J.Z. Exploring park visitation trends during the COVID-19 pandemic in Hungary by using mobile device location data. Sci. Rep. 2023, 13, 11078. [Google Scholar] [CrossRef] [PubMed]
  47. Godfrey, D. No COVID-19-Related Park Closures Expected in Burnaby—Burnaby Now. 2020. Available online: https://www.burnabynow.com/local-news/no-covid-19-related-park-closures-expected-in-burnaby-3119960 (accessed on 8 November 2023).
  48. Rose, A. National Park Visitors Surge as COVID-19 Pandemic Restrictions Wane|CNN. CNN. 2021. Available online: https://www.cnn.com/travel/article/national-park-visitors-surge/index.html (accessed on 8 November 2023).
  49. Pouso, S.; Borja, Á.; Fleming, L.E.; Gómez-Baggethun, E.; White, M.P.; Uyarra, M.C. Contact with blue-green spaces during the COVID-19 pandemic lockdown beneficial for mental health. Sci. Total Environ. 2021, 756, 143984. [Google Scholar] [CrossRef]
  50. Alizadehtazi, B.; Tangtrakul, K.; Woerdeman, S.; Gussenhoven, A.; Mostafavi, N.; Montalto, F.A. Urban Park Usage During the COVID-19 Pandemic. J. Extrem. Events 2020, 7, 2150008. [Google Scholar] [CrossRef]
  51. Johnson, T.F.; Hordley, L.A.; Greenwell, M.P.; Evans, L.C. Associations between COVID-19 transmission rates, park use, and landscape structure. Sci. Total Environ. 2021, 789, 148123. [Google Scholar] [CrossRef]
  52. Spano, G.; D’este, M.; Giannico, V.; Elia, M.; Cassibba, R.; Lafortezza, R.; Sanesi, G. Association between indoor-outdoor green features and psychological health during the COVID-19 lockdown in Italy: A cross-sectional nationwide study. Urban For. Urban Green. 2021, 62, 127156. [Google Scholar] [CrossRef]
  53. Kinzig, A.P.; Ehrlich, P.R.; Alston, L.J.; Arrow, K.; Barrett, S.; Buchman, T.G.; Daily, G.C.; Levin, B.; Levin, S.; Oppenheimer, M.; et al. Social Norms and Global Environmental Challenges: The Complex Interaction of Behaviors, Values, and Policy. Bioscience 2013, 63, 164–175. [Google Scholar] [CrossRef]
  54. Casari, M.; Tagliapietra, C. Group size in social-ecological systems. Proc. Natl. Acad. Sci. USA 2018, 115, 2728–2733. [Google Scholar] [CrossRef]
  55. COVID-19 Community Mobility Reports. Available online: https://www.google.com/covid19/mobility/ (accessed on 15 September 2024).
  56. Center for Disease Control and Prevention (CDC). Principles of Epidemiology in Public Health Practice; CDC: Atlanta, Georgia, 2006. [Google Scholar]
  57. Mathieu, E.; Ritchie, H.; Rodés-Guirao, L.; Appel, C.; Giattino, C.; Hasell, J.; Macdonald, B.; Dattani, S.; Beltekian, D.; Ortiz-Ospina, E.; et al. Coronavirus Pandemic (COVID-19). Our World in Data. 8 March 2020. Available online: https://ourworldindata.org/coronavirus (accessed on 23 August 2024).
  58. Hale, T.; Angrist, N.; Goldszmidt, R.; Kira, B.; Petherick, A.; Phillips, T.; Webster, S.; Cameron-Blake, E.; Hallas, L.; Majumdar, S.; et al. A global panel database of pandemic policies (Oxford COVID-19 Government Response Tracker). Nat. Hum. Behav. 2021, 5, 529–538. [Google Scholar] [CrossRef] [PubMed]
  59. Real Estate News—KPMG Slovakia. Available online: https://kpmg.com/sk/en/home/industries/real-estate.html (accessed on 26 April 2023).
  60. UN-Habitat’s COVID-19 Response Plan|UN-Habitat. Available online: https://unhabitat.org/un-habitat-covid-19-response-plan (accessed on 26 April 2023).
  61. Arafat, S.M.Y.; Kar, S.K.; Marthoenis, M.; Sharma, P.; Apu, E.H.; Kabir, R. Psychological underpinning of panic buying during pandemic (COVID-19). Psychiatry Res. 2020, 289, 113061. [Google Scholar] [CrossRef] [PubMed]
  62. McKinsey. European Consumer Pessimism Intensifies in the Face of Rising Prices|McKinsey. Available online: https://www.mckinsey.com/capabilities/growth-marketing-and-sales/our-insights/survey-european-consumer-sentiment-during-the-coronavirus-crisis (accessed on 7 May 2023).
  63. Ahrendt, D.; Cabrita, J.; Clerici, E.; Hurley, J.; Leončikas, T.; Mascherini, M.; Riso, S.; Sándor, E. Living, Working and COVID-19; Eurofound: Dublin, Ireland, 2020; p. 66. [Google Scholar]
  64. Huynh, N.N.Y.; Nguyen, D.D.; Ta, N.H.; Nguyen, M.T.; Van Nguyen, T.; Dang, H.T.; Vo, T.K.C.; Le, N.T. COVID-19 Clusters at Workplaces and its Transmission into Communities in Vietnam: A Novel Emerging Occupational Risk Factor at Work Due to Coronavirus Infection. Asian Pacific J. Environ. Cancer 2020, 3, 27–33. [Google Scholar] [CrossRef]
  65. Telework in the EU Before and After the COVID-19: Where We Were, Where We Head to. Available online: https://joint-research-centre.ec.europa.eu/document/download/1ccf7717-ab52-4215-b14a-08d74e9d44fc_en (accessed on 29 April 2023).
  66. The Future of the Office Has Arrived: It’s Hybrid. Available online: https://www.gallup.com/workplace/511994/future-office-arrived-hybrid.aspx (accessed on 13 September 2024).
  67. COVID Behaviors Dashboard—Johns Hopkins Center for Communication Programs. Available online: https://ccp.jhu.edu/kap-covid/ (accessed on 23 May 2023).
  68. Nanath, K.; Balasubramanian, S.; Shukla, V.; Islam, N.; Kaitheri, S. Developing a mental health index using a machine learning approach: Assessing the impact of mobility and lockdown during the COVID-19 pandemic. Technol. Forecast. Soc. Chang. 2022, 178, 121560. [Google Scholar] [CrossRef] [PubMed]
  69. Larson, L.R.; Zhang, Z.; Oh, J.I.; Beam, W.; Ogletree, S.S.; Bocarro, J.N.; Lee, K.J.; Casper, J.; Stevenson, K.T.; Hipp, J.A.; et al. Urban Park Use During the COVID-19 Pandemic: Are Socially Vulnerable Communities Disproportionately Impacted? Front. Sustain. Cities 2021, 3, 710243. [Google Scholar] [CrossRef]
  70. Niță, M.R.; Arsene, M.; Barbu, G.; Cus, A.G.; Ene, M.; Serban, R.M.; Stama, C.M.; Stoia, L.N. Using Social Media Data to Evaluate Urban Parks Use during the COVID-19 Pandemic. Int. J. Environ. Res. Public Health 2021, 18, 10860. [Google Scholar] [CrossRef]
  71. Freeman, S.; Eykelbosh, A. COVID-19 and Outdoor Safety Considerations for Use of Outdoor Recreational Spaces; National Collaborating Centre for Environmental Health: Vancouver, BC, Canada, 2020; Available online: https://www.scirp.org/reference/referencespapers?referenceid=2872772 (accessed on 13 September 2024).
  72. Volenec, Z.M.; Abraham, J.O.; Becker, A.D.; Dobson, A.P. Public parks and the pandemic: How park usage has been affected by COVID-19 policies. PLoS ONE 2021, 16, e0251799. [Google Scholar] [CrossRef]
  73. Tully, M.A.; McMaw, L.; Adlakha, D.; Blair, N.; McAneney, J.; McAneney, H.; Carmichael, C.; Cunningham, C.; Armstrong, N.C.; Smith, L. The effect of different COVID-19 public health restrictions on mobility: A systematic review. PLoS ONE 2021, 16, e0260919. [Google Scholar] [CrossRef]
  74. Shoari, N.; Ezzati, M.; Baumgartner, J.; Malacarne, D.; Fecht, D. Accessibility and allocation of public parks and gardens in England and Wales: A COVID-19 social distancing perspective. PLoS ONE 2020, 15, e0241102. [Google Scholar] [CrossRef]
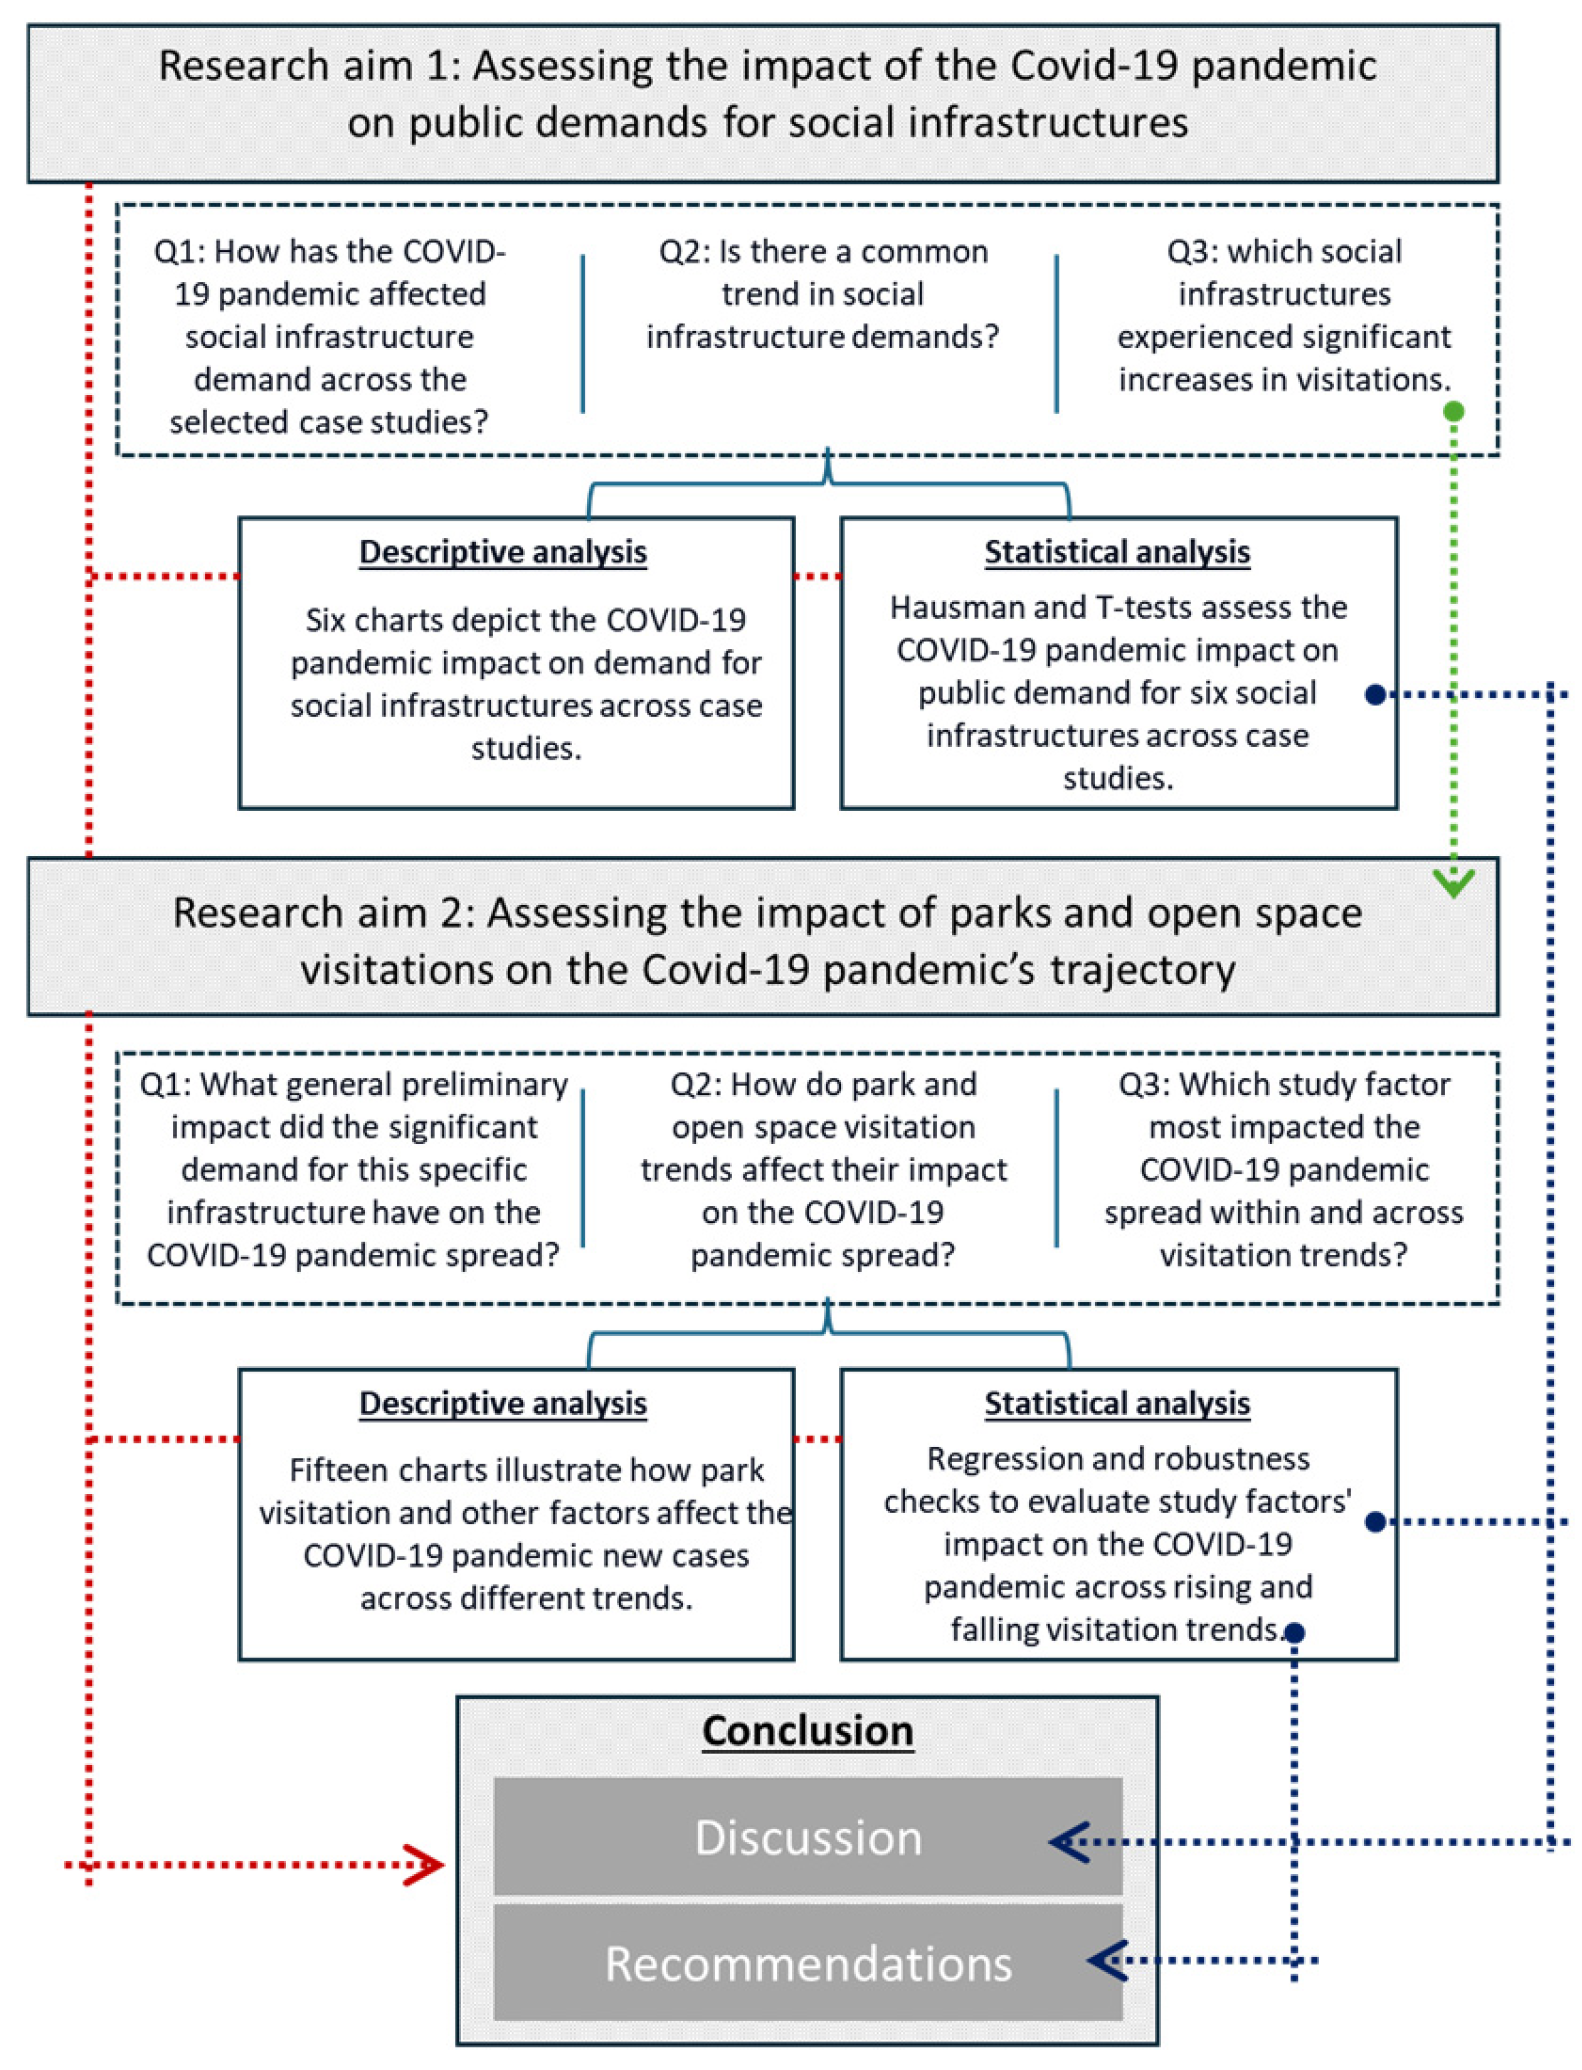
Figure 1. The research methodological flow. Source: the researcher.
Sustainability 16 10343 g001
Figure 2. Changes in visitation trends in social infrastructure in 15 European countries. Source: The researcher (depending on [55,57]).
Sustainability 16 10343 g002
Figure 3. The average trust of people in information from the government and health authorities compared to average use of parks and open spaces. Source: the researcher (depending on [57]).
Sustainability 16 10343 g003
Figure 4. Average change in visitations in social infrastructures across the selected 15 EU case studies. Source: the researcher (depending on [55,57]).
Sustainability 16 10343 g004
Figure 5. Park and open space visitation moderately impacting the COVID-19 pandemic infections in 15 European case studies during study time frame. Source: the researcher (depending on [55,57]).
Sustainability 16 10343 g005
Figure 6. The impact of the new COVID-19 pandemic cases and government responses on park and open space visitation across the 15 countries studied. Source: the researcher (depending on [55,57,58]).
Sustainability 16 10343 g006aSustainability 16 10343 g006bSustainability 16 10343 g006c
Figure 7. Relationship between park and open space visitations and the new COVID-19 pandemic cases. Source: the researcher (depending on [55,57]).
Sustainability 16 10343 g007
Figure 8. Correlation analysis matrix to examine influential factors in park and open space visitations and the COVID-19 pandemic. Source: the researcher (depending on [55,57,58].
Sustainability 16 10343 g008
Figure 9. Impacts between study factors across park and open space visitation trends. Source: the researcher (depending on [55,57,58]).
Sustainability 16 10343 g009
Table 1. Hausman test and t-test to detect the impact of the COVID-19 pandemic on social infrastructure.
Dependent VariablesHousman TestVariablePanel Data Model
ValueModelCoeff.S.E.t-Testp-Value
Retail and recreation4.61 **Fixedc−15.490.218−71.130.00
New cases0.000.009.670.00
Groceries and pharmacies0.0258Randomc7.420.1938.750.00
New cases0.000.0010.090.00
Residential6.86 **Fixedc4.160.0660.080.00
New cases−0.000.00−2.000.04
Transit station63.97 **Fixedc−19.730.20−97.140.00
New cases0.000.006.480.00
Workplaces28.53 **Fixedc−20.940.13−159.130.00
New cases0.000.007.820.00
Parks and open spaces12.23 **Fixedc41.170.52478.560.00
New cases−0.000.00−4.560.00
** Significant at 0.05. Source: the researcher (depending on [55,57]).
Table 2. ANOVA analysis of study factors across the two visitation trends.
Study FactorsF-Statisticp-Value
Visitation magnitudes (y, y)171.060.00 **
New infections1.390.24
Public health measures26.810.00 **
Visitation duration (x, x)29.530.00 **
** Significant at 0.05. Source: the researcher (depending on [55,57,58]).
Table 3. Turkey’s HSD test of significant factors between the two visitation trends.
Study FactorsMDp-ValueCI LowerCI Upper
Visitation magnitudes (y, y)143.150.00 **121.24165.06
Public health measures−16.490.00 **−22.87−10.12
Visitation duration (x, x)4.230.00 **2.675.79
** Significant at 0.05. Source: the researcher (depending on [55,57,58]).
Table 4. Multiple linear regression analysis for the increased park and open space visitation trend—the COVID-19 pandemic cases.
StatisticValue
R-squared0.6923
Adjusted R-squared0.6568
F-statistic19.5002
Prob (F-statistic)0.0000
Log-likelihood−194.5399
AIC397.0797
BIC402.6845
Jarque–Bera (JB)0.4013
Prob (JB)0.8182
Breusch–Pagan5.2061
Prob (BP)0.1573
VariableCoefficientp > |t|
Const−272.9560.156689
Visitation duration78.285542.93 × 10−7
Visitation magnitude−0.647620.358323
Public health stringency −0.232260.943786
Source: the researcher (depending on [55,57,58]).
Table 5. Multiple linear regression analysis for the park and open space visitation decline trend—the COVID-19 pandemic infections.
OLS CoefOLS p-ValueBox-Cox CoefBox-Cox p-Value
Const54.370.81305.540.1127
Duration (x)34.480.02950.720.0033
Magnitude (y)4.450.04030.070.0368
Public health stringency1.890.52060.010.7340
R-squared0.25-0.36-
Adj. R-squared0.16-0.29-
F-statistic2.89950.05404.92970.0077
JB p-value0.00-0.67-
BP p-value0.54-0.53-
Box–Cox Lambda--0.19-
Source: the researcher (depending on [55,57,58]).
Table 6. Regression analysis of the interplay of study factors in park and open space visitation trends.
Periods of Visitation Increase
MagnitudeInfection/MStringencyDurationAll
Periods of Visitation DeclinesMagnitudeR-squared0.0020.1060.0450.3020.470
p value0.8020.0780.2600.001 ***0.002 **
Infection/MR-squared0.0040.4920.0470.3520.546
p value0.7200.000 **0.2480.000 ***0.000 **
StringencyR-squared0.1680.0410.3960.0180.522
p value0.0240.2780.000 **0.4890.000
DurationR-squared0.1720.0100.0370.0160.189
p value0.022 **0.5980.3090.4930.245
AllR-squared0.25350.1770.40840.3551
p value0.0517 **0.1590.00305 ***0.00883 ***
*** Significant at 0.001. ** Significant at 0.05. Source: the researcher (depending on [55,57,58]).
Disclaimer/Publisher’s Note: The statements, opinions and data contained in all publications are solely those of the individual author(s) and contributor(s) and not of MDPI and/or the editor(s). MDPI and/or the editor(s) disclaim responsibility for any injury to people or property resulting from any ideas, methods, instructions or products referred to in the content.