Article

Birds as Cultural Ambassadors: Bridging Ecosystem Services and Biodiversity Conservation in Wetland Planning

by
Michela Ingaramo
1,2,*,
Anna Rita Bernadette Cammerino
1,
Vincenzo Rizzi
2,3,
Maurizio Gioiosa
1,2,3 and
Massimo Monteleone
1
1
Biodiversity and Rural Landscape Lab, Department of Agriculture, Food, Natural Resources and Engineering, University of Foggia, 71122 Foggia, Italy
2
Centro Studi Naturalistici, Pro Natura, 71121 Foggia, Italy
3
Natural History Museum of Foggia, 71121 Foggia, Italy
*
Author to whom correspondence should be addressed.
Sustainability 2024, 16(23), 10286; https://doi.org/10.3390/su162310286
Submission received: 25 September 2024 / Revised: 19 November 2024 / Accepted: 20 November 2024 / Published: 24 November 2024
(This article belongs to the Topic Mediterranean Biodiversity)

Abstract

:
Coastal wetlands deliver essential ecosystem services, including cultural services, which provide non-material benefits such as recreation, education, and spiritual enrichment that are crucial for human well-being. This study investigates the cultural ecosystem services provided by a 40 ha coastal wetland in the Gulf of Manfredonia, southern Italy, within the Gargano National Park. By integrating an ecological survey of the bird community with a social survey of visitors to the King’s Lagoon Nature Reserve, the content of tailored planning strategies and management tools for the conservation of wetland biodiversity was developed. An ecological analysis of the bird community was carried out on the assumption that it could be representative of the total biodiversity observed in the wetland. On the other hand, a questionnaire was used to collect information from visitors to the reserve, highlighting the aspects of the wetland that they found most interesting and attractive according to their judgement and beliefs, and thus targeting a specific set of cultural ecological services. The two approaches were then combined to develop a comprehensive strategy. The bird community analysis led to the identification of the mixed biotope category (a combination of wetlands, aquatic/riparian ecosystems, semi-natural vegetated areas, and meadows together with agricultural areas) as the reference biotope for prioritizing wetland management. The Ardeidae family was chosen as a bird flagship group because of its high visibility, ease of identification, attractiveness to visitors, wide local distribution, and fairly constant presence in the study area throughout the year. Flagship species have a dual function: to guide conservation measures and actions by wetland managers, and to attract the interest, curiosity and active participation of potential visitors to the wetland. Based on the results, a list of guidelines for improving the birds’ habitats and providing them with resources (feeding, breeding, shelter, roosting, etc.) has been proposed. The aim of these measures is to optimize the presence and abundance of Ardeidae as flagship species, thereby preserving the biodiversity heritage in general and increasing the provision of cultural ecosystem services in the wetland. The resulting dynamic interplay ensures that both natural and cultural resources are fully and appropriately valued, protected, and maintained for the benefit of present and future generations.

1. Introduction

Coastal wetlands are unique and highly productive ecosystems, providing several benefits to human communities [1]. There is now a robust scientific literature that identifies these benefits as “ecosystem services” (ESs), and classifies them into different categories according to their nature, quality, and type of service provided [2]. These include cultural ecosystem services (CESs) encompassing the intangible benefits that humans derive from ecosystems, such as spiritual enrichment, cognitive enhancement, reflection, and recreational enjoyment, including the aesthetic value of landscapes [2,3]. Although often considered secondary to other ecosystem services, CESs may play a central role in human well-being [2,4].
Coastal wetlands are among the most biodiverse places on Earth, supporting a rich diversity of resident and migratory birds due to their high biological productivity and habitat heterogeneity, which provide essential nesting, roosting, and foraging sites [5,6,7].
These rich ecosystems provide habitats for a wide range of species, and in turn become attractive for cultural activities such as birdwatching, nature photography, and nature tourism. Birds not only enrich biodiversity-based cultural activities [8,9] but could be useful indicators of biodiversity. They have shown a significant dependence on wetlands at different scales, highlighting the importance of conserving wetlands of different sizes and densities across the landscape [10].
Cultural activities driven by biodiversity are strongly shaped by the dynamics of biotic communities; with proper conservation management and collaborative science they can also lead to social development and economic benefits [6,11,12]. However, biodiversity is declining worldwide, and this loss has significant impacts on ecosystem functioning and the provision of ESs, resulting in less stable and resilient ecosystems [13]. The global biodiversity crisis and its potential solutions are closely linked to how natural capital is valued in political and economic decisions. Although nature provides multiple values, most policies have focused on a limited set of these values, often neglecting the perspectives of people and ignoring long-term impacts on both nature and society. There is a significant gap between scientific research and policy implementation, and less than 5% of evaluation studies are translated into policy decisions [14,15,16,17,18]. Understanding the links between environmental and social values can help conservation experts develop targeted strategies that are both efficient and effective in specific areas [19]. This socio-cultural approach is in line with the new ‘human dimension’ strategy for managing local biodiversity [20], which has become increasingly important in recent decades. The central idea of this approach is that the conservation of species and habitats requires the integration of natural and social sciences, which in turn increases the reliability and impact of conservation decisions [20].
Combined approaches that promote both bird conservation and the provision of CESs can increase the overall benefits to the wider environment [21], as CESs and wetland birds support each other in a virtuous circle, creating a synergistic relationship that enhances both ecological balance and human well-being. Although the incorporation of CESs into management plans is considered fundamental and can ensure that coastal lagoons effectively fulfill their cultural roles, the use of CESs in management decisions is still limited due to gaps between assessment and implementation [22].
There are several non-monetary methods of evaluating CESs [23,24,25,26,27,28], as also reported in literature reviews [29], but research on CESs in small wetland reserves or nature parks is relatively scarce. Furthermore, CESs can be difficult to measure because the ability of the ecosystem to provide these services is strongly influenced by both its biophysical characteristics and the experiences of people who benefit from these services [19,30]. Many CESs are closely linked to biodiversity and are directly dependent on the presence, abundance, diversity, and functional characteristics of biotic communities [31]. Despite the recognized need to incorporate ecological perspectives into the assessment of human well-being [32], current ES research still faces challenges in quantifying the direct link between ecological communities and the benefits they can provide to people [33,34]. Villamagna et al. [35] focused on birdwatching and found that its potential to promote cultural services depends not only on species presence and habitat quality, but also on a social component that affects site conditions and people’s ability to access and enjoy the service (e.g., site management) [36]. Assandri et al. [37] quantified biodiversity, aesthetics, and cultural heritage values using a flagship bird species to demonstrate the potential importance of integrating multiple conservation objectives, such as biodiversity conservation and the provision of CESs.
To promote the sustainable enjoyment of coastal wetlands, conservation efforts and management strategies are essential, and this can be achieved, among other things, by combining biodiversity and CESs. In this respect, nature-based tourism and recreational activities in wetlands and nature reserves in general are an important target and a fundamental source of income for the management and conservation of biodiversity. It is therefore necessary to expand the range of CESs on offer in order to increase the number of visitors, thereby generating economic benefits, while ensuring full compatibility with biodiversity conservation goals. This economic support helps fund habitat restoration, research, and education programs, creating a positive feedback loop where economic, ecological, and cultural values are interlinked and mutually reinforcing.
This work considers the CESs in a coastal wetland of about 40 ha of high naturalistic importance, King’s Lagoon, characterized by a mosaic of habitats in the Gulf of Manfredonia (Southern Italy) within the Gargano National Park, resulting from a project to restore a typical transitional coastal environment with flooded and dry land also for agricultural use, equipped with structures to promote a wide range of nature-related recreational activities.
The study case fits into a broader work by the same authors [38], which highlighted the three interrelated core pillars of wetland planning and management, viz.: (1) the natural environment, (2) human livelihoods through the provision of goods, and (3) cultural and knowledge aspects [39,40,41,42].
This work developed a multidisciplinary methodology combining visitor perception, small-scale landscape features based on land cover and biodiversity assessment. Quantitative and qualitative data were collected on wetland visitors and wetland bird diversity. The latter was used to select “flagship” species to act as “ambassadors”, i.e., iconic and symbolic bird species that can attract the interest of a large public (and potential visitors) and promote campaigns for the protection and conservation of the whole natural environment in which the selected species is embedded [43,44]. The aim was to develop informed policy and decision-making criteria, thus promoting strategic development that contributes to optimal wetland planning and management. Therefore, the objective of this work is to better understand how, where, and why visitors to a coastal wetland perceive the value of CESs and to relate this information to the observed bird diversity in the wetland itself. Based on these findings, the paper aims to provide recommendations to improve and optimize the provision of CESs in the studied coastal wetland and to preserve its biodiversity heritage.

2. Materials and Methods

2.1. Strategic Approach
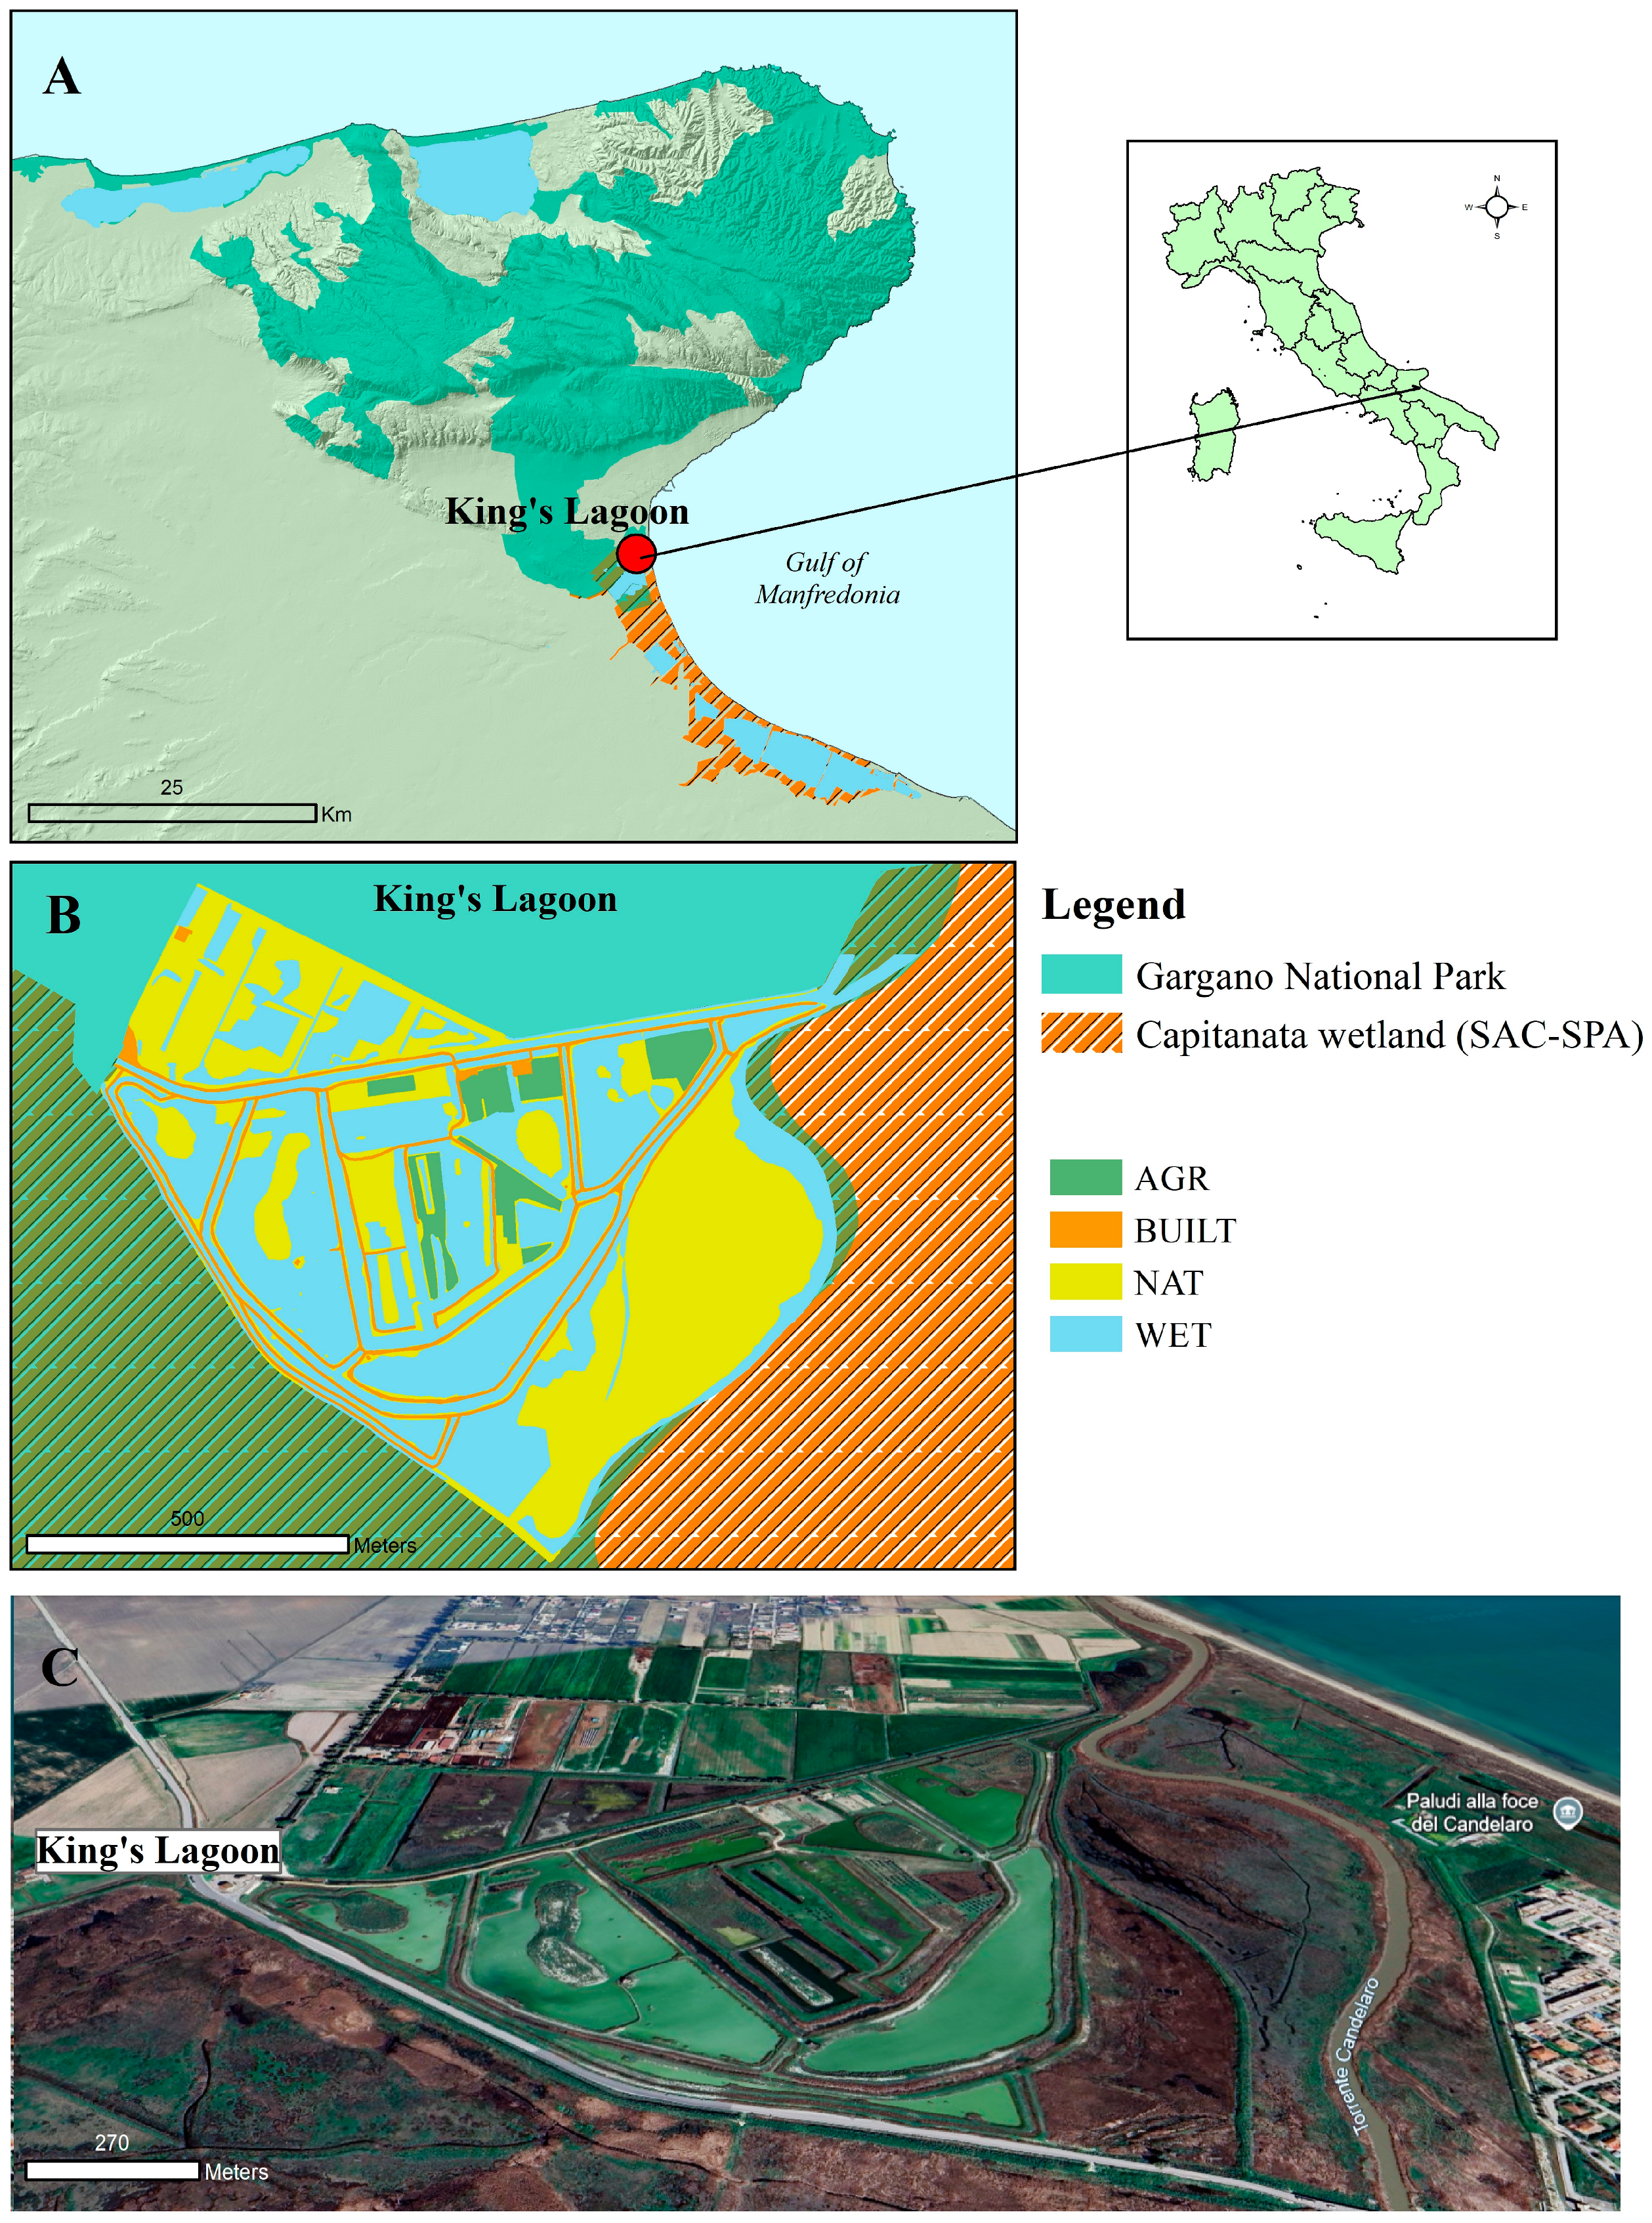
This work is characterized by a twofold methodological strategy: (1) on the one hand, an ecological study of the ornithological community has been carried out, assuming that it can be representative of the total biodiversity observed in the wetland; (2) on the other hand, information has been collected through a questionnaire from visitors to the natural area, highlighting, the aspects of the wetland that are most interesting and attractive according to their judgments and beliefs, thus activating a specific set of CESs. The two approaches were then matched together to develop tailor-made planning strategies and management tools (Figure 1).
Bird diversity was used as an indicator of wetland biodiversity (Figure 1, Pillar I—Nature) and was assessed by the presence and abundance of bird species and their corresponding taxonomic order, taking into account the ecological habitats where these species were observed and the corresponding reference biotopes (habitat is a species attribute, biotope refers to the entire biocoenosis, which, in our case study, was limited to the bird community of the wetland and its strictly surrounding areas).
Thanks to the bird survey, a flagship species or other taxonomic group has been selected as a reference unit in the conservation strategy. The popularity of this unit helps to draw attention to the ecosystem it inhabits and the threats it faces, which in turn helps to increase bird diversity and the recreational and cultural value of wetlands.
A survey of wetland visitors was also conducted (Figure 1, Pillar III—Culture) to learn about their demographics and understand their opinions and preferences. By identifying target audiences by age, gender, occupation, and geographic origin, managers can tailor services and marketing strategies to meet the needs of different visitor groups (Table S1 in the Supplementary Materials). In addition, knowing what activities and features visitors value most can help improve the provision of services that make the wetland more attractive and enjoyable.

2.2. Study Area

Bird community assessments and visitor surveys were carried out at King’s Lagoon, a coastal wetland located in Siponto (Manfredonia, province of Foggia, southern Italy) directly connected to the Adriatic Sea at the mouth of the Candelaro stream. The wetland covers an area of 40 hectares and is part of the overall reclamation system of the Siponto polder (Figure 2).
Reclamation of the area began in the early 20th century with the construction of canals and later a water pumping station, but was significantly advanced just before the second World War and was completed in the 1950s. This land transformation drastically altered the pre-existing hydrological system to convert natural areas into farmland and human settlements. However, the remaining wetlands have become an integral part of the Apulian coastal landscape. Today, King’s Lagoon plays an important ecological role and is part of the European Natura 2000 network. It has been designated both as a Special Area of Conservation (SAC), known as “Capitanata Wetlands” (IT9110038), and as a Special Protection Area (SPA), known as “Marshes of the Gulf of Manfredonia” (IT9110005). These areas contain two priority habitats under the EU Habitats Directive: 1150 * “coastal lagoons” and 1510 * “Mediterranean salt steppes” (* indicates priority status).
A considerable EU LIFE environmental project [45] was implemented in the Siponto area, resulting in the creation of King’s Lagoon on a previously reclaimed wetland site. The project, which was completed in 2019 after five years of work, focused on restoring the wetland by converting agricultural land and unauthorized building development into a natural wetland system. Work has included redesigning and reopening silted canals, digging “valleys” (open water areas), installing weirs to control water flow, and creating sluices to recreate the dynamic coastal environment that alternates between natural flood zones and dry areas used for agriculture. The restoration of King’s Lagoon has greatly enhanced its importance as a habitat for a wide variety of bird species, making it a crucial site for avian biodiversity. King’s Lagoon, with its mosaic of wetlands, open water areas, and salt steppes, provides an ideal environment for both resident and migratory bird species. Wildlife observation structures, such as towers, boardwalks, and hides, have been installed to promote birdwatching and recreation. Additionally, footpaths, huts, and terraces invite visitors to explore the natural oasis, fostering a deeper connection with nature. The project had a positive social impact as well, promoting the restoration of legality by demolishing unauthorized buildings and giving former residents small plots of land for legal agricultural use. Agriculture is now strictly regulated and allowed only in designated areas within the wetland system, balancing human activity with environmental preservation [38].

2.3. Land Cover Mapping

The land cover map of King’s Lagoon and of some surrounding areas was produced at a very detailed scale in a previous study [46] using GIS software (QGIS 3.34.3-Prizren) and a Pleiades NEO satellite image (30 cm resolution) acquired on 24 July 2023. The resulting land cover classification (Table 1) was structured into 2 hierarchical levels, the first of which consists of only 4 general classes: wetland and aquatic/riparian ecosystems (WET), semi-natural vegetation areas (NAT), built-up areas (BUILT), and agricultural areas (AGR). The second level contains more differentiated land cover classes as listed in Table 1 and photoboard S3 in the Supplementary Material.
The orthophoto of the study area was overlaid with a square grid of a 100 m mesh, covering the entire surface of the wetland and some surrounding areas, which are considered important for bird presence (Figure 3).
A total of 67 cells (one hectare each) were defined on the map, each representing a reference unit (cell) to characterize land cover (together with the resulting biotope category to which each cell refers) and to assess the presence and abundance of bird species by a survey. As King’s Lagoon covers 40 hectares, some cells are only partially outside the boundary of the King’s Lagoon area, while others are completely outside, although immediately adjacent. Therefore, the assessment included a larger area that was considered strictly relevant to the research.

2.4. Wetland Biodiversity Assesment Through a Bird Survey

The bird survey consisted of one detection per month, from January to December 2023, for a total of 12 counts within King’s Lagoon wetland, along selected transects through the 67 cells following the main paths and without overlap. Surveys were conducted by two observers walking along the transect for approximately 2 h, shortly after sunrise and under favorable weather conditions. Therefore, surveys were not conducted on rainy or windy days. All visible, singing, and vocally active individuals of all bird species within a 50 m buffer around the observers’ position were identified (using 10 × 40 Leica binoculars) and counted. Although the transects did not cover all 67 cells, this method allowed for a comprehensive survey of the entire study area. Birds flying above 20 m were not counted [47]. All data were recorded and georeferenced according to the established cell grid. Individuals observed flying over the area were also included in the census if they exhibited behavior related to the underlying environment (e.g.: Accipitriformes and Falconiformes in hunting, Laridae and Sternidae in fishing, and Apodidae and Hirundinidae in trophic activity on lagoons or reed beds).

2.5. Applied Statistical Procedures on Bird Communities

The experimental data are of two different types and they form two different initial matrices. The first matrix, Matrix [A], reports the annual average number of individuals (occurrences) of each bird species detected during the 12-month survey for each of the cells into which the wetland was divided. The second data matrix, Matrix [B], reports the proportion of each wetland cell’s area covered by the four broad land cover classes, distinguishing between wetland (WET), natural vegetation (NAT), agricultural land (AGR), and built or infrastructure surfaces (BUILT). Figure 3 shows a flowchart that represents the overall statistical processing of the data obtained from the annual bird survey. It can be useful to have a general overview of the statistical methodological approach that was applied to the data.
With regard to Matrix [A], it should be noted that the aim of the study was to identify bird species that are easy to observe and recognize by non-expert visitors (who may find it difficult to distinguish between similar species) and, as many of the more conspicuous and recognizable species can be identified by their distinctive anatomical features (such as those belonging to the orders Ciconiiformes), the analysis was simplified by focusing on taxonomic orders and, in some cases, families. It is important to note that this study was not designed to provide a detailed analysis of the bird community structure, but rather to select potential flagship species and their strict association with landscape features. Another reason for aggregating species by grouping them according to their higher taxonomic class is to avoid an excessively limited number of species occurrences, to reduce the dispersion of the data, and to make the representativeness of the wetland bird community more consistent.
Therefore, Matrix [A] was converted and also transposed to obtain Matrix [A’], with bird orders in rows and wetland cells in columns (Figure 4). With respect to Matrix [B], a cluster analysis using the K-means procedure was performed, which identified some representative biotope categories that characterize the wetland on the basis of the land cover partitioning of each cell. The biotope categories thus include, at least partially, the habitats of the bird species observed during the annual survey. In this way, Matrix [C] was obtained (Figure 4) and the biotope categories were described according to their average relative land cover (biotope centroid) and their variability (cluster dispersion). Multiplying Matrix [A’] by Matrix [B] gives a new matrix with the taxonomic orders of the birds in the rows and the land cover in the columns. This matrix is only temporary because the classification rules from the previous cluster analysis (K-means clustering) are applied to it, transforming the land cover fractions into biotope categories. The result is Matrix [D] (Figure 4), which is a distance/proximity matrix of each bird order to each biotope centroid. By taking the inverse of each matrix element and normalizing the elements, this matrix can be transformed into a “membership” matrix that indicates the degree of association of each bird order with a corresponding biotope. Finally, a Principal Component Analysis (PCA) can be performed to verify the association between the taxonomic orders of species and their predominant reference biotope (Figure 4). Having obtained a clear picture of the distribution of the ornithological community within the wetland biotopes, it is then possible to make an informed choice of which bird species (a single species or a group of species within an order) should best play the role of flagship species, being abundant, widespread, charismatic, and well-known, and thus more likely to attract public interest and raise awareness of wider conservation issues.
A preliminary screening of the bird community and its species composition was carried out by simply ranking the data collected. A rank abundance plot (or Whittaker plot) and a rank occurrence plot [48,49] can be used to visualize the distribution of species within the wetland. In these plots, the number of individuals of each species, or alternatively their occurrence in the wetland cells, is sorted in descending order and the relative proportion for each species is then plotted on a logarithmic scale against the species rank. The linearity of the relationship reflects the logarithmic distribution of species within the community, where only a few species play a dominant role [48,50]. Furthermore, in order to carry out a further preliminary analysis of the ornithological community in relation to the wetland as a whole, it may be useful to identify those species that are characterized by both a significant numerical presence (abundance) and a relatively wide distribution over the majority of the reference cells (evenness). The use of the Shannon–Weaver diversity index [51,52] may be useful for this purpose. Considering pj as the relative abundance (i.e., cover fraction) of each j-th species within the s total number of species detected in a cell/site, the H index can be calculated as follows:
H = j = 1 s p j   ln ( p j )
All statistical processing was performed using JMP software (JMP Pro 16.0®, SAS Institute Inc.©, Cary, NC, USA, 2021).

2.6. Social Survey of Wetland Visitors

A questionnaire was created using Google Modules and systematically administered to the wetland visitors shortly after the end of their visit and before they left. The questionnaire was in digital format, downloadable through a QR code to be scanned by mobile devices. The survey was active from May 2022 to June 2024. Each survey took approximately five minutes to complete. The questionnaire was pre-tested with a small group of visitors to confirm that it was clear, straightforward, and acceptable. The questionnaire was divided into three sections called “Demographics”, “Attitudes”, and “Perceptions”, and includes multiple-choice, ordinal-scale, and open-ended questions.
  • The first section collects general data to outline the visitor’s profile (socio-demographic characteristics, such as gender, age, formal education, occupation, place of residence and awareness of being in a Nature 2000 Network site).
  • The second section examines opinions and preferences about visiting the wetland. Respondents were asked to select the best reasons for visiting the wetland from a list of six pre-defined options, with a final option for ‘other reasons’. These options were identified by considering the main purposes of protected areas as defined by the Italian framework law (L. 394/91) [53] that may be relevant for visitors: biodiversity and landscape conservation, integration between man and the natural environment, education, and recreation.
  • The third section of the questionnaire explores visitor perceptions of the key ESs provided by the study area. Respondents were asked to indicate their perceptions of the three most important ESs provided by the King’s Lagoon wetland.
Table S1 (in the Supplementary Materials) reports the second and the third sections of the questionnaire. For the first question, six options were given. Each reason for visiting the wetland was associated with a corresponding “social value” and an explanatory text. The term “social value” should be understood as the importance, worthiness, and usefulness of the selected reason for visiting in terms of collective benefits [14,54]; it also refers to the perceived, non-market benefits that people associate with ecosystem [55,56]. These proposed social values are not mutually exclusive, and none is inherently superior to another. Rather, they can often coexist and be expressed in different combinations. For the second question, visitors were asked to rate, on a scale of 1–5, their appreciation of landscape components (which can be considered “biotopes” in our case study) from a list of four: wetland and aquatic/riparian ecosystems (WET), semi-natural vegetation areas (NAT), agricultural areas (AGR), and agroecomosaic (MIXED), the latter being the combination of the three components mentioned above (see photoboard S4 in the Supplementary Material). For the third question, respondents were asked to identify, through multiple choice, which of the previously defined biotope categories (WET, NAT, AGR, and MIXED) best supports the priority ecosystem services they had identified. Previous studies on the perception and value of ESs have helped us to identify those that are not only highly relevant to the area but also easily understood by visitors [26,57,58]. In this section of the questionnaire, 13 ESs are listed and categorized into three main groups (provisioning, regulating, and cultural), as shown in Table S1 (in the Supplementary Materials). These groups are based on the Common International Classification of Ecosystem Services (CICES) [59], with an additional group named “biodiversity” to emphasize its critical role in many ESs. Finally, the fourth question asked about the possible association of the prioritized ESs with the four biotope categories (Table S1 in the Supplementary Materials).

3. Results

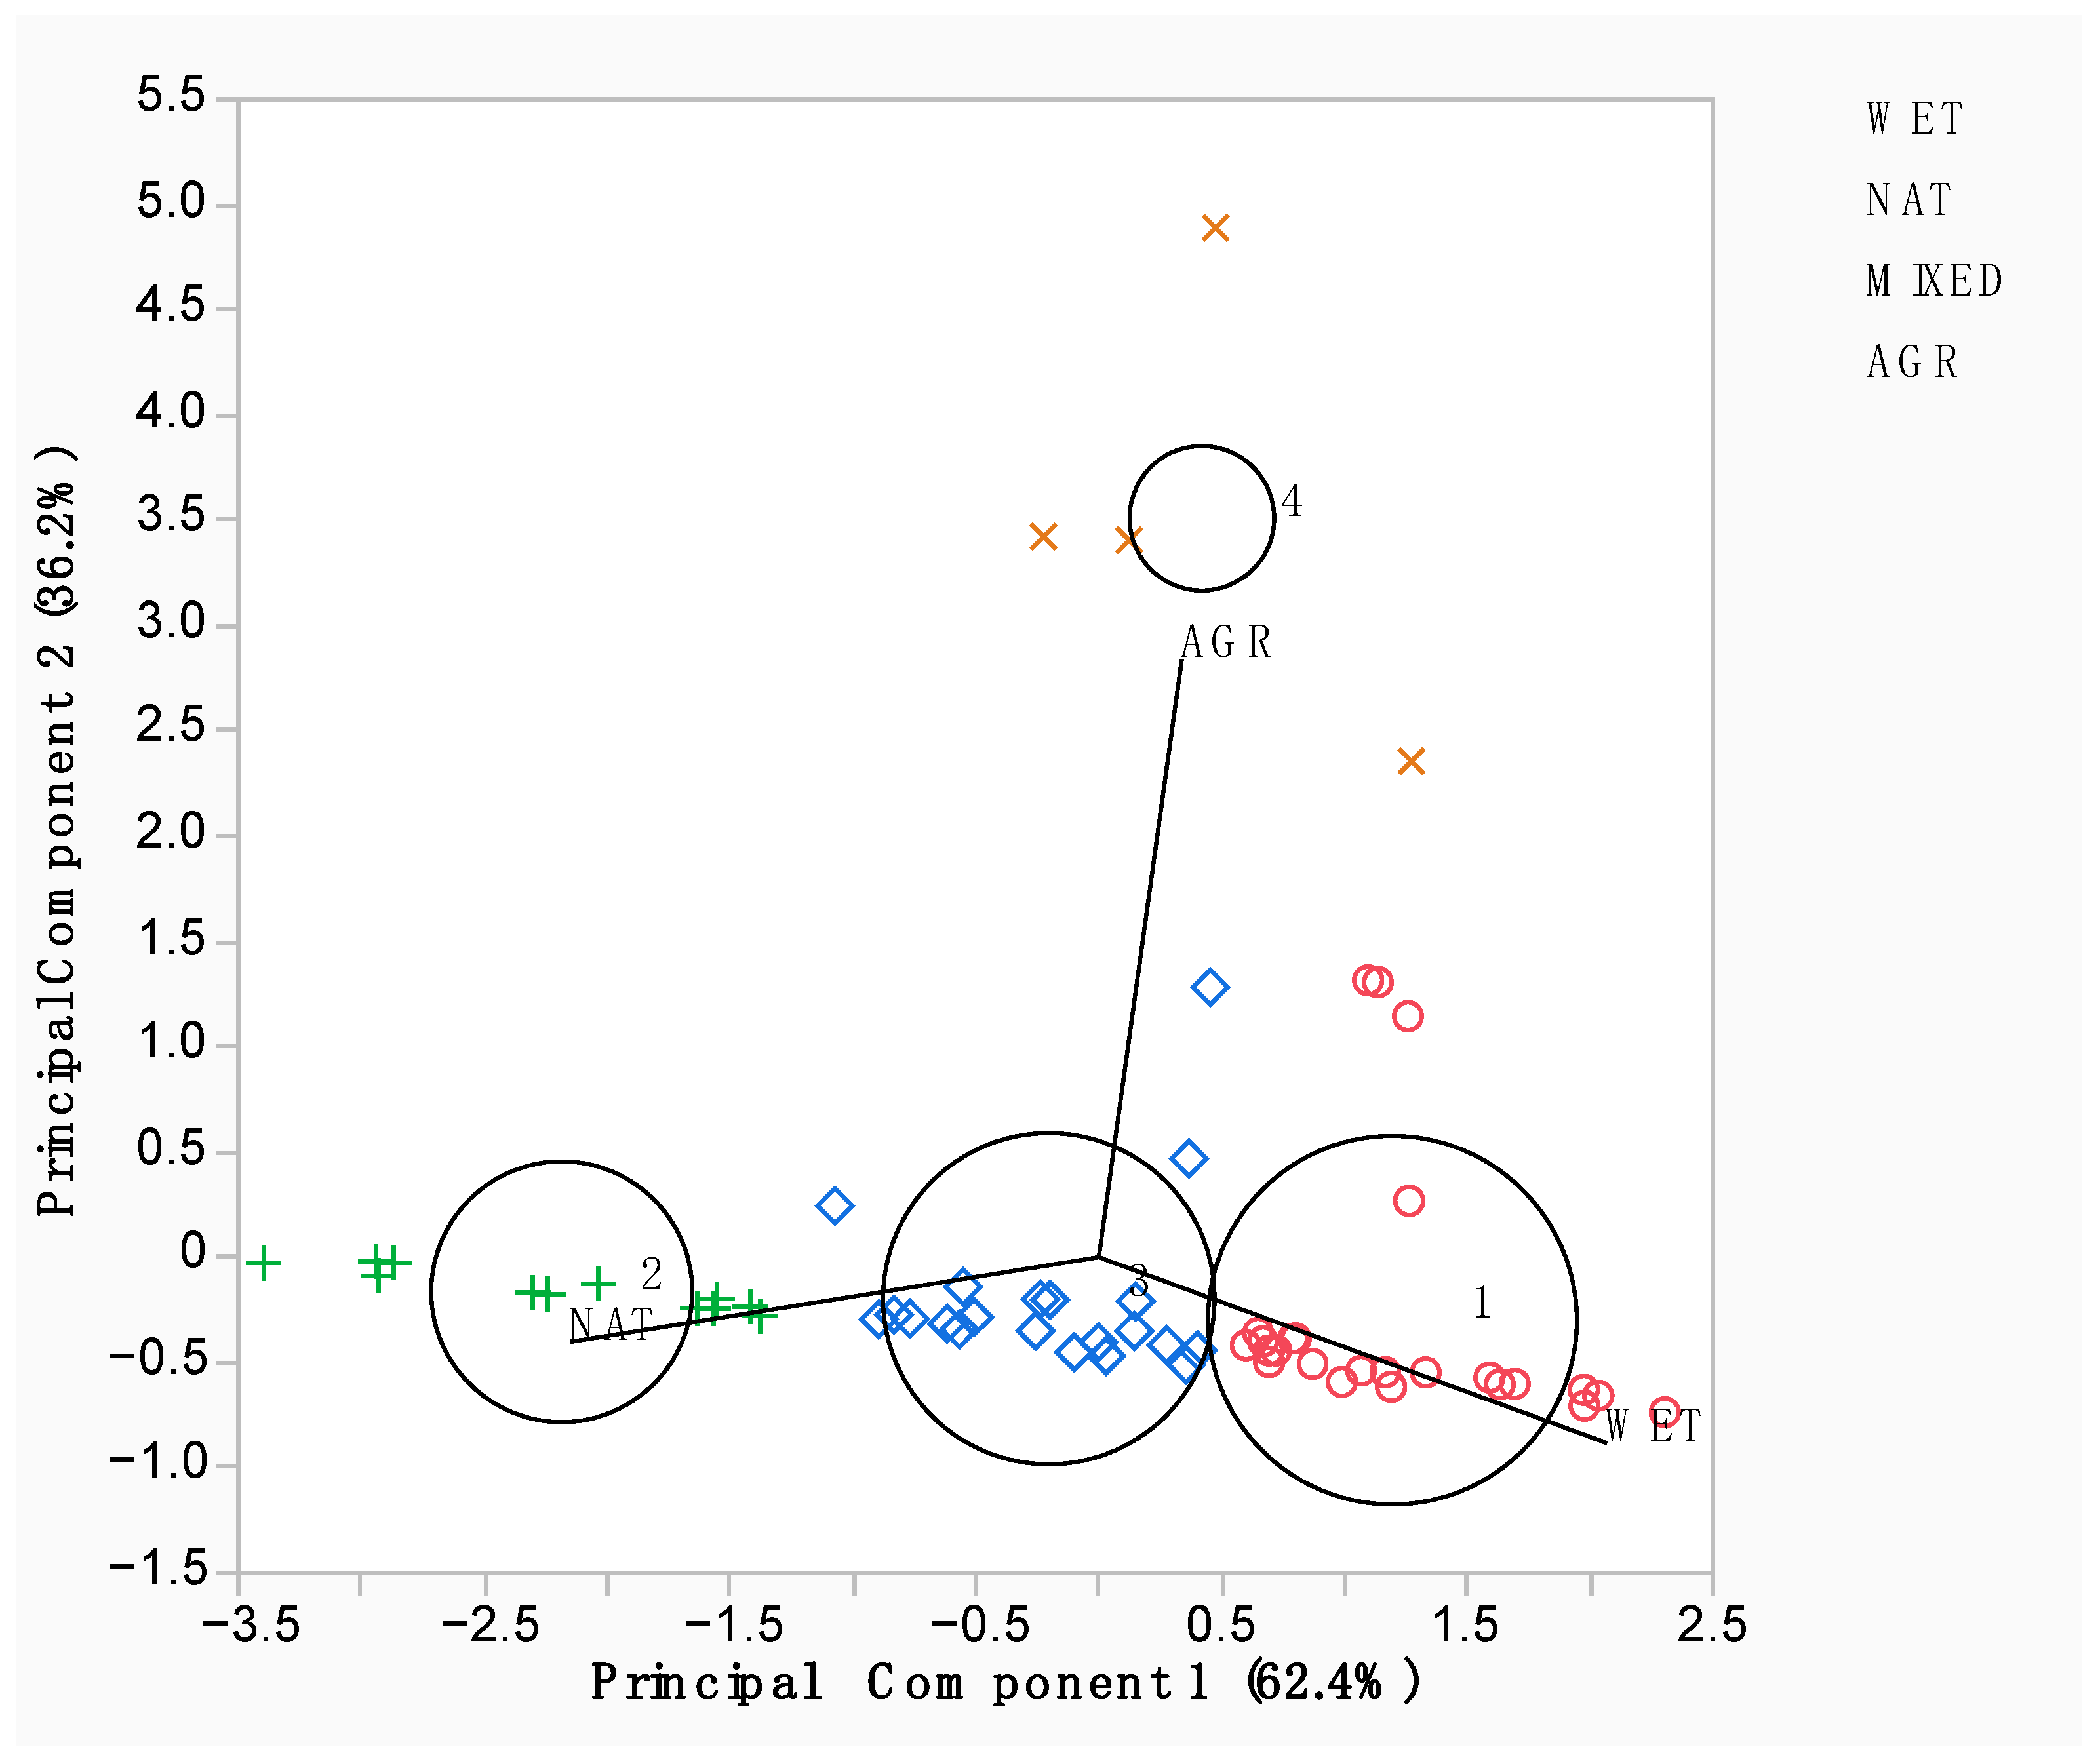
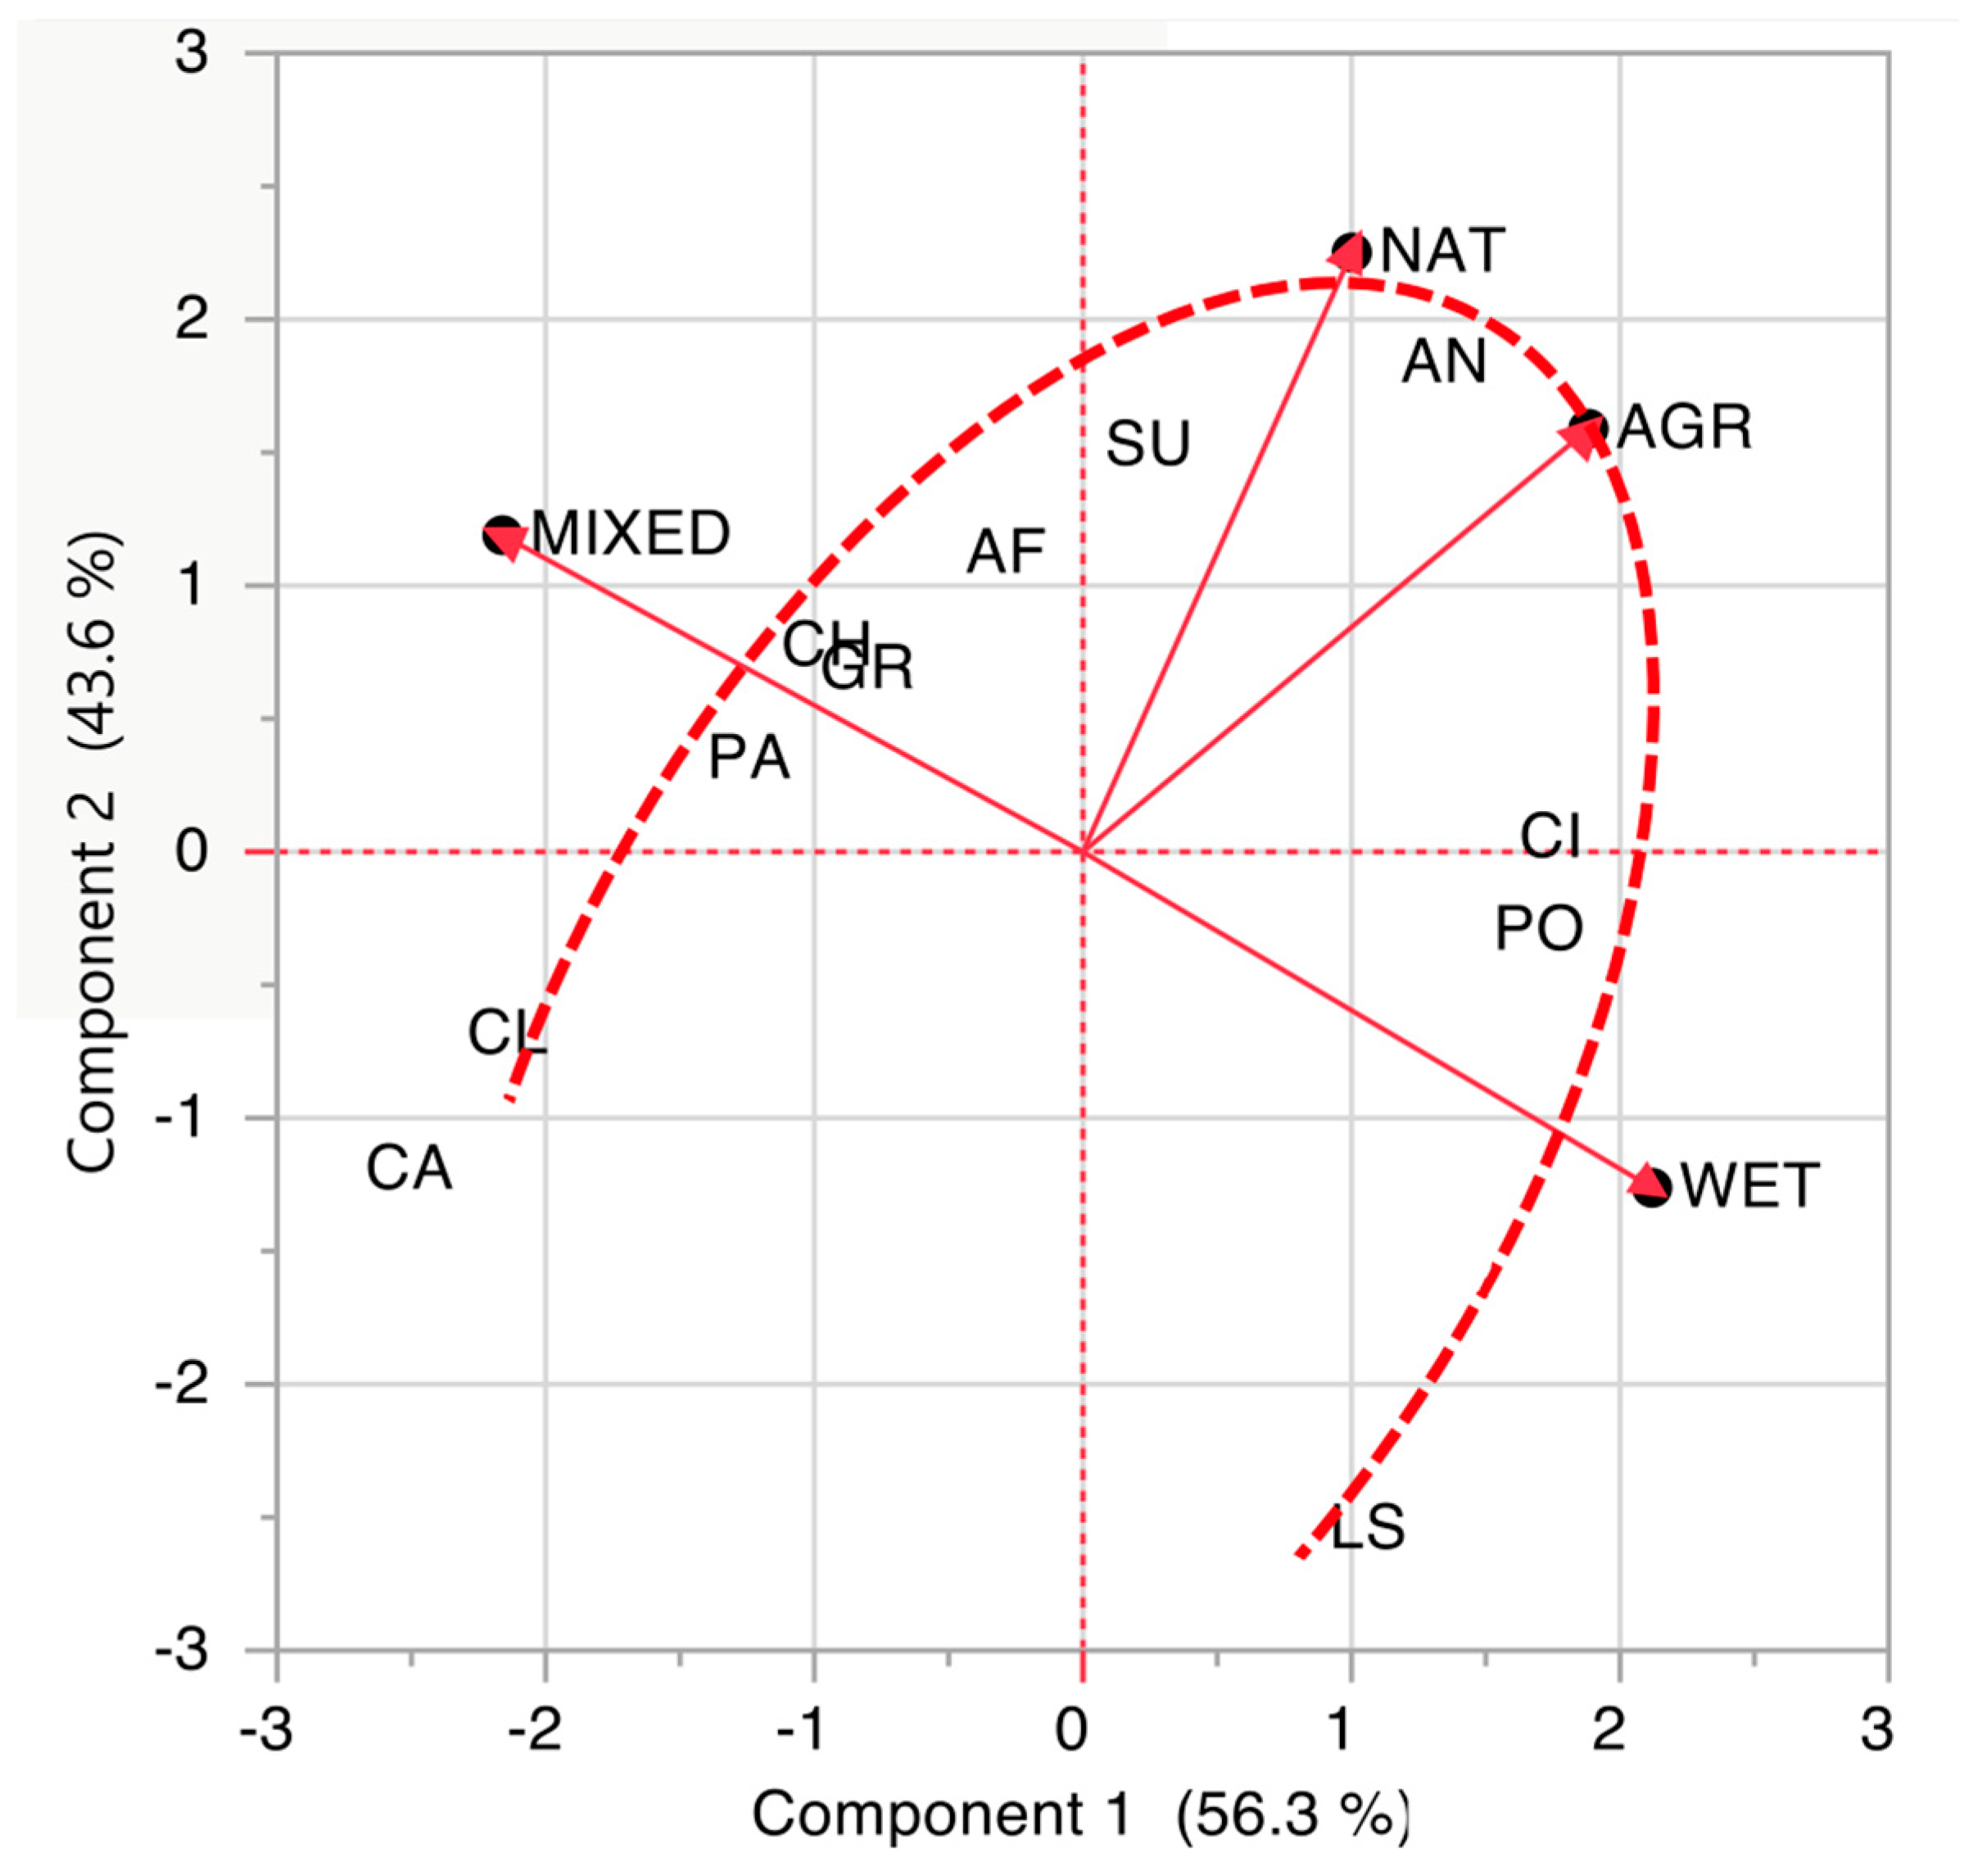
3.1. Wetland Bird Community as a Whole

Taking into account the entire ornithological community of the wetland, the total number of species detected during the entire study year (12 monthly surveys) was 94, distributed among the 67 survey cells. For some observations it was not possible to identify the species precisely. Therefore, these bird observations were assigned to a broader taxonomic category, that of the corresponding bird order. This resulted in a total of 97 bird taxonomic units. The average monthly bird abundance (counts or contacts) in the whole area was 322 individuals, while the average monthly species richness was 34. Table S2 (in the Supplementary Materials) shows the list of all detected bird species with their corresponding total occurrence, considering both time (12 annual surveys) and space (67 square cells), as well as their average monthly abundance in the wetland as a whole.
Bird species abundance (Table S2 in the Supplementary Materials) is distributed according to a logarithmic trend with respect to the species abundance rank (Ln Q = 1.7346 − 0.0616 × Rank; R2 = 0.994; p < 0.0001), identifying six species (Cisticola juncidis, Anas platyrhynchos, Acrocephalus scirpaceus, Fulica atra, Cettia cetti, and Phalacrocorax carbo, reported in photoboard S5 in the Supplementary Materials) with abundances greater than 5% of the total. Similarly, the occurrence of bird species (Table S2 in the Supplementary Materials), is also distributed according to a logarithmic trend with respect to the species occurrence rank (Ln R = 3.6360 − 0.0437 × Rank; R2 = 0.997; p < 0.0001), identifying six species (Cisticola juncidis, Acrocephalus scirpaceus, Anas platyrhynchos, Fulica atra, Cettia cetti, and Phalacrocorax carbo) with occurrences over a number of cells greater than 30 (the 45% of all wetland survey cells). Finally, considering the Shannon diversity index, the bird species with the highest values (i.e., the species more evenly distributed in the wetland cells) were exactly the same species as before (Cisticola juncidis, Acrocephalus scirpaceus, Cettia cetti, Anas platyrhynchos, Phalacrocorax carbo, and Fulica atra), confirming once again the prominent role they played in the entire ornithological community. Therefore, we can conclude that these six species were the ones that shared the highest positions in these ranks and can be considered the reference species in the wetland. Three of these species—Cisticola juncidis, Acrocephalus scirpaceus, and Cettia cetti—are small passerines that are difficult for the general public to identify visually. In addition, Fulica atra, although common in the fall and winter months, does not have the persistent visibility required for a flagship species (Table S2 in the Supplementary Materials). Anas platyrhynchos is also unsuitable, being very common and widespread, with domestic forms reducing its symbolic conservation value. Furthermore, Phalacrocorax carbo is often considered problematic due to perceived conflicts with fishermen, making it an inappropriate candidate. Indeed, flagship species must be highly visible, appealing, and capable of engaging the public, criteria that these species do not meet, making them unsuitable for such a role. To address these issues, the bird community was analyzed based on taxonomic orders. This approach helped to identify which groups would be the most suitable candidates for selection as flagship species.
After grouping the different species into their respective taxonomic orders, it can be verified that the order Passeriformes (with 34 species) represents 35% of the abundance of bird species in the wetland, followed by the order Ciconiiformes (with 11 species), which reaches 16% of the total bird abundance, followed by 12% for the order Gruiformes and 11% for the order Anseriformes. Passeriformes are present in 65 of the 67 total wetland observation cells, while Ciconiiformes are present in 53, Gruiformes in 44, and Anseriformes in 41. Thus, similar to what has been reported previously for individual species, we can conclude that these are the quantitatively most important bird groups in terms of bird taxonomic orders.
Among the Ciconiiformes, Ardeidae (see photoboard S6 in the Supplementary Materials) were potentially considered as flagship species due to their visibility, appeal, attractiveness, wide distribution in the study area and abundance. Adding up the monthly abundance of all the Ardeidae species present and considering them together as a single bird group, the abundance ranges from 21 to 50 individuals in spring, autumn, and winter, and over 50 individuals in summer (Table 2), making this family easily observable throughout the year, even by non-experts. It should be noted, however, that all the herons recorded were taken into account, but among them, Ardea cinerea, Egretta garzetta, Ardea alba, Bubulcus ibis, and Ardeola ralloides are the most abundant and the first three are present throughout the year. Ardea purpurea, Bubulcus ibis, and Ardeola ralloides are present and observable only in spring and summer. Botaurus stellaris and Ixobrychus minutus have only been observed once, as they are the most elusive of the Ardeidae family and therefore are difficult for the general public to observe (Table 2).
The K-means clustering procedure was applied to convert the land cover fractions of the wetland cell into biotope categories. Four categories were identified and characterized in the wetland, as shown in Table 3.
The centroid of the wetland biotope (WET) is composed, on average, mainly of aquatic and riparian ecosystems (67.3%) and a more limited fraction, on average, of seminatural vegetation areas and meadows (22.1%); the opposite proportions were approximately observed when considering the natural wetland biotope (NAT), which was mainly composed of seminatural vegetation areas and meadows (77.6%) and a more limited fraction (19.6%) of aquatic and riparian ecosystems. A third biotope category was clearly distinguished (we called it MIXED) since it showed intermediate characteristics between the two previous ones. Indeed, the MIXED biotope was characterized by an approximately balanced composition of both aquatic and riparian ecosystems (45.9%) and seminatural vegetation and meadows (43.3%). The last identified biotope category is mostly characterized by a relatively significant proportion of agricultural land (37.0%), while the proportions related to wetlands (33.0%) and natural vegetation (22.8%) are slightly lower but still relevant. We identified this biotope category with the code AGR. The presence of built-up areas is usually quite limited, but not irrelevant, considering that this type of land cover shows values in the range of 3–9% among the different biotope categories. The most widespread biotope, i.e., the one that is most present in the area, is WET, with 26 cells out of a total of 67; the NAT biotope, on the other hand, has 13 cells, while the MIXED biotope has 21 cells; finally, the AGR biotope is less representative, with only 4 cells. Missing from the count are three marginal cells, i.e., peripheral to the wetland and only partially in its area.
Figure 5 shows the biotope clustering results in a principal component plot, showing the locations in the plane of all the wetland survey cells, their mutual distances, as well as their aggregation into distinct biotope clusters.
The first principal component accounted for 62.4% of the variability, while the second one accounted for 36.2%; thus, the two main orthogonal dimensions accounted, in total, for 98.6% of the data variability. From Figure 4, it can be seen that the four cells corresponding to the AGR biotope category are located in the upper part of the graph, with their centroids well separated from the other clusters. Conversely, the lower part of the graph is occupied by the other cells, which are grouped to the right to form the cluster related to the NAT biotope and to the left to form the cluster related to the WET biotope, while the central part of the graph allows the clustering of all those cells with intermediate characteristics and a substantial balance between WET and NAT cover, which define the cluster related to the MIXED biotope. From the position of the points corresponding to the bird survey cells, in the lower part of the graph, and from left to right, a progressive shift can be observed along the gradient represented by the first main component (PC1), from positions predominantly associated with WET, to intermediate positions associated with MIXED, and finally positions more decisively associated with NAT, as the PC1 values progressively increase. This suggests a rather regular and homogeneous biotope composition of the wetland, rather than a sharp and rigid distinction between the different biotope categories.
By multiplying the two data input matrices (Matrix [A’] and Matrix [B], respectively), a matrix of the abundances of each bird taxonomic order (in the rows) over the land cover (in the columns) was obtained. After a series of calculation steps, the matrix of distances of each bird order from their respective biotopes (i.e., WET, NAT, MIXED, and AGR) was derived and then converted into a “membership” matrix. This matrix was then processed with a PCA and the results shown in Figure 6 were obtained.
Figure 6 shows the results of the PCA; the first component accounted for the 53.3% of the variability, while the second one accounted for 43.6%; the total variability accounted by PC1 and PC2 together was equal to 99.9%. The position of the eigenvectors is shown in the figure: the vector corresponding to the WET biotope is oriented toward the lower right, while the vector corresponding to the MIXED biotope is oriented toward the upper left in an almost mirror image, i.e., a symmetrical configuration with respect to the former.
In contrast, the vectors associated to the NAT and AGR biotopes are oriented toward the upper right of the graph, are highly correlated with each other, and are only slightly angularly offset from each other. Therefore, it can be clearly observed that the CA and CL bird taxonomic orders (Caprimulgiformes–Apodiformes and Columbiformes) are highly associated with the MIXED biotope and the membership values of the MIXED biotope decrease along an elliptical path while the membership values of the WET biotope progressively increase to reach the bird taxonomic orders of LS (Laridae and Sternidae), where the highest membership values of the WET biotope are observed. The generally very low membership values associated with the NAT and AGR biotope categories along this elliptical path first increase (starting with CA and CL) and then decrease (ending with LS), reaching the maximum membership value for the AN bird taxonomic order (Anseriformes), placed at the vertex of the ellipse. Table 4 shows the membership values just commented on in Figure 6.
With respect to the total of eleven bird orders identified in the wetland, after applying the K-means clustering rules and performing the PCA characterization, it can be noted that eight bird orders are assigned to the MIXED biotope category and the other three bird orders are assigned to the WET biotope category (Table 4). It can therefore be concluded that the MIXED biotope is the most dominant in strict association with the bird community, their respective bird orders and their habitat sets. This is one of the most important pieces of information to consider when translating the results of the analysis into management strategies and operations.

3.2. Visitor Identification, Preferences and Orientations

Table 5 provides a summary of the respondents’ characteristics. A total of 239 visitors completed the questionnaire.
The 36–60 year age group was the most represented. The gender ratio (male/female) was approximately 0.78, with about 42% male and 54% female respondents. Nearly half (48.5%) of the participants held a master’s degree. The primary occupations of respondents included students (16.3%), office workers (15.9%), retired (13.4%), and an equal number of teachers and professionals (12.6%). Most of the respondents were from Italy (92.9%) and lived at different distances from the wetland: 20–40 km (38.9%), 0–20 km (29.3%), and 40–100 km (22.2%). The vast majority (79.9%) were visiting the oasis for the first time, and less than half (47.7%) knew that the site is part of the Nature 2000 network.
The majority of respondents (62.8%) cited the option “contact with nature” as the main reason for visiting King’s Lagoon. None of the other options selected reached 10% of respondents and were therefore not considered representative.
According to the respondents, the AGR and NAT biotopes were rated lower, while the MIXED and WET biotopes were rated higher (Figure 7A) in terms of consideration by wetland visitors. Overall, WET and MIXED were the most valued biotopes according to respondents, with NAT and AGR lagging behind. This ranking was determined by summing the products of the scores and the number of responses for each option (Figure 7B).
Table 6 shows the results of visitors’ perceptions and ratings of the ESs provided by King’s Lagoon. Four main or general typologies of ESs were distinguished: provisioning, regulating, cultural, and biodiversity. According to the literature [2], these four types should be: provisioning, regulating, supporting, and cultural. For the sake of simplicity and ease of understanding for respondents, it was decided to select biodiversity as a distinct and individual ES, thus not including it in the regulating ESs, and to consider supporting ESs within the broader category of regulating ESs. Within this framework, the “biodiversity” option was considered a priority by about 19% of visitors, making it the highest ranked single preference option (first numerical column in Table 5). In second place was the option “pristine nature and landscape” (about 16%), closely followed by the option “nature-based tourism” (about 15%).
More broadly, considering the five ES macro-categories, almost half of the respondents (about 45%) considered cultural ESs (i.e., CESs) as the most important group of services provided by the wetland. Both regulating and biodiversity ESs were considered a priority by about 20% of the respondents, while provisioning ESs were regarded as the least important (for about 15% of the respondents). Among the regulating ESs, the option “climate change mitigation” was considered a priority by 9% of the respondents, highlighting the importance of King’s Lagoon for this type of ecological function. In terms of provisioning services, the most valued option was “water availability”, highlighting the importance of water resources in the face of their expected scarcity as climate crises worsen.
Table 7 shows a deeper understanding of the visitors’ opinions and options regarding the possible association of ESs with the biotope categories.
In general, the most valued biotope category in the ES supply was the MIXED biotope (with about 52% of the reports), followed by the WET biotope with 30%. In contrast, the NAT and AGR biotopes were much less valued by the respondents, each receiving about 9% of the reports. The ES “biodiversity” is mostly associated with the MIXED biotope, while the regulating services are considered to be provided by a combination of biotopes: WET for “natural water treatment and improved water quality”, NAT for “flood protection”, and WET and NAT together with respect to “climate change mitigation”. Considering the provisioning services, not surprisingly and quite obviously, both “fishing” and “water availability” are largely associated with the WET biotopes, while “crop cultivation” is associated with AGR and “harvesting wild edible plants” is associated with NAT. Finally, all cultural services depend largely on the MIXED biotope. This relationship is very strict and highly significant; it highlights the most important consideration of this work: by preserving and regenerating the MIXED biotope type (the target), it is also possible to intercept the most relevant demand for services by wetland visitors.

4. Discussion

4.1. Suitability of the Bird Counting Method Used in the Survey

Species richness is a key indicator for assessing ecosystem integrity, not only because of its simplicity but also because it is accessible to the general public. As a core measure of taxonomic diversity, it plays a critical role in engaging stakeholders and strengthening awareness-raising initiatives [60]. This metric is essential for mobilizing collective efforts to conserve biodiversity and monitor the health of the environment. In this study, the line transect method was chosen and implemented because of its high flexibility, which makes it applicable in terrestrial and coastal environments, both for the survey of single species and for the survey of groups of species. Its efficiency lies in the significant amount of data collected relative to the effort expended, making it particularly suitable for long-term monitoring projects where resource optimization is a critical factor [61]. Bird surveys have been carried out throughout the year, during both breeding and non-breeding periods, to assess the composition of the bird community, including migratory species. This approach reflects the variety of nature-based experiences available to visitors in different seasons. During the non-breeding season, birds are generally less active in movement and song than during the breeding season, which posed some challenges. In terms of species detection, line transects generally yield higher numbers of species than point counts [62], but only if observers stayed within 50 m of the transect line. Beyond this distance, up to 60% of birds may go undetected by observers [63]. The line transect method was therefore chosen because it is considered to be the most effective for detecting species abundance and richness [64], making it suitable for biodiversity assessment [65]. Birds observed included individuals in flight over atypical habitats, but were consistent with other field observations and the literature.

4.2. Bird Community and Biotopes: The Importance of Ecotones and Flagship Species Selection

In King’s Lagoon, 97 bird taxonomic units (94 species and 3 higher taxa) have been recorded, distributed in four main biotope categories, the most abundant being WET followed by MIXED. The WET biotope (wetlands and aquatic/riparian ecosystems) is the most widespread biotope category, but lagoons here typically cover only a few hectares, a strong limitation for strictly aquatic bird species, which tend to prefer water bodies larger than 5 hectares [66]. This limitation is evident in the absence of large wintering flocks of Anseriformes and Charadriiformes, a phenomenon that has instead been observed within the same SPA (Special Protection Area) in larger wetlands such as the Margherita di Savoia saltpans (not far from King’s Lagoon). Thus, although the MIXED biotope is not the most widespread and abundant in the study area, it is the one that predominates in terms of size and composition of the ornithological community, bird species and orders recorded, and detected habitat diversity, highlighting its central role in supporting a wide range of biodiversity. The MIXED biotope represents ecotones, which are transitional zones between different habitats, more precisely a kind of blurred boundary or tension buffer between aquatic and terrestrial habitats that plays an important role in enhancing biodiversity and ecosystem functionality. These areas are often richer in biodiversity because they can support organisms from both adjacent ecosystems, as well as species that are uniquely adapted to this particular transitional environment. This makes ecotones hotspots of biodiversity, offering diverse resources that are not always available in the core areas of either biotope [67,68].
This finding is crucial for management strategies, as it emphasizes the need to focus conservation efforts on maintaining and enhancing these mixed-species habitats. In fact, most birds, including waterfowl of the orders Gruiformes, Suliformes and Anseriformes, are mainly observed in the MIXED biotope categories. They congregate in ecotones, which provide a variety of microhabitats that offer shelter, food, and breeding grounds, thus playing a critical role in maintaining ecosystem health and stability [69]. Birds find ecotones particularly advantageous for foraging, nesting, and resting, as they can access both aquatic and terrestrial resources [70]. This diversity of options helps species thrive in ways that a single ecosystem might not. Ecotones also serve as natural buffers, providing protection from disturbance. For waterbirds, the edges between water and land provide refuge from predators or human disturbance, which is often more prevalent in the open, central parts of ecosystems, underscoring the influence of habitat size on bird behavior and distribution [71].
The bird orders Ciconiiformes, Podicipediformes, and Charadriiformes (especially the families Laridae and Sternidae) are most commonly observed in WET biotopes due to their ecological dependence on water and wetlands, which provide essential resources such as food, breeding sites, and shelter. Ciconiiformes, which include large wading birds such as A. alba, A. cinerea, A. purpurea, A. ralloides, B. ibis, E. garzetta, and P. falcinellus, are particularly well suited to wetland habitats. These birds rely on shallow water to hunt for fish, amphibians, and other small aquatic animals, making wetlands ideal foraging and breeding grounds for them [72]. Podicipediformes, which include grebes, are another group strongly associated with wetlands. These diving birds are primarily found in freshwater wetlands, where they use their exceptional diving skills to catch fish and aquatic invertebrates. Wetlands provide the calm, nutrient-rich waters that grebes need for feeding and nesting [73,74]. Laridae (gulls) and Sternidae (terns) are also closely associated with wetland ecosystems. Gulls are commonly found in coastal wetlands, estuaries, and inland waters, where they benefit from the abundant food supply these habitats provide. Terns, known for their fishing skills, depend on wetlands to feed on fish and aquatic invertebrates, and they often nest along the shores of wetlands or in marshes [75].
Considering the abundance and distribution of birds in King’s Lagoon, the order Passeriformes is the most abundant and widespread, followed by the order Ciconiiformes. Passeriformes, being small birds, are not always easy to spot by visitors, while Ciconiiformes (especially some Ardeidae such as A. alba, A. cinerea, A. purpurea, A. ralloides, B. ibis, and E. garzetta) are much larger and therefore easier to observe. These latter waterbirds, known for their conspicuous presence, ecological importance, and sensitivity to habitat change, are often considered flagship species. As high-profile, charismatic, or ambassadorial species, flagship species serve as symbols and rallying points for conservation projects, campaigns, and the broader conservation movement [76]. As large, visually distinctive birds, Ardeidae, commonly known as herons, capture public attention, making them effective symbols for conservation efforts. Their reliance on wetlands for feeding, nesting, and breeding also makes them strong indicators of wetland health [77]. They feed primarily on fish, amphibians, and invertebrates, placing them at the top of the food chain in many wetland ecosystems. This role as top predators helps regulate prey populations and maintain ecological balance within wetlands. Their presence signals a thriving, biodiverse environment, while their decline can indicate habitat degradation or pollution. As flagship species, Ardeidae can mobilize public support for wetland conservation and draw attention to the need to preserve these vital ecosystems. Protecting habitats that support herons often benefits a wide range of other species, from plants to smaller animals, making them a key species for promoting holistic conservation strategies.
Furthermore, the presence of Ardeidae, as charismatic flagship species, can encourage a more diverse audience, as these animals have a strong visual and emotional appeal, and can attract not only adults but also children, young people, and families, who may be fascinated by the opportunity to see live species that they normally only know from images or documentaries. In addition, the fame of these animals often generates media interest, making King’s Lagoon more attractive to people with different levels of education or environmental knowledge, also through the development of educational trails and interactive activities related to their presence, involving schools, families, and groups, thus broadening the visitor base.

4.3. Interpretation of Visitor Survey Results

The high value placed by visitors on the “contact with nature” option (63% of respondents) illustrates the essential role that nature experiences play in people’s lives, affecting their health, leisure activities and personal values, and underlines the importance of preserving and enhancing these natural spaces. People value direct experiences with nature and seek its intrinsic benefits for relaxation, and mental and physical well-being. Visitors are also attracted by recreational and educational opportunities, and for many, nature provides cultural and personal fulfillment. This connection fosters greater awareness and support for conservation efforts, as people who appreciate nature are more likely to advocate for the protection and sustainable management of natural areas.
The variety of ESs considered as priorities for the study area indicates that visitors recognize and value a wide range of benefits provided by the natural environment. Their preferences span multiple categories, highlighting the importance of different ecosystem functions and services, from cultural and recreational opportunities to environmental protection and biodiversity conservation. This diversity of preferences underscores the multifaceted importance of the wetland and suggests that management and conservation strategies should address a wide range of ESs to meet the diverse needs and values of visitors. MIXED and WET biotopes are perceived to be more effective in providing essential ESs that visitors prioritize. In particular, MIXED is not only recognized for its overall provision of ESs but also stands out as the biotope type that best supports CESs and biodiversity. The high rankings of MIXED and WET reflect their critical roles in maintaining ecological balance, enhancing biodiversity, and providing cultural and recreational benefits that are essential to both the environment and the visitor experience.

4.4. Conservation and Management Implications

The main reason for people to visit the studied wetland (King’s Lagoon) was the “contact with nature” option, through which they find a number of individual and social values of nature, specifically expressed by the corresponding ecosystem services. Visitors perceive the conservation and increase of biodiversity and the wide range of ESs that the wetland can provide as priorities for King’s Lagoon, with a particular emphasis on CESs. Among the latter, the most relevant are the options of “pristine nature and landscape” together with “nature-based tourism” with its associated values, which are both supported and stimulated by the biodiversity of King’s Lagoon.
Understanding the relationships between biodiversity, as expressed by bird communities in this case study, and biotopes can help in planning conservation strategies and promoting sustainable recreational activities. Biodiversity is positively correlated with habitat diversity. Therefore, management that favors greater habitat diversity will lead to an increase in biodiversity and consequently an improvement in the CESs offered by King’s Lagoon, which will attract a greater number of visitors whose main reason for visiting is “contact with nature”, as already reported. In this virtuous circle, the rich biodiversity of the wetlands enhances the CESs, while the cultural activities and values associated with these ecosystems promote and sustain biodiversity. This dynamic interplay ensures that both natural and cultural resources are valued, protected and preserved for future generations.
As a result of our research in King’s Lagoon (through both bird surveys and visitor questionnaires and their subsequent cross-interpretation), it is critical to prioritize the MIXED biotope, which supports diverse species and is essential for maintaining biodiversity. MIXED biotopes are also identified as the environmental systems of greatest interest to visitors and should be primarily targeted for conservation management. In addition, the ecological needs of Ardeidae as flagship species should be addressed. There is growing recognition in interdisciplinary conservation science that the use of flagship species is a strategic approach, not just an ecological concept [78]. By focusing on both the MIXED biotope and the ecological needs of Ardeidae, conservation efforts can be better aligned with the ecological characteristics of the area, ensuring effective and comprehensive action while adequately providing CESs. Xie et al. [79] have shown that wading birds are ideal focal species for wider bird conservation in terms of habitat preference. Indeed, wading birds can benefit coexisting water and forest birds that prefer blue or green areas in ecological networks. Therefore, conservation actions targeting Ardeidae can be representative and have an impact on a wider biodiversity of bird species. By focusing on both the MIXED biotope and the ecological needs of Ardeidae, conservation efforts can be better aligned with the ecological characteristics of the area, ensuring effective and comprehensive action while adequately providing CESs.
Based on the research presented in this paper, we propose the following recommendations (Table 8), inspired by international best practices for habitat conservation in protected areas. The aim is to improve and optimize the occurrence and abundance of Ardeidae in order to increase the provision of CESs in the King’s Lagoon wetland and to conserve its biodiversity heritage as a whole [80,81,82,83].
Such recommendations will be included in the Management Plan of King’s Lagoon, which will be drawn up as part of a project financed through a national call for proposals (PNRR) entitled “Protection and enhancement of architecture and the rural landscape”.
These actions and measures can contribute to biodiversity conservation, which in turn maximizes the potential of CESs by providing opportunities for recreational activities such as birding, nature photography, and nature-based tourism. These activities not only provide enjoyment and educational benefits but also generate economic revenues that can be reinvested in conservation efforts. In addition, the cultural values associated with wetlands—such as their spiritual significance, aesthetic beauty, and role in local traditions—foster a deeper appreciation and respect for these environments. This cultural appreciation can translate into greater support for conservation initiatives. When visitors recognize the importance of conserving the biodiversity that underpins their cultural experiences, they are more likely to engage in and support sustainable practices.
Promoting CESs strengthens conservation policies, as wetlands designated for cultural activities often receive greater protection and management attention. These efforts, including habitat restoration and sustainable land-use practices, enhance biodiversity, creating a positive feedback loop where a healthy ecosystem offers richer cultural experiences. Integrating CESs into conservation planning highlights the broader value of wetlands beyond their ecological and economic benefits, encouraging widespread support. This dynamic relationship fosters a sustainable model, preserving both natural and cultural resources for future generations, and promoting a harmonious balance between nature and society.

5. Conclusions

This paper developed tailored planning strategies and management tools for the conservation of wetland biodiversity by integrating an ecological survey of the wetland bird community with a social survey of visitors to the King’s Lagoon Nature Reserve.
Firstly, the bird community analysis led to the identification of the mixed biotope category (a combination of wetlands, aquatic/riparian ecosystems, semi-natural vegetated areas, and meadows together with agricultural areas) as the reference biotope for prioritizing wetland management. Secondly, Ardeidae was selected as the flagship bird category to guide conservation actions and to stimulate interest, curiosity, and active participation of potential visitors of the wetland.
The visitor survey was essential to identify the MIXED biotope as the most appealing environmental feature, which should therefore be the primary focus of conservation management efforts.
A holistic approach should be adopted in management strategies in favor of Ardeidae, the MIXED biotope and visitors, to improve habitat diversification, maintain ecological balance, and secure essential resources for feeding, nesting, and breeding by promoting habitat diversity, managing water levels, and ensuring ecosystem connectivity.
These guidelines enhance biodiversity, creating a positive feedback loop in which a healthy ecosystem provides richer cultural experiences, and vice versa. This dynamic relationship fosters a sustainable model that preserves both natural and cultural resources for future generations and promotes a harmonious balance between nature and society.

Supplementary Materials

The following supporting information can be downloaded at https://www.mdpi.com/article/10.3390/su162310286/s1: Table S1. Questionnaire for visitors; Table S2. List of detected bird species; Photoboard S3. Landcover classes; Photoboard S4. MIXED biotope; Photoboard S5. Bird species with the highest abundance and occurrence; Photoboard S6. Ardeidae as flagship species.

Author Contributions

Conceptualization, M.I., V.R., A.R.B.C., M.G., and M.M.; methodology, M.I., A.R.B.C., V.R., M.G., and M.M.; formal analysis, M.M.; investigation, M.I. and V.R.; writing—original draft preparation, M.I.; writing—review and editing, M.M.; funding acquisition, M.M. All authors have read and agreed to the published version of the manuscript.

Funding

This research was funded by the Agritech National Research Center and received funding from the European Union Next-Generation EU, Piano Nazionale di Ripresa e Resilienza (PNRR)—Missione 4, Componente 2, Investimento 1.4—D.D. 1032 17/06/2022, CN00000022. This manuscript reflects only the authors’ views and opinions, and neither the European Union nor the European Commission can be considered responsible for them.

Data Availability Statement

The raw data supporting the conclusions of this article will be made available by the authors upon request.

Acknowledgments

We would like to thank Planetek Italia for the pre-processing of the Pleiades NEO data and wildlife photographer Matteo Caldarella, Walter Caterina, Mario Lacetera, and Salvatore Giannino for providing birds images to be used in the photoboards S5 and S6 of the Supplementary materials.

Conflicts of Interest

The authors declare no conflicts of interest.

References

  1. Anthony, A.; Atwood, J.; August, P.; Byron, C.; Cobb, S.; Foster, C.; Fry, C.; Gold, A.; Hagos, K.; Heffner, L.; et al. Coastal Lagoons and Climate Change: Ecological and Social Ramifications in U.S. Atlantic and Gulf Coast Ecosystems. Ecol. Soc. 2009, 14, art8. [Google Scholar] [CrossRef]
  2. Millennium Ecosystem Assessment; Ecosystems and Human Well-Being: Synthesis; Island Press: Washington, DC, USA, 2005.
  3. Pastur, G.M.; Peri, P.L.; Lencinas, M.V.; García-Llorente, M.; Martín-López, B. Spatial Patterns of Cultural Ecosystem Services Provision in Southern Patagonia. Landsc. Ecol. 2016, 31, 383–399. [Google Scholar] [CrossRef]
  4. Mao, Q.; Hu, C.; Guo, Q.; Li, Y.; Liu, M. How Does Vegetation Landscape Structure of Urban Green Spaces Affect Cultural Ecosystem Services at Multiscale: Based on PLS-SEM Model. Forests 2023, 14, 1401. [Google Scholar] [CrossRef]
  5. Kennish, M.; Paerl, H. Coastal Lagoons: Critical Habitats of Environmental Change. In Coastal Lagoons; Kennish, M., Paerl, H., Eds.; Marine Science; CRC Press: Boca Raton, FL, USA, 2010; Volume 20103358, pp. 1–15. ISBN 978-1-4200-8830-4. [Google Scholar]
  6. Sánchez, B.; Rodríguez, D. Avifauna Associated with the Aquatic and Coastal Ecosystems of Cayo Coco, Cuba. J. Caribb. Ornithol. 2000, 13, 68–75. [Google Scholar]
  7. Kularatne, R.K.A.; Harris, J.M.; Vinobaba, P.; Thanusanth, S.; Kishoran, S.; Kankanamge, C.E. Use of Habitats by Aquatic and Terrestrial Avifauna in Tropical Coastal Lagoons. Reg. Stud. Mar. Sci. 2021, 47, 101926. [Google Scholar] [CrossRef]
  8. Whelan, C.J.; Wenny, D.G.; Marquis, R.J. Ecosystem Services Provided by Birds. Ann. N. Y. Acad. Sci. 2008, 1134, 25–60. [Google Scholar] [CrossRef]
  9. Santos, F.C.V.; Nascimento, M.S.; Braga, S.S.; Guzi, A. O Potencial Do Birdwatching Na Área de Proteção Ambiental Do Delta Do Parnaíba (Piauí, Brasil). Rev. Bras. Ecoturismo 2019, 12, 854–865. [Google Scholar] [CrossRef]
  10. Gregory, R.D.; Strien, A.V. Wild Bird Indicators: Using Composite Population Trends of Birds as Measures of Environmental Health. Ornithol. Sci. 2010, 9, 3–22. [Google Scholar] [CrossRef]
  11. Sundar, K.S.G.; Kittur, S. Can Wetlands Maintained for Human Use Also Help Conserve Biodiversity? Landscape-Scale Patterns of Bird Use of Wetlands in an Agricultural Landscape in North India. Biol. Conserv. 2013, 168, 49–56. [Google Scholar] [CrossRef]
  12. Graves, R.A.; Pearson, S.M.; Turner, M.G. Effects of Bird Community Dynamics on the Seasonal Distribution of Cultural Ecosystem Services. Ambio 2019, 48, 280–292. [Google Scholar] [CrossRef]
  13. Rodrigues-Filho, J.L.; Macêdo, R.L.; Sarmento, H.; Pimenta, V.R.A.; Alonso, C.; Teixeira, C.R.; Pagliosa, P.R.; Netto, S.A.; Santos, N.C.L.; Daura-Jorge, F.G.; et al. From Ecological Functions to Ecosystem Services: Linking Coastal Lagoons Biodiversity with Human Well-Being. Hydrobiologia 2023, 850, 2611–2653. [Google Scholar] [CrossRef] [PubMed]
  14. Díaz, S.; Demissew, S.; Carabias, J.; Joly, C.; Lonsdale, M.; Ash, N.; Larigauderie, A.; Adhikari, J.R.; Arico, S.; Báldi, A.; et al. The IPBES Conceptual Framework—Connecting Nature and People. Curr. Opin. Environ. Sustain. 2015, 14, 1–16. [Google Scholar] [CrossRef]
  15. Ebner, M.; Schirpke, U.; Tappeiner, U. Combining Multiple Socio-Cultural Approaches—Deeper Insights into Cultural Ecosystem Services of Mountain Lakes? Landsc. Urban Plan. 2022, 228, 104549. [Google Scholar] [CrossRef]
  16. Sherrouse, B.C.; Semmens, D.J.; Ancona, Z.H.; Brunner, N.M. Analyzing Land-Use Change Scenarios for Trade-Offs among Cultural Ecosystem Services in the Southern Rocky Mountains. Ecosyst. Serv. 2017, 26, 431–444. [Google Scholar] [CrossRef]
  17. Kumar, M.; Kumar, P. Valuation of the Ecosystem Services: A Psycho-Cultural Perspective. Ecol. Econ. 2008, 64, 808–819. [Google Scholar] [CrossRef]
  18. Martín-López, B.; Gómez-Baggethun, E.; García-Llorente, M.; Montes, C. Trade-Offs across Value-Domains in Ecosystem Services Assessment. Ecol. Indic. 2014, 37, 220–228. [Google Scholar] [CrossRef]
  19. Perman, R. (Ed.) Natural Resource and Environmental Economics, 3rd ed.; Pearson Addison Wesley: Harlow, UK; Munich, Germany, 2003. [Google Scholar]
  20. Nesbitt, L.; Adamczewski, J. Decline and Recovery of the Bathurst Caribou Herd: Workshops Held in Yellowknife, NWT; Government of NWT: Yellowknife, NWT, Canada, 2009. [Google Scholar]
  21. Brambilla, M.; Ilahiane, L.; Assandri, G.; Ronchi, S.; Bogliani, G. Combining Habitat Requirements of Endemic Bird Species and Other Ecosystem Services May Synergistically Enhance Conservation Efforts. Sci. Total Environ. 2017, 586, 206–214. [Google Scholar] [CrossRef]
  22. Zhou, L.; Guan, D.; Huang, X.; Yuan, X.; Zhang, M. Evaluation of the Cultural Ecosystem Services of Wetland Park. Ecol. Indic. 2020, 114, 106286. [Google Scholar] [CrossRef]
  23. Hale, R.L.; Cook, E.M.; Beltrán, B.J. Cultural Ecosystem Services Provided by Rivers across Diverse Social-Ecological Landscapes: A Social Media Analysis. Ecol. Indic. 2019, 107, 105580. [Google Scholar] [CrossRef]
  24. Sinclair, M.; Mayer, M.; Woltering, M.; Ghermandi, A. Using Social Media to Estimate Visitor Provenance and Patterns of Recreation in Germany’s National Parks. J. Environ. Manag. 2020, 263, 110418. [Google Scholar] [CrossRef]
  25. Sinclair, M.; Ghermandi, A.; Signorello, G.; Giuffrida, L.; De Salvo, M. Valuing Recreation in Italy’s Protected Areas Using Spatial Big Data. Ecol. Econ. 2022, 200, 107526. [Google Scholar] [CrossRef]
  26. Brown, G.; Fagerholm, N. Empirical PPGIS/PGIS Mapping of Ecosystem Services: A Review and Evaluation. Ecosyst. Serv. 2015, 13, 119–133. [Google Scholar] [CrossRef]
  27. Ondiek, R.A.; Kitaka, N.; Oduor, S.O. Assessment of Provisioning and Cultural Ecosystem Services in Natural Wetlands and Rice Fields in Kano Floodplain, Kenya. Ecosyst. Serv. 2016, 21, 166–173. [Google Scholar] [CrossRef]
  28. Johansson, M.; Pedersen, E.; Weisner, S. Assessing Cultural Ecosystem Services as Individuals’ Place-Based Appraisals. Urban For. Urban Green. 2019, 39, 79–88. [Google Scholar] [CrossRef]
  29. Gómez-Baggethun, E.; Tudor, M.; Doroftei, M.; Covaliov, S.; Năstase, A.; Onără, D.-F.; Mierlă, M.; Marinov, M.; Doroșencu, A.-C.; Lupu, G.; et al. Changes in Ecosystem Services from Wetland Loss and Restoration: An Ecosystem Assessment of the Danube Delta (1960–2010). Ecosyst. Serv. 2019, 39, 100965. [Google Scholar] [CrossRef]
  30. Satz, D.; Gould, R.K.; Chan, K.M.A.; Guerry, A.; Norton, B.; Satterfield, T.; Halpern, B.S.; Levine, J.; Woodside, U.; Hannahs, N.; et al. The Challenges of Incorporating Cultural Ecosystem Services into Environmental Assessment. AMBIO 2013, 42, 675–684. [Google Scholar] [CrossRef]
  31. Lavorel, S.; Bayer, A.; Bondeau, A.; Lautenbach, S.; Ruiz-Frau, A.; Schulp, N.; Seppelt, R.; Verburg, P.; Teeffelen, A.V.; Vannier, C.; et al. Pathways to Bridge the Biophysical Realism Gap in Ecosystem Services Mapping Approaches. Ecol. Indic. 2017, 74, 241–260. [Google Scholar] [CrossRef]
  32. Kremen, C. Managing Ecosystem Services: What Do We Need to Know about Their Ecology? Ecol. Lett. 2005, 8, 468–479. [Google Scholar] [CrossRef]
  33. Cumming, G.S.; Maciejewski, K. Reconciling Community Ecology and Ecosystem Services: Cultural Services and Benefits from Birds in South African National Parks. Ecosyst. Serv. 2017, 28, 219–227. [Google Scholar] [CrossRef]
  34. Booth, J.E.; Gaston, K.J.; Evans, K.L.; Armsworth, P.R. The Value of Species Rarity in Biodiversity Recreation: A Birdwatching Example. Biol. Conserv. 2011, 144, 2728–2732. [Google Scholar] [CrossRef]
  35. Villamagna, A.M.; Angermeier, P.L.; Niazi, N. Evaluating Opportunities to Enhance Ecosystem Services in Public Use Areas. Ecosyst. Serv. 2014, 7, 167–176. [Google Scholar] [CrossRef]
  36. Paracchini, M.L.; Zulian, G.; Kopperoinen, L.; Maes, J.; Schägner, J.P.; Termansen, M.; Zandersen, M.; Perez-Soba, M.; Scholefield, P.A.; Bidoglio, G. Mapping Cultural Ecosystem Services: A Framework to Assess the Potential for Outdoor Recreation across the EU. Ecol. Indic. 2014, 45, 371–385. [Google Scholar] [CrossRef]
  37. Assandri, G.; Bogliani, G.; Pedrini, P.; Brambilla, M. Beautiful Agricultural Landscapes Promote Cultural Ecosystem Services and Biodiversity Conservation. Agric. Ecosyst. Environ. 2018, 256, 200–210. [Google Scholar] [CrossRef]
  38. Cammerino, A.R.B.; Ingaramo, M.; Monteleone, M. Complementary Approaches to Planning a Restored Coastal Wetland and Assessing the Role of Agriculture and Biodiversity: An Applied Case Study in Southern Italy. Water 2023, 16, 153. [Google Scholar] [CrossRef]
  39. Müller, S.M.; Peisker, J.; Bieling, C.; Linnemann, K.; Reidl, K.; Schmieder, K. The Importance of Cultural Ecosystem Services and Biodiversity for Landscape Visitors in the Biosphere Reserve Swabian Alb (Germany). Sustainability 2019, 11, 2650. [Google Scholar] [CrossRef]
  40. Gosal, A.S.; Newton, A.C.; Gillingham, P.K. Comparison of Methods for a Landscape-Scale Assessment of the Cultural Ecosystem Services Associated with Different Habitats. Int. J. Biodivers. Sci. Ecosyst. Serv. Manag. 2018, 14, 91–104. [Google Scholar] [CrossRef]
  41. Whitehead, A.L.; Kujala, H.; Ives, C.D.; Gordon, A.; Lentini, P.E.; Wintle, B.A.; Nicholson, E.; Raymond, C.M. Integrating Biological and Social Values When Prioritizing Places for Biodiversity Conservation. Conserv. Biol. 2014, 28, 992–1003. [Google Scholar] [CrossRef]
  42. Plieninger, T.; Bieling, C.; Fagerholm, N.; Byg, A.; Hartel, T.; Hurley, P.; López-Santiago, C.A.; Nagabhatla, N.; Oteros-Rozas, E.; Raymond, C.M.; et al. The Role of Cultural Ecosystem Services in Landscape Management and Planning. Curr. Opin. Environ. Sustain. 2015, 14, 28–33. [Google Scholar] [CrossRef]
  43. Wang, Y.; Shi, J.; Wu, Y.; Zhang, W.; Yang, X.; Lv, H.; Xia, S.; Zhao, S.; Tian, J.; Cui, P.; et al. Selection of Flagship Species and Their Use as Umbrellas in Bird Conservation: A Case Study in Lishui, Zhejiang Province, China. Animals 2023, 13, 1825. [Google Scholar] [CrossRef]
  44. Polgar, G.; Jaafar, Z. Flagship Species. In Endangered Forested Wetlands of Sundaland; Springer International Publishing: Cham, Switzerland, 2018; pp. 57–88. [Google Scholar]
  45. LIFE+09 NAT/IT/000150 Layman’s Report. Available online: https://pugliacon.regione.puglia.it/web/sit-puglia-paesaggio/-/rapporto-finale-progetto-life-interventi-di-conservazione-degli-habitat-delle-zone-umide-costiere-nel-sic-zone-umide-della-capitanata- (accessed on 21 September 2024).
  46. Cammerino, A.R.B.; Piacquadio, L.; Ingaramo, M.; Gioiosa, M.; Monteleone, M. Wild Edible Plant Species in the ‘King’s Lagoon’ Coastal Wetland: Survey, Collection, Mapping and Ecological Characterization. Horticulturae 2024, 10, 632. [Google Scholar] [CrossRef]
  47. Dylewski, Ł.; Tobolka, M. Unused Railway Lines as a Contributor to Bird Abundance, Species Richness and Diversity in Intensively Managed Farmland. Agric. Ecosyst. Environ. 2022, 326, 107820. [Google Scholar] [CrossRef]
  48. Whittaker, R.H. Evolution and Measurement of Species Diversity. Taxon 1972, 21, 213–251. [Google Scholar] [CrossRef]
  49. Whittaker, R.H. Dominance and Diversity in Land Plant Communities: Numerical Relations of Species Express the Importance of Competition in Community Function and Evolution. Science 1965, 147, 250–260. [Google Scholar] [CrossRef] [PubMed]
  50. Peet, R.K. The Measurement of Species Diversity. Annu. Rev. Ecol. Syst. 1974, 5, 285–307. [Google Scholar] [CrossRef]
  51. Spellerberg, I.F.; Fedor, P.J. A Tribute to Claude Shannon (1916–2001) and a Plea for More Rigorous Use of Species Richness, Species Diversity and the ‘Shannon–Wiener’ Index. Glob. Ecol. Biogeogr. 2003, 12, 177–179. [Google Scholar] [CrossRef]
  52. Shannon, C.E. A Mathematical Theory of Communication. Bell Syst. Tech. J. 1948, 27, 379–423. [Google Scholar] [CrossRef]
  53. Gazzetta Ufficiale. LEGGE 6 Dicembre 1991, n. 394 Legge Quadro Sulle Aree Protette; GU Serie Generale n.292 Del 13-12-1991—Supplemento Ordinario n. 83; Gazzetta Ufficiale: Rome, Italy, 1991. [Google Scholar]
  54. Pascual, U.; Balvanera, P.; Anderson, C.B.; Chaplin-Kramer, R.; Christie, M.; González-Jiménez, D.; Martin, A.; Raymond, C.M.; Termansen, M.; Vatn, A.; et al. Diverse Values of Nature for Sustainability. Nature 2023, 620, 813–823. [Google Scholar] [CrossRef]
  55. Van Oudenhoven, A.P.E.; Petz, K.; Alkemade, R.; Hein, L.; De Groot, R.S. Framework for Systematic Indicator Selection to Assess Effects of Land Management on Ecosystem Services. Ecol. Indic. 2012, 21, 110–122. [Google Scholar] [CrossRef]
  56. Shoyama, K.; Yamagata, Y. Local Perception of Ecosystem Service Bundles in the Kushiro Watershed, Northern Japan—Application of a Public Participation GIS Tool. Ecosyst. Serv. 2016, 22, 139–149. [Google Scholar] [CrossRef]
  57. Hausner, V.H.; Brown, G.; Lægreid, E. Effects of Land Tenure and Protected Areas on Ecosystem Services and Land Use Preferences in Norway. Land Use Policy 2015, 49, 446–461. [Google Scholar] [CrossRef]
  58. Karimi, A.; Raymond, C.M. Assessing the Diversity and Evenness of Ecosystem Services as Perceived by Residents Using Participatory Mapping. Appl. Geogr. 2022, 138, 102624. [Google Scholar] [CrossRef]
  59. Haines-Young, R.; Potschin-Young, M.; Czúcz, B. Report on the Use of CICES to Identify and Characterise the Biophysical, Social and Monetary Dimensions of ES Assessments; Deliverable D4.2, EU Horizon 2020 ESMERALDA Project, Grant Agreement No. 642007; European Commision: Brussel, Belgium, 2018. [Google Scholar]
  60. Kobori, H.; Dickinson, J.L.; Washitani, I.; Sakurai, R.; Amano, T.; Komatsu, N.; Kitamura, W.; Takagawa, S.; Koyama, K.; Ogawara, T.; et al. Citizen Science: A New Approach to Advance Ecology, Education, and Conservation. Ecol. Res. 2016, 31, 1–19. [Google Scholar] [CrossRef]
  61. Sutherland, W.J.; Newton, I.; Green, R.E. Bird Ecology and Conservation: A Handbook of Techniques; Techniques in Ecology and Conservation Series; Oxford University Press: New York, NY, USA, 2004. [Google Scholar]
  62. Fletcher, R.J.; Dhundale, J.A.; Dean, T.F. Estimating non-breeding season bird abundance in prairies: A comparison of two survey techniques. J. Field Ornithol. 2000, 71, 321–329. [Google Scholar] [CrossRef]
  63. Diefenbach, D.R.; Brauning, D.W.; Mattice, J.A. Variability in grassland bird counts related to observer differences and species detection rates. Auk 2003, 120, 1168. [Google Scholar] [CrossRef]
  64. Silveira, L.; Jácomo, A.T.A.; Diniz-Filho, J.A.F. Camera Trap, Line Transect Census and Track Surveys: A Comparative Evaluation. Biol. Conserv. 2003, 114, 351–355. [Google Scholar] [CrossRef]
  65. Bibby, C.J.; Burgess, N.D.; Hill, D.A.; Mustoe, S. Bird Census Techniques, 2nd ed.; Academic Press: San Diego, CA, USA, 2000. [Google Scholar]
  66. Tinarelli, R.; Marchesi, F. Inserto: Zone Umide—Sono Molte Le Aziende Che Tutelano La Natura. Biol. Ambient. 1996, 5, 11–12. [Google Scholar]
  67. Kark, S. Effects of Ecotones on Biodiversity. In Encyclopedia of Biodiversity; Elsevier: Amsterdam, The Netherlands, 2007; pp. 1–10. ISBN 978-0-12-226865-6. [Google Scholar]
  68. Schlacher, T.A.; Gilby, B.L.; Olds, A.D.; Henderson, C.J.; Connolly, R.M.; Peterson, C.H.; Voss, C.M.; Maslo, B.; Weston, M.A.; Bishop, M.J.; et al. Key Ecological Function Peaks at the Land–Ocean Transition Zone When Vertebrate Scavengers Concentrate on Ocean Beaches. Ecosystems 2020, 23, 906–916. [Google Scholar] [CrossRef]
  69. Holland, M.M.; Risser, P.G.; Naiman, R.J. (Eds.) Ecotones; Springer: Boston, MA, USA, 1991; ISBN 978-1-4615-9688-2. [Google Scholar]
  70. Platteeuw, M.; Foppen, R.P.B.; Van Eerden, M.R. The Need for Future Wetland Bird Studies: Scales of Habitat Use as Input for Ecological Restoration and Spatial Water Management. Ardea 2010, 98, 403–416. [Google Scholar] [CrossRef]
  71. Mulamoottil, G.; Warner, B.G.; McBean, E.A. Wetlands: Environmental Gradients, Boundaries, and Buffers; Lewis Publishers: Boca Raton, FL, USA, 1996; ISBN 978-0-203-73388-2. [Google Scholar]
  72. Kushlan, J.A.; Hancock, J.A. Herons: Bird Families of the World; Oxford University Press: Oxford, UK, 2005; ISBN 978-0-19-854981-9. [Google Scholar]
  73. O’Donnell, C.F.J.; Fjeldså, J. Grebes: Status Survey and Conservation Action Plan; IUCN: Gland, Switzerland, 1997; ISBN 978-2-8317-0421-0. [Google Scholar]
  74. Fjeldså, J. The Grebes: Podicipedidae (Bird Families of the World); Oxford University Press: Oxford, UK, 2004; ISBN 978-0-19-850064-3. [Google Scholar]
  75. Schreiber, E.A.; Burger, J. (Eds.) Biology of Marine Birds; CRC marine biology series; CRC Press: Boca Raton, FL, USA, 2002; ISBN 978-0-8493-9882-7. [Google Scholar]
  76. Simberloff, D. Flagships, Umbrellas, and Keystones: Is Single-Species Management Passé in the Landscape Era? Biol. Conserv. 1998, 83, 247–257. [Google Scholar] [CrossRef]
  77. Ogden, J.C.; Baldwin, J.D.; Bass, O.L.; Browder, J.A.; Cook, M.I.; Frederick, P.C.; Frezza, P.E.; Galvez, R.A.; Hodgson, A.B.; Meyer, K.D.; et al. Waterbirds as Indicators of Ecosystem Health in the Coastal Marine Habitats of Southern Florida: 1. Selection and Justification for a Suite of Indicator Species. Ecol. Indic. 2014, 44, 148–163. [Google Scholar] [CrossRef]
  78. Jepson, P.; Barua, M. A Theory of Flagship Species Action. Conserv. Soc. 2015, 13, 95. [Google Scholar] [CrossRef]
  79. Xie, Y.; Zou, J.; Chen, Y.; Li, F.; Jiang, Q. Are Wading Birds the Ideal Focal Species for Broader Bird Conservation? A Cost-Effective Approach to Ecological Network Planning. Ecol. Indic. 2024, 160, 111785. [Google Scholar] [CrossRef]
  80. Luoni, F.; Morganti, M. Report Workshop LIFE14 IPE/IT/000018—26 May 2017—Le Aree Umide per Gli Uccelli in Lombardia: Di Cosa Hanno Bisogno? Raccolta di Suggerimenti e Buone Pratiche; University of Pavia: Pavia, Italy, 2017. [Google Scholar]
  81. Morganti, M.; Manica, M.; Bogliani, G.; Gustin, M.; Luoni, F.; Trotti, P.; Perin, V.; Brambilla, M. Multi-Species Habitat Models Highlight the Key Importance of Flooded Reedbeds for Inland Wetland Birds: Implications for Management and Conservation. Avian Res. 2019, 10, 15. [Google Scholar] [CrossRef]
  82. Trasforini, S.; Clerici, S.; Bendotti, R.; Romanò, A.; Barenghi, B.; Ioculano, D.; Bucchini, A.; Porrini, S. Interventi Idraulici Ittiocompatibili: Linee Guida. Quaderni della Ricerca. Regione Lombardia, Italy, 2011. Available online: http://www.graia.eu/wp-content/uploads/2017/07/Interventi-idraulici-ittiocompatibili.pdf (accessed on 21 November 2024).
  83. White, C.L.; Frederick, P.C.; Main, M.B.; Rodgers, J.A., Jr. Nesting Island Creation for Wading Birds. EDIS 2019, 2005. [Google Scholar] [CrossRef]
  84. Draulans, D. The Effect of Prey Density on Foraging Behaviour and Success of Adult and First-Year Grey Herons (Ardea Cinerea). J. Anim. Ecol. 1987, 56, 479. [Google Scholar] [CrossRef]
Figure 1. Methodological planning of the research work. The flow chart was designed by the authors to show the relationships between the three pillars considered in a wetland strategic plan: nature, economy, and culture. Each green arrow indicates the path being studied and the red arrows indicate the links and relationships between them. Two positive loops are generated by matching the ecological analysis with the socio-cultural analysis: feedback (A) a better strategy for ecological conservation and feedback (B) a better strategy for the provision of cultural services.
Sustainability 16 10286 g001
Figure 2. Satellite image and planimetric map of King’s Lagoon, the coastal wetland considered in the study case. (A) Location of the study area within the Gargano National Park (southern Italy). (B) Planimetric map displaying the following landcover classes: AGR (agricultural areas); BUILT (built-up areas); NAT (semi-natural vegetation areas and meadows); and WET (wetlands and aquatic/riparian ecosystems). (C) Satellite image of King’s Lagoon.
Sustainability 16 10286 g002
Figure 3. Satellite image showing the overlaid regular grid of 67 reference units (one hectare each) used to survey land cover and monitor bird communities in King’s Lagoon, the coastal wetland under study.
Sustainability 16 10286 g003
Figure 4. Flow chart showing the overall processing of the statistical data.
Sustainability 16 10286 g004
Figure 5. Clustering (circle) of the four wetland biotope categories and display of the wetland cells (dots) according to a principal component plot. The shaded colored area of each cluster encloses the 50% of the observations, while the size of each black line circle is proportional to the count of the observations. Different colors specify the four identified clusters corresponding to the biotope categories: 1. WET (26 cells); 2. NAT (13 cells); 3. MIXED (21 cells), and 4. AGR (4 cells).
Sustainability 16 10286 g005
Figure 6. Principal Component Analysis (PCA) performed on the membership values of each taxonomic order of birds (CA, CL, PA, GR, CH, AF, SU, AN, CI, PO, and LS) to their respective categories of biotope (WET, AGR, NAT, and MIXED) identified in the wetland. The list of the bird order code is reported in Table 4.
Sustainability 16 10286 g006
Figure 7. (A) Trends in the scores (from 1 to 5) given by visitors to the four selected biotope categories (AGR, NAT, MIXED, and WET) and (B) corresponding average score. Levels not connected with the same letter are significantly different (p < 0.05).
Sustainability 16 10286 g007
Table 1. First- and second-order land cover classes detected in “King’s Lagoon”, the costal wetland considered in the study case.
First-Order Land Cover ClassesSecond-Order Land Cover Classes
WET
Wetlands and aquatic/riparian ecosystems
reeds and reedbeds
wetlands and lagoons
channels
non-permanent channels
temporary ponds
NAT
Semi-natural vegetation areas (meadows)
sparse semi-natural vegetation
herbaceous vegetation and scattered trees
BUILT
Built-up areas
roads and paths
rural buildings
rural building annexes
roof terraces and rural sheds
AGR
Agricultural areas
arable agricultural land
tree-lined and wooded agricultural areas
complex cropping and parcel systems, including small orchards and olive groves
abandoned olive groves
Table 2. Monthly and total species abundance and total species occurrence for the bird family Ardeidae.
Jan. 2023Feb. 2023Mar. 2023Apr. 2023May 2023June 2023July 2023Aug. 2023Sept. 2023Oct. 2023Nov. 2023Dec. 2023Total Species AbundanceOccurrence (No. of Cells)
Ardea alba2–32–3==1====2–31=137
Ardea cinerea>508–208–208–201 8–20>5021–508–208–208–2022120
Ardea purpurea==1 2–3 12–34–71==1310
Ardeola ralloides===2–34–72–32–38–202–3===3316
Botaurus stellaris1===========11
Bubulcus ibis8–208–20==8–208–20>5021–50==8–208–2016720
Egretta garzetta==2–32–38–208–208–208–2021–508–208–208–2012230
Ixobrychus minutus=====1======11
Table 3. Centroids and standard errors of the four biotope categories (WET, NAT, MIXED, and AGR) identified in the wetland by the K-means clustering procedure on land cover fractions. Land cover classes (WET, NAT, AGR, and BUILT) are defined in Table 1.
Biotope CategoriesNo. of CellsWET Land CoverNAT Land CoverAGR Land CoverBUILT Land Cover
WET260.673±0.0950.221±0.0650.023±0.0560.083 ± 0.056
NAT130.196±0.0990.776±0.101==0.028 ± 0.101
MIXED210.459±0.0770.433±0.0830.015±0.0400.094 ± 0.040
AGR40.330±0.1230.228±0.0850.370±0.0790.072 ± 0.085
Table 4. Membership values of each bird taxonomic order to the corresponding wetland biotope categories. The code order and number of species of each bird order are also reported.
Bird Taxonomic OrderCode OrderN SpeciesWET BiotopeNAT BiotopeMIXED BiotopeAGR BiotopeBiotope Assigned
Caprimulgiformes and ApodiformesCA30.0170.0070.9730.002MIXED
ColumbiformesCL30.0260.0120.9580.004MIXED
PasseriformesPA340.0660.0200.9070.008MIXED
CharadriformesCH120.0710.0230.8960.009MIXED
GruiformesGR30.1180.0240.8490.009MIXED
Accipitriformes and FalconiformesAF90.1550.0260.8070.011MIXED
SuliformesSU20.2040.0290.7530.014MIXED
AnseriformesAN80.3910.0340.5590.016MIXED
CiconiiformesCI110.7140.0240.2480.014WET
PodicipediformesPO30.7590.0230.2060.013WET
Charadriformes (Laridae and Sternidae)LS50.9440.0090.0410.007WET
Table 5. Respondents’ characteristics and attributes.
VariableAttributeN = 239
Ageunder 18 years old3.8%
from 19 to 35 years old25.5%
from 36 to 60 years old40.6%
over 60 years old30.1%
GenderFemale54.4%
Male41.8%
No answer3.8%
Education levelPrimary school0.8%
Middle school/Junior high school5.9%
High school32.2%
Bachelor’s degree11.7%
Master’s degree or higher education48.5%
Primary occupationStudent16.3%
Employee15.9%
Retired13.4%
Freelancer12.6%
Teacher/Professor12.6%
Other29.3%
Country of originItaly92.9%
Other7.1%
Distance travelled0–20 km29.3%
>20–40 km38.9%
>40–100 km22.2%
>100 km9.2%
No answer0.4%
First time visitingYes79.9%
No20.1%
Awareness of the Nature 2000 NetworkYes47.7%
No52.3%
Table 6. Respondents’ preferences (in percentages) for ecosystem services (ESs) and their typologies that might be provided by the King’s Lagoon wetland.
ESDescriptionPreferences (%)
BiodiversityBiodiversity19.119.1
RegulatingFlood control4.520.4
Natural water treatment and improved water quality6.7
Climate change mitigation9.1
ProvisioningAgriculture2.815.2
Fishing1.6
Harvesting wild edible plants4.6
Water availability6.2
CulturalPristine nature and landscape15.845.3
Nature-based tourism14.8
Human health and well-being7.6
Opportunities to socialize3.0
Ancient tradition and cultural heritage4.2
Total 100.0100.0
Table 7. Respondents’ preferences (in percentages) for the wetland ecosystem services (ESs) and their typologies that might be provided by King’s Lagoon with respect to the wetland biotope categories.
ESDescriptionWETAGRNATMIXED
BiodiversityBiodiversity23.43.14.768.8
RegulatingFlood control42.95.72.948.6
Natural water treatment and improved water quality48.89.32.339.5
Climate change mitigation39.74.814.341.3
ProvisioningAgriculture0.065.217.417.4
Fishing90.90.00.09.1
Harvesting wild edible plants3.617.953.625.0
Water availability57.510.68.523.4
CulturalPristine nature and landscape31.47.68.652.4
Nature-based tourism34.32.04.059.6
Human health and well-being7.817.77.866.7
Opportunities to socialize4.48.78.778.3
Ancient tradition and cultural heritage14.811.13.770.4
Total 30.09.18.852.1
Table 8. Proposed conservation and management actions aimed directly at flagship species (Ardeidae) and indirectly at promoting biodiversity and providing cultural ecosystem services to wetland visitors (King’s Lagoon).
Fields of ActionObjectivesConservation Actions
HabitatCreate uneven-aged environmental mosaicsManaging vegetation for the maintenance of ecological corridors and ecotone
Feeding resourcesGuarantee adequate water levels for feeding behaviorCreating or maintaining shallow water zones (30–50 cm)
Creating and/or maintaining the gradual transition between aquatic and terrestrial areas
Guarantee adequate aquatic and marsh vegetationIncreasing the distribution of floating hydrophytes (e.g., Lemna minor)
Managing reedbeds to prevent the rapid accumulation of sediment (they should be maintained over 30 to 70 percent of the submerged area)
Guarantee healthy populations of fish, amphibians and aquatic invertebratesManaging water quality by reducing runoff and preventing nutrient over-enrichment through sustainable agricultural practices (e.g., regenerative agriculture)
Increase fish density [84]Laying of dead trees, submerged stumps, and wood to encourage fish reproduction and fry growth [82]
Breeding and nesting resourcesProvide adequate conditions for nestingPlanting trees
Positioning wooden artificial platforms [83]
Human disturbanceIncrease reproductive successCreating buffer zones of dense vegetation around nesting sites
Limiting and/or regulating visitors’ access
PredationIncrease reproductive successCreating buffer zones of dense vegetation around nesting sites
Disclaimer/Publisher’s Note: The statements, opinions and data contained in all publications are solely those of the individual author(s) and contributor(s) and not of MDPI and/or the editor(s). MDPI and/or the editor(s) disclaim responsibility for any injury to people or property resulting from any ideas, methods, instructions or products referred to in the content.

