Article

Analysis of the Morphological Characteristics of PM2.5 and Its Microbiological Composition in a Fattening Pig House

1
Chongqing Academy of Animal Sciences, Chongqing 402460, China
2
National Center of Technology Innovation for Pigs, Chongqing 402460, China
3
Agro-Environmental Protection Institute, Ministry of Agriculture and Rural Affairs, Tianjin 300191, China
*
Authors to whom correspondence should be addressed.
Sustainability 2024, 16(23), 10249; https://doi.org/10.3390/su162310249
Submission received: 22 October 2024 / Revised: 20 November 2024 / Accepted: 20 November 2024 / Published: 23 November 2024
(This article belongs to the Section Waste and Recycling)

Abstract

:
Particulate matter (PM2.5) in pig houses and the microorganisms in PM2.5 restrict the sustainable development of the pig industry and have a negative influence on environmental sustainability. This study aimed to investigate the morphological characteristics and diel microbial composition of PM2.5 in fattening pig sheds and explore how changes in the diel microbial composition of PM2.5 correlate with environmental factors and sources. To this end, environmental data from a fattening pig house were monitored, and PM2.5, feed, and faecal particles were examined using electron microscopy. Additionally, the bacterial and fungal assemblages contained in PM2.5 were analysed using 16S and 18S rRNA gene sequencing, respectively. The results showed that NH3, CO2, temperature, and relative humidity were significantly higher at night than during the day. PM2.5 particles from the fattening pig house exhibited different morphologies such as spherical, flocculent, and chain structures. The microbial diversity and bacterial assemblage showed significant variations, which were related to diel environmental factors in the fattening house. In addition, faeces may be the main source of airborne bacteria and feed may be the main source of airborne fungi in fattening houses. These findings provide a scientific basis for exploring the potential risks of the morphological characteristics of PM2.5 and its microbial composition to human and animal health. Additionally, they contribute to the sustainable development of the pig industry and the protection of the environment.

1. Introduction

With the increasing intensification of pig farming, the high-density and intensive farming mode of large-scale pig farms has exacerbated air quality problems in pig houses [1]. In particular, the large amount of particulate matter (PM) produced during pig farming poses a significant threat to the health of staff and animals in the houses [2]. PM is a general term for all small solid and liquid particles suspended in a gaseous medium, and it is a mixture that carries multiple pollutants concurrently. Based on aerodynamic equivalent diameter, PM is usually classified into three main categories: total suspended particulate matter (TSP, diameter ≤ 100 μm), respirable particulate matter (PM10, diameter ≤ 10 μm), and fine particulate matter (PM2.5, diameter ≤ 2.5 μm). Among them, PM2.5 is the most harmful to the human body due to its small size and large surface area, its ability to absorb a large number of harmful substances and microorganisms, and its ability to enter the alveoli and blood circulation through respiration [3]. Studies have shown that if the human body is exposed to high concentrations of PM2.5 for an extended period of time, it can lead to a variety of illnesses [4], including chronic obstructive pulmonary disease (COPD) [5], impaired lung function [6], asthma [7], and lung cancer [8]. Therefore, PM2.5 in pig houses is not conducive to the sustainable development of the pig industry, and a comprehensive and in-depth study of it is of great significance to both the risk assessment of PM2.5 and the sustainable development of the pig industry.
Unlike the atmospheric environment, there are abundant sources of particulate matter in piggeries, including faeces, urine, feed, skin, and hair [9,10]. As a result, the particulate matter in piggeries varies in microscopic morphology, such as elliptical particles, smooth spherical particles, grape-shaped particles, and particles with edges and corners [11]. Moreover, the concentration of particulate matter in piggeries is 10–100 times higher than that in the atmospheric environment, and it often carries a wide range of harmful gases, such as NH3 and H2S, along with a significant load of microorganisms that contain potential pathogens or allergens [12,13]. A variety of airborne microbial pathogens and allergens have been found in swine farms, including Salmonella, Staphylococcus, Fusobacterium inducens, Bacillus cereus, and Staphylococcus aureus [14,15]. In addition, aerosols in swine farms that carry pathogenic microorganisms can be transported over great distances [16,17]. For example, Dee et al. [18] detected porcine Mycoplasma pneumoniae DNA in air samples collected 4.7 km from a swine farm. Therefore, microorganisms in PM2.5 from pig houses could pose a public health risk, making studies on the microbial composition of pig houses highly essential. Previous studies have shown that the abundance and composition of microorganisms are influenced by a variety of factors, including environmental factors, seasonal variations, human activities, and pollutant sources [19,20,21]. Therefore, understanding the effects of environmental factors on airborne microorganisms is critical for assessing the magnitude of their health risks.
There are limited studies on the morphology and microbial composition of PM2.5 in pig houses. In this study, we investigated the morphological characteristics and diel microbial composition of PM2.5 in a fattening pig house and assessed their correlation with environmental factors. This study aimed to reveal the morphological characteristics and microbial composition of PM2.5 in fattening pig sheds and provide theoretical support for mitigating the risks of air pollution in pig sheds, which is conducive to the sustainable development of the pig industry.

2. Materials and Methods

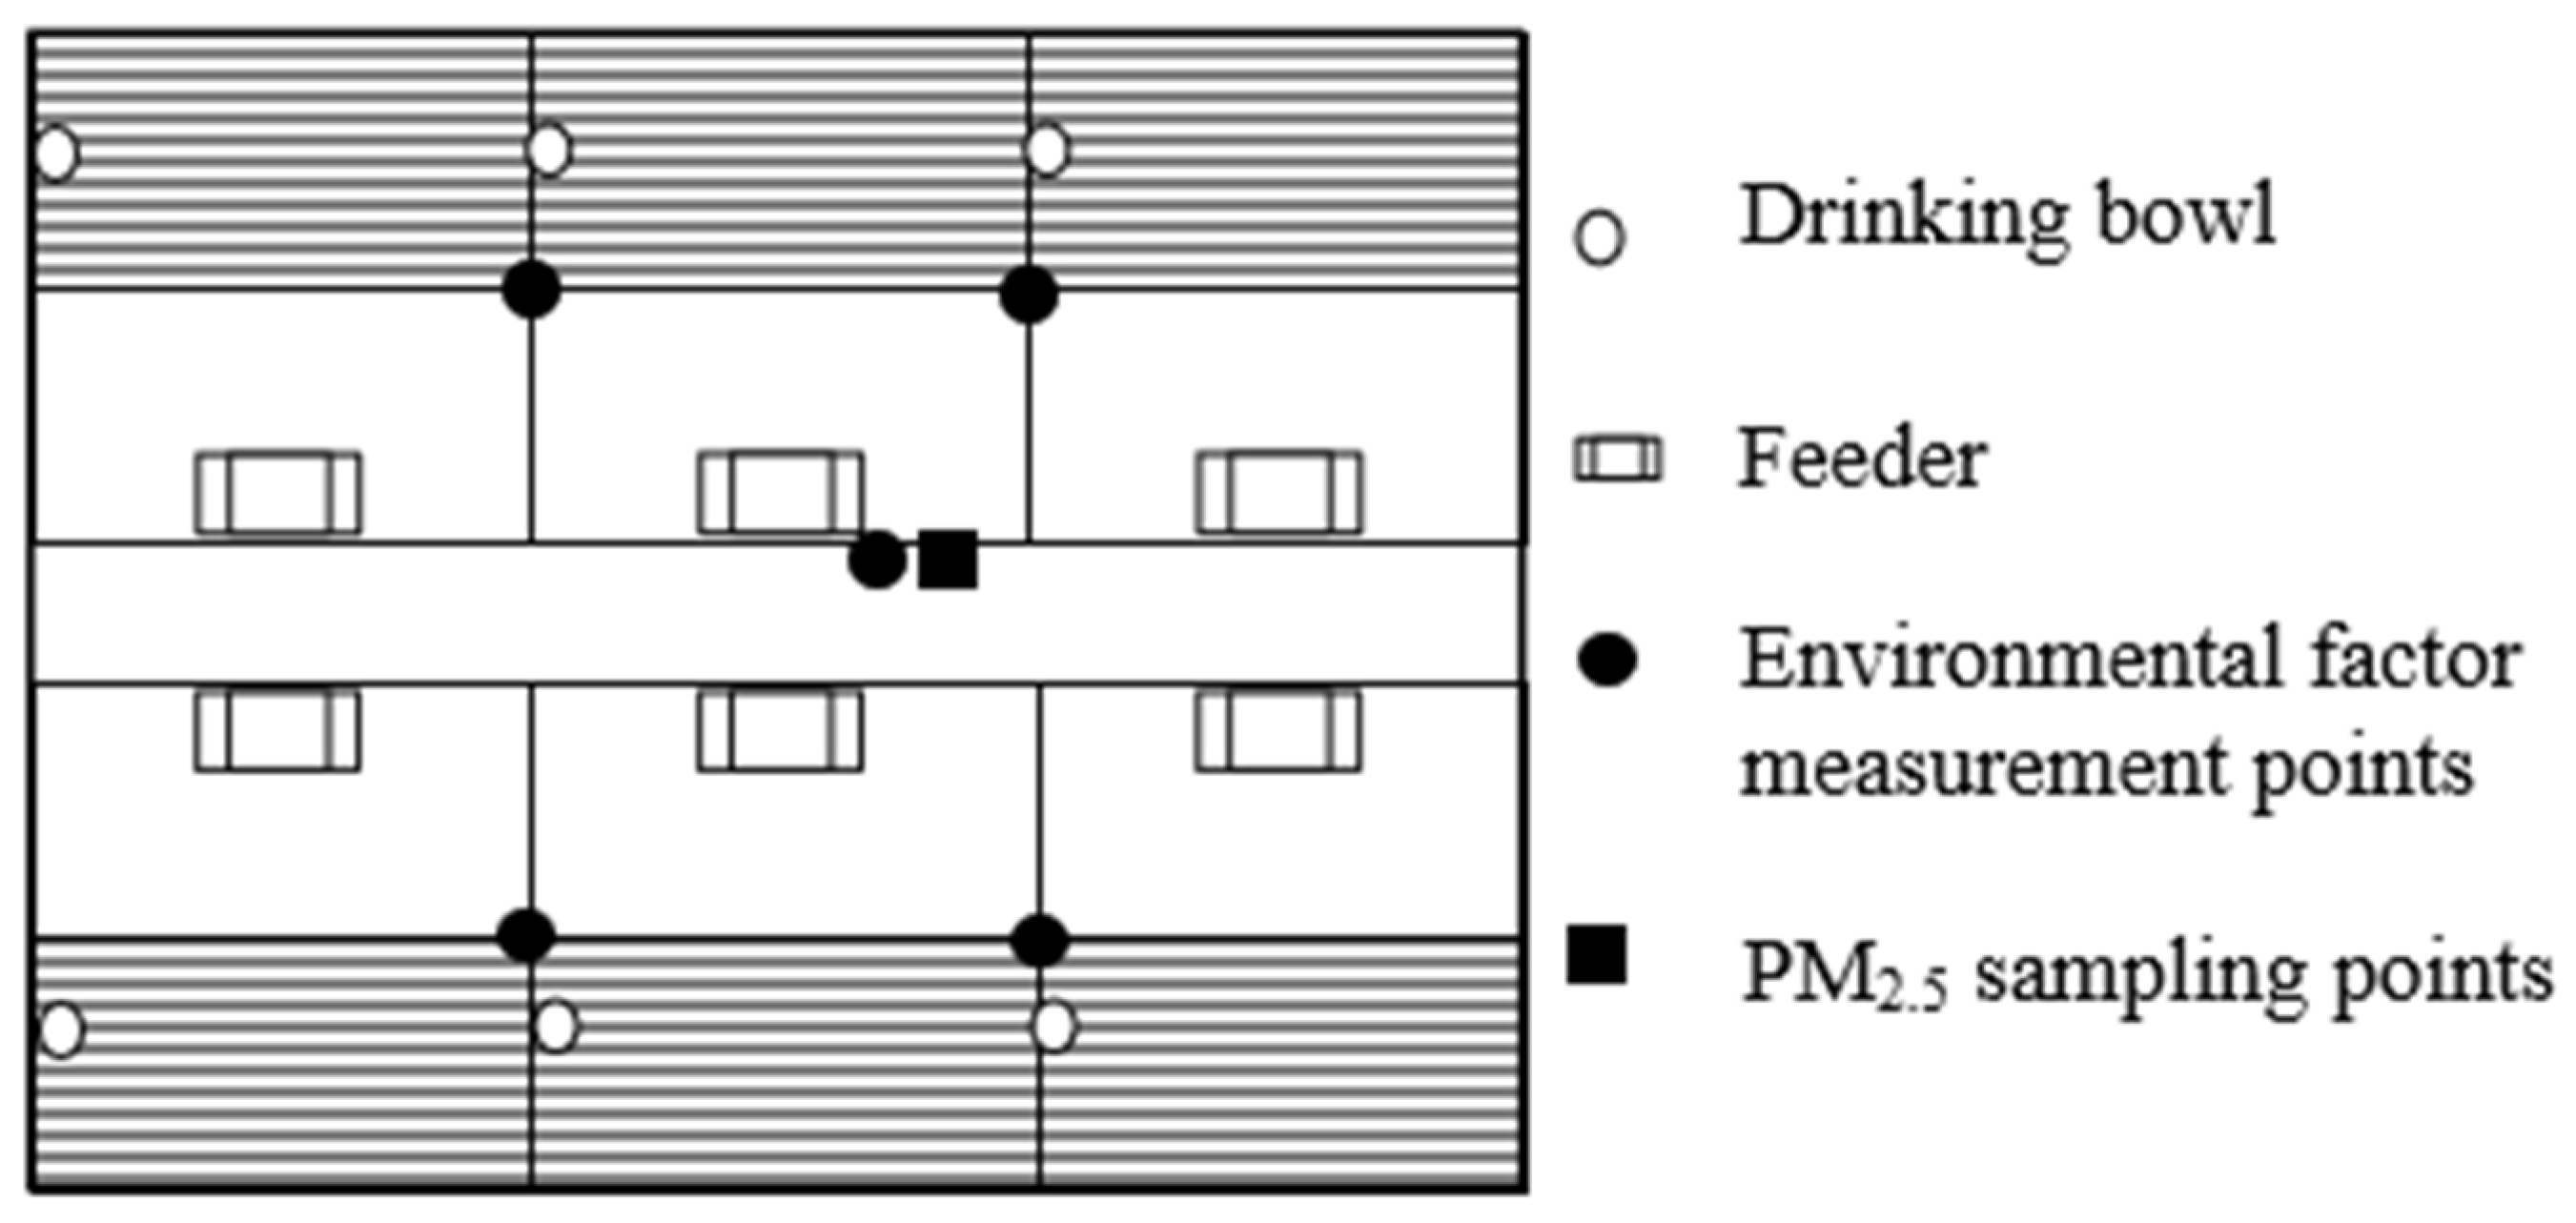
2.1. Condition of Pig Housing and Feeding Management

This study was conducted in a fattening house at a pig farm in Chongqing, China. The house consisted of 6 pens (each measuring 3.08 m long, 1.94 m wide and 1 m high) with a 1.5 m wide aisle in the middle. Four exhaust fans were used for ventilation. The fattening house was cleaned and disinfected before this study, and 24 Duroc × Landrace × Yorkshire (DLY) pigs, with an average body weight of 27.59 ± 1.33 kg, were housed in the facility. The pigs were fed from 19 July 2023 to 19 November 2023, and this experiment was conducted from 1 to 7 September 2023. During the study period, all pigs were hand-fed daily at 09:00 and 15:00 with a commercial pelleted dry feed. The test pigs were immunised as per routine, provided with ad libitum access to both feed and water, and manure was removed regularly.

2.2. Measurement of Microclimate Variables and PM2.5 Collection in the Pig House

The temperature and humidity in the pig house were monitored using sensors (U23-001, Onset, Bourne, MA, USA) that recorded data every 30 min. An ammonia sensor (RS485, Shandong Renke Measurement and Control Technology Co., Ltd., Jinan, China), TSP sensor (RS485, Shandong Renke Measurement and Control Technology Co., Ltd., Jinan, China), carbon dioxide sensor (RS485, Shandong Renke Measurement and Control Technology Co., Ltd., Jinan, China), and wind speed sensor (RS485, Shandong Renke Measurement and Control Technology Co., Ltd., Jinan, China) from Shandong Renke Measurement and Control Technology Co., Ltd. were used to monitor the ammonia, TSP, carbon dioxide concentration, and wind speed in the house, and the recordings were taken every minute. PM2.5 samples were collected using quartz filter membranes (MK360, 90 mm) and an ambient air particulate collector (2030 type medium flow intelligent TSP sampler, Qingdao Laoshan Institute of Applied Technology, Qingdao, China). Before sampling, the filter membrane was wrapped with aluminium foil and heated in a muffle furnace at 500 °C for 5 h to remove organic matter and other impurities. During sampling, the flow rate of the sampler was set at 100 L/min, and the filter membranes were replaced according to the sampling time schedule. The sampling time periods were divided into three intervals: all day (0:00–24:00), daytime (8:00–20:00), and nighttime (20:00–8:00). After collection, the filter membrane samples were immediately wrapped in sterile aluminium foil and stored at −20 °C within half a day (or at −80 °C for long-term storage). The locations of the monitoring sites for the above indicators are shown in Figure 1, with a monitoring height of 1.5 m.

2.3. Micro-Morphological Analysis of PM2.5 Samples

The PM2.5 filter membrane was cut into 1 cm2 pieces and directly pasted onto a metal post with conductive adhesive. After coating with about 20 nm of gold, its morphology was observed using a scanning electron microscope ([SEM] Hitachi, Tokyo, Japan).

2.4. DNA Extraction and Bacterial/Fungal Sequencing

Total DNA was extracted from the samples using a gene extraction kit (Biomarker Soil Genomic DNA kit, RK02005). Bacterial DNA was amplified using the universal primers 338F (5-ACTCCTACGGGGAGGCAGCAG-3) and 806R (5-GGACTACHVGGGTWTCTAAT-3), while fungal DNA was amplified using the universal primers ITS1F (5-CTTGGTCATTTAGAGGAAGTAA-3) and ITS2R (5-GCTGCGTTCTTCATCGATGC-3). The PCR amplification system consisted of 2 × Pro Taq 10 μL, Forward Primer (5 μM) 0.8 μL, Reverse Primer (5 μM) 0.8 μL, and Template DNA 10 ng/μL and was brought to a final volume of 20 μL with ddH2O.
The bacterial amplification procedure was as follows: pre-denaturation at 95 °C for 3 min; denaturation at 95 °C for 30 s, annealing at 53 °C for 30 s, annealing at 53 °C for 30 s, extension at 72 °C for 45 s, repeated for a total of 29 cycles; final extension at 72 °C for 10 min, followed by holding at 10 °C until termination. The fungal amplification procedure was as follows: pre-denaturation at 95 °C for 3 min; denaturation at 95 °C for 30 s, annealing at 55 °C for 30 s, and extension at 72 °C for 45 s, for a total of 35 cycles; and final extension at 72 °C for 10 min, followed by holding at 10 °C until termination.
After PCR amplification, the products were purified (PCR Clean-Up Kit, YuHua, Shanghai, China), quantified (Qubit 4.0, Thermo Fisher Scientific, Waltham, MA, USA), and homogenised for library preparation and sequencing (Illumina Nextseq2000 platform, Illumina, CA, USA). Following sample demultiplexing of the obtained PE reads, quality control and filtering were applied to the pair-end reads based on sequencing quality. Pair-ended reads were merged according to their overlap, resulting in optimised data. The optimised data were then further processed using sequence denoising methods (such as DADA2 or Deblur) to obtain ASV (Amplicon Sequence Variant) representative sequences and abundance information.

2.5. Data Analysis

The environmental monitoring data of the pig house were plotted by Origin 2018 (OriginLab, Northampton, MA, USA) software, and the data were analysed by one-way ANOVA using SPSS 26 (IBM, Chicago, IL, USA), with p < 0.05 indicating a significant difference and p < 0.01 indicating a highly significant difference. The microscopic morphology images of the PM2.5 samples were assembled using Adobe Photoshop 2020 (Adobe, CA, USA). In addition, community richness (ACE and Chao1) and diversity indices (Shannon and Simpson) were calculated using Mothur (version 1.30.2, https://mothur.org/wiki/calculators/, accessed on 18 November 2024) software, a beta diversity distance matrix was calculated using Qiime software, and microbial community composition abundance was analysed by Python (version 2.7 https://www.python.org/, accessed on 18 November 2024) software. Redundancy Analysis (RDA) was conducted using the vegan package in R (version 2.4.3, https://cran.r-project.org/, accessed on 18 November 2024) to assess the effects of environmental factors on microbial community composition in the pig house, with visualisations also created in R (version 3.3.1).

3. Results

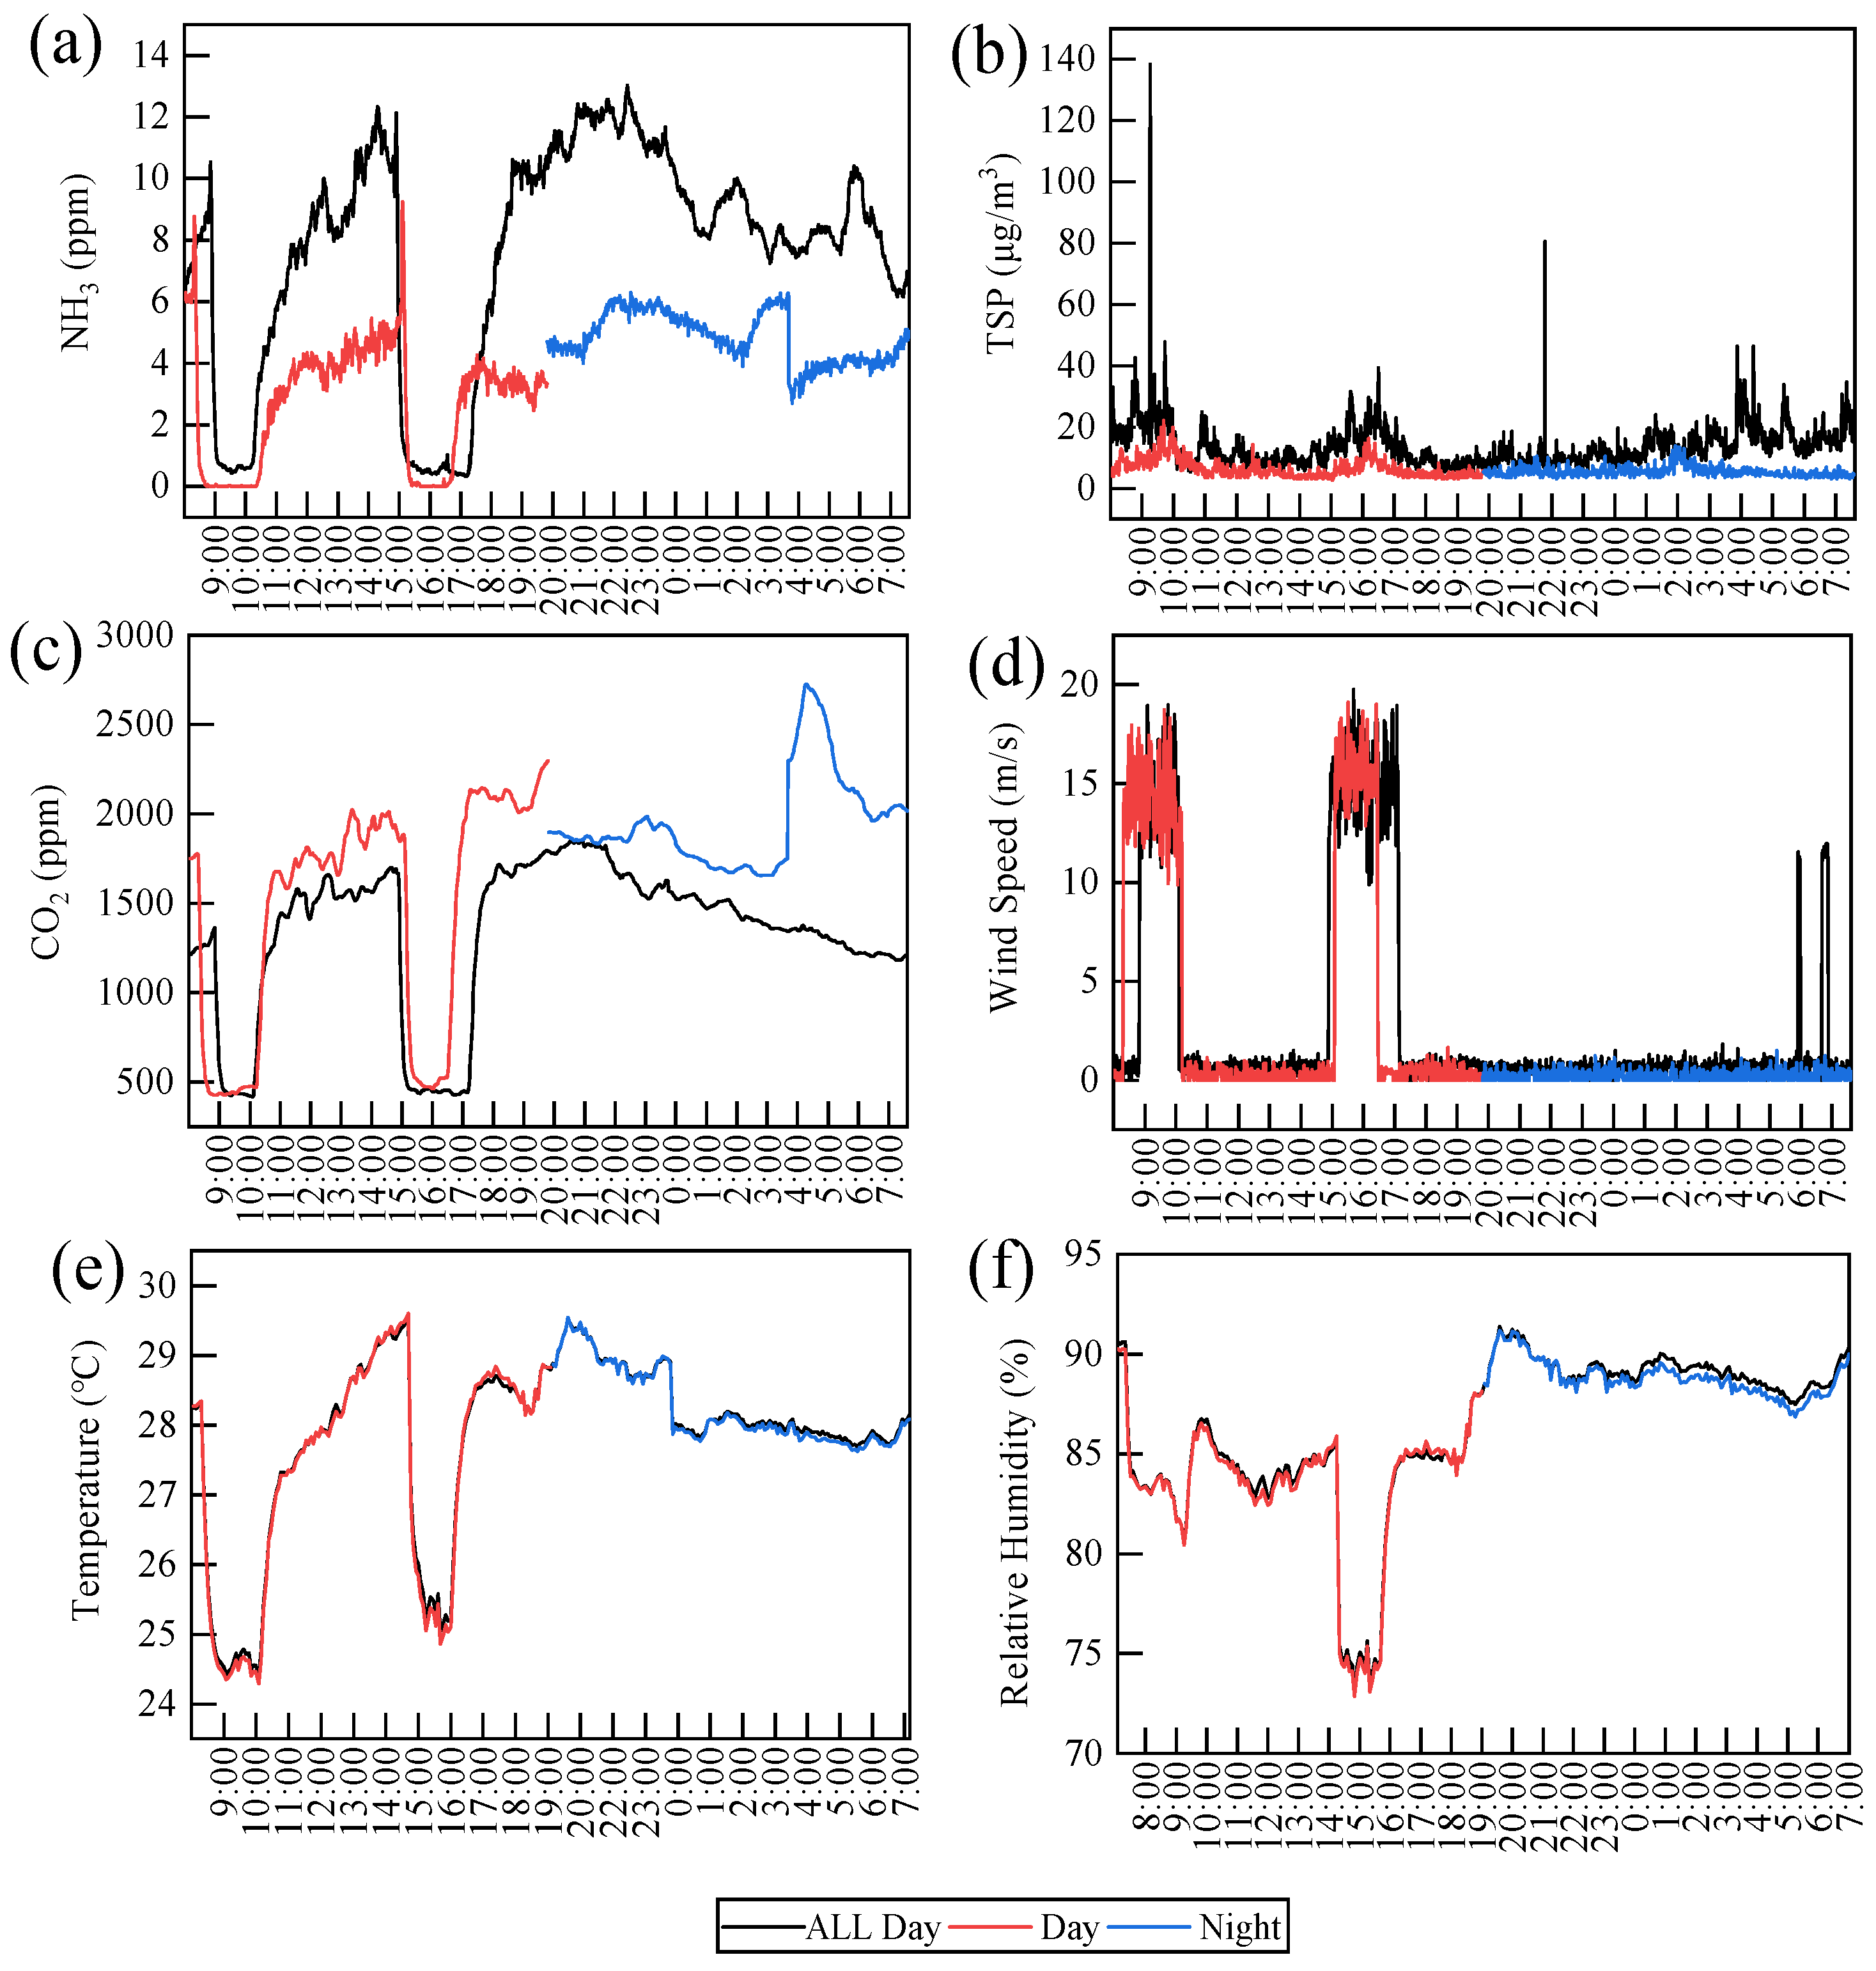
3.1. Microclimate Variables in the Pig House

The 24 h variations in the environmental indicators, including NH3, TSP, CO2, wind speed, relative humidity, and temperature in the fattening pig house are shown in Figure 2. At 9:00 and 15:00, the NH3 concentration, CO2 concentration, temperature, and relative humidity plummeted, while the TSP concentration and wind speed increased. The NH3 concentration was significantly higher at night compared to daytime (p < 0.01), as was the CO2 concentration (p < 0.01). Conversely, the wind speed was significantly lower at night compared to daytime (p < 0.05), while the relative humidity was significantly higher at night (p < 0.05). The temperature was significantly higher at night than during the day (p < 0.01), while the TSP concentration did not show a significant difference between day and night (p > 0.05).

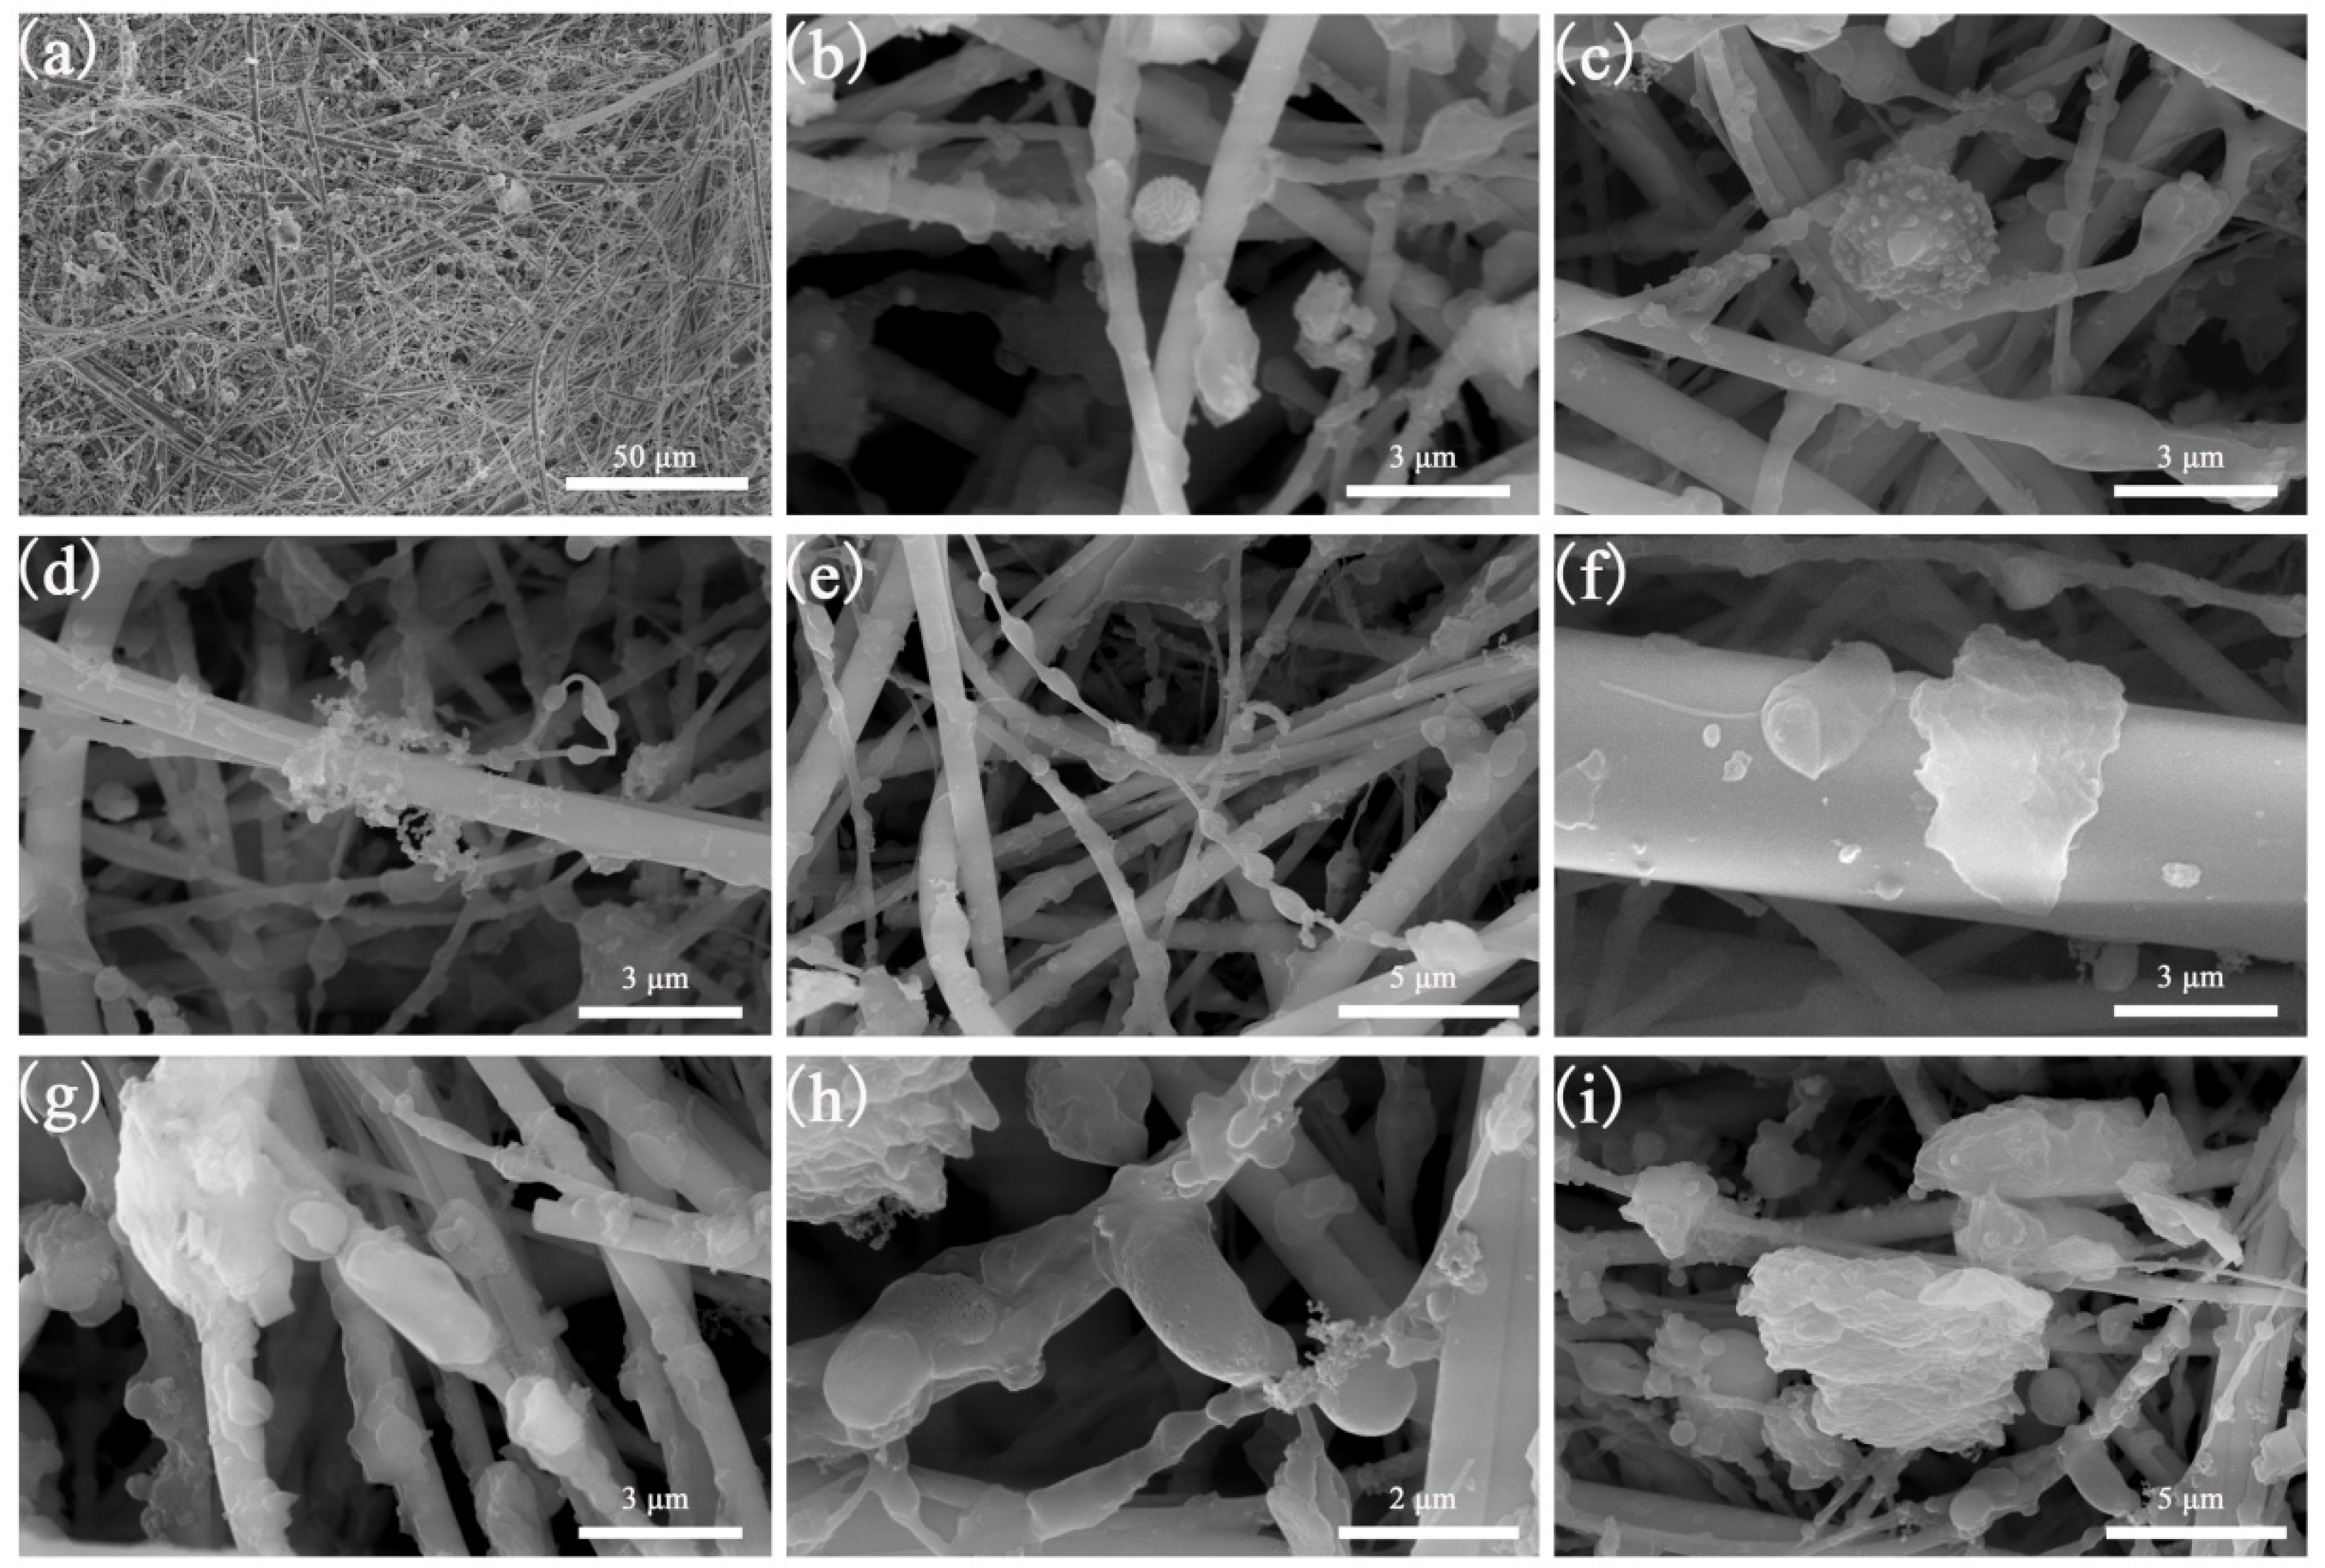
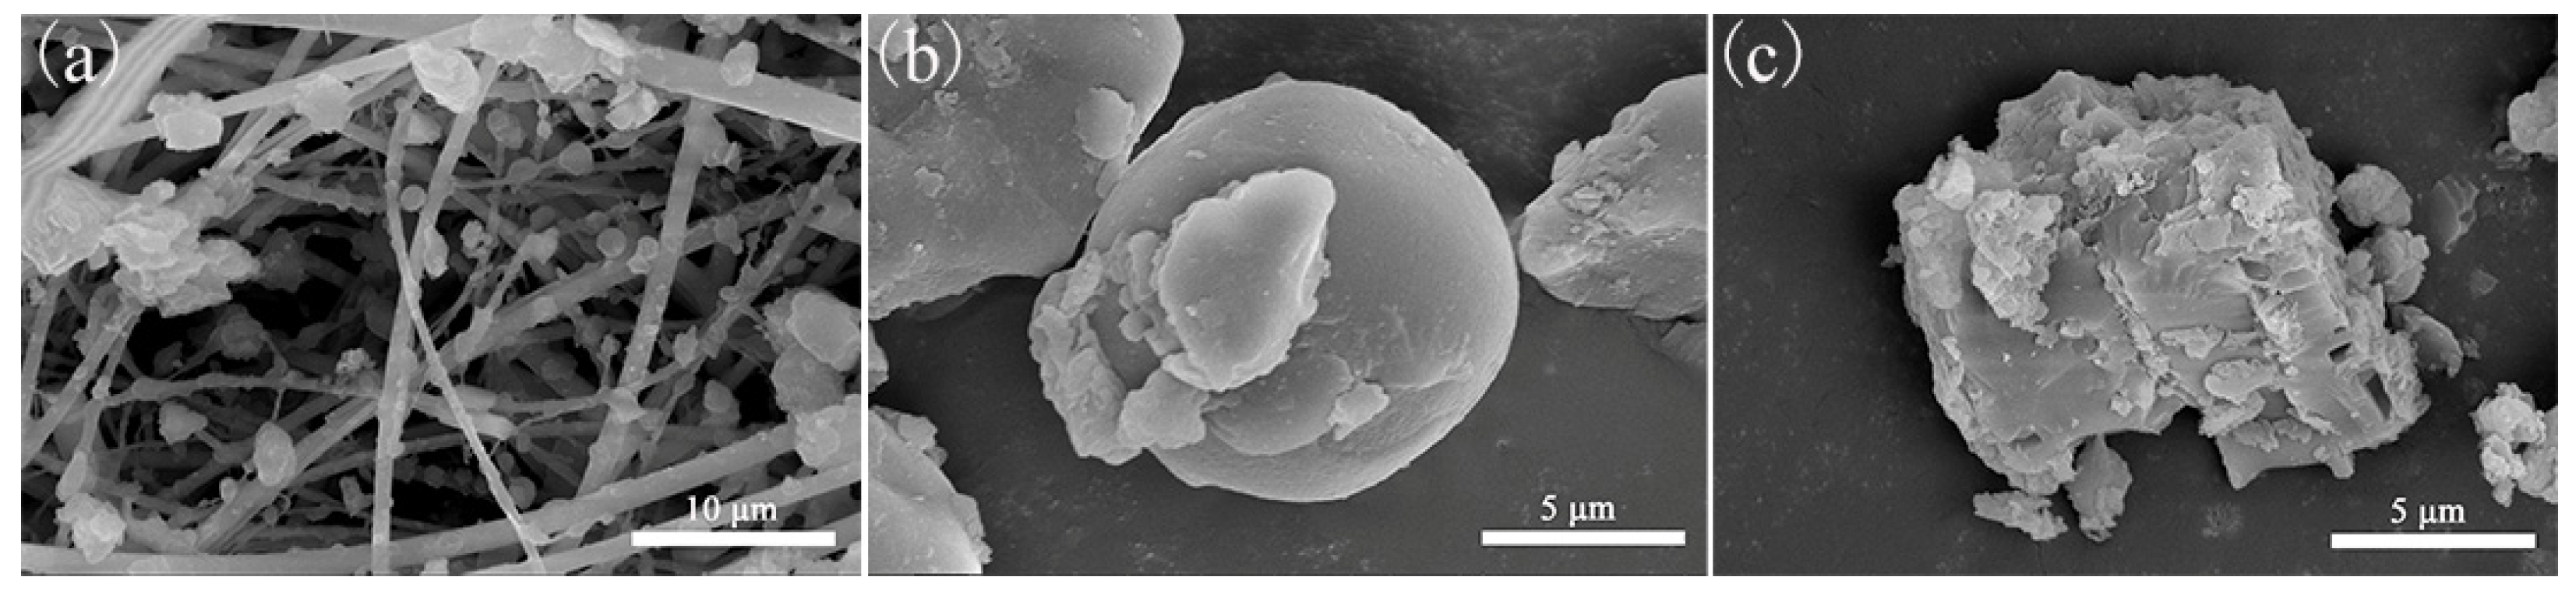
3.2. Analysis of Microscopic Morphology of PM2.5

Scanning electron microscopy (SEM) revealed that the airborne PM2.5 particles in the fattening house were of different microscopic morphologies, which could be divided into six categories: spherical particles, flocculent particles, chain-like particles, flaky particles, rod-shaped particles, and particles of other shapes (Figure 3). Spherical particles were further divided into those with smooth surfaces and those with rough surfaces, with diameters of 1–2 μm and 2–3 μm, respectively. Flocculent particles had a relatively loose structure, with diameters ranging from 4 to 6 μm. Chain-like particles were formed when multiple particles, about 1 μm in size, were connected to form a thread-like particle in series. Flaky particles were subdivided into lamellar particles and massive particles with a particle size of 3–5 μm, and the lamellar particles were thinner than the massive particles. Rod-shaped particles were less common in the observed field, with sizes ranging from 1 to 2 μm. Finally, irregular particles were classified as “particles of other shapes”.
After crushing the feed and faecal samples from the pig house and observing them by scanning electron microscopy, the feed particles appeared spherical, lumpy, or irregularly shaped, while the faecal particles were irregular with rough surfaces (Figure 4).

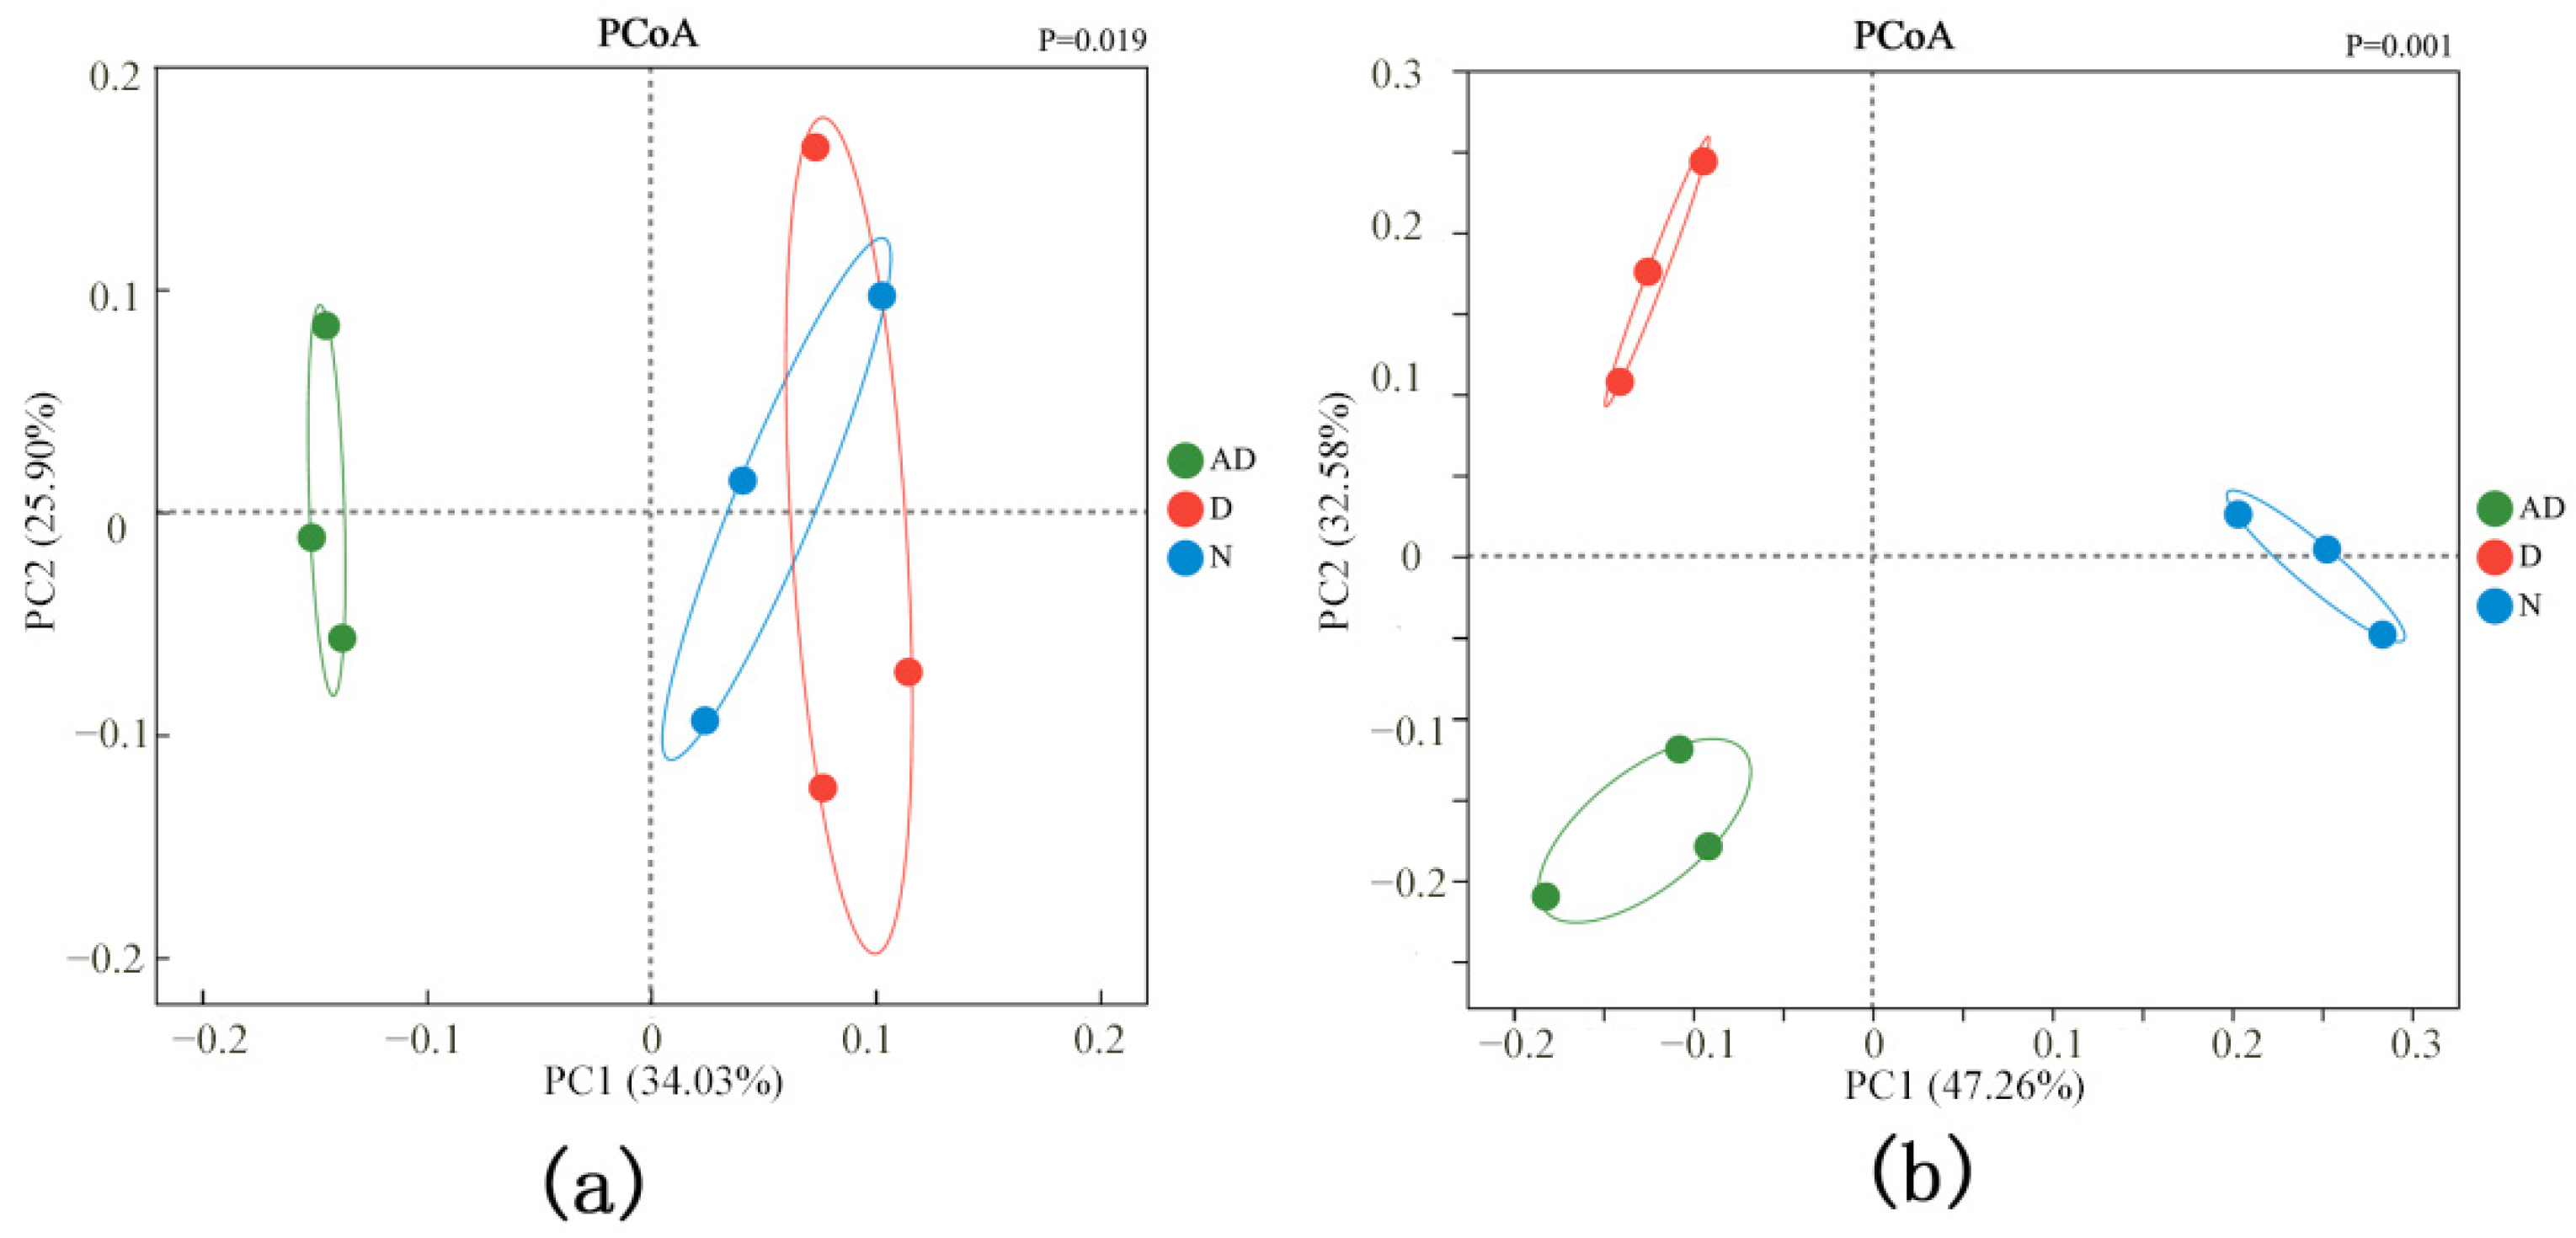
3.3. Analysis of Microbial Diversity in PM2.5

The abundance (ACE index and Chao1 index) and diversity (Simpson index and Shannon index) of microbial communities were assessed by comparing the alpha diversity of bacteria and fungi in the day and night PM2.5 samples from the pig house. For bacteria, the ACE index, Chao1 index, and Shannon index were significantly higher at night than during the day (p < 0.05), whereas there was no significant difference in the Simpson index between the day and night PM2.5 samples (p > 0.05) (Table 1). However, for fungi, the alpha diversity (ACE index, Chao1 index, Shannon index, Simpson index) of the day and night PM2.5 samples from the pig house were not significantly different (p > 0.05) (Table 2).
Principal Coordinate Analysis (PCoA) was used to analyse the β-diversity of bacteria and fungi in the day and night PM2.5 samples from the pig house (Figure 5). In terms of bacterial composition, there was no significant separation between the daytime and nighttime PM2.5 samples, indicating little diurnal variation in the structure of bacterial flora. In terms of fungal composition, the fungal flora of the PM2.5 samples were completely segregated between daytime and nighttime, indicating greater diurnal variation in the structure of fungal flora.

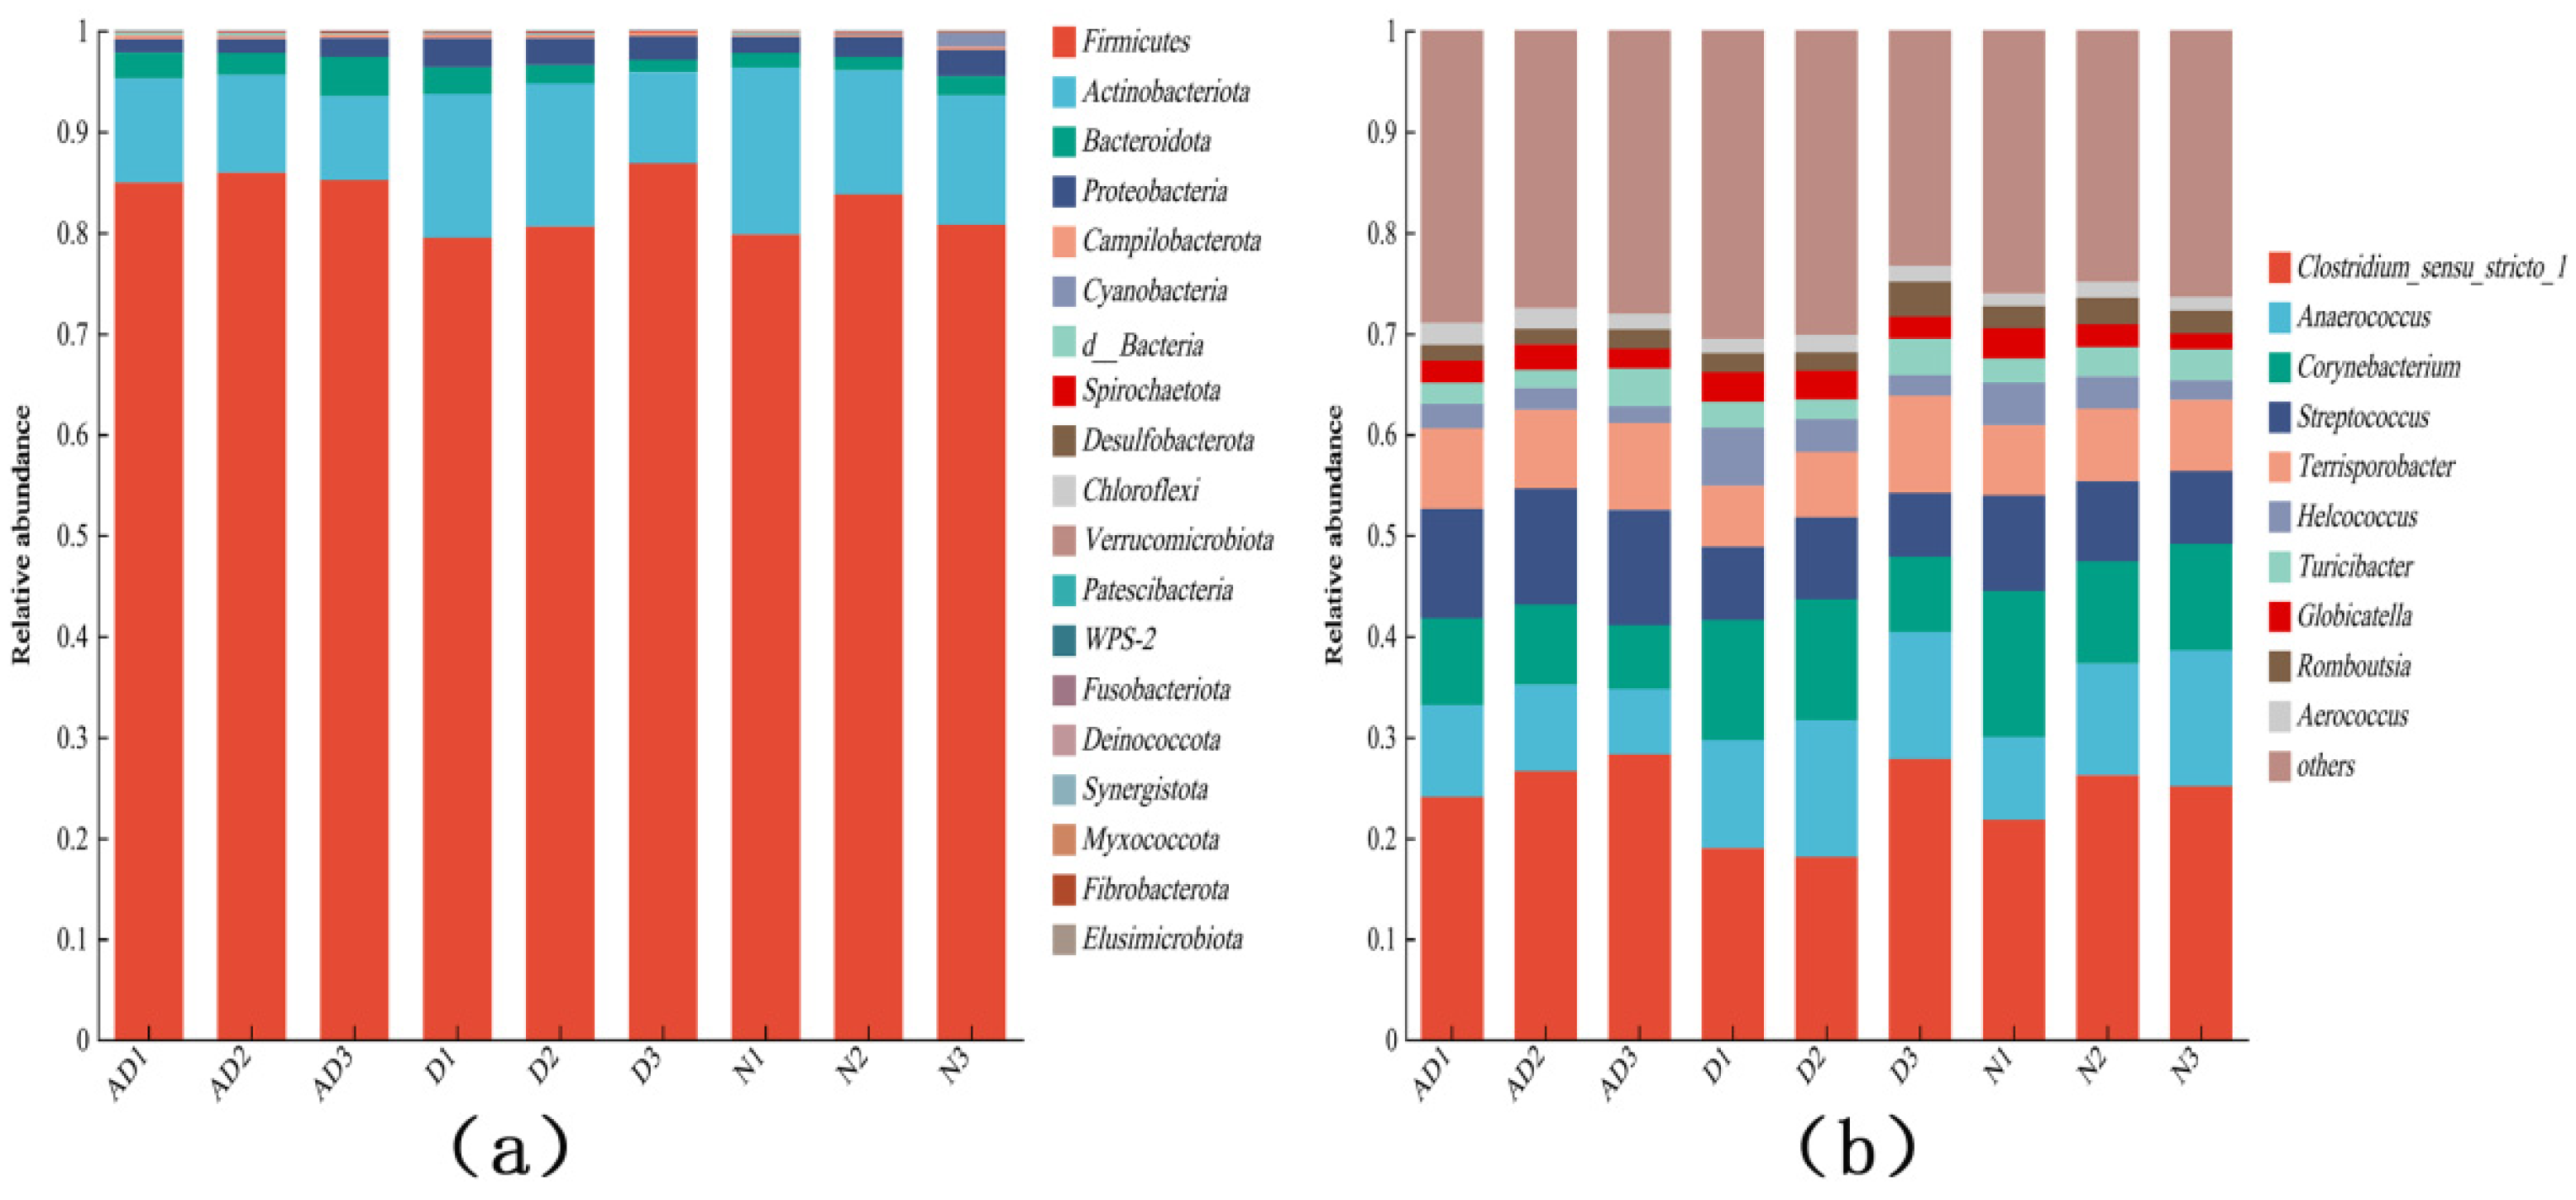
3.4. Analysis of Microbiological Composition in PM2.5

A total of 19 phylum- and 595 genus-level bacteria were identified in the PM2.5 bacterial samples (Figure 6). At the phylum level, Firmicutes had the highest abundance among all the samples, followed by Actinobacteriota and Bacteroidota, with relative shares of their abundance ranging from 79.44 to 86.82%, 8.32 to 16.54%, and 1.27 to 3.88%, respectively. There was no significant difference (p > 0.05) between the top three gate-level bacteria in terms of abundance in the pig house diurnal PM2.5 samples. At the genus level, the five most abundant genera were Clostridium_sensu_stricto_1 (18.06–28.29%), Anaerococcus (6.45–13.61%), Corynebacterium (6.32–11.93%), Streptococcus (6.31–11.49%), and Terrisporobacter (6.04–9.70%). There were no significant differences (p > 0.05) in the abundance of these top five genera between the day and night PM2.5 from the piggery.
A total of five phylum- and 571 genus-level fungi were identified in the PM2.5 fungal samples (Figure 7). At the phylum level, the combined abundance of Ascomycota (51.04–93.92%) and Basidiomycota (5.27–43.55%) accounted for more than 90% of all the samples. The relative abundance of Ascomycota in the day and night PM2.5 samples from the pig house accounted for 91.69–93.92% and 51.04–56.29%, respectively, and the relative abundance of Ascomycota in the night PM2.5 samples was significantly lower than that in the daytime PM2.5 samples (p < 0.05). The relative abundance of Basidiomycota in the day and night PM2.5 samples from the piggery ranged from 5.27 to 7.40% and 37.49 to 43.55%, respectively, and the relative abundance of Basidiomycota in the PM2.5 samples at night was significantly higher than that in the PM2.5 samples during the day (p < 0.05). At the genus level, the three most abundant genera were Aspergillus (41.58–88.97%), Cladosporium (0.83–6.78%), and Nigroporus (0.24–7.95%). The relative abundance of Aspergillus spp. in the day and night PM2.5 samples from the pig house ranged from 80.37 to 83.00% and 41.58 to 51.10%, respectively, and the relative abundance of Aspergillus spp. in the night PM2.5 samples was significantly lower than that in the daytime PM2.5 samples (p < 0.05). The relative abundance of Nigroporus spp. in the daytime and nighttime PM2.5 samples from the pig house ranged from 0.24 to 0.58% and 4.37 to 7.95%, respectively, and the relative abundance of Nigroporus spp. in the nighttime PM2.5 samples was significantly higher than that in the daytime PM2.5 samples (p < 0.05).

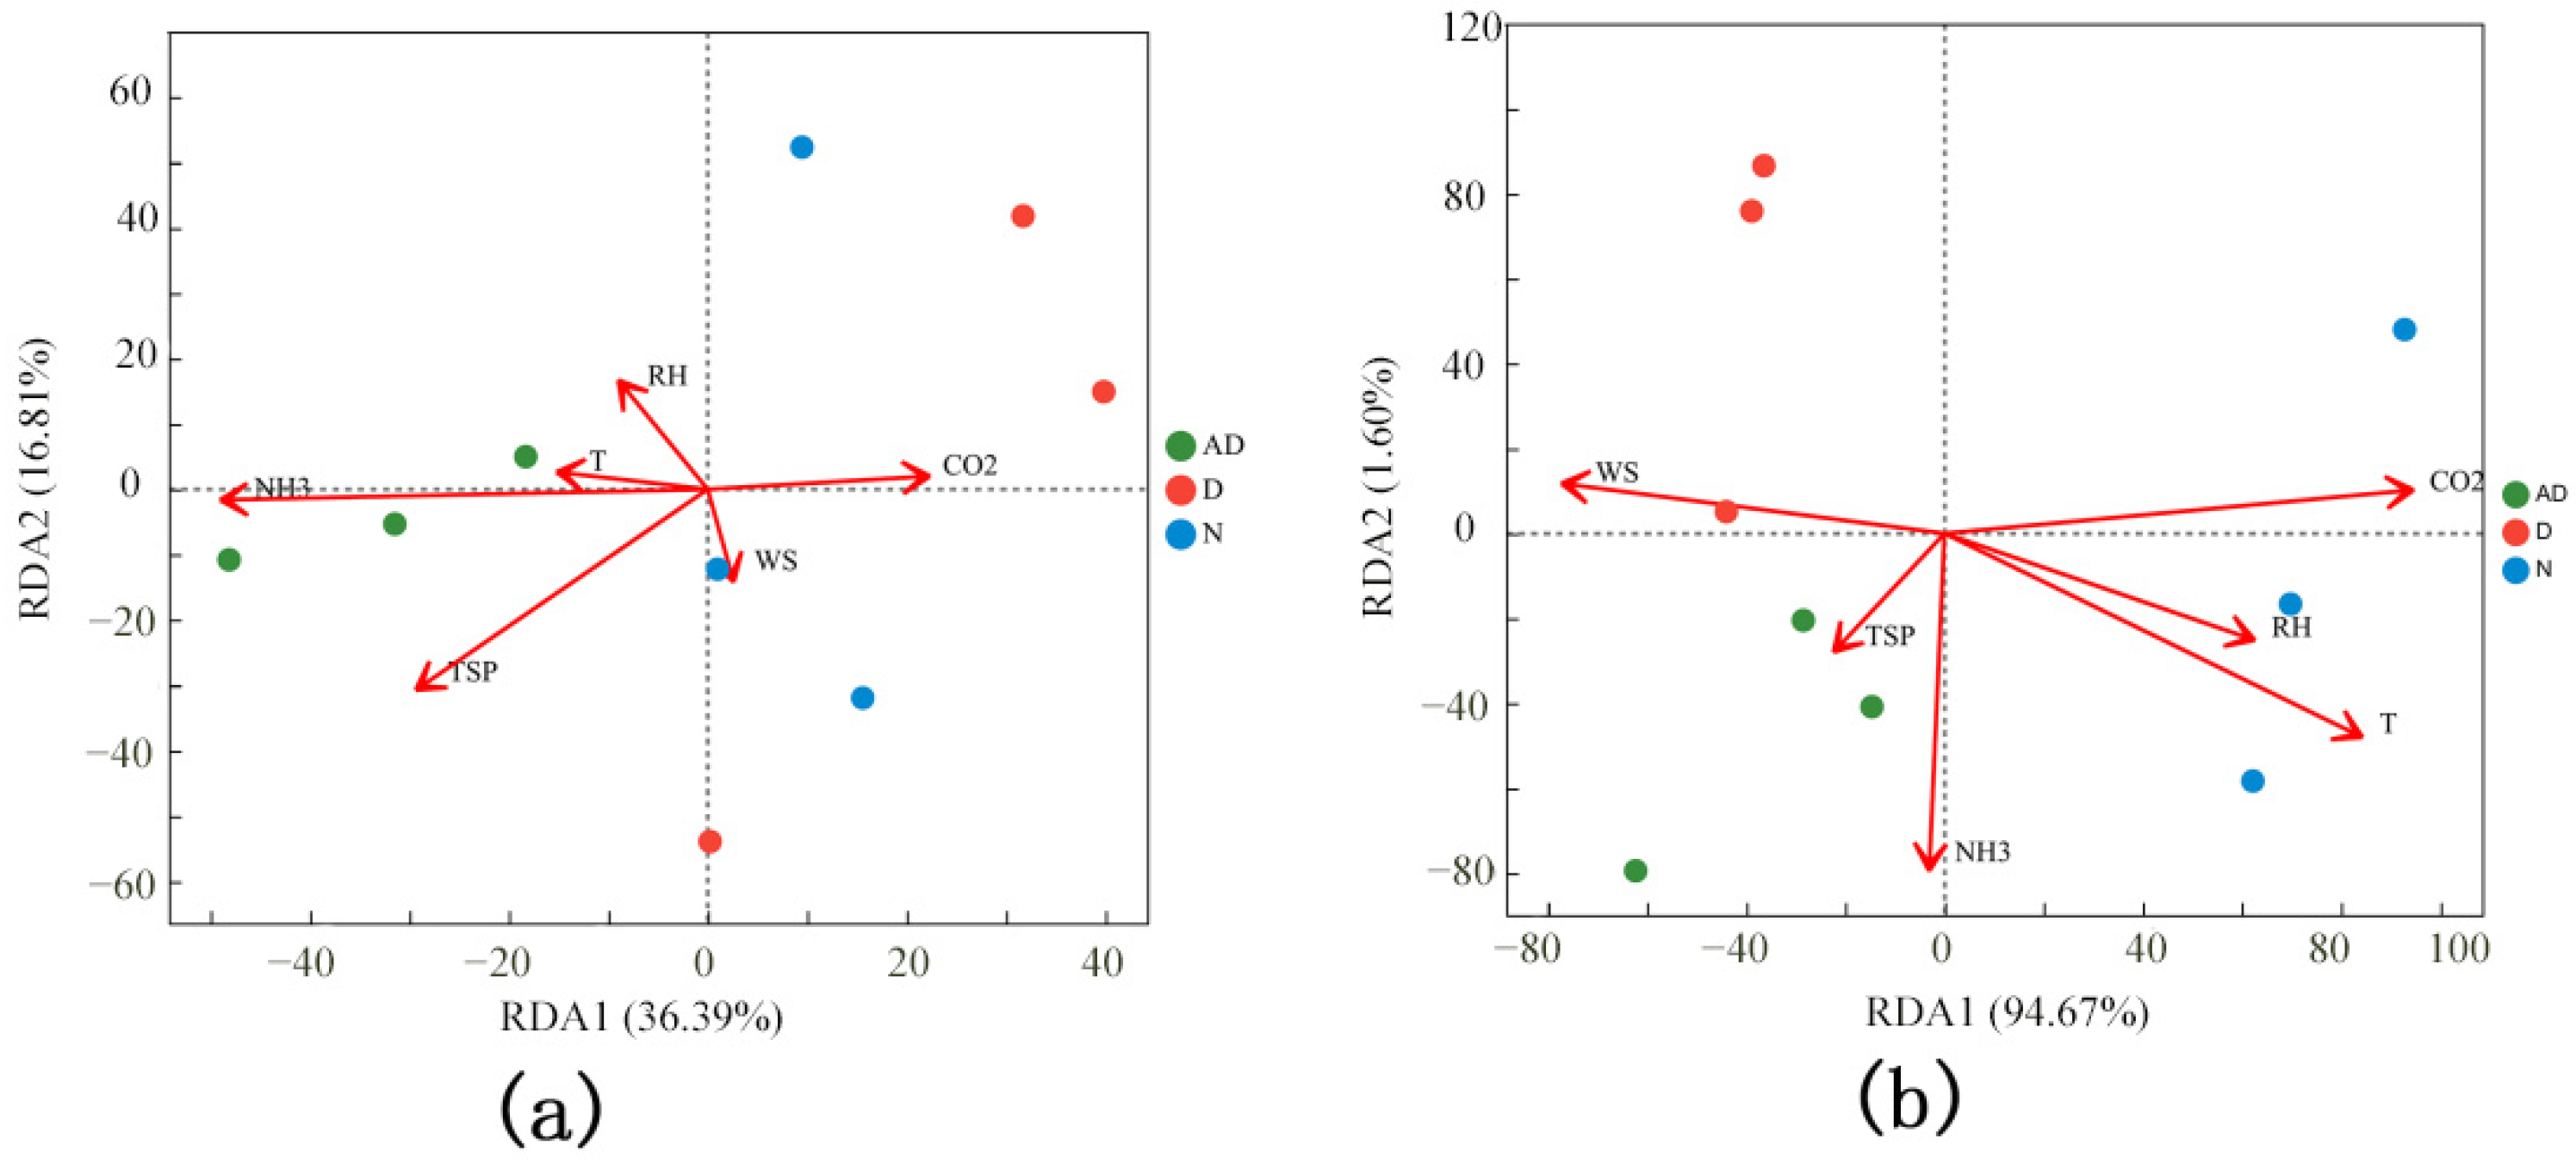
3.5. Correlation Analysis Between PM2.5 Microorganisms and Environmental Factors in the Pig House

The relationship between bacterial and fungal community composition and environmental factors in the PM2.5 samples (Figure 8). The results showed that 53.20% of the bacterial and 96.27% of the fungal flora composition changes could be attributed to the changes in environmental factors in the fattening house. For bacteria, the NH3 concentration had the strongest correlation with changes in the flora composition of the PM2.5 samples. For fungi, the CO2 concentration had the highest correlation with the PM2.5 sample colony composition. In addition, temperature and relative humidity also had a high correlation with the composition of the PM2.5 samples.

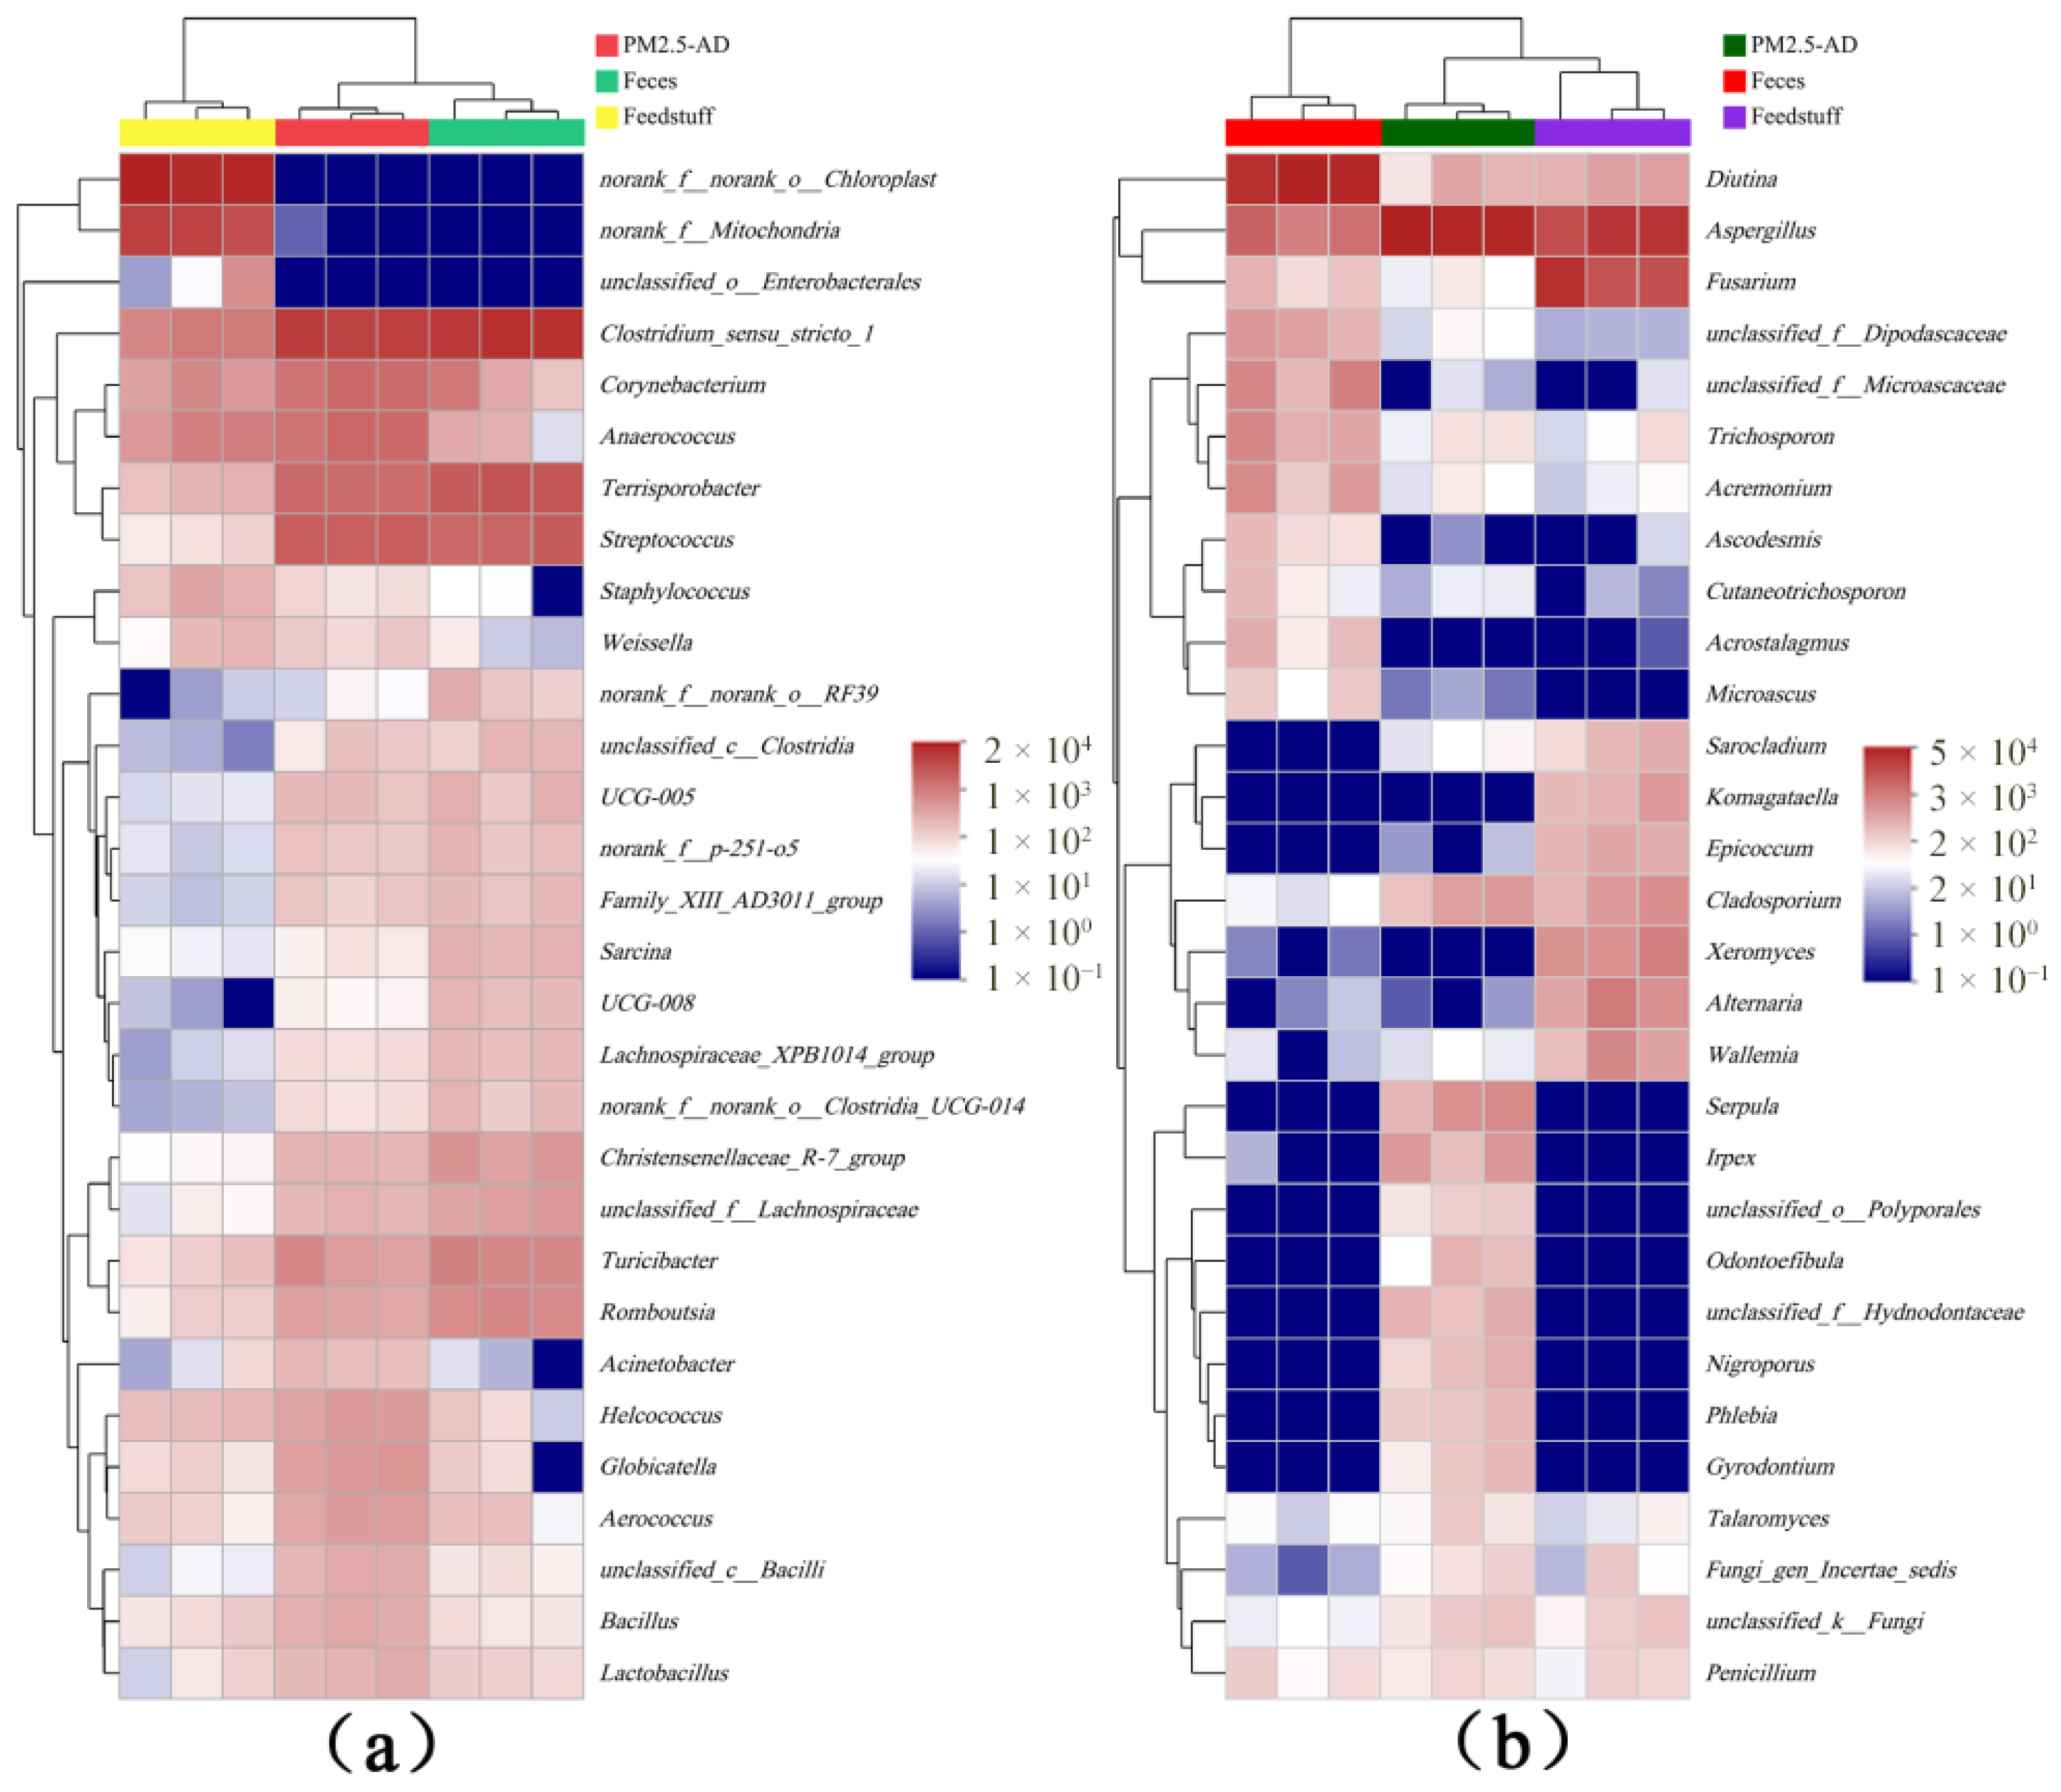
3.6. Correlation Analysis of PM2.5 Microorganisms with Feed and Faeces

Clustered heat maps were generated to assess the correlation between PM2.5 and bacteria and fungi in the feed and faecal samples (Figure 9). For the top 30 bacterial genera, the bacterial composition and abundance were more similar between the PM2.5 and faecal samples than between the PM2.5 and feed samples. Conversely, for the top 30 fungal genera, the fungal composition and abundance were more similar between the PM2.5 and feed samples than between the PM2.5 and faecal samples.

4. Discussion

In this study, it was observed that air PM2.5 particles in the fattening pig house showed different morphologies, including spherical, flocculent, and chain-like structures. The feed particles appeared spherical, lumpy, or irregularly shaped, while the faecal particles were irregular with rough surfaces. These observations align with those of previous studies [22,23]. Particles larger than PM10 in the pig house were mainly derived from feed particles, whereas particles smaller than PM10 were mainly derived from faecal particles [24]. Furthermore, PM2.5 particles changed their shapes due to abrasion during transfer and suspension, resulting in different morphologies [25]. In addition, the morphology of the particles was also affected by the moisture content, with smaller particles agglomerating and combining with larger particles when the particles had high moisture content [26]. The results of this study show that PM2.5 is a very important component in the air quality of the pig house.
There were significant diel variations in microbial diversity and flora structure in air PM2.5 in the fattening pig house, with higher bacterial diversity in PM2.5 at night and considerable changes in fungal flora structure in the diurnal and nocturnal PM2.5 samples. These changes can be attributed to diel variations in environmental factors in the house. The monitoring results of environmental factors in this study showed that NH3, CO2, temperature, and relative humidity were significantly higher at night than during the day (Figure 2). Further RDA was applied to analyse the relationship between bacterial and fungal flora composition and environmental factors in the PM2.5 samples (Figure 8). The results indicate that the changes in microbial composition of PM2.5 are related to the changes in environmental factors in the fattening house. Air pollutants such as NH3 may be converted into ionic forms that provide nutrients for bacteria and catalyse oxidation by microorganisms [27,28]. Similarly, some air pollutants (e.g., CO2) may indirectly affect the growth and survival of airborne bacteria by interacting with other factors [29]. Several studies have shown that temperature and microbial diversity are positively correlated, with higher temperatures promoting microbial growth, yet lower temperatures inhibiting microbial reproduction [30,31]. In addition, similar to temperature, relative humidity is positively correlated with airborne microbial diversity, and its synergistic effect with temperature is even more pronounced [32]. Therefore, the higher levels of NH3, CO2, temperature, and relative humidity at night compared to daytime are likely contributing factors to the higher bacterial diversity in the PM2.5 samples at night and the large variation in the structure of fungal flora between day and night.
The study of the microbiological composition of air PM2.5 in pig houses is important for animal welfare and human public health. In this study, the dominant bacterial phylum identified in air PM2.5 from the pig house was Firmicutes, which is consistent with previous studies on pig houses [33]. However, some studies have identified Proteobacteria as the dominant bacteria in bioaerosols from pig houses instead of Firmicutes [34]. The discrepancy is likely due to the differences in sampling locations, as those studies collected samples from the environment surrounding the pigsties. The structure of the bacterial flora in residential air PM2.5 was significantly different from that of pig house air, with Proteobacteria being the dominant bacterial group in residential air PM2.5, followed by Actinobacteriota and Firmicutes [35]. This may be the result of the different sampling points and sources of PM2.5. The main sources of airborne PM2.5 in pig houses are faeces, feed, dander, hair, and bedding [36]. In this study, the bacterium with the highest abundance was Clostridium spp., which is associated with intestinal flora and faecal microorganisms. The potential pathogenic bacteria and allergen fungi in PM2.5 in pig houses are closely related to human and animal health. Some species of Clostridium spp. can cause intestinal diseases and soft tissue infections [37,38]. In addition, bacteria carried by animals can also be transmitted to humans through bioaerosols. Aspergillus spp. is the allergen fungus genus with the highest relative abundance of PM2.5. Repeated inhalation can cause various pathological changes, such as allergic asthma and allergic pneumonia [39]. Secondly, the secondary metabolites produced by Aspergillus spp., such as mycotoxins, can cause immunotoxic effects. Aflatoxin produced by Aspergillus spp. species is even listed as a carcinogen for humans and animals [40]. The bacterial composition abundance of the PM2.5 samples is similar to that of faecal samples, and the fungal composition abundance of the PM2.5 samples is similar to that of feed samples (Figure 9). Therefore, it can be inferred that most of the bacteria in the PM2.5 samples in the fattening house may come from faeces and most of the fungi may come from feed, which further confirms that faeces and feed are the main sources of PM2.5 in pig house [23].

5. Conclusions

In this study, we analysed the morphological characteristics of PM2.5 in a fattening pig house and the microbial composition of PM2.5 during day and night. We found that PM2.5 particles in the fattening house showed different morphologies, such as spherical, flocculent, and chain-like structures. It was also found that the microbial diversity and colony structure of PM2.5 in the fattening house had significant diel variations and could be attributed to the variation in environmental factors between the day and night in the fattening house. In addition, faeces may be the main source of airborne bacteria in fattening houses and feed may be the main source of airborne fungi in fattening houses. The findings provide a theoretical basis for improving the rearing environment of pig houses, which is conducive to the sustainable development of the pig industry and environment.

Author Contributions

Conceptualisation, Q.T. and R.Z.; methodology, Y.J.; validation, Y.J., J.Z. and K.T.; data curation, M.T.; writing—original draft preparation, M.T.; writing—review and editing, K.T.; visualisation, J.Z.; supervision, R.Z.; project administration, Q.T.; funding acquisition, Q.T. All authors have read and agreed to the published version of this manuscript.

Funding

This research was funded by the “National Key Research and Development Program of China (2023YFD1702000)” and “Chongqing Scientific Research Institution Performance Incentive and Guidance Special Project (cstc2021jxj100021)”.

Institutional Review Board Statement

Not applicable.

Informed Consent Statement

Not applicable.

Data Availability Statement

The data presented in this study are available on request from the corresponding author.

Conflicts of Interest

The authors declare no conflicts of interest.

References

  1. Knetter, S.M.; Tuggle, C.K.; Wannemuehler, M.J.; Ramer-Tait, A.E. Organic barn dust extract exposure impairs porcine macrophage function in vitro: Implications for respiratory health. Vet. Immunol. Immunopathol. 2014, 157, 20–30. [Google Scholar] [CrossRef] [PubMed]
  2. Borlée, F.; Yzermans, C.J.; Aalders, B.; Rooijackers, J.; Krop, E.; Maassen, C.B.; Smit, L.A. Air pollution from livestock farms is associated with airway obstruction in neighboring residents. Am. J. Respir. Crit. Care Med. 2017, 196, 1152–1161. [Google Scholar] [CrossRef] [PubMed]
  3. Jahne, M.A.; Rogers, S.W.; Holsen, T.M.; Grimberg, S.J.; Ramler, I.P. Emission and dispersion of bioaerosols from dairy manure application sites: Human health risk assessment. Environ. Sci. Technol. 2015, 49, 9842–9849. [Google Scholar] [CrossRef] [PubMed]
  4. Weichenthal, S.A.; Godri Pollitt, K.; Villeneuve, P.J. PM2.5, oxidant defence and cardiorespiratory health: A review. Environ. Health. 2013, 12, 1612. [Google Scholar] [CrossRef]
  5. Audi, C.; Baïz, N.; Maesano, C.N.; Ramousse, O.; Reboulleau, D.; Magnan, A.; Caillaud, D.; Annesi-Maesano, I. Serum cytokine levels related to exposure to volatile organic compounds and PM2.5 in dwellings and workplaces in French farmers—A mechanism to explain nonsmoking COPD. Int. J. Chron. Obstruct Pulmon Dis. 2017, 12, 1363. [Google Scholar] [CrossRef]
  6. Hedelin, A.S.; Sundblad, B.M.; Sahlander, K.; Wilkinson, K.; Seisenbaeva, G.; Kessler, V.; Larsson, K.; Palmberg, L. Comparing human respiratory adverse effects after acute exposure to particulate matter in conventional and particle-reduced swine building environments. Occup. Environ. Med. 2016, 73, 648–655. [Google Scholar] [CrossRef]
  7. Viegas, S.; Mateus, V.; Almeida-Silva, M.; Carolino, E.; Viegas, C. Occupational exposure to particulate matter and respiratory symptoms in Portuguese swine barn workers. J. Toxicol. Environ. Health A 2013, 76, 1007–1014. [Google Scholar] [CrossRef]
  8. Pateraki, S.; Asimakopoulos, D.N.; Flocas, H.A.; Maggos, T.; Vasilakos, C. The role of meteorology on different sized aerosol fractions (PM₁₀, PM2.5, PM2.5–10). Sci. Total Environ. 2012, 419, 124–135. [Google Scholar] [CrossRef]
  9. Zhao, Y.; Aarnink, A.J.A.; De, M.C.M.; Groot, P.W.G. Airborne Microorganisms From Livestock Production Systems and Their Relation to Dust. Crit. Rev. Environ. Sci. Technol. 2014, 44, 1071–1128. [Google Scholar] [CrossRef]
  10. Rooij, M.M.T.; Smit, L.A.M.; Erbrink, H.J.; Hagenaars, T.J.; Hoek, G.; Ogink, N.W.M.; Winkel, A.; Heederik, D.J.J.; Wouters, I.M. Endotoxin and particulate matter emitted by livestock farms and respiratory health effects in neighboring residents. Environ. Int. 2019, 132, 105009. [Google Scholar] [CrossRef]
  11. Peng, S.; Luo, M.; Long, D.; Liu, Z.; Tan, Q.; Huang, P.; Shen, J.; Pu, S. Full-length 16S rRNA gene sequencing and machine learning reveal the bacterial composition of inhalable particles from two different breeding stages in a piggery. Ecotoxicol. Environ. Saf. 2023, 253, 114712. [Google Scholar] [CrossRef] [PubMed]
  12. Zhang, Y.; Mo, J.; Li, Y.; Sundell, J.; Wargocki, P.; Zhang, J.; Little, J.C.; Corsi, R.; Deng, Q.; Leung, M.H.K.; et al. Can commonly-used fan-driven air cleaning technologies improve indoor air quality? A literature review. Atmos. Environ. 2011, 45, 4329–4343. [Google Scholar] [CrossRef] [PubMed]
  13. Sun, X.; Li, D.; Li, B.; Sun, S.; Yabo, S.D.; Geng, J.; Ma, L.; Qi, H. Exploring the disparity of inhalable bacterial communities and antibiotic resistance genes between hazy days and non-hazy days in a cold megacity in Northeast China. J. Hazard. Mater. 2020, 398, 122984. [Google Scholar] [CrossRef] [PubMed]
  14. Hong, P.Y.; Li, X.; Yang, X.; Shinkai, T.; Zhang, Y.; Wang, X.; Mackie, R.I. Monitoring airborne biotic contaminants in the indoor environment of pig and poultry confinement buildings. Environ. Microbiol. 2012, 14, 1420–1431. [Google Scholar] [CrossRef]
  15. White, J.K.; Nielsen, J.L.; Madsen, A.M. Microbial species and biodiversity in settling dust within and between pig farms. Environ. Res. 2019, 171, 558–567. [Google Scholar] [CrossRef]
  16. Griffin, D.W.; Gonzalez-Martin, C.; Hoose, C.; Smith, D.J. Global-scale atmospheric dispersion of microorganisms. In Microbiology of Aerosols, 1st ed.; Anne-Marie, D., Pierre, A., Eds.; John Wiley & Sons, Inc.: Hoboken, NJ, USA, 2017; pp. 155–194. [Google Scholar]
  17. Reche, I.; D’Orta, G.; Mladenov, N.; Winget, D.M.; Suttle, C.A. Deposition rates of viruses and bacteria above the atmospheric boundary layer. ISME J. 2018, 12, 1154–1162. [Google Scholar] [CrossRef]
  18. Dee, S.; Otake, S.; Oliveira, S.; Deen, J. Evidence of long distance airborne transport of porcine reproductive and respiratory syndrome virus and Mycoplasma hyopneumoniae. Vet. Res. 2009, 40, 39. [Google Scholar] [CrossRef]
  19. Xue, F.; Yang, Y.; Zou, S.; Zhang, Y.; Yue, D.; Zhao, Y.; Lai, S. Characterization of airborne bacteria and fungi at a land-sea transition site in Southern China. Sci. Total Environ. 2022, 849, 157786. [Google Scholar] [CrossRef]
  20. Bai, W.; Li, Y.; Xie, W.; Ma, T.; Hou, J.; Zeng, X. Vertical variations in the concentration and community structure of airborne microbes in PM2.5. Sci. Total Environ. 2021, 760, 143396. [Google Scholar] [CrossRef]
  21. Xu, C.; Chen, H.; Liu, Z.; Sui, G.; Li, D.; Kan, H.; Chen, J. The decay of airborne bacteria and fungi in a constant temperature and humidity test chamber. Environ. Int. 2021, 157, 106816. [Google Scholar] [CrossRef]
  22. Cambra-López, M.; Hermosilla, T.; Aarnink, A.J.A.; Ogink, N.W.M. A methodology to select particle morpho-chemical characteristics to use in source apportionment of particulate matter from livestock houses. Comput. Electron. Agric. 2012, 81, 14–23. [Google Scholar] [CrossRef]
  23. Pu, S.; Peng, S.; Zhu, J.; Liu, Z.; Long, D.; Lim, T. Characteristics of PM2.5 and Its Correlation with Feed, Manure and NH3 in a Pig-Fattening House. Toxics 2022, 10, 145. [Google Scholar] [CrossRef] [PubMed]
  24. Donham, K.J. Hazardous agents in agricultural dusts and methods of evaluation. Am. J. Ind. Med. 1986, 10, 205–220. [Google Scholar] [CrossRef] [PubMed]
  25. Satsangi, P.G.; Yadav, S. Characterization of PM2.5 by X-ray diffraction and scanning electron microscopy–energy dispersive spectrometer: Its relation with different pollution sources. Int. J. Environ. Sci. Technol. 2014, 11, 217–232. [Google Scholar] [CrossRef]
  26. Aloyan, A.E.; Arutyunyan, V.O.; Lushnikov, A.A.; Zagaynov, V.A. Transport of coagulating aerosol in the atmosphere. J. Aerosol Sci. 1997, 28, 67–85. [Google Scholar] [CrossRef]
  27. Xie, Z.; Li, Y.; Lu, R.; Li, W.; Fan, C.; Liu, P.; Wang, W. Characteristics of total airborne microbes at various air quality levels. J. Aerosol Sci. 2018, 116, 57–65. [Google Scholar] [CrossRef]
  28. Liu, H.; Hu, Z.; Zhou, M.; Zhang, H.; Li, Z.; Zhang, H.; Hu, J.; Yao, X.; Lou, L.; Xi, C.; et al. Airborne microorganisms exacerbate the formation of atmospheric ammonium and sulfate. Environ. Pollut. 2020, 263, 114293. [Google Scholar] [CrossRef]
  29. Zhai, Y.; Li, X.; Wang, T.; Wang, B.; Li, C.; Zeng, G. A review on airborne microorganisms in particulate matters: Composition, characteristics and influence factors. Environ. Int. 2018, 113, 74–90. [Google Scholar] [CrossRef]
  30. Almaguer, M.; Aira, M.J.; Rodríguez-Rajo, F.J.; Rojas, T.I. Temporal dynamics of airborne fungi in Havana (Cuba) during dry and rainy seasons: Influence of meteorological parameters. Int. J. Biometeorol. 2014, 58, 1459–1470. [Google Scholar] [CrossRef]
  31. Smets, W.; Moretti, S.; Denys, S.; Lebeer, S. Airborne bacteria in the atmosphere: Presence, purpose, and potential. Atmos. Environ. 2016, 139, 214–221. [Google Scholar] [CrossRef]
  32. Yan, D.; Zhang, T.; Su, J.; Zhao, L.L.; Wang, H.; Fang, X.M.; Zhang, Y.Q.; Liu, H.Y.; Yu, L.Y. Diversity and Composition of Airborne Fungal Community Associated with Particulate Matters in Beijing during Haze and Non-haze Days. Front. Microbiol. 2016, 7, 487. [Google Scholar] [CrossRef] [PubMed]
  33. Hong, S.W.; Park, J.; Jeong, H.; Kim, M. Evaluation of the microbiome composition in particulate matter inside and outside of pig houses. J. Anim. Sci. Technol. 2021, 63, 640–650. [Google Scholar] [CrossRef] [PubMed]
  34. Wu, N.; Xie, S.; Zeng, M.; Xu, X.; Li, Y.; Liu, X.; Wang, X. Impacts of pile temperature on antibiotic resistance, metal resistance and microbial community during swine manure composting. Sci. Total Environ. 2020, 744, 140920. [Google Scholar] [CrossRef] [PubMed]
  35. Du, P.; Du, R.; Ren, W.; Lu, Z.; Fu, P. Seasonal variation characteristic of inhalable microbial communities in PM2.5 in Beijing city, China. Sci. Total Environ. 2018, 610, 308–315. [Google Scholar] [CrossRef] [PubMed]
  36. Dumas, M.D.; Polson, S.W.; Don, R.; Jacques, R.; Jack, G.; Robin, M.; Wommack, K.E. Impacts of poultry house environment on poultry litter bacterial community composition. PLoS ONE 2011, 6, e24785. [Google Scholar] [CrossRef]
  37. Freedman, J.C.; Shrestha, A.; McClane, B.A. Clostridium perfringens Enterotoxin: Action, Genetics, and Translational Applications. Toxics 2016, 8, 73. [Google Scholar] [CrossRef]
  38. Sukumaran, V.; Senanayake, S. Bacterial skin and soft tissue infections. Aust. Prescr. 2016, 39, 159–163. [Google Scholar] [CrossRef]
  39. Vacher, G.; Niculita-Hirzel, H.; Roger, T. Immune responses to airborne fungi and non-invasive airway discases. Semin. Immunopathol. 2014, 37, 83–96. [Google Scholar] [CrossRef]
  40. Liu, Y.; Wu, F. Global burden of aflatoxin-induced hepatocellular carcinoma: A risk assessment. Environ. Health Perspect. 2010, 118, 818–824. [Google Scholar] [CrossRef]
Figure 1. Monitoring points for environmental factors in the pigsty and PM2.5 sampling points.
Sustainability 16 10249 g001
Figure 2. Summary data from the 24 h monitoring of the pig house. (a) NH3, (b) TSP, (c) CO2, (d) wind speed, (e) temperature, and (f) relative humidity.
Sustainability 16 10249 g002
Figure 3. Micro-morphology of PM2.5 in the pigsty. (a) Overall morphology of PM2.5 in pigsties, (b) smooth-surfaced spherical particles, (c) rough-surfaced spherical particles, (d) flocculent particles, (e) chain-like particles, (f) flaky particles, (g) lumpy particles, (h) rod-shaped particles, and (i) irregularly shaped particles.
Sustainability 16 10249 g003
Figure 4. Microscopic morphology of PM2.5, feedstuff, and faeces in the pigsty. (a) PM2.5, (b) feedstuff, and (c) faeces.
Sustainability 16 10249 g004
Figure 5. Comparison of bacterial and fungal β-diversity among different samples. (a) The bacterial PCoA analysis and (b) the fungal PCoA analysis.
Sustainability 16 10249 g005
Figure 6. Composition of bacterial communities in different PM2.5 samples. (a) The bacterial composition at the phylum level and (b) the 10 most dominant bacterial composition at the genera level.
Sustainability 16 10249 g006
Figure 7. Composition of fungal communities in different PM2.5 samples. (a) The fungal composition at the phylum level and (b) the 10 most dominant fungal composition at the genera level.
Sustainability 16 10249 g007
Figure 8. Correlation analysis between microbial composition and environmental factors. (a) The Redundancy Analysis (RDA) of the association between bacterial assemblage and microclimate variables. (b) The Redundancy Analysis (RDA) of the association between fungal assemblage and microclimate variables.
Sustainability 16 10249 g008
Figure 9. Cluster heatmap of PM2.5, feed, and faecal samples in the pigsty. (a) Bacteria and (b) fungi.
Sustainability 16 10249 g009
Table 1. Bacterial alpha diversity index of different samples.
Sample NameACEChao1ShannonSimpson
AD329.5 ± 72.45 B327.23 ± 72.89 B2.71 ± 0.44 B0.18 ± 0.07 a
D325.8 ± 57.33 B325.10 ± 57.09 B2.82 ± 0.07 B0.13 ± 0.02 ab
N606.30 ± 5.94 A601.40 ± 6.50 A4.18 ± 0.12 A0.05 ± 0.01 b
Note: AD—all day PM2.5, D—day PM2.5, N—night PM2.5. Equal letters for each factor represent non-significant differences (p > 0.05). Different lowercase and uppercase indicate significant and remarkable differences among treatments, at the 0.05 and 0.01 levels, respectively.
Table 2. Fungal alpha diversity index of different samples.
Sample NameACEChao1ShannonSimpson
AD918.90 ± 54.42 Aa899.30 ± 53.15 Aa4.45 ± 0.09 a0.05 ± 0.01 a
D701.30 ± 82.88 Bb690.30 ± 81.07 Bb4.39 ± 0.28 a0.04 ± 0.01 a
N725.90 ± 19.93 b711.20 ± 16.07 b4.31 ± 0.07 a0.05 ± 0.01 a
Note: AD—all day PM2.5, D—day PM2.5, N—night PM2.5. Equal letters for each factor represent non-significant differences (p > 0.05). Different lowercase and uppercase indicate significant and remarkable differences among treatments, at the 0.05 and 0.01 levels, respectively.
Disclaimer/Publisher’s Note: The statements, opinions and data contained in all publications are solely those of the individual author(s) and contributor(s) and not of MDPI and/or the editor(s). MDPI and/or the editor(s) disclaim responsibility for any injury to people or property resulting from any ideas, methods, instructions or products referred to in the content.

