
A Study on the Relationship Between Livestock Carbon Emission and Economic Growth in Inner Mongolia


Abstract
1. Introduction
- (1)
- Inner Mongolia grassland, as one of China’s traditional pastoral areas, is an important animal husbandry production base and main production area of livestock breeding in China, and its animal husbandry industry is relatively developed.
- (2)
- This study not only estimated the carbon emissions of four major livestock species in Inner Mongolia through the IPCC inventory estimation method, and also empirically analyzed the relationship between the carbon emissions of animal husbandry and economic growth in Inner Mongolia, which is helpful to expand the research scope in the field of environmental economics and explore the interaction between economic growth and environmental quality. It provides theoretical support for the development of ecological economy theory.
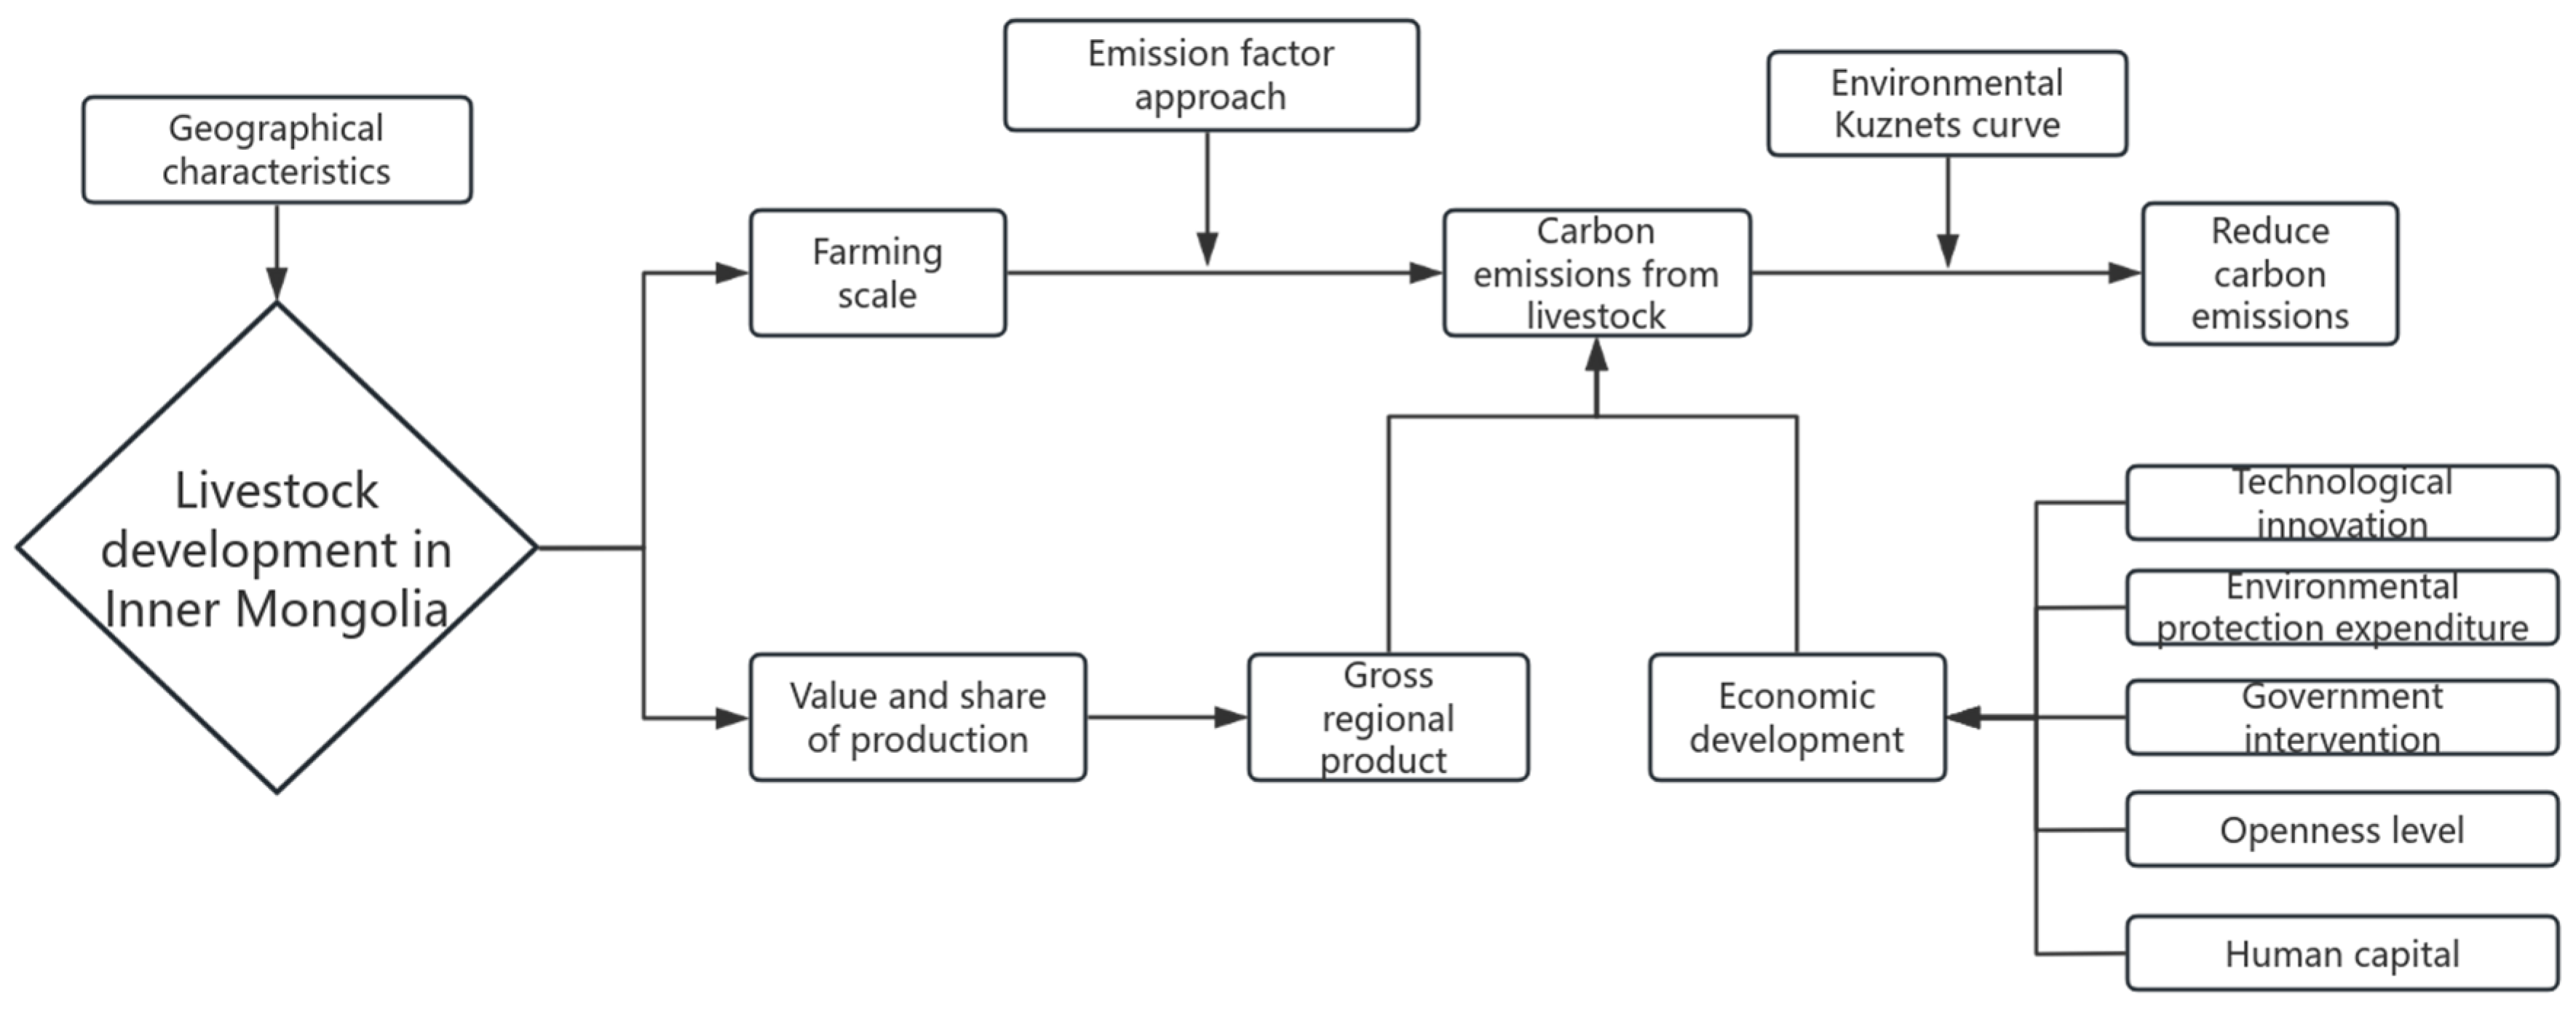
2. Theoretical Analysis and Research Framework
3. Current Status of Livestock Development in the Inner Mongolia Autonomous Region
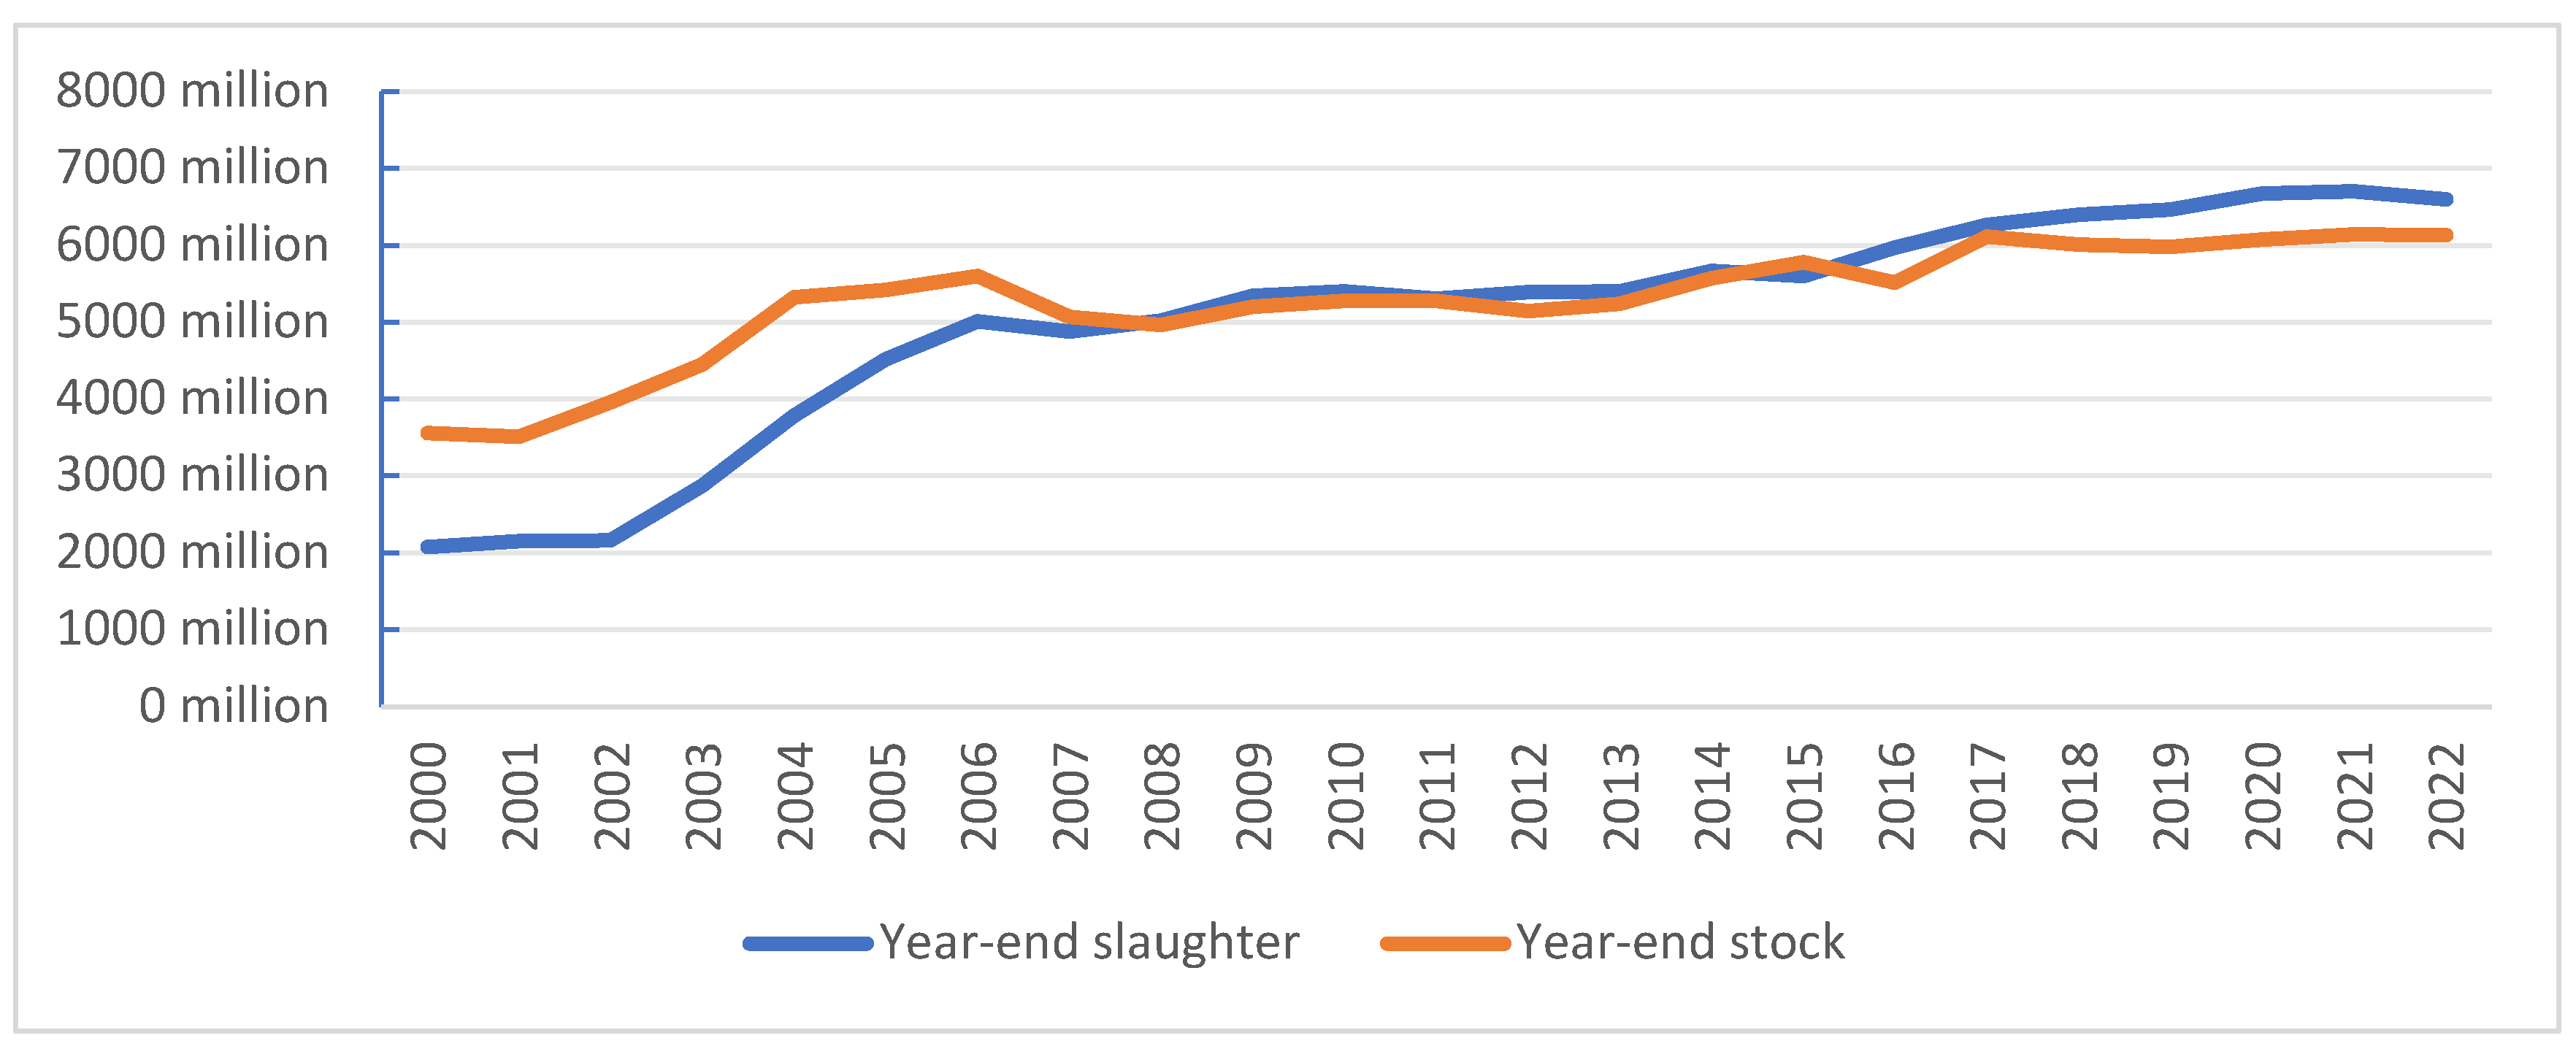
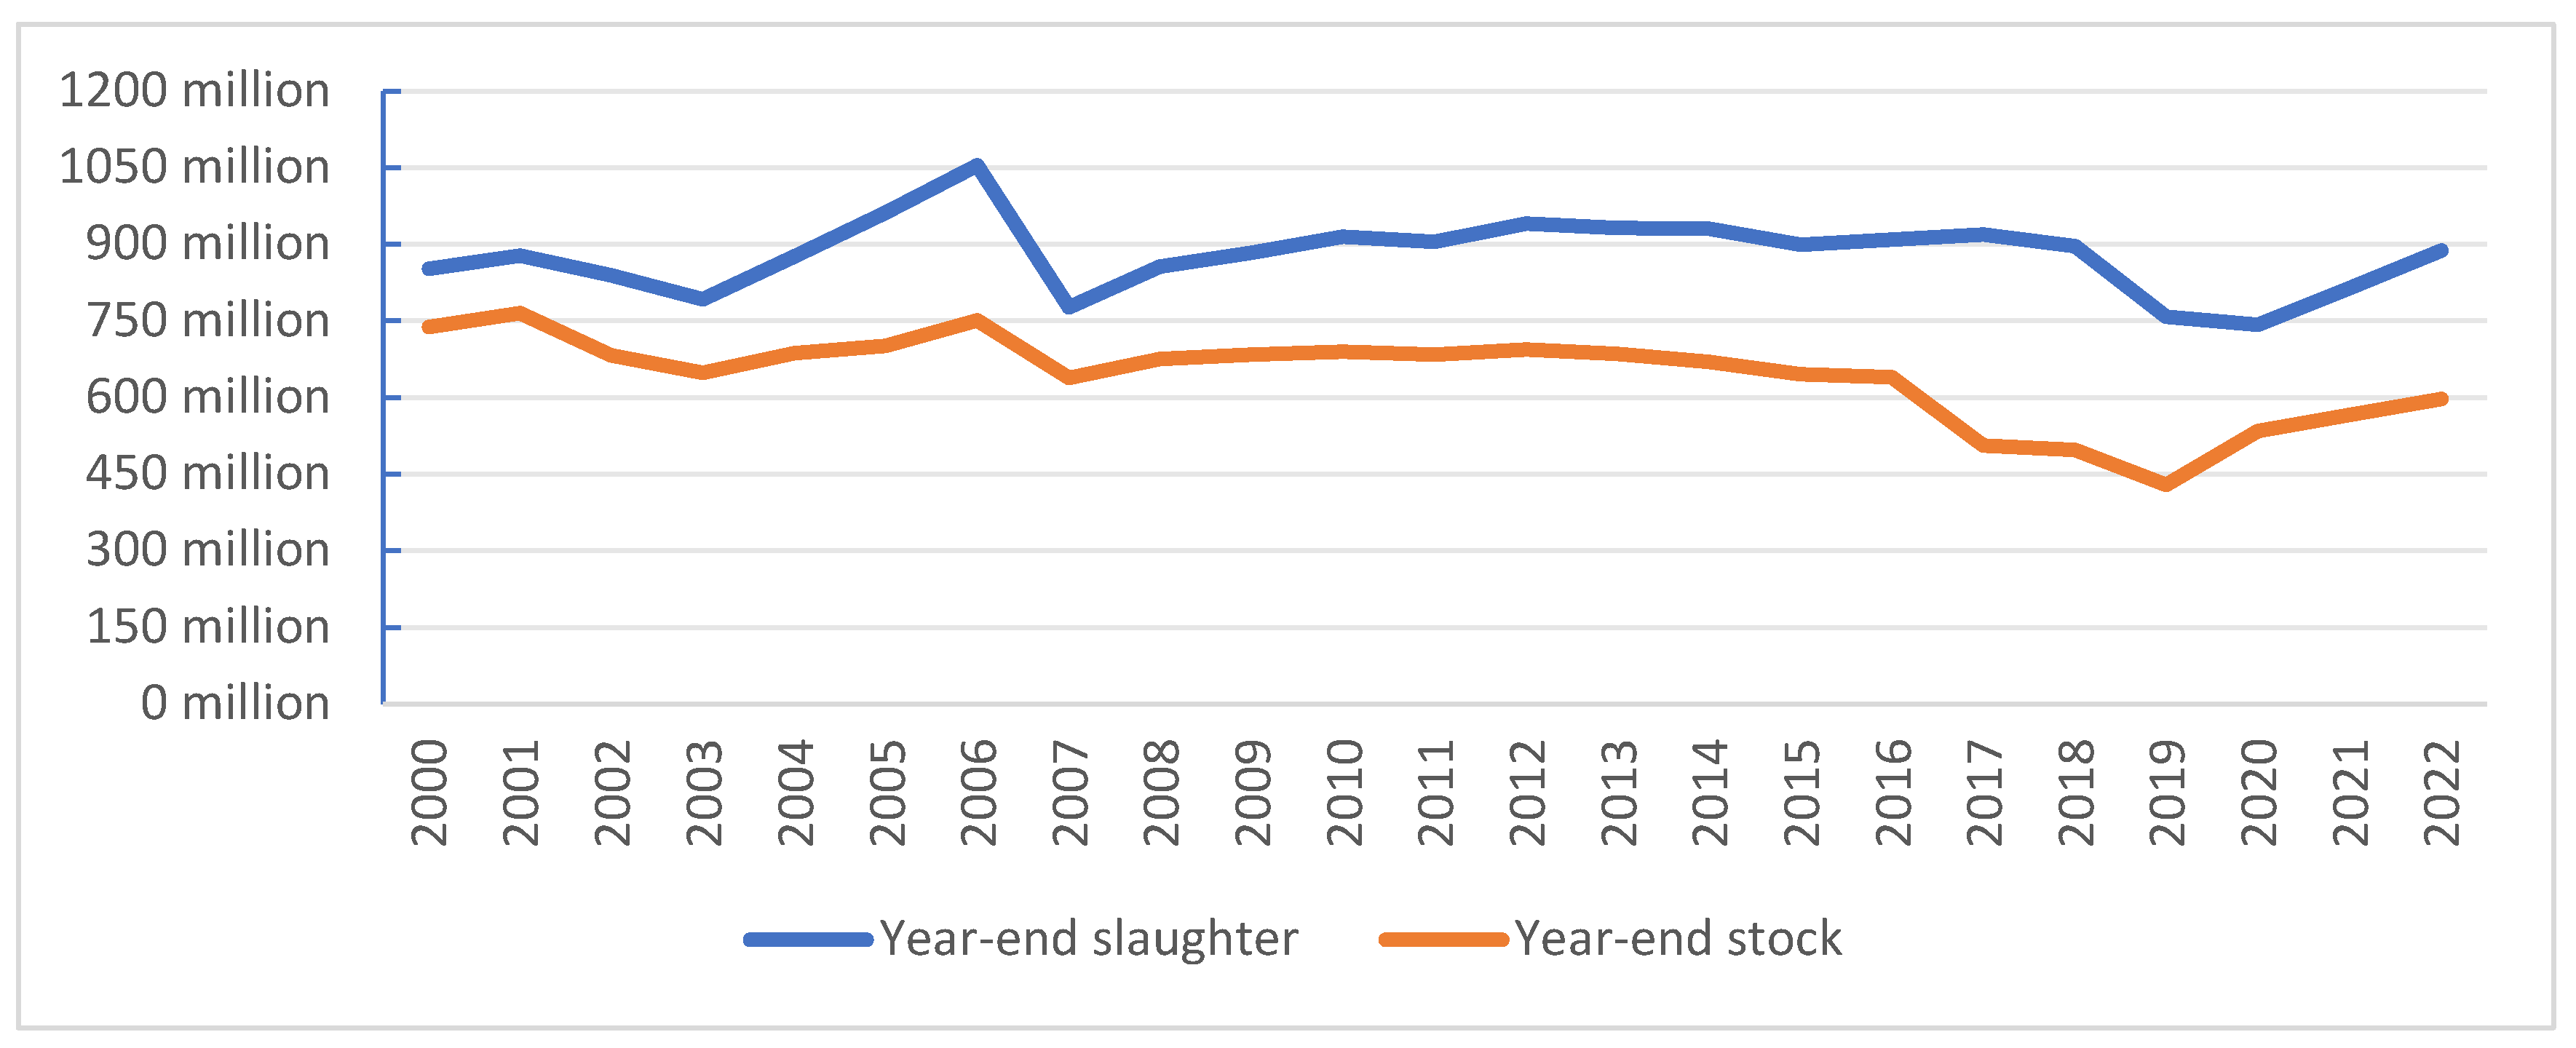
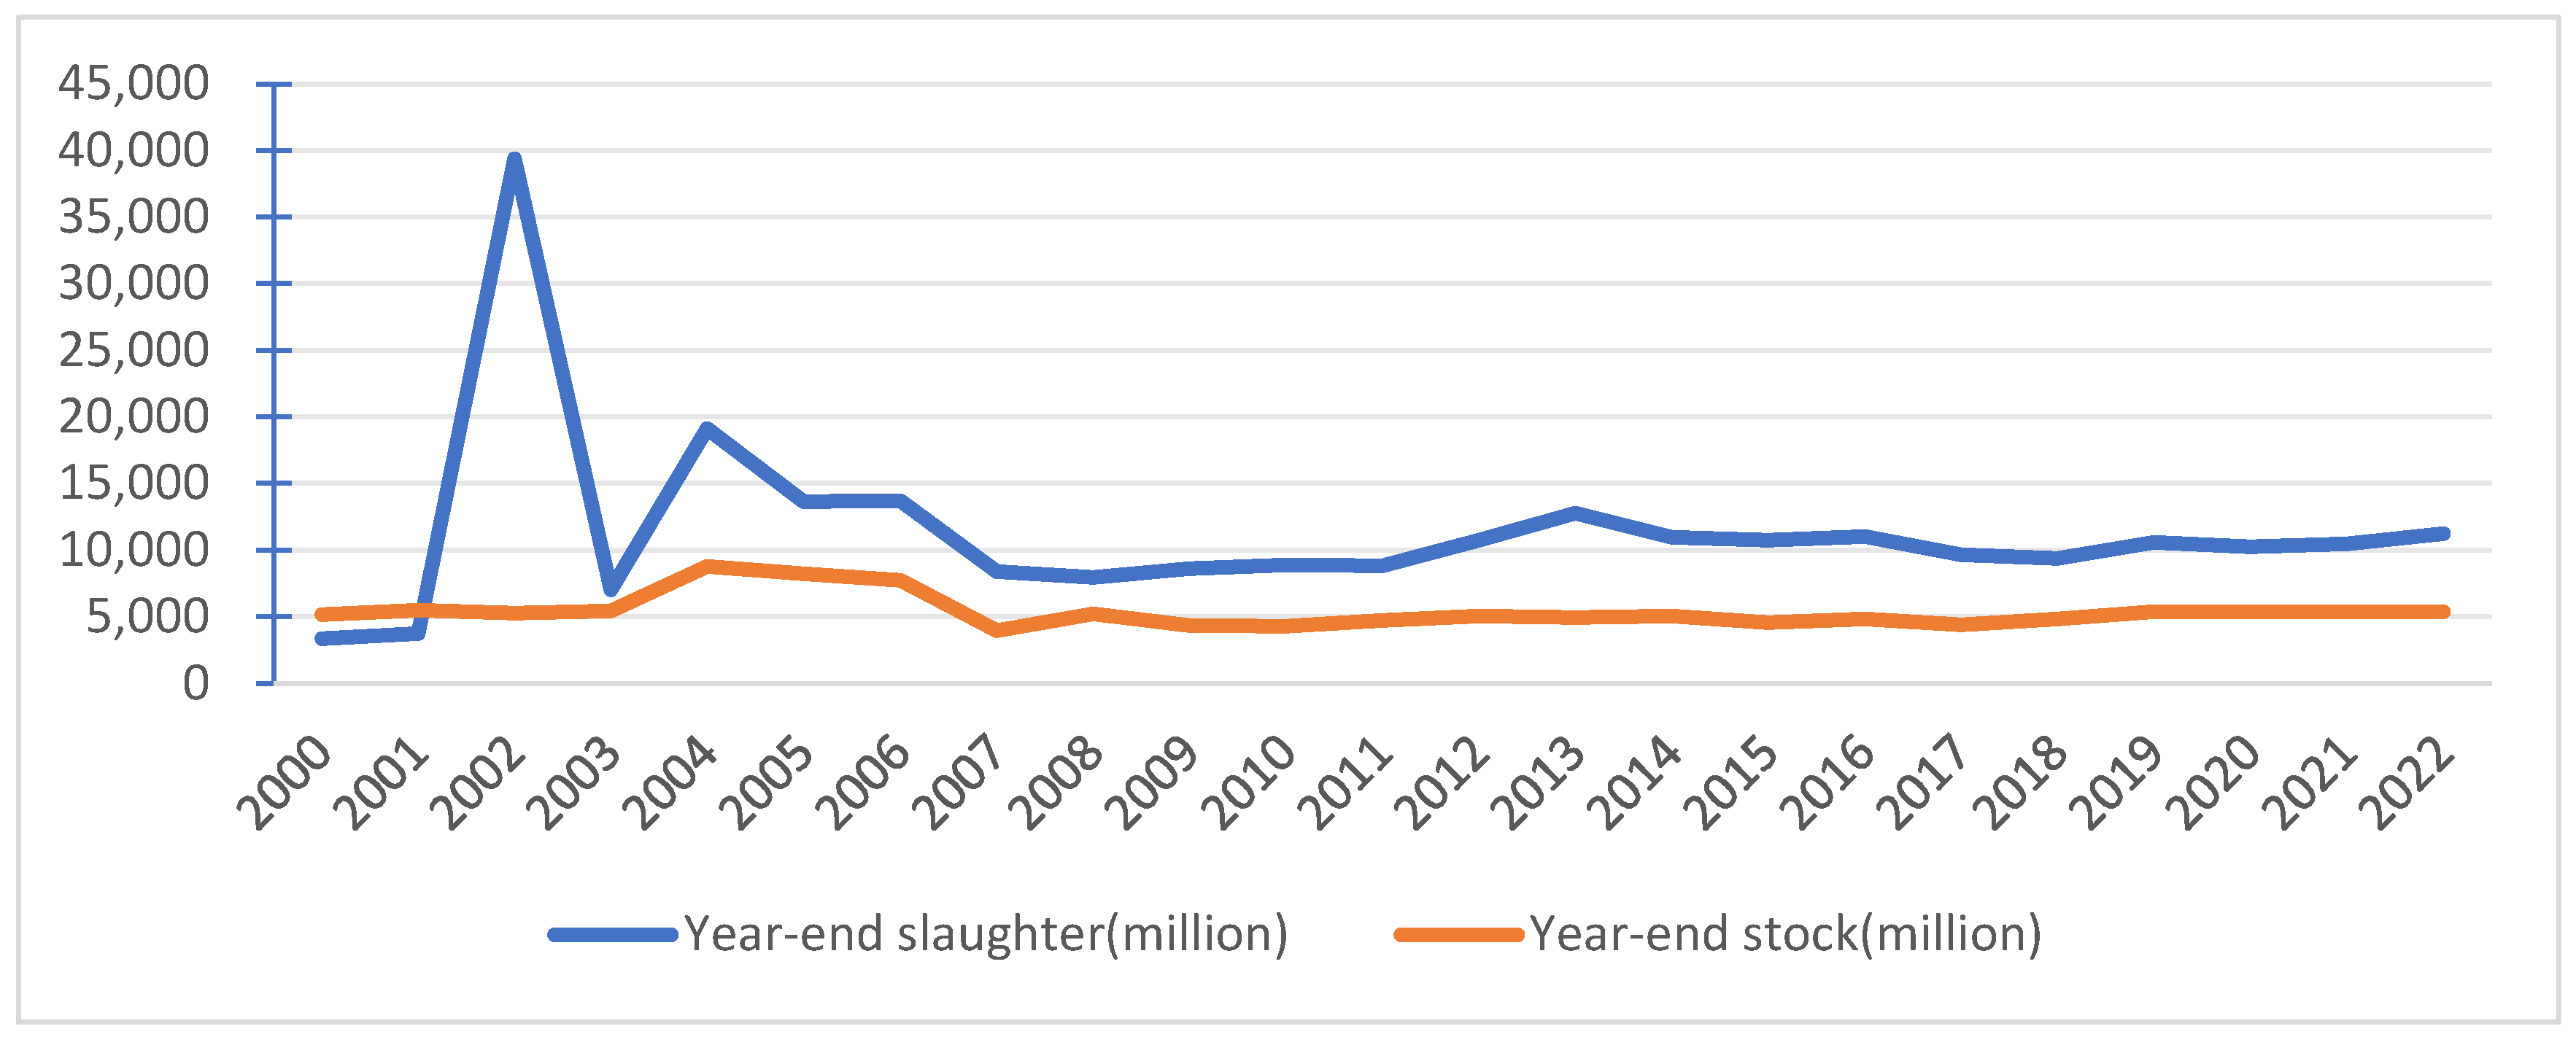
3.1. Scale of Livestock Farming
3.2. Value and Share of Livestock Production
3.3. Measurement of Carbon Emissions from Livestock
4. Description of the Research Methodology and Variables
4.1. Selection of Variables
- (1)
- The explanatory variable is carbon emissions from animal husbandry, referring to the emission factor method of Zhang Jinxin et al. [20] to measure carbon dioxide emissions in Inner Mongolia.
- (2)
- The explanatory variable in this paper is the gross regional product. This, first, is because the gross regional product can reflect the regional economic development situation more realistically; second, the availability of the gross regional product is higher, and the statistical caliber is the most consistent, which is convenient for the mutual comparison between different regions.
- (3)
- The control variables in this paper are the five indicators of technological innovation, environmental protection expenditure, government intervention, openness level, and human capital. Among them, technological innovation, environmental protection expenditure, and government intervention are borrowed from Zhao Feifei et al. [21], who used the general public budget expenditure in science and technology expenditures (10,000 yuan), energy saving and environmental protection expenditures (10,000 yuan), and the city’s general public budget financial expenditures as a proportion of the regional GDP; the level of openness is a reference to the ratio of the total import and export trade to the regional GDP by Xu Yingying [22]; the human capital is borrowed from Chen Yao [23], who used the number of rural population to measure rural human capital. The details are shown in Table 5.
4.1.1. Data Sources
4.1.2. Descriptive Statistics
4.2. Model Construction
5. Empirical Analysis of the Relationship Between Carbon Emissions from Animal Husbandry and Economic Growth in Inner Mongolia
Non-Linear Regression
6. Conclusions and Recommendations for Response
6.1. Main Findings
- (1)
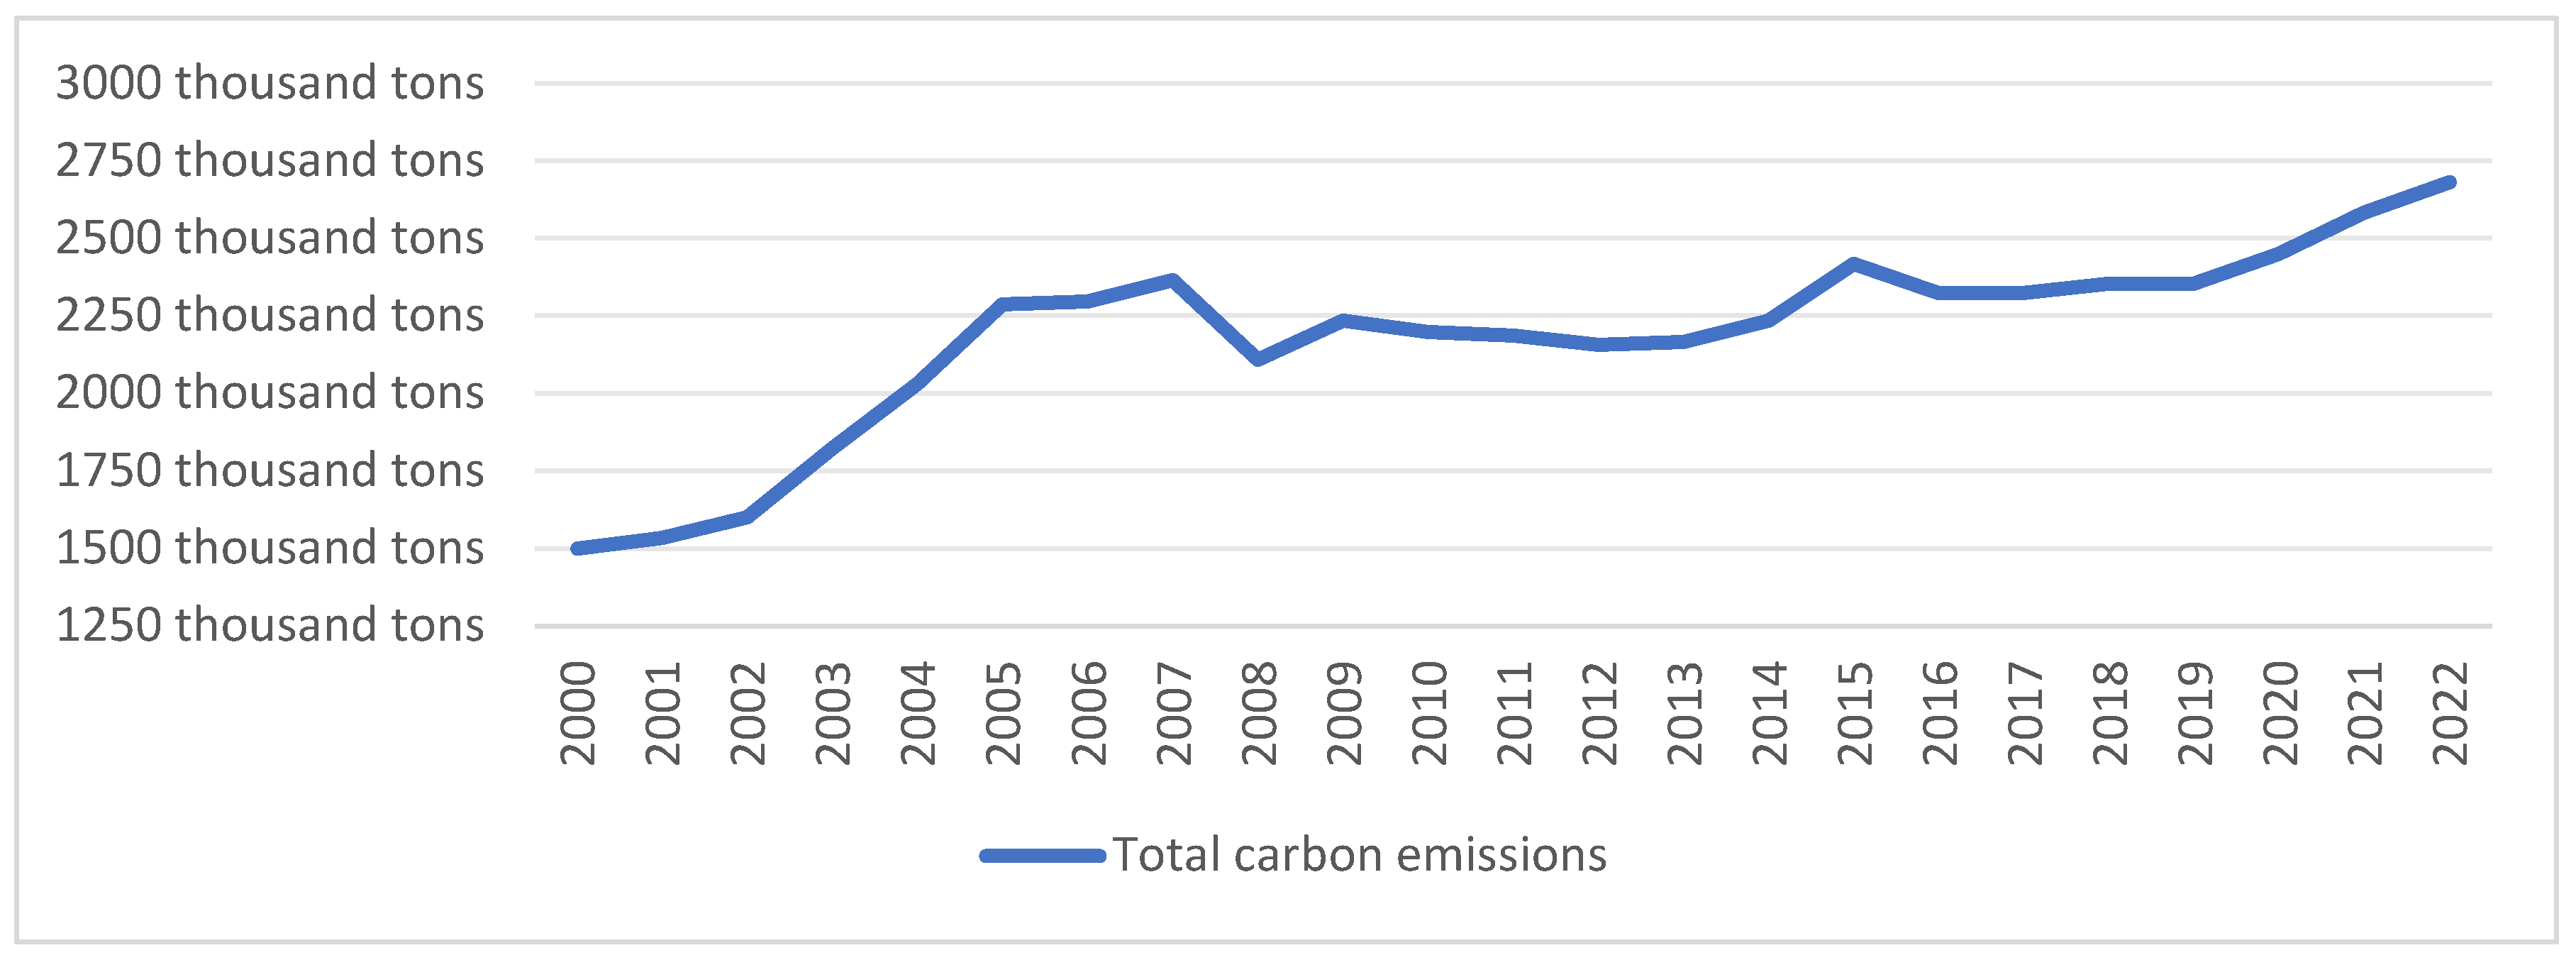
- The research objects of this paper are cows, sheep, hog, and poultry. Drawing on the emission factor method of Zhang Jinxin et al. [20], the carbon dioxide emissions of Inner Mongolia are measured, and the results show that the livestock industry in Inner Mongolia achieved significant growth between 2000 and 2022 and that the average annual feeding capacity and carbon emissions of all types of livestock increased. However, the carbon emission problem has been gradually highlighted along with the increase in feeding capacity, with the average annual feeding capacity and carbon emission of cow, sheep and hog showing an increasing trend, while on the contrary, the average annual feeding capacity and carbon emission of poultry have decreased.
- (2)
- Through regression analysis, it is further pointed out that environmental protection expenditure, openness level, and technological innovation all show a negative correlation with the carbon emissions of the livestock industry, and government intervention, human capital, and the carbon emissions of the livestock industry show a positive correlation.
- (3)
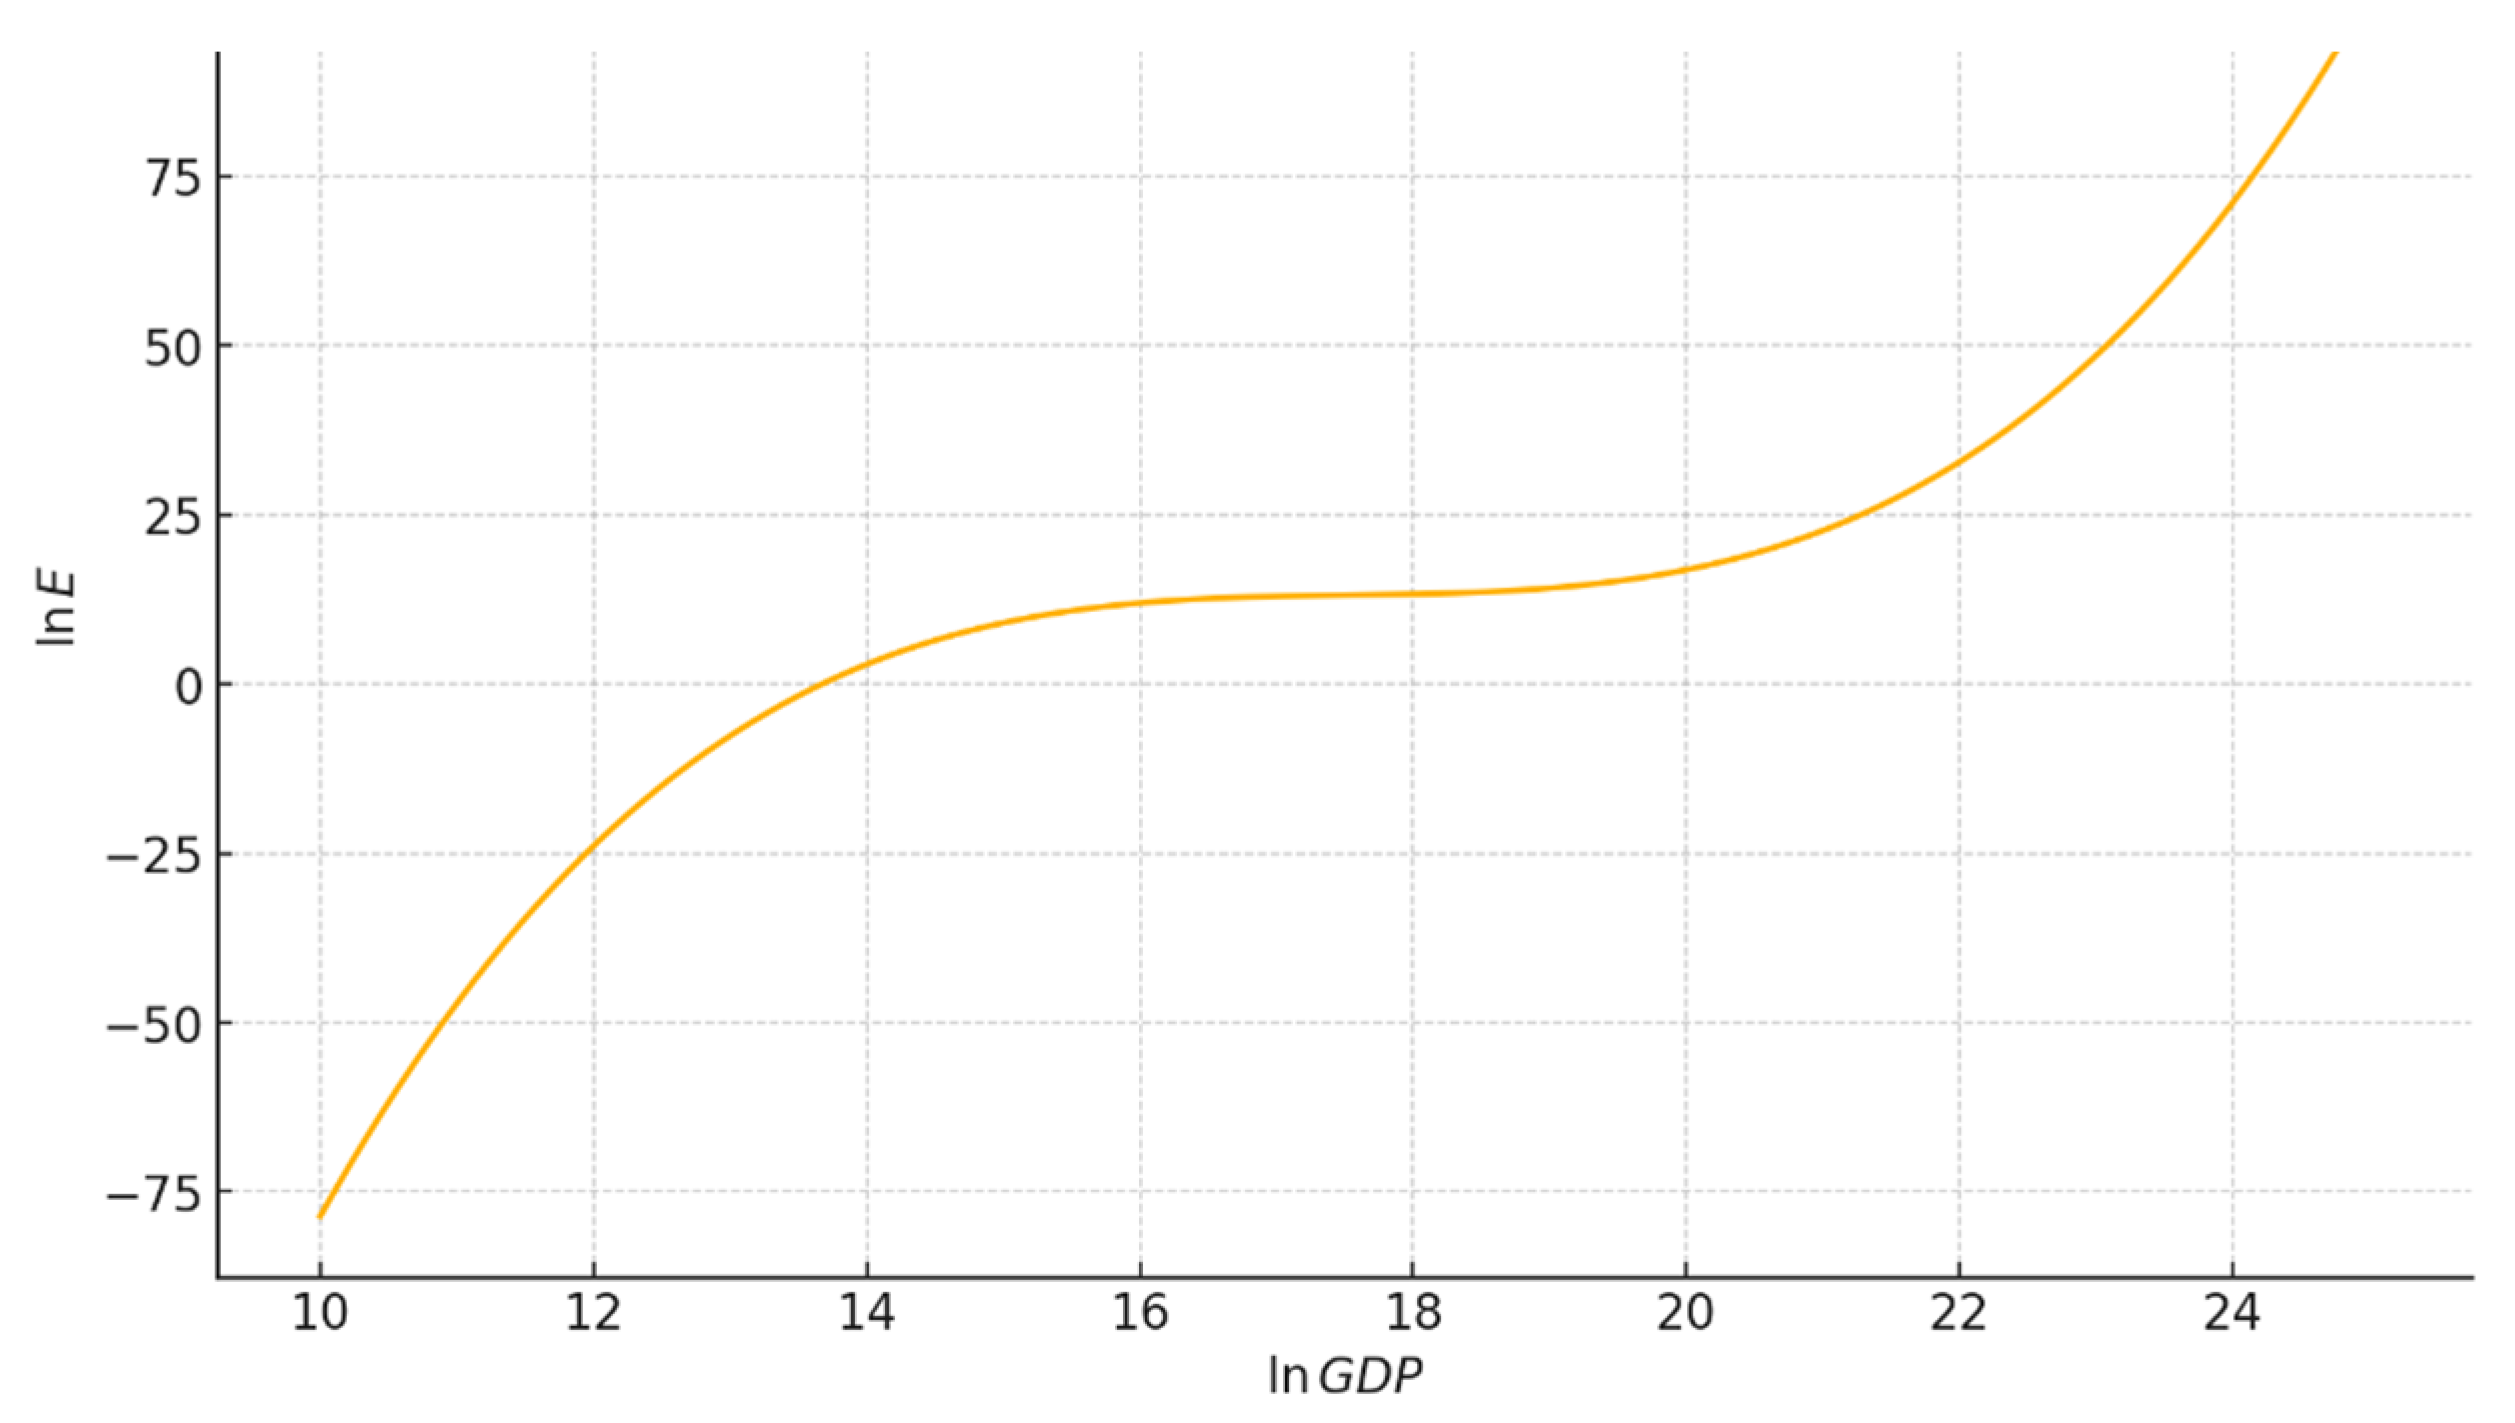
- From the results of our data analysis, Inner Mongolia animal husbandry carbon emissions and the introduction of the three terms of regional gross domestic product after the introduction of economic growth show an N-shaped relationship, and there is an inflection point, which is 415,953,900,000 yuan. Initial economic growth is accompanied by a rapid rise in carbon emissions. Medium-term economic growth helps to control carbon emissions. And further economic growth in the later period brings about a rise in carbon emissions. In view of this complex relationship, it is necessary to take corresponding measures at different stages of economic development in order to realize the coordinated development of economic growth and carbon emission control.
6.2. Countermeasures Suggestions for the Development of Livestock Husbandry in Inner Mongolia
Author Contributions
Funding
Data Availability Statement
Conflicts of Interest
References
- Wang, M.L. Development of China’s animal husbandry in the past 40 years of reform and opening up: Achievements, experience and future trend. Issues Agric. Econ. 2018, 60–70. [Google Scholar] [CrossRef]
- Shi, S.; Li, C.X.; Li, M.T. Research progress of accounting methods from “carbon emission” to “carbon footprint” in animal husbandry. China Popul. Resour. Environ. 2017, 27, 36–41. [Google Scholar]
- Dong, H.M.; Lin, R.D.; Yang, Q.C. Preliminary estimation of methane emissions from ruminants and mitigation techniques in China. Rural. Ecol. Environ. 1995, 11, 4–7. [Google Scholar]
- Yao, C.S.; Qian, S.S.; Mao, Y.H.; Li, Z.T. Decomposition of influencing factors and spatial differentiation of changes in carbon emissions from animal husbandry in China. J. Agric. Eng. 2017, 33, 10–19. [Google Scholar]
- Wang, Z.P. Study on Spatial and Temporal Characteristics and Influencing Factors of Greenhouse Gas Emissions from Hog Farming in Jiangxi Province. Master’s Thesis, Jiangxi (Province) University of Finance and Economics, Nanchang, China, 2017. [Google Scholar]
- Ye, X.M.; Du, J.; Kong, X.P.; Wang, L.; Zhu, F.; Han, T. Research progress of carbon emission accounting methods in livestock and poultry industry. Jiangsu Agric. J. Ind. Sci. 2019, 50, 1–8. [Google Scholar]
- Wu, Q.; Zhang, Y.Y.; Zhang, M.Y. Quantitative assessment, spatial and temporal characteristics and dynamic evolution of carbon emissions from animal husbandry in China: 2001–2020. Arid Zone Resour. Environ. 2022, 36, 65–71. [Google Scholar]
- Hu, X.D.; Wang, J.M. Estimation of greenhouse gas emissions from livestock and poultry in China. J. Agric. Eng. 2010, 26, 247–252. [Google Scholar]
- Dabkienė, A.; Baležentis, T.; Dalia Štreimikienė, D. Calculation of the carbon footprint for family farms using the Farm Accountancy Data Network: A case from Lithuania. J. Clean. Prod. 2020, 262, 121509. [Google Scholar] [CrossRef]
- Benaouda, M.; González-Ronquillo, M.; Appuhamy, J.A.D.R.N.; Kebreab, E.; Molina, L.T.; Herrera-Camacho, J.; Ku-Vera, J.C.; Ángeles-Hernández, J.C.; Castelán-Ortega, O.A. Development of mathmatical models to product entric methane emission by cow in Latin America. Livest. Sci. 2020, 241, 104177. [Google Scholar] [CrossRef]
- Guo, J.; Qi, D.S.; Zhang, N.Y.; Sun, L.H.; Hu, R.G. Current situation and peak prediction of greenhouse gas emissions from animal husbandry in China. J. Ind. Environ. Sci. 2017, 36, 2106–2113. [Google Scholar]
- Wang, A.E.; You, M.Q.; Wang, D.H. Study on temporal and spatial characteristics of carbon emissions from hog farming in China. J. Agric. Resour. Environ. 2018, 35, 269–275. (In Chinese) [Google Scholar]
- Li, B.; Du, J.G.; Liu, X.Q. Temporal and spatial characteristics and economic correlation of agricultural carbon emissions in Hubei Province. Chin. J. Agric. Sci. 2019, 52, 439–4319. [Google Scholar]
- Li, Y.B.; Li, G.S.; Zhang, F.H.; Liu, J.L. The relationship between carbon emission and economic growth in animal husbandry: Based on Kyrgyzstan Statistical data of Lin Province. J. Neijiang Norm. Univ. 2021, 36, 91–98. [Google Scholar]
- Zhang, Y.J.; Yan, J.H. The illusion of peaking carbon emissions in China’s beef cow industry: An empirical study based on EKC theory Analysis and test. Probl. Agric. Econ. 2022, 93–105. [Google Scholar] [CrossRef]
- Korkut, P.U.; Suleyman, Y. Is the EKC hypothesis valid in the five highly globalized countries of the European Union? An empirical investigation with smooth structural shifts. Environ. Monit. Assess. 2022, 195, 17. [Google Scholar] [CrossRef]
- Massagony, A.; Budiono. Is the Environmental Kuznets Curve (EKC) hypothesis valid on CO2 emissions in Indonesia? Int. J. Environ. Stud. 2023, 80, 20–31. [Google Scholar] [CrossRef]
- Mikayilov, J.I.; Galeotti, M.; Hasanov, F.J. The impact of economic growth on CO2 emissions in Azerbaijan. J. Clean. Prod. 2018, 197, 1572. [Google Scholar] [CrossRef]
- Wu, X.R.; Zhang, J.B.; Tian, Y.; Xue, L.F. Analysis of China’s agricultural carbon emission reduction potential based on the dual perspective of equity and efficiency. J. Nat. Resour. 2015, 30, 1172–1182. [Google Scholar]
- Zhang, J.X.; Wang, H.L. Regional differences, dynamic evolution and convergence analysis of carbon emissions from China’s animal husbandry industry—Based on the data of animal husbandry industry in 31 provinces (cities) from 1997 to 2017. Jianghan Forum 2020, 63, 41–48. [Google Scholar]
- Zhao, F.F.; Lu, L.W. Empirical test of environmental Kuznets curve under the perspective of environmental governance. Stat. Decis. Mak. 2022, 20, 174–178. [Google Scholar]
- Xu, Y.Y. A Study on the Relationship Between Industrial Environmental Quality and Economic Growth in China—A Validation of the Environmental Kuznets Curve. Master’s Thesis, Guangdong University of Finance and Economics, Guangzhou, China, 2021. [Google Scholar]
- Chen, Y. Research on Carbon Emission Measurement and Sink Enhancement and Emission Reduction Paths in China’s Animal Husbandry Industry. Ph.D. Thesis, Northeast Forestry University, Harbin, China, 2015. [Google Scholar]
- Inner Mongolia Autonomous Region People’s Government. Report on the Economic Development of the Inner Mongolia Autonomous Region; China Agricultural Press: Beijing, China, 2022.
- Wang, Y.X.; Zhang, J.M. China Animal Husbandry Development Report; China Agricultural Press: Beijing, China, 2018. [Google Scholar]


| Livestock Breeds | CH4 Emission Factor (kg/Unit/Year) | N2O Emission Factor (kg/Unit/Year) | |
|---|---|---|---|
| Gastrointestinal Fermentation | Fecal Fermentation | ||
| Cow | 57.4 | 8.5 | 1.195 |
| Hog | 1 | 3.5 | 0.53 |
| Sheep | 5 | 0.16 | 0.33 |
| Poultry | ---- | 0.02 | 0.02 |
| Years | Cow | Sheep | Hog | Poultry |
|---|---|---|---|---|
| 2000 | 0.4506 | 0.5860 | 1.1531 | 0.6509 |
| 2001 | 0.5374 | 0.6105 | 1.1471 | 0.6810 |
| 2002 | 0.3960 | 0.5456 | 1.2297 | 7.4996 |
| 2003 | 0.3638 | 0.6444 | 1.2226 | 1.2996 |
| 2004 | 0.3620 | 0.7113 | 1.2773 | 2.1699 |
| 2005 | 0.3752 | 0.8325 | 1.3738 | 1.6643 |
| 2006 | 0.4024 | 0.8957 | 1.4050 | 1.7675 |
| 2007 | 0.4110 | 0.9626 | 1.2173 | 2.1046 |
| 2008 | 0.4103 | 1.0121 | 1.2682 | 1.5329 |
| 2009 | 0.4436 | 1.0273 | 1.2915 | 1.9829 |
| 2010 | 0.4505 | 1.0231 | 1.3268 | 2.0635 |
| 2011 | 0.4835 | 1.0046 | 1.3229 | 1.8712 |
| 2012 | 0.5063 | 1.0479 | 1.3555 | 2.1228 |
| 2013 | 0.5228 | 1.0309 | 1.3615 | 2.5888 |
| 2014 | 0.5341 | 1.0173 | 1.3893 | 2.1820 |
| 2015 | 0.4864 | 0.9686 | 1.3922 | 2.3466 |
| 2016 | 0.5188 | 1.0845 | 1.4207 | 2.2777 |
| 2017 | 0.5535 | 1.0239 | 1.8176 | 2.1896 |
| 2018 | 0.6087 | 1.0648 | 1.8017 | 1.9423 |
| 2019 | 0.6122 | 1.0807 | 1.7654 | 1.9655 |
| 2020 | 0.5915 | 1.0988 | 1.3894 | 1.9015 |
| 2021 | 0.5602 | 1.0924 | 1.4383 | 1.9394 |
| 2022 | 0.5227 | 1.0774 | 1.4853 | 2.0885 |
| Years | Cow | Sheep | Hog | Poultry |
|---|---|---|---|---|
| 2000 | 340.41 | 3609.27 | 419.84 | 5049.16 |
| 2001 | 339.46 | 3751.66 | 433.00 | 5224.91 |
| 2002 | 355.42 | 3983.03 | 413.49 | 4644.49 |
| 2003 | 421.02 | 4635.11 | 390.53 | 830.13 |
| 2004 | 493.05 | 4935.07 | 432.24 | 2250.43 |
| 2005 | 572.80 | 5456.46 | 474.47 | 1609.96 |
| 2006 | 596.91 | 5242.08 | 519.92 | 1616.91 |
| 2007 | 653.47 | 5277.69 | 382.66 | 991.01 |
| 2008 | 640.67 | 4126.67 | 422.33 | 938.57 |
| 2009 | 678.55 | 4388.38 | 435.46 | 1012.53 |
| 2010 | 649.20 | 4436.63 | 450.69 | 1046.44 |
| 2011 | 653.03 | 4356.33 | 446.35 | 1043.89 |
| 2012 | 623.47 | 4430.42 | 463.80 | 1269.28 |
| 2013 | 627.80 | 4439.22 | 459.59 | 1506.75 |
| 2014 | 641.70 | 4656.75 | 458.67 | 1293.98 |
| 2015 | 642.73 | 5537.76 | 443.07 | 1266.32 |
| 2016 | 663.57 | 4907.88 | 448.39 | 1301.66 |
| 2017 | 635.53 | 5143.45 | 453.19 | 1139.21 |
| 2018 | 641.13 | 5252.63 | 441.86 | 1106.45 |
| 2019 | 643.66 | 5308.22 | 374.00 | 1248.53 |
| 2020 | 679.28 | 5485.58 | 365.96 | 1207.82 |
| 2021 | 745.74 | 5511.25 | 400.88 | 1231.91 |
| 2022 | 807.51 | 5423.08 | 437.36 | 1326.65 |
| Years | Cow | Sheep | Hog | Poultry | Total |
|---|---|---|---|---|---|
| 2000 | 597,189.51 | 760,327.76 | 108,654.31 | 33,425.41 | 1,499,596.99 |
| 2001 | 595,531.65 | 790,324.70 | 112,060.68 | 34,588.87 | 1,532,505.90 |
| 2002 | 623,531.08 | 839,064.05 | 107,010.47 | 30,746.52 | 1,600,352.12 |
| 2003 | 738,616.44 | 976,431.22 | 101,069.41 | 5495.49 | 1,821,612.56 |
| 2004 | 864,982.27 | 1,039,620.79 | 111,862.86 | 14,897.83 | 2,031,363.75 |
| 2005 | 1,004,891.68 | 1,149,456.81 | 122,791.60 | 10,657.93 | 2,287,798.01 |
| 2006 | 1,047,180.29 | 1,104,296.57 | 134,555.01 | 10,703.92 | 2,296,735.79 |
| 2007 | 1,146,406.32 | 1,111,797.12 | 99,032.48 | 6560.50 | 2,363,796.42 |
| 2008 | 1,123,959.41 | 869,323.98 | 109,298.83 | 6213.30 | 2,108,795.53 |
| 2009 | 1,190,414.19 | 924,456.88 | 112,696.27 | 6702.92 | 2,234,270.27 |
| 2010 | 1,138,924.02 | 934,620.50 | 116,638.68 | 6927.43 | 2,197,110.63 |
| 2011 | 1,145,634.41 | 917,704.22 | 115,515.56 | 6910.58 | 2,185,764.76 |
| 2012 | 1,093,775.82 | 933,313.26 | 120,031.01 | 8402.61 | 2,155,522.71 |
| 2013 | 1,101,380.93 | 935,165.91 | 118,941.08 | 9974.69 | 2,165,462.61 |
| 2014 | 1,125,757.62 | 980,990.52 | 118,703.69 | 8566.16 | 2,234,018.00 |
| 2015 | 1,127,573.38 | 1,166,584.52 | 114,666.84 | 8383.04 | 2,417,207.77 |
| 2016 | 1,164,125.26 | 1,033,893.31 | 116,043.93 | 8617.01 | 2,322,679.51 |
| 2017 | 1,114,942.06 | 1,083,520.19 | 117,284.47 | 7541.58 | 2,323,288.29 |
| 2018 | 1,124,757.64 | 1,106,519.06 | 114,352.87 | 7324.73 | 2,352,954.31 |
| 2019 | 1,129,196.15 | 1,118,228.87 | 96,791.34 | 8265.26 | 2,352,481.63 |
| 2020 | 1,191,686.10 | 1,155,591.88 | 94,709.74 | 7995.80 | 2,449,983.51 |
| 2021 | 1,308,280.20 | 1,161,000.94 | 103,748.31 | 8155.28 | 2,581,184.72 |
| 2022 | 1,416,646.40 | 1,142,425.92 | 113,188.91 | 8782.46 | 2,681,043.68 |
| Variables Types | Variables Names | Variables Definition |
|---|---|---|
| Explained variable | E | Using the emission factor method proposed by Zhang Jinxin et al. [20] to estimate the carbon dioxide emissions of Inner Mongolia (10,000 tons) |
| Explaining variable | GDP | Gross regional product of the year (100 million yuan) |
| Control variables | R&D | Expenditure on science and technology in the general public budget (10 thousand yuan) |
| EPE | Expenditure on energy conservation and environmental protection in general public budgets (10 thousand yuan) | |
| GOV | The proportion of financial expenditure in the general public budget of the city to the regional GDP | |
| OPEN | Total import and export trade as a share of regional GDP | |
| P | Rural population (10,000) |
| Year | General Public Budget Expenditure (0.1 Billion Yuan) | Total Import and Export Trade (0.1 Billion Yuan) | Regional GDP (0.1 Billion Yuan) |
|---|---|---|---|
| 2000 | 261.06 | 168.78 | 1539.12 |
| 2001 | 335.98 | 210.90 | 1713.81 |
| 2002 | 413.33 | 248.73 | 1940.94 |
| 2003 | 471.09 | 257.70 | 2388.38 |
| 2004 | 602.75 | 335.09 | 2942.35 |
| 2005 | 734.61 | 416.58 | 3523.70 |
| 2006 | 914.97 | 464.40 | 4161.75 |
| 2007 | 1082.31 | 565.71 | 5166.93 |
| 2008 | 1454.57 | 610.55 | 6242.11 |
| 2009 | 1926.84 | 461.85 | 7104.22 |
| 2010 | 2273.50 | 577.43 | 8199.86 |
| 2011 | 2989.21 | 752.27 | 9458.12 |
| 2012 | 3425.99 | 707.48 | 10,470.14 |
| 2013 | 3686.52 | 731.17 | 11,392.42 |
| 2014 | 3879.98 | 894.04 | 12,158.22 |
| 2015 | 4252.96 | 792.54 | 12,948.99 |
| 2016 | 4512.71 | 772.78 | 13,789.26 |
| 2017 | 4529.93 | 940.86 | 14,898.05 |
| 2018 | 4831.46 | 1034.35 | 16,140.76 |
| 2019 | 5100.91 | 1097.80 | 17,212.53 |
| 2020 | 5270.16 | 1051.63 | 17,258.04 |
| 2021 | 5239.57 | 1236.49 | 21,166.00 |
| 2022 | 5887.70 | 1524.37 | 23,158.65 |
| Variables | Sample Size | Mean | Standard Deviation | Minimum | Maximum |
|---|---|---|---|---|---|
| E | 23 | 2,182,414.325 | 307,585.3135 | 1,499,596.99 | 2,681,043.68 |
| EPE | 23 | 993,233.3913 | 559,472.895 | 146,960 | 1,752,452 |
| GOV | 23 | 0.262978261 | 0.052515253 | 0.1696 | 0.3284 |
| OPEN | 23 | 0.08406087 | 0.025017753 | 0.056 | 0.1281 |
| P | 23 | 1063.426087 | 210.2793428 | 754 | 1371.3 |
| R&D | 23 | 208,296.4783 | 134,453.37 | 22,214 | 429,858 |
| GDP | 23 | 97,814,934.78 | 65,065,510.15 | 15,391,200 | 231,586,500 |
| Variables | Estimators | p-Values | Estimators | p-Values | Estimators | p-Values |
|---|---|---|---|---|---|---|
| C | 5.481287 | 0.161 | 78.32722 | 0.002 | −1120.074 | 0.186 |
| Ln GDP | 0.4257866 | 0.067 | −8.118024 | 0.005 | 193.2589 | 0.175 |
| Ln GDP2 | —— | —— | 0.2505302 | 0.004 | −11.0012 | 0.167 |
| Ln GDP3 | —— | —— | —— | —— | 0.209027 | 0.158 |
| EPE | −0.000000709 | 0.147 | −0.00000101 | 0.019 | −0.000000768 | 0.083 |
| GOV | 6.329177 | 0.007 | 7.434547 | 0.000 | 7.92967 | 0.000 |
| OPEN | 0.4954135 | 0.923 | −5.357042 | 0.246 | −7.5471 | 0.118 |
| P | 0.0004378 | 0.488 | 0.0008997 | 0.103 | 0.0008714 | 0.105 |
| R&D | −0.000000444 | 0.732 | −0.00000258 | 0.049 | −0.00000249 | 0.052 |
| R-squared | 0.7686 | —— | 0.8532 | —— | 0.8690 | —— |
| F-statistic | 11.07 | —— | 15.78 | —— | 14.93 | —— |
| Curve shape | linear type | —— | U type | —— | N type | —— |
| Inflection point | None | —— | 16.201687 | —— | 17.5435 | —— |
Disclaimer/Publisher’s Note: The statements, opinions and data contained in all publications are solely those of the individual author(s) and contributor(s) and not of MDPI and/or the editor(s). MDPI and/or the editor(s) disclaim responsibility for any injury to people or property resulting from any ideas, methods, instructions or products referred to in the content. |
© 2024 by the authors. Licensee MDPI, Basel, Switzerland. This article is an open access article distributed under the terms and conditions of the Creative Commons Attribution (CC BY) license (https://creativecommons.org/licenses/by/4.0/).
Share and Cite
Niu, X.; He, M.; Zhang, Y.; Luan, Z. A Study on the Relationship Between Livestock Carbon Emission and Economic Growth in Inner Mongolia. Sustainability 2024, 16, 10180. https://doi.org/10.3390/su162310180
Niu X, He M, Zhang Y, Luan Z. A Study on the Relationship Between Livestock Carbon Emission and Economic Growth in Inner Mongolia. Sustainability. 2024; 16(23):10180. https://doi.org/10.3390/su162310180
Chicago/Turabian StyleNiu, Xuanqi, Mengyu He, Yaoxin Zhang, and Zhiqiang Luan. 2024. "A Study on the Relationship Between Livestock Carbon Emission and Economic Growth in Inner Mongolia" Sustainability 16, no. 23: 10180. https://doi.org/10.3390/su162310180
APA StyleNiu, X., He, M., Zhang, Y., & Luan, Z. (2024). A Study on the Relationship Between Livestock Carbon Emission and Economic Growth in Inner Mongolia. Sustainability, 16(23), 10180. https://doi.org/10.3390/su162310180