Abstract
Cities are key areas for carbon control and reduction. The study of the decoupling between CO2 emissions and gross domestic product (GDP) and the drivers of CO2 emissions in cities facilitates the reduction of CO2 emissions to safeguard the development of the economy. This paper first calculates the CO2 emissions in Tianjin, China, from 2005 to 2022, then uses the Tapio decoupling index to quantify the decoupling status, and, finally, explores the energy-CO2-emission drivers through the Logarithmic Mean Divisia Index (LMDI) model. The findings indicate that (1) the decrease in CO2 emissions from industrial products and transport is the main reason for the decline. (2) During the period under investigation, the predominant condition observed was a state of weak decoupling. (3) Given the economic-output effect is the primary and substantial driver of energy CO2 emissions, it is essential to harmonize the interplay between economic-development approach and CO2 emissions to foster sustainable development in Tianjin. The industrial structure plays the most critical role in hindering the reduction of CO2 emissions; therefore, optimizing industrial structure can help achieve carbon reduction and control targets. These findings enrich the study of CO2 emission factors and can also interest urban policymakers.
1. Introduction
Climate change has become a pivotal issue in global environmental debates [1]. Despite the widespread acknowledgment of the need for carbon reduction and the ratification of the Paris Agreement in 2015, where nations pledged their intended nationally determined contributions (INDCs), the influence of greenhouse gases (GHGs) on economic growth has paradoxically intensified in recent years [2]. According to the recent information provided by NOAA’s Global Monitoring Laboratory, the global atmospheric CO2 concentration hit an unprecedented peak of 419.3 ppm in 2023. Combating climate change necessitates a significant and ongoing reduction in GHG emissions. Embracing a low-carbon approach has been increasingly recognized as a crucial element for achieving sustainable development [3,4].
The climate group argues that low-carbon development should emphasize the increased adoption of renewable energy and the process of decoupling economic growth from carbon emissions [5]. Detaching CO2 emissions from economic expansion serves as a potent strategy for mitigating emission levels [6]. To reach a double-win outcome, which entails meeting emission reduction goals without sacrificing sustainable economic progress, it is imperative to understand the dynamics between economic expansion and the rise in CO2 emissions, and decoupling analysis serves as an effective method to measure the correlation between the two [5]. Since a pure decoupling model cannot analyze the drivers, much of the existing literature combines it with decomposition analysis. This integrated approach is typically employed to initially assess the decoupling status between economic growth and CO2 emissions, followed by a deeper examination of the factors that impact CO2 emissions [7,8,9]. These studies tend to analyze a particular industry, such as electricity [10], metal industries [11], trade export [8], etc., or take multiple study areas at an administrative scale as cases [5,9], and rarely with a single city as the study object.
Cities are the driving force behind more than 80% of the world’s economic output; also, they are responsible for at least 75% of the world’s CO2 emissions [12]. The growth of CO2 emissions in a city is closely related to its GDP growth [13], and accurately identifying CO2 emission drivers is crucial for proposing specific carbon-reduction policies and adopting targeted carbon-reduction measures. This study takes Tianjin, China, a representative industrial city, as a case study. Firstly, the IPCC inventory method is deployed to quantify CO2 emissions in the case area from 2005 to 2022; secondly, the Tapio decoupling model is applied to examine the relationship between CO2 and economic decoupling, and then, the LMDI method is utilized to dissect the drivers of energy CO2 emissions. The research contributions are outlined as follows: (1) The LMDI method is employed to analyze the impact of various factors, including socioeconomic and natural factors, on carbon emissions, thereby offering a basis for CO2-emission-reduction measures. (2) This article emphasizes the importance of the relationship between economic-development methods and CO2 emissions, and proposes that coordinating the relationship between the two is crucial for achieving sustainable development in Tianjin.
2. Literature Review
2.1. Decoupling Theory
The Organization for Economic Co-operation and Development (OECD) characterizes the concept of decoupling as a metric that reflects the interplay between economic activity and environmental pressures. There are various models used to analyze the decoupling relationship, and the common ones include the OECD decoupling factor model, the Tapio elastic analysis method, the Vehmas decoupling model, the econometric analysis method, and the Lu Jongwu decoupling model. The advantages and disadvantages of each decoupling model and their related references are listed below (Table 1).

Table 1.
Common decoupling evaluation models.
Decoupling carbon emissions represents an aspirational process aimed at progressively diminishing the correlation between economic growth and GHGs, aiming to eliminate this linkage entirely [18]. In line with decoupling principles, conventional approaches to gauge the decoupling of carbon emissions from economic operations encompass the Tapio decoupling method and the OECD decoupling factor model [8]. The Tapio decoupling model extends the OECD decoupling methodology by combining elasticity coefficients with raw indices to classify decoupling states into eight categories [10]. The Tapio framework’s meticulous and robust features make it widely used [19]. Zheng et al. applied the Tapio decoupling model to quantitatively assess the decoupling of CO2 emissions and economic growth in China [20]. Zhang and Sharifi explored the economic-development–CO2-emission decoupling in China’s provincial capital cities [21]. Rajabi Kouyakhi used the Tapio decoupling model to analyze the decoupling of CO2 from the economy in Middle Eastern countries [22]. Ozdemir used the Tapio decoupling model to analyze the decoupling analysis of CO2 emissions from major fossil-fuel-power generation in Turkey [23]. Zhao et al. used the Tapio decoupling model to analyze the decoupling of the family sector [24]. It can be seen that the Tapio decoupling model has strong applicability and is suitable for decoupling analysis in different fields. Therefore, this research employs the Tapio decoupling model to examine the interplay between CO2 emissions and economic expansion in the study area.
2.2. CO2 Driver Analysis
Understanding how drivers affect CO2 emission levels is critical to decreasing carbon emissions [25,26,27]. In general, the selection of CO2 emission drivers focuses on quantifiable variables, such as urbanization rate, population, industrial structure, GDP, energy consumption, and energy structure [28]. Zuo et al. (2020) utilized CiteSpace to sift through the Web of Science database, extracting 500 pertinent articles from the past half-decade for a co-occurrence analysis [29]. Their research revealed that the exponential decomposition analysis (IDA), structural decomposition analysis (SDA), STIRPAT model, and log-mean score index (LMDI) are the dominant methodologies for examining the factors influencing CO2 emissions. The characteristics of these models are shown in Table 2.
Table 2.
Mainstream models for CO2-emission-driver analysis.
Table 2 shows that the IDA model is simple in principle and friendly in data requirements. Prominent organizations, including the International Energy Agency, the World Bank, and the European Union, accept IDA and prove it to be a powerful technology [38]. Although IDA techniques include many types, the LMDI models are distinguished by their theoretical foundation, adaptability, user-friendliness, and ease with which their results can be interpreted, which are the benefits that give them an edge, together with the residual-free and zero-value solving features that give them a definite advantage and thus the most widespread use [23]. Scholars have used LMDI analysis to deconstruct the drivers of the transportation industry [28], power sector [39], fossil energy consumption [40], industrial CO2 emission [41], logistics industry [42], manufacturing sector [43], and energy-related carbon emissions [44].
In summary, the LMDI method is a comprehensive decomposition technique that demands low data requirements and the characteristic of residual-free decomposition results, which is suitable for time series analysis and applicable to several fields. In this research, the LMDI method is deployed to investigate the decomposition of energy-CO2-emission drivers.
3. Materials and Methods
3.1. Study Area
Tianjin (38°34′~40°15′ N, 116°43′~118°4′ E) is a municipality directly governed by the central government of China and functions as a provincial-level administrative region, as well as the largest port city and the largest industrial city in northern China (Figure 1). Tianjin’s population is growing steadily, with an urbanization rate of 85.11% in 2022. The economy has an excellent industrial structure, dominated by the tertiary industry; carbon-sink resources are scarce, with carbon-sink land accounting for only about 3% of the total land area. Since 2010, Tianjin has been included in the first batch of low-carbon pilot cities in China and has accumulated rich experience in constructing low-carbon cities. Therefore, Tianjin has proposed “Achieving carbon peaking by 2030”. The choice of Tianjin, a city supported by industrial industries and with a high level of urbanization and few carbon sinks, is conducive to investigating CO2 drivers in industrial cities to minimize the problems caused by CO2 emissions and hastening the attainment of a peak in CO2 emissions levels.

Figure 1.
Location of Tianjin.
3.2. Methods
This research was carried out following the framework depicted in Figure 2, which is divided into three main components:

Figure 2.
Research framework.
- The IPCC inventory method was used to account for CO2 in Tianjin from 2005 to 2022 in four sources: energy activities, industrial processes, waste disposal, and land-use change and forestry.
- Analysis of CO2 and economic decoupling using the Tapio decoupling model.
- Analysis of the drivers of energy CO2 emissions using the LMDI model.
3.3. CO2 Emission Accounting
As there are no official statistics on CO2 emissions in Tianjin, this research drew upon the findings of Yang et al. (2023) to calculate the CO2 emissions [45]. The CO2 emissions in the study come from four sources: energy activities, industrial processes, waste disposal, and land-use change and forestry, where CO2 sources are derived from energy activities, industrial processes, and waste disposal and land-use change and forestry are CO2 sinks. The accounting specifics include the following components (Figure 3).
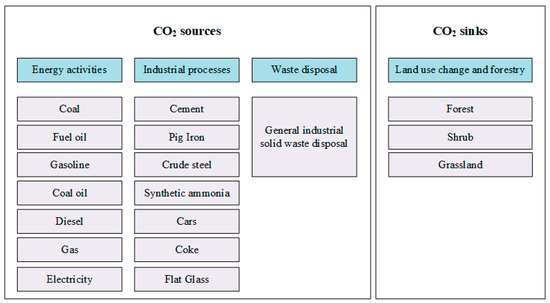
Figure 3.
Tianjin CO2 emission accounting inventory.
The heart of the IPCC inventory method involves, for CO2 emissions, each component (C) is calculated by multiplying the activity data (AD) by the emission coefficient (EC), which can be expressed as
3.3.1. Energy Activities
The activity data multiplied by the emission coefficient for the fuel species can be the core of the CO2 accounting methodology for energy activities. The resulting CO2 emissions are accumulated according to the fuel-variety CO2 emissions. The formula for CO2 emissions from energy activities is
where denotes the CO2 emissions from energy consumption; represents the count of energy types (Figure 3); signifies the consumption of the i-th energy type; is the carbon emission factor associated with the i-th energy type; and 44/12 is the conversion factor of carbon to CO2 (this conversion factor is also applied consistently hereinafter).
3.3.2. Industrial Processes
It is difficult for publicly available data to meet the requirements for accounting for CO2 emissions from industrial processes in the “Guidelines for the Preparation of Provincial Greenhouse Gas Inventories (Trial)”. The method of multiplying industrial product output by an emission coefficient is a method that both solves the data problem and estimates industrial-product CO2. The formula is
where is the CO2 emissions from industrial processes; is the number of industrial product categories (Figure 3); is the production output of the i-th product; and is the CO2 emission coefficient specific to the manufacturing process of the i-th product.
3.3.3. Waste Disposal
The waste-disposal-CO2-emission accounting model is as follows:
where is the CO2 emissions from general-waste disposal; denotes the quantity of general-industrial-solid-waste disposal; is the carbon emission coefficient associated with the disposal of general industrial solid waste.
3.3.4. Land-Use Change and Forestry
Yang and Huang (2021) have provided green space data [46]. We extracted forest, grassland, and shrub data for 2005–2022 from Yang and Huang’s study to account for the CO2 absorbed by green space, and the calculation formula is
where represents CO2 emissions from green spaces; is the count of land types (Figure 3); is the area of the i-th land type; and is the carbon emission coefficient for the i-th land type.
3.4. Tapio Decoupling Model
The Tapio decoupling framework categorizes the interplay between environmental pressures and economic expansion into eight distinct types (Figure 4), and according to Tapio (2005) [47], decoupling indicators can be defined as
where signifies the decoupling index, O and T representing the initial and final periods, respectively; and are the increments in CO2 emission and GDP of Tianjin from the base period O to the end period T; and are the CO2 emissions in years T and O, respectively; and and correspond to the GDP values in years T and O, respectively.
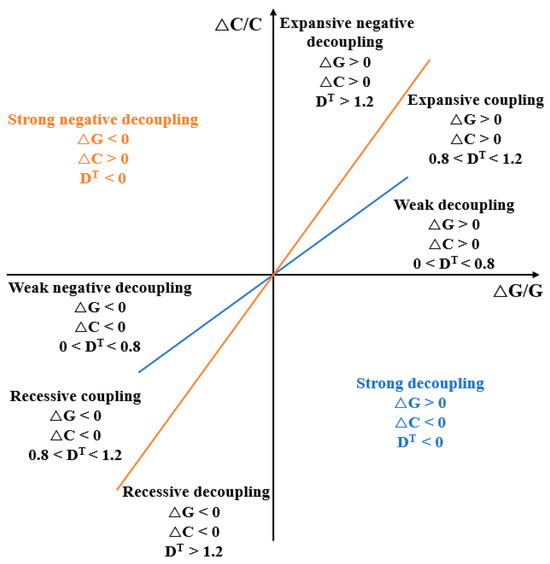
Figure 4.
The decoupling statuses of the Tapio decoupling model.
3.5. Decomposition of CO2 Emission Drivers Based on the LMDI Model
Introducing other drivers based on Kaya’s constant equation LMDI is a widely used method for the decomposition analysis of CO2 emission drivers. Japanese scholar Yoichi Kaya proposed the Kaya constant equation, which employs a straightforward mathematical expression to connect CO2 emissions from human activities to drivers, such as population, economy, and policy, and has strong explanatory power for fluctuations in carbon emissions [48,49]. The basic formula is as follows:
where C represents CO2 emissions; P signifies the population size; G represents GDP; and E indicates energy consumption.
Shichun et al. (2012) advanced the introduction of industry-energy-consumption factors based on model [50] (7):
where j is the carbon emission sector, C represents CO2 emissions, represents the CO2 emissions of the j-th industrial sector of the i-th energy source, P is the population, G is GDP, is the gross product of the j-th industrial sector, is the energy consumption from the j-th industrial sector, and E is the energy consumption; represents GDP per capita, represents the industrial structure, and represents energy intensity, reflecting the energy-intensity effect; and represents energy structure and represents the carbon emission coefficient of the i-th energy source in the j-th industry.
Applying an additive decomposition to assess the change in energy-related CO2 emissions from to over the period O to T, the contribution of the six factors to the change in CO2 emissions is expressed as
The coefficient in the above equation species, when , , when , . is the carbon emission factor for various energy sources, which is constant; is always 0. Therefore, in the actual estimation,
Thus, the drivers of energy CO2 emissions are decomposed into population-size effect, economic-output effect, industrial-structure effect, energy-intensity effect, and energy-structure effect.
3.6. Data Sources
Data on socioeconomic development and energy consumption were sourced from the “Tianjin Statistical Yearbook (2006–2023)”, “Tianjin Territorial Spatial Master Plan (2021–2035)”, and “Outline of the 14th Five-Year Plan for National Economic and Social Development and Vision 2035 of Tianjin”, while land-use information was derived from the research findings of Yang and Huang (2021) [46].
4. Results
4.1. CO2 Accounting Results
4.1.1. CO2 Emission Profile
From 2005 to 2022, Tianjin witnessed a rise in CO2 emissions from 115.4 million tons to 148.5 million tons, peaking at 161.86 million tons in 2013. The emissions grew at an average annual rate of 1.84%, with the most significant increase of 12.12% occurring between 2006 and 2007. During 2005–2013, Tianjin’s CO2 emissions showed an upward trend, followed by a decline from 2013 to 2017. This reduction can be attributed primarily to decreased emissions from industrial products and transportation sectors, as illustrated in Figure 5.
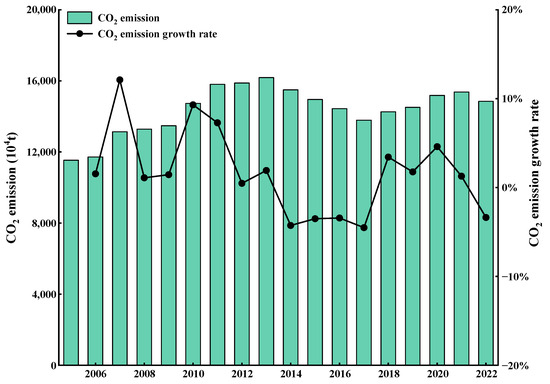
Figure 5.
CO2 emissions in Tianjin from 2005 to 2022.
4.1.2. Sectoral CO2 Emissions
From Tianjin’s sectoral CO2 emission map from 2005 to 2022 (Figure 6), we can see that CO2 emissions from energy activities have been Tianjin’s primary source of CO2 emissions, accounting for more than 90% of CO2 sources yearly. The emissions from industrial production processes rank as the second major contributor, representing approximately 10% of the total emissions. CO2 emissions in energy consumption and industrial production processes are the main reasons for the change in Tianjin’s CO2 emissions. Land-use change and forestry are major carbon sinks, absorbing about 10% of CO2 emissions yearly.
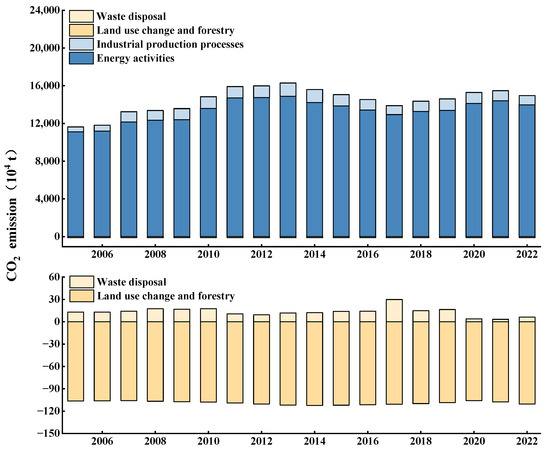
Figure 6.
Tianjin’s sectoral CO2 emissions from 2005 to 2022.
4.2. The Decoupling Relationship between CO2 and the Economy
Analyzing the decoupling of CO2 from the economy is crucial for assessing the environmental sustainability of economic development. The annual decoupling states determined during the study are shown in Figure 7. From 2005 to 2022, Tianjin’s economy preserved the continuous growth state, so there was no strong negative decoupling, weak negative decoupling, recessive coupling, or recessive decoupling state. The decoupling state can be analyzed in three stages.
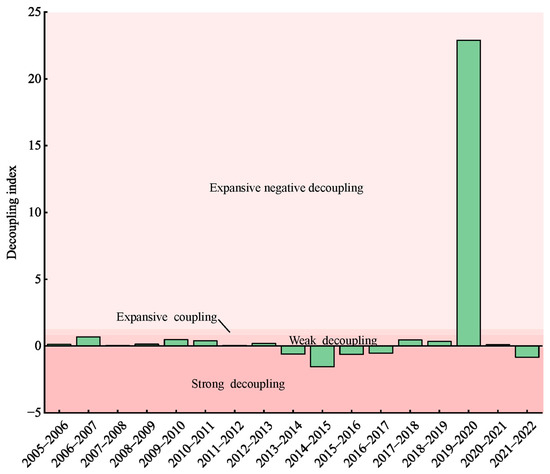
Figure 7.
Decoupling index and its decoupling status of Tianjin from 2005 to 2022.
From 2005 to 2013, CO2 emissions showed an upward trend. During this timeframe, the relationship between CO2 emissions and economic growth in Tianjin was characterized by a weak decoupling, meaning that while emissions were increasing, they were doing so at a slower pace than the economy.
From 2013 to 2017, CO2 emissions experienced a decline, and the decoupling state in this period was a strong decoupling state. This was due to the decreasing trend of CO2 emissions during this period, and the decreasing CO2 emissions eased the environmental pressure.
From 2019 to 2020, there was a very abrupt expansive negative decoupling, with a decoupling index as high as 22.89. This state of affairs occurred because the COVID-19 pandemic in 2020 had a huge impact on Tianjin’s economy. Prevention and control measures for the pandemic may have led to a slowdown in production and consumption activities, thereby the GDP growth rate in that year is significantly lower than in other years.
Overall, the state that occurred most frequently during the study was the weak decoupling state. However, between 2019 and 2020, Tianjin experienced an expansive negative decoupling state. This phenomenon suggests that the rate of increase in CO2 emissions exceeded the rate of economic growth during that period.
4.3. Five Drivers of Energy CO2 Emissions
The energy-CO2-emission results were selected for the energy-CO2-emission-driver analysis.
Among the five energy-CO2-emission drivers, population size, economic output, and energy structure positively impact the rise in energy-related CO2 emissions. In contrast, industrial structure and energy intensity have a negative impact, acting as restraining factors. Among them, the industrial structure plays a positive promoting role in individual years, and the energy structure plays a negative inhibiting role in particular years. Generally, the five drivers of energy CO2 emissions contribute positively each year and show an increasing trend. The combination of various factors contributes to the energy CO2 emissions, increasing the energy CO2 emissions in Tianjin yearly. The trends of individual factors’ contribution values and the five factors’ contribution values are shown below (Figure 8). A thorough analysis of each factor’s influence is provided in the subsequent section.
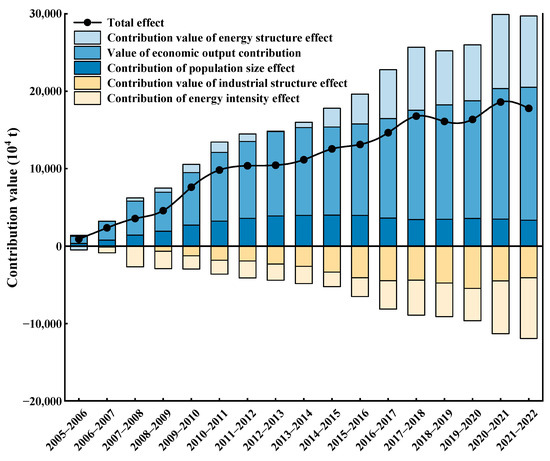
Figure 8.
Contribution value of factors influencing CO2 emissions in Tianjin.
4.3.1. Population-Size Effect
The population-size effect is Tianjin’s third-largest positive driver of CO2 emissions (average annual effect of 28.17 million tons). In the 18 years from 2005 to 2022, the effect of population size on CO2 emissions shows an upward and downward trend, bringing a cumulative effect of 506.98 million tons of CO2, with a cumulative effect of 27% contribution to CO2 emissions. The population of Tianjin shows a trend of rising and then falling, with the population of Tianjin growing from 10.43 million to 13.63 million from 2005 to 2022. As depicted in Figure 9, the growth trend of CO2 emission contribution of population-size effect is consistent with the population growth trend. Population growth determines the increase in CO2 emissions that contribute to the population-size effect, which cannot be controlled in the short term. The “Tianjin Territorial Spatial Master Plan (2021–2035)” limits the population to 20 million in 2035, and the contribution of future population growth to CO2 emissions should not be underestimated.
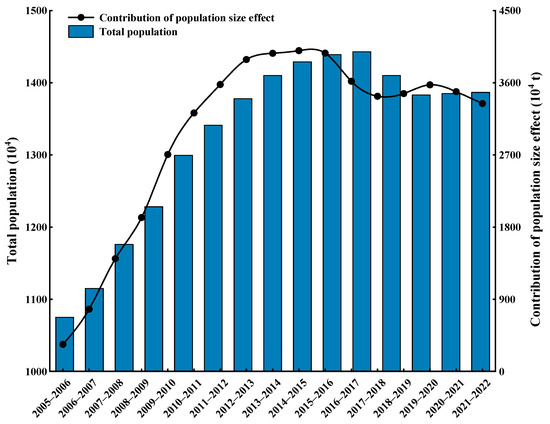
Figure 9.
Population and contribution of population-size effect in Tianjin.
4.3.2. Economic-Output Effect
The economic-output effect is Tianjin’s number one driver of CO2 emissions (average annual effect of 97.09 million tons). From 2005 to 2022, the role of economic-output effect on CO2 emissions increased yearly, bringing a cumulative effect of 174.76 million tons of CO2, with a cumulative effect of 94% contribution to CO2 emissions. Tianjin’s economy continued to grow at a high rate year-round, and although the economic growth rate had slowed in the last 20 years, the economic growth rate was almost above 10% in 2015 and before. The high-growth economy has become a major driver of CO2 emissions. As seen in Figure 10, the growth trend in the value of economic-output contribution is consistent with the growth trend in GDP per capita. Achieving sustained economic growth without exacerbating CO2 emissions necessitates robust technological advancements. These improvements should aim to reduce the economy’s reliance on resource-intensive consumption and substantial investment. Additionally, it is crucial to bolster the capacity for scientific and technological innovation to become a driving force for economic expansion. In this regard, Tianjin has issued the “Tianjin Three-Year Action Plan for Science and Technology Innovation (2020–2022)” to enhance independent-innovation and original-innovation curation capacity and promote green economic growth.
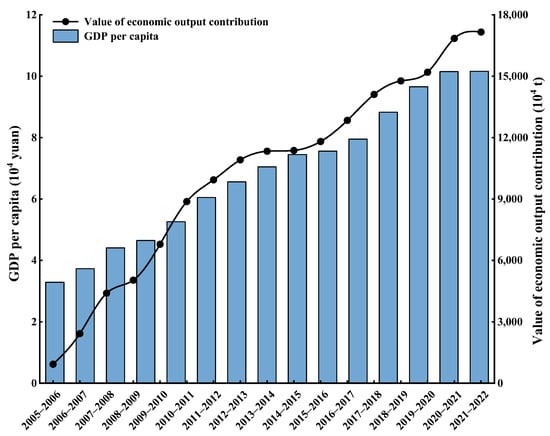
Figure 10.
GDP per capita and value of economic-output contribution in Tianjin.
4.3.3. Industrial Structure
Industrial structure has the most significant inhibiting effect of CO2 emission reduction. From 2005 to 2022, the inhibitory effect of the improvement of industrial structure in Tianjin on CO2 emissions increased year by year (average annual effect of negative 25.46 million tons), bringing a cumulative emission reduction of 458.23 million tons of CO2 and contributing 25% to the cumulative effect of CO2 emissions. As depicted in Figure 11, the emission reduction rate of the industrial-structure effect is faster than the decrease rate of industrial value added as a proportion of GDP, which shows that the CO2-emission-reduction dividend brought by industrial restructuring in Tianjin has already appeared.

Figure 11.
Industrial value added as a percentage of GDP and contribution value of industrial-structure effect.
4.3.4. Energy Intensity
From 2005 to 2022, the suppression of CO2 emissions by decreasing energy intensity showed an increasing trend (average annual effect of negative 28.55 million tons), bringing a cumulative reduction of 513.85 million tons and contributing 28% to the cumulative effect of CO2 emissions. As depicted in Figure 12, the decline in the contribution of energy-intensity effects is the reduction rate of industrial-energy intensity. Therefore, further improvement of the regional technological level in Tianjin will bring a more obvious reduction effect.
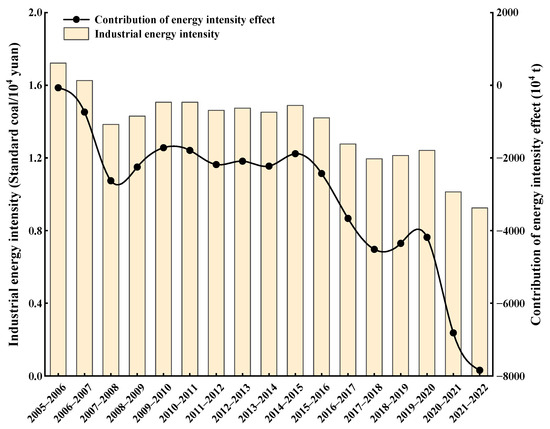
Figure 12.
Energy intensity and contribution of energy-intensity effect in Tianjin.
4.3.5. Energy Structure
The influence of energy structure on CO2 emissions in Tianjin is characterized by a positive contribution (average annual effect of 32.47 million tons). It is bringing a cumulative effect of 584.41 million tons of CO2, with a cumulative effect of 31% contribution to CO2 emissions. From 2005 to 2010, the proportion of industrial coke consumption to industrial energy consumption in Tianjin was on the rise, and from 2011 to 2022, it was stable at 15% or below. In the previous period, the trend of the change in the contribution value of the energy-structure effect was consistent with the trend of changes in the proportion of industrial coke consumption to industrial energy consumption. During the phase when the proportion of industrial coke consumption to industrial energy consumption remained stable, the contribution of the energy structure to CO2 emissions grew rapidly (Figure 13). This suggests that if the improvement of the energy structure is stagnant, there is no way to curb the growth of CO2 emissions; on the contrary, the improvement of the energy structure significantly affects the curbing of CO2 emission growth.
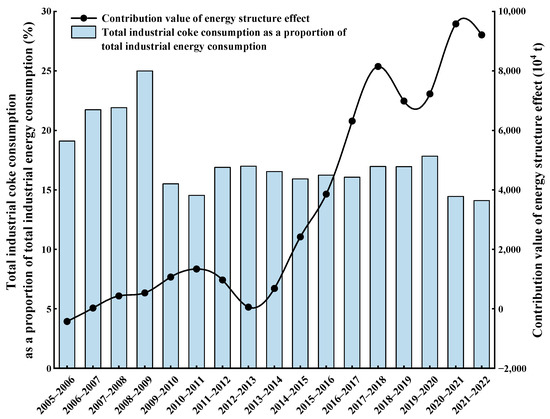
Figure 13.
Industrial coke consumption as a proportion of industrial energy consumption and contribution value of energy-structure effect in Tianjin.
5. Discussion
The results of the decoupling relationship between CO2 and the economy in Tianjin confirm the findings of Du et al. (2021); that is, the decoupling performance of Chinese cities has improved [51]. What differs, however, is that this study focused on a particular type of city decoupling-state analysis and found that the industrial city of Tianjin has improved but cannot maintain a strong decoupling state. This indicates that Tianjin still needs to further promote the optimization and upgrading of the industrial structure to achieve a more stable and lasting decoupling state.
Similar to the findings of Chontanawat et al. (2020) [43] and Yasmeen et al. (2020) [52], economic growth is the number-one driver of CO2 emissions [52]. Economic growth requires large amounts of energy consumption [53], and CO2 emissions from energy combustion and industrial processes accounted for nearly 89% of GHGs from the energy sector in 2021 [54]. Therefore, changing the economic-development mode to an intensive growth mode that mainly relies on improving resource-use efficiency to achieve economic growth and includes industrial structure, quality, efficiency, ecological balance, and environmental protection is an effective way to reduce CO2.
6. Conclusions and Policy Implications
Firstly, the IPCC inventory method accounts for CO2 emissions in Tianjin from 2005 to 2022. Secondly, the Tapio decoupling model was applied to examine the decoupling relationship between CO2 and economics, and then, the LMDI method was used to deconstruct the drivers of energy CO2 emissions. The following findings have been established:
- (1)
- From 2005 to 2022, CO2 emissions in Tianjin show a trend of increasing, then decreasing, and then increasing again, with a downward trend between 2013 and 2017. This is mainly due to the reduction in emissions from industrial products and the transportation sector. CO2 from energy consumption consistently constituted the majority of Tianjin’s CO2 emissions, exceeding 90% annually, while emissions stemming from industrial production processes made up approximately 10% of the annual emissions.
- (2)
- The decoupling index of CO2 throughout the study period shows three states, weak decoupling, expansive negative decoupling, and strong decoupling, and overall, the weak decoupling state is the most prevalent. From 2019 to 2020, there was an expansive negative decoupling state, signifying that the rate of increase in CO2 emissions in Tianjin surpassed the rate of economic expansion.
- (3)
- The contribution of all five drivers to CO2 emissions is positively contributing each year and shows an increasing trend. Economic output emerges as a predominant force driving CO2 emissions from 2005 to 2022. Therefore, Tianjin needs to harmonize the dynamics of economic growth with CO2 emission trends to foster sustainable development. Among the drivers, the industrial structure exerts the most evident mitigating influence on CO2 emissions. Therefore, refining the overall industrial framework and recalibrating its internal components can be instrumental in attaining CO2 emission reduction objectives while maintaining rapid economic progress.
Author Contributions
F.Y.: Conceptualization, Investigation, Methodology, Software, and Writing—Original Draft. Q.L.: Formal Analysis and Visualization. All authors have read and agreed to the published version of the manuscript.
Funding
This research received no external funding.
Institutional Review Board Statement
Not applicable.
Informed Consent Statement
Not applicable.
Data Availability Statement
The raw data supporting the conclusions of this article will be made available by the authors on request.
Conflicts of Interest
The authors declare no conflicts of interest.
References
- Althor, G.; Watson, J.E.M.; Fuller, R.A. Global mismatch between greenhouse gas emissions and the burden of climate change. Sci. Rep. 2016, 6, 20281. [Google Scholar] [CrossRef] [PubMed]
- Wang, Q.; Yang, X. New insight into aggressive Intended Nationally Determined Contributions in China—What lessons China should learn from Germany to reduce production-based carbon emission. J. Clean. Prod. 2021, 279, 123522. [Google Scholar] [CrossRef]
- Al-Amin, A.Q.; Rasiah, R.; Chenayah, S. Prioritizing climate change mitigation: An assessment using Malaysia to reduce carbon emissions in future. Environ. Sci. Policy 2015, 50, 24–33. [Google Scholar] [CrossRef]
- Zhu, B.; Ye, S.; Jiang, M.; Wang, P.; Wu, Z.; Xie, R.; Chevallier, J.; Wei, Y.-M. Achieving the carbon intensity target of China: A least squares support vector machine with mixture kernel function approach. Appl. Energy 2019, 233–234, 196–207. [Google Scholar] [CrossRef]
- Gao, C.; Ge, H.; Lu, Y.; Wang, W.; Zhang, Y. Decoupling of provincial energy-related CO2 emissions from economic growth in China and its convergence from 1995 to 2017. J. Clean. Prod. 2021, 297, 126627. [Google Scholar] [CrossRef]
- Raza, M.Y.; Lin, B. Analysis of Pakistan’s electricity generation and CO2 emissions: Based on decomposition and decoupling approach. J. Clean. Prod. 2022, 359, 132074. [Google Scholar] [CrossRef]
- Chen, W.; Yan, S. The decoupling relationship between CO2 emissions and economic growth in the Chinese mining industry under the context of carbon neutrality. J. Clean. Prod. 2022, 379, 134692. [Google Scholar] [CrossRef]
- Wang, Q.; Han, X. Is decoupling embodied carbon emissions from economic output in Sino-US trade possible? Technol. Forecast. Soc. Chang. 2021, 169, 120805. [Google Scholar] [CrossRef]
- Ozturk, I.; Majeed, M.T.; Khan, S. Decoupling and decomposition analysis of environmental impact from economic growth: A comparative analysis of Pakistan, India, and China. Environ. Ecol. Stat. 2021, 28, 793–820. [Google Scholar] [CrossRef]
- Wang, J.; Li, Z.; Wu, T.; Wu, S.; Yin, T. The decoupling analysis of CO2 emissions from power generation in Chinese provincial power sector. Energy 2022, 255, 124488. [Google Scholar] [CrossRef]
- Wang, M.; Feng, C. Towards a decoupling between economic expansion and carbon dioxide emissions in resources sector: A case study of China’s 29 non-ferrous metal industries. Resour. Policy 2021, 74, 102249. [Google Scholar] [CrossRef]
- Shan, Y.; Fang, S.; Cai, B.; Zhou, Y.; Li, D.; Feng, K.; Hubacek, K. Chinese cities exhibit varying degrees of decoupling of economic growth and CO2 emissions between 2005 and 2015. One Earth 2021, 4, 124–134. [Google Scholar] [CrossRef]
- Guan, D.; Meng, J.; Reiner, D.M.; Zhang, N.; Shan, Y.; Mi, Z.; Shao, S.; Liu, Z.; Zhang, Q.; Davis, S.J. Structural decline in China’s CO2 emissions through transitions in industry and energy systems. Nat. Geosci. 2018, 11, 551–555. [Google Scholar] [CrossRef]
- OECD. Indicators to Measure Decoupling of Environmental Pressure from Economic Growth; OECD: Paris, France, 2002. [Google Scholar]
- Vehmas, J.; Kaivo-Oja, J.; Luukkanen, J. Global Trends of Linking Environmental Stress and Economic Growth; Turku School of Economics and Busies Administration: Turku, Finland, 2003; Volume 18, pp. 55–60. [Google Scholar]
- Charlier, D.; Fizaine, F. Decoupling gross domestic product and consumption of raw materials: A macro-panel analysis. Sustain. Prod. Consum. 2023, 36, 194–206. [Google Scholar] [CrossRef]
- Heming, W.; Qiang, Y.; Zhongwu, L. Decoupling Analysis of China’s Resource Consumption and Economic Growth over the Period 1998–2008. Resour. Sci. 2011, 33, 1757–1767. (In Chinese) [Google Scholar]
- Liu, H.; Zhang, Z. Probing the carbon emissions in 30 regions of China based on symbolic regression and Tapio decoupling. Environ. Sci. Pollut. Res. 2022, 29, 2650–2663. [Google Scholar] [CrossRef]
- Wang, Q.; Jiang, X.; Li, R. Comparative Decoupling Analysis of Energy-Related Carbon Emission from Electric Output of Electricity Sector in Shandong Province, China. Energy 2017, 127, 78–88. [Google Scholar] [CrossRef]
- Zheng, J.; Wu, S.; Li, S.; Li, L.; Li, Q. Impact of global value chain embedding on decoupling between China’s CO2 emissions and economic growth: Based on Tapio decoupling and structural decomposition. Sci. Total Environ. 2024, 918, 170172. [Google Scholar] [CrossRef]
- Zhang, Z.; Sharifi, A. Analysis of decoupling between CO2 emissions and economic growth in China’s provincial capital cities: A Tapio model approach. Urban Clim. 2024, 55, 101885. [Google Scholar] [CrossRef]
- Rajabi Kouyakhi, N. CO2 emissions in the Middle East: Decoupling and decomposition analysis of carbon emissions, and projection of its future trajectory. Sci. Total Environ. 2022, 845, 157182. [Google Scholar] [CrossRef]
- Ozdemir, A.C. Decomposition and decoupling analysis of carbon dioxide emissions in electricity generation by primary fossil fuels in Turkey. Energy 2023, 273, 127264. [Google Scholar] [CrossRef]
- Zhao, L.; Zhao, T.; Yuan, R. Drivers of household decarbonization: Decoupling and decomposition analysis. J. Clean. Prod. 2021, 289, 125154. [Google Scholar] [CrossRef]
- Xiong, C.; Chen, S.; Gao, Q.; Xu, L. Analysis of the influencing factors of energy-related carbon emissions in Kazakhstan at different stages. Environ. Sci. Pollut. Res. 2020, 27, 36630–36638. [Google Scholar] [CrossRef] [PubMed]
- Ren, Y.; Ren, X.; Hu, J. Driving factors of China’s city-level carbon emissions from the perspective of spatial spillover effect. Carbon Manag. 2019, 10, 551–566. [Google Scholar] [CrossRef]
- Lu, C.; Li, W. A comprehensive city-level GHGs inventory accounting quantitative estimation with an empirical case of Baoding. Sci. Total Environ. 2019, 651, 601–613. [Google Scholar] [CrossRef] [PubMed]
- Liu, M.; Zhang, X.; Zhang, M.; Feng, Y.; Liu, Y.; Wen, J.; Liu, L. Influencing factors of carbon emissions in transportation industry based on CD function and LMDI decomposition model: China as an example. Environ. Impact Assess. Rev. 2021, 90, 106623. [Google Scholar] [CrossRef]
- Zuo, Z.; Guo, H.; Cheng, J. An LSTM-STRIPAT model analysis of China’s 2030 CO2 emissions peak. Carbon Manag. 2020, 11, 577–592. [Google Scholar] [CrossRef]
- Wang, H.; Ang, B.W.; Su, B. Assessing drivers of economy-wide energy use and emissions: IDA versus SDA. Energy Policy 2017, 107, 585–599. [Google Scholar] [CrossRef]
- Song, C.; Zhao, T.; Wang, J. Spatial-temporal analysis of China’s regional carbon intensity based on ST-IDA from 2000 to 2015. J. Clean. Prod. 2019, 238, 117874. [Google Scholar] [CrossRef]
- Zhang, C.; Zhao, Y.; Shi, C.; Chiu, Y.-H. Can China achieve its water use peaking in 2030? A scenario analysis based on LMDI and Monte Carlo method. J. Clean. Prod. 2021, 278, 123214. [Google Scholar] [CrossRef]
- Xu, S.; Zhang, L.; Liu, Y.; Zhang, W.; He, Z.; Long, R.; Chen, H. Determination of the factors that influence increments in CO2 emissions in Jiangsu, China using the SDA method. J. Clean. Prod. 2017, 142, 3061–3074. [Google Scholar] [CrossRef]
- Ribeiro, L.C.D.S.; Filho, J.F.D.S.; Santos, G.F.D.; Freitas, L.F.D.S. Structural decomposition analysis of Brazilian greenhouse gas emissions. World Dev. Sustain. 2023, 2, 100067. [Google Scholar] [CrossRef]
- Yu, S.; Zhang, Q.; Hao, J.L.; Ma, W.; Sun, Y.; Wang, X.; Song, Y. Development of an extended STIRPAT model to assess the driving factors of household carbon dioxide emissions in China. J. Environ. Manag. 2023, 325, 116502. [Google Scholar] [CrossRef] [PubMed]
- Ziyuan, C.; Yibo, Y.; Simayi, Z.; Shengtian, Y.; Abulimiti, M.; Yuqing, W. Carbon emissions index decomposition and carbon emissions prediction in Xinjiang from the perspective of population-related factors, based on the combination of STIRPAT model and neural network. Environ. Sci. Pollut. Res. 2022, 29, 31781–31796. [Google Scholar] [CrossRef]
- Alajmi, R.G. Factors that impact greenhouse gas emissions in Saudi Arabia: Decomposition analysis using LMDI. Energy Policy 2021, 156, 112454. [Google Scholar] [CrossRef]
- Ang, B.W. LMDI decomposition approach: A guide for implementation. Energy Policy 2015, 86, 233–238. [Google Scholar] [CrossRef]
- Liao, C.; Wang, S.; Fang, J.; Zheng, H.; Liu, J.; Zhang, Y. Driving forces of provincial-level CO2 emissions in China’s power sector based on LMDI method. Energy Procedia 2019, 158, 3859–3864. [Google Scholar] [CrossRef]
- Yang, P.; Liang, X.; Drohan, P.J. Using Kaya and LMDI models to analyze carbon emissions from the energy consumption in China. Environ. Sci. Pollut. Res. 2020, 27, 26495–26501. [Google Scholar] [CrossRef]
- Wen, L.; Li, Z. Provincial-level industrial CO2 emission drivers and emission reduction strategies in China: Combining two-layer LMDI method with spectral clustering. Sci. Total Environ. 2020, 700, 134374. [Google Scholar] [CrossRef]
- Quan, C.; Cheng, X.; Yu, S.; Ye, X. Analysis on the influencing factors of carbon emission in China’s logistics industry based on LMDI method. Sci. Total Environ. 2020, 734, 138473. [Google Scholar] [CrossRef]
- Chontanawat, J.; Wiboonchutikula, P.; Buddhivanich, A. An LMDI decomposition analysis of carbon emissions in the Thai manufacturing sector. Energy Rep. 2020, 6, 705–710. [Google Scholar] [CrossRef]
- Wang, C.; Wu, K.; Zhang, X.; Wang, F.; Zhang, H.; Ye, Y.; Wu, Q.; Huang, G.; Wang, Y.; Wen, B. Features and drivers for energy-related carbon emissions in mega city: The case of Guangzhou, China based on an extended LMDI model. PLoS ONE 2019, 14, e0210430. [Google Scholar] [CrossRef] [PubMed]
- Yang, F.; Shi, L.; Gao, L. Probing CO2 emission in Chengdu based on STRIPAT model and Tapio decoupling. Sustain. Cities Soc. 2023, 89, 104309. [Google Scholar] [CrossRef]
- Yang, J.; Huang, X. The 30 m annual land cover dataset and its dynamics in China from 1990 to 2019. Earth Syst. Sci. Data 2021, 13, 3907–3925. [Google Scholar] [CrossRef]
- Tapio, P. Towards a theory of decoupling: Degrees of decoupling in the EU and the case of road traffic in Finland between 1970 and 2001. Transp. Policy 2005, 12, 137–151. [Google Scholar] [CrossRef]
- Kaya, Y. Impact of Carbon Dioxide Emission Control on GNP Growth: Interpretation of Proposed Scenarios; IPCC Energy and Industry Subgroup, Response Strategies Working Group: Geneva, Switzerland, 1990. [Google Scholar]
- Kaya, Y.; Yokobori, K. Environment, Energy, and Economy: Strategies for Sustainability; United Nations University Press: Tokyo, Japan, 1997. [Google Scholar]
- Shichun, X.; Rong, X.; Zhengxia, H. Influential Factors and Policy Implications of Carbon Emissions for Energy Consumption in China. Resour. Sci. 2012, 34, 2–12. (In Chinese) [Google Scholar]
- Du, X.; Shen, L.; Wong, S.W.; Meng, C.; Yang, Z. Night-time light data based decoupling relationship analysis between economic growth and carbon emission in 289 Chinese cities. Sustain. Cities Soc. 2021, 73, 103119. [Google Scholar] [CrossRef]
- Yasmeen, H.; Wang, Y.; Zameer, H.; Solangi, Y.A. Decomposing factors affecting CO2 emissions in Pakistan: Insights from LMDI decomposition approach. Environ. Sci. Pollut. Res. 2020, 27, 3113–3123. [Google Scholar] [CrossRef]
- Komarova, A.V.; Filimonova, I.V.; Kartashevich, A.A. Energy consumption of the countries in the context of economic development and energy transition. Energy Rep. 2022, 8, 683–690. [Google Scholar] [CrossRef]
- International Energy Agency. Global Energy Review CO2 Emissions in 2021; International Energy Agency: Paris, France, 2022. [Google Scholar]
Disclaimer/Publisher’s Note: The statements, opinions and data contained in all publications are solely those of the individual author(s) and contributor(s) and not of MDPI and/or the editor(s). MDPI and/or the editor(s) disclaim responsibility for any injury to people or property resulting from any ideas, methods, instructions or products referred to in the content. |
© 2024 by the authors. Licensee MDPI, Basel, Switzerland. This article is an open access article distributed under the terms and conditions of the Creative Commons Attribution (CC BY) license (https://creativecommons.org/licenses/by/4.0/).