Article

Potential Reduction in Carbon Emissions in the Transport of Aggregates by Switching from Road-Only Transport to an Intermodal Rail/Road System

by
Francisco Javier López-Acevedo
1,
María Josefa Herrero
1,*,
José Ignacio Escavy Fernández
2 and
José González Bravo
3
1
Facultad de Ciencias Geológicas, Universidad Complutense de Madrid, Calle José Antonio Nováis, 12, 28040 Madrid, Spain
2
ETSI Caminos, Canales y Puertos, Universidad Politécnica de Madrid, Calle Profesor Aranguren s/n, 28040 Madrid, Spain
3
SODIRA, Calle Doctor Esquerdo, 136, 28007 Madrid, Spain
*
Author to whom correspondence should be addressed.
Sustainability 2024, 16(22), 9871; https://doi.org/10.3390/su16229871
Submission received: 9 October 2024 / Revised: 9 November 2024 / Accepted: 11 November 2024 / Published: 12 November 2024

Abstract

:
Aggregates are the second-most consumed product in the world after water. This geological resource is used as building and construction material, and its production in quarries and delivery to customers generates several environmental problems. Their transport from quarries to consumption points, almost entirely done by truck, also generates impacts such as an increase in traffic and noise and the emission of greenhouse gases and other pollutants. Transportation and storage of goods account for 15% of greenhouse gas emissions in Europe and will increase significantly by 2050. To mitigate this, the European Union suggested shifting 30% of long-distance road freight to cleaner alternatives, such as rail or waterborne transport. This approach neglects the enormous volume of short-distance freight movement and its impact on achieving the goal of reducing greenhouse gas emissions. In this study, the hypothesis to test is whether the use of an intermodal rail/road transport mode, instead of just roads, for the transport of some products can help reduce global CO2 emissions even for short distances. To test this, this study investigates the carbon emissions (and transport cost reduction) generated by rail/road intermodal aggregate transport for short distances in the Madrid region (Spain), rather than the currently used direct truck transport. An analysis of variables, such as aggregate supply, demand locations and amounts, and road and rail networks, using a geographical information system provides the associated carbon emissions of the different transport alternatives. To obtain a reduction in CO2 emissions, this study proposes the establishment of intermodal transfer facilities near consumption centers, where materials are primarily transported by rail, with road transport limited to the final delivery to consumption areas. The results anticipate a notable decrease in carbon emissions in aggregate transport and allow the establishment of more efficient and environmentally friendly rail/road intermodal transport that would help to meet the goals of reducing climate change while making the use of aggregates more environmentally friendly.

1. Introduction

The average global atmospheric temperatures are increasing, and there is a broad scientific consensus on the direct link of this global warming with greenhouse gas (GHG) emissions from human activity [1]. In 2021, a total of 3311 million tons of anthropogenic carbon equivalent GHG were emitted in the European Union, and approximately 15% of these emissions were produced by transportation and storage [2]. In Europe, 75% of continental freight transportation is carried out by road, 7% by inland waterways, and approximately 18% by rail [3]. The activity of road freight transport, which is key to making most of the necessary goods available to society, is highly dependent on oil products and, therefore, is inexorably associated with the release of GHG [4,5,6]. This means that there is a significant challenge in achieving the drastic reduction in carbon emissions proposed by governments, while transportation energy use is expected to double from now to 2050 [7]. Solutions are needed to reconcile these opposing trends.
Among various freight transport methods (airplane, truck, train, and ship) road transport by trucks is the second-least energy efficient, measured by the energy consumed per ton of goods moved per kilometer [8]. Although factors such as load, technology, and other variables can influence each mode of transport efficiency, airplanes are generally the least efficient, followed by trucks, trains, and finally ships. Inland freight shipping requires navigable rivers or canals, which is a limiting factor in areas with a dry climate or mountainous topography such as Spain. This makes rail transport the most environmentally friendly inland mode of transport of goods in most cases in this kind of country. The advantage of rail transport in terms of energy consumption is due to the higher weight transported per trip compared to those by trucks. Furthermore, trains produce lower GHG emissions per ton-km, not only due to their higher energy efficiency but also because in many cases the energy that propels trains is electricity, and a portion of it can be generated from renewable sources [9].
Recognizing the need to reduce GHG emissions, in 2011, the European Union published the Transport White Paper entitled “Roadmap to a Single European Transport Area” [10], in which it is indicated that one of the main measures to reduce GHG emissions is to shift 30% of long-distance road freight (over 300 km) to other cleaner transport alternatives such as rail or waterborne transport by 2030, increasing to 50% by 2050. This strategy was updated in 2020 by the Sustainable and Smart Mobility Strategy, aligned with the European Green Deal Agreement, aiming to reduce emissions by 90% by 2050 [11]. However, in Europe, more than 50% of the road transport of goods travel distances of less than 50 km, and more than 75% travel less than 150 km. For these shorter distances, the White Paper states that transport will rely on road transport but, at the same time, recognizes that improvement in engine efficiency and the use of cleaner fuels will not be sufficient to achieve the desired reduction in GHG emissions in transport [10]. Therefore, only shifting from road to rail freight transport for long distances seems too simplistic and limited in impact. Based on this, the hypothesis of this study is to test the use of intermodal rail/road transport instead of just road for the transport of some products and establish if this change can help reduce global CO2 emissions even for the transport of goods over short distances.
It seems worth exploring the suitability of intermodal transport [12,13] over short distances of certain products such as aggregates, a heavy and bulky construction material that is transported in large quantities over short distances. Aggregates are one of the most consumed products in the world (second in tonnage after water) [14,15,16,17], with the aggregates sector being the largest in terms of material extraction volume among non-energy industries [18]. They are used as loose material and in the manufacture of concrete and mortars in the construction industry [19,20]. Their high volume employment, together with their low price, makes aggregates a typical high-place-value product, with most of its value based on the distance between the production and demand locations [21]. Global Market Insights (GMIs) estimated that the size of the global aggregates market in 2022 will have exceeded 450 billion dollars and will almost double in the next 10 years [22]. In the case of Spain, the consumption of aggregates in 2020 was 140 million tons; 2.5% were generated by recycling and industrial processes [23], and 97.5% were obtained from sand and gravel deposits or from quarries (natural aggregates) and were transported by road over a distance of less than 100 km.
The case study in this research is the market of aggregates in the Madrid area (Spain), where the transport distances of aggregates from quarries to demand areas are progressively increasing year by year, leading to a corresponding increase in GHG emissions [24]. This study evaluates the impact of shifting the transportation of aggregates that are almost entirely transported by road to intermodal rail and road systems over short distances. Of the four main modes of freight transport, air transport is not economic for low-price bulk materials such as aggregates [25], and environmentally, it is worse than road transport. There are no inland waterways in central Spain; therefore, the only possible improvement of the mode of transport would be a shift from unimodal (direct truck transportation from the quarry to the consumption point) to an intermodal mode of transport including rail and truck.
This work fills a gap in assessing the viability of the use of intermodal rail and road freight transportation for short distances (<100 km) to reduce GHG emissions and to test its economic viability. Based on the results of this study, authorities and policymakers would take the necessary measures to promote this transition.
To carry out the most exhaustive analysis, computer vision software created by the authors has been used to record all the aggregate quarries in the study area. This allows obtaining an updated and accurate record of the location of the aggregate quarries that can be considered active production centers to satisfy the demand.
This study is grounded in a comprehensive review of existing literature to assess the current state of research. Subsequently, the necessary data, including quarry locations, transport networks, and production and demand values, were gathered and prepared for geospatial analysis. Using this information, a detailed data analysis was conducted, calculating the total distances traveled in 2020 to meet the demand for aggregates in the province of Madrid. This analysis provided estimates of GHG emissions and the associated economic costs of material transportation. Furthermore, a simulation was developed to explore the impact of intermodal transport. Intermodal terminals were strategically placed within the province, and the shift from road to rail transport was assessed in terms of its influence on CO2 emissions and transport costs (Figure 1).
The document is organized in the standard sections for scientific papers. The methodology section explains in detail how the data were obtained and made useful for the study and how the CO2 emissions and costs were estimated. The results section shows the main figures obtained for distances, emissions and costs, while the discussion section shows the key findings and how they match or not with other related published research. This section also discusses the strengths and main limitations of intermodality in this context and the importance of the role that authorities must play to promote this change in the mode of transportation. The conclusions section distills the main conclusions of this work.

2. Methodology

This study analyzes the CO2 emissions and costs related to the transport of aggregates from their extraction sites to consumption points in the Madrid province (central Spain). Specifically, a comparison will be established between the economic and environmental footprint of two transport modes: road transport and combined rail and road transport.

2.1. Literature Review

In order to analyze the availability of previous studies related to the switch from unimodal to intermodal transport for short travel distances, a three-stage literature review in the Scopus database was performed [26]. The first stage consisted of the identification of all available literature in the Scopus database with the keywords “intermodal” and “railroad”. A total of 910 records were obtained. The second stage was the manual screening of all records obtained based on titles and abstracts, keeping only the potentially interesting papers dealing with the reduction in carbon emissions by railroad intermodal freight transport over short distances. Only 16 papers were found to be potentially interesting according to their title or abstract. Phase three consisted of the corpus analysis of the documents. Only 12 works were kept: two deal with the transport of aggregates in general [24,27], two works study the emissions and general characteristics of the different means of transport [8,25], two manuscripts appear to focus on the history of Zero-Kilometer building materials [28,29], and six publications studied the potential benefits of switching from more-polluting to less-polluting transport modes or a combination of them (intermodality) [9,30,31,32,33,34]. None of them focuses on the use of intermodal rail/road transport for short distances (<100 km), and only Pinto et al. [33] take into account short distances for freight transport by intermodal rail/road transport as part of a more general study. Following the search in the Scopus database, a new search in Researchgate© and in the literature included in the selected articles identified only a couple of papers as being of interest for the analysis [9,30,31,32,33,34]. The main conclusion, at this point, is that there is a gap in the research on the potential benefits of intermodality in freight transport for short distances, confirming the interest of the present research.

2.2. Data Sources and Preparation

Different types of geographical data were used for this study. The location of the quarries was obtained mainly from the Mineral Resources Database (BDMIN) of the Spanish Geological Survey [35]. The population and towns used for the consumption points, administrative limits, rail network geometries, and road geometries were obtained from the Spanish National Geographic Institute [36].
All this downloaded information was unified and standardized in a database, and all data were projected in the European Terrestrial Reference System 1989 coordinate system (ETRS89), with a datum of 30N. This coordinate system is the official spatial reference system of Spain [37].

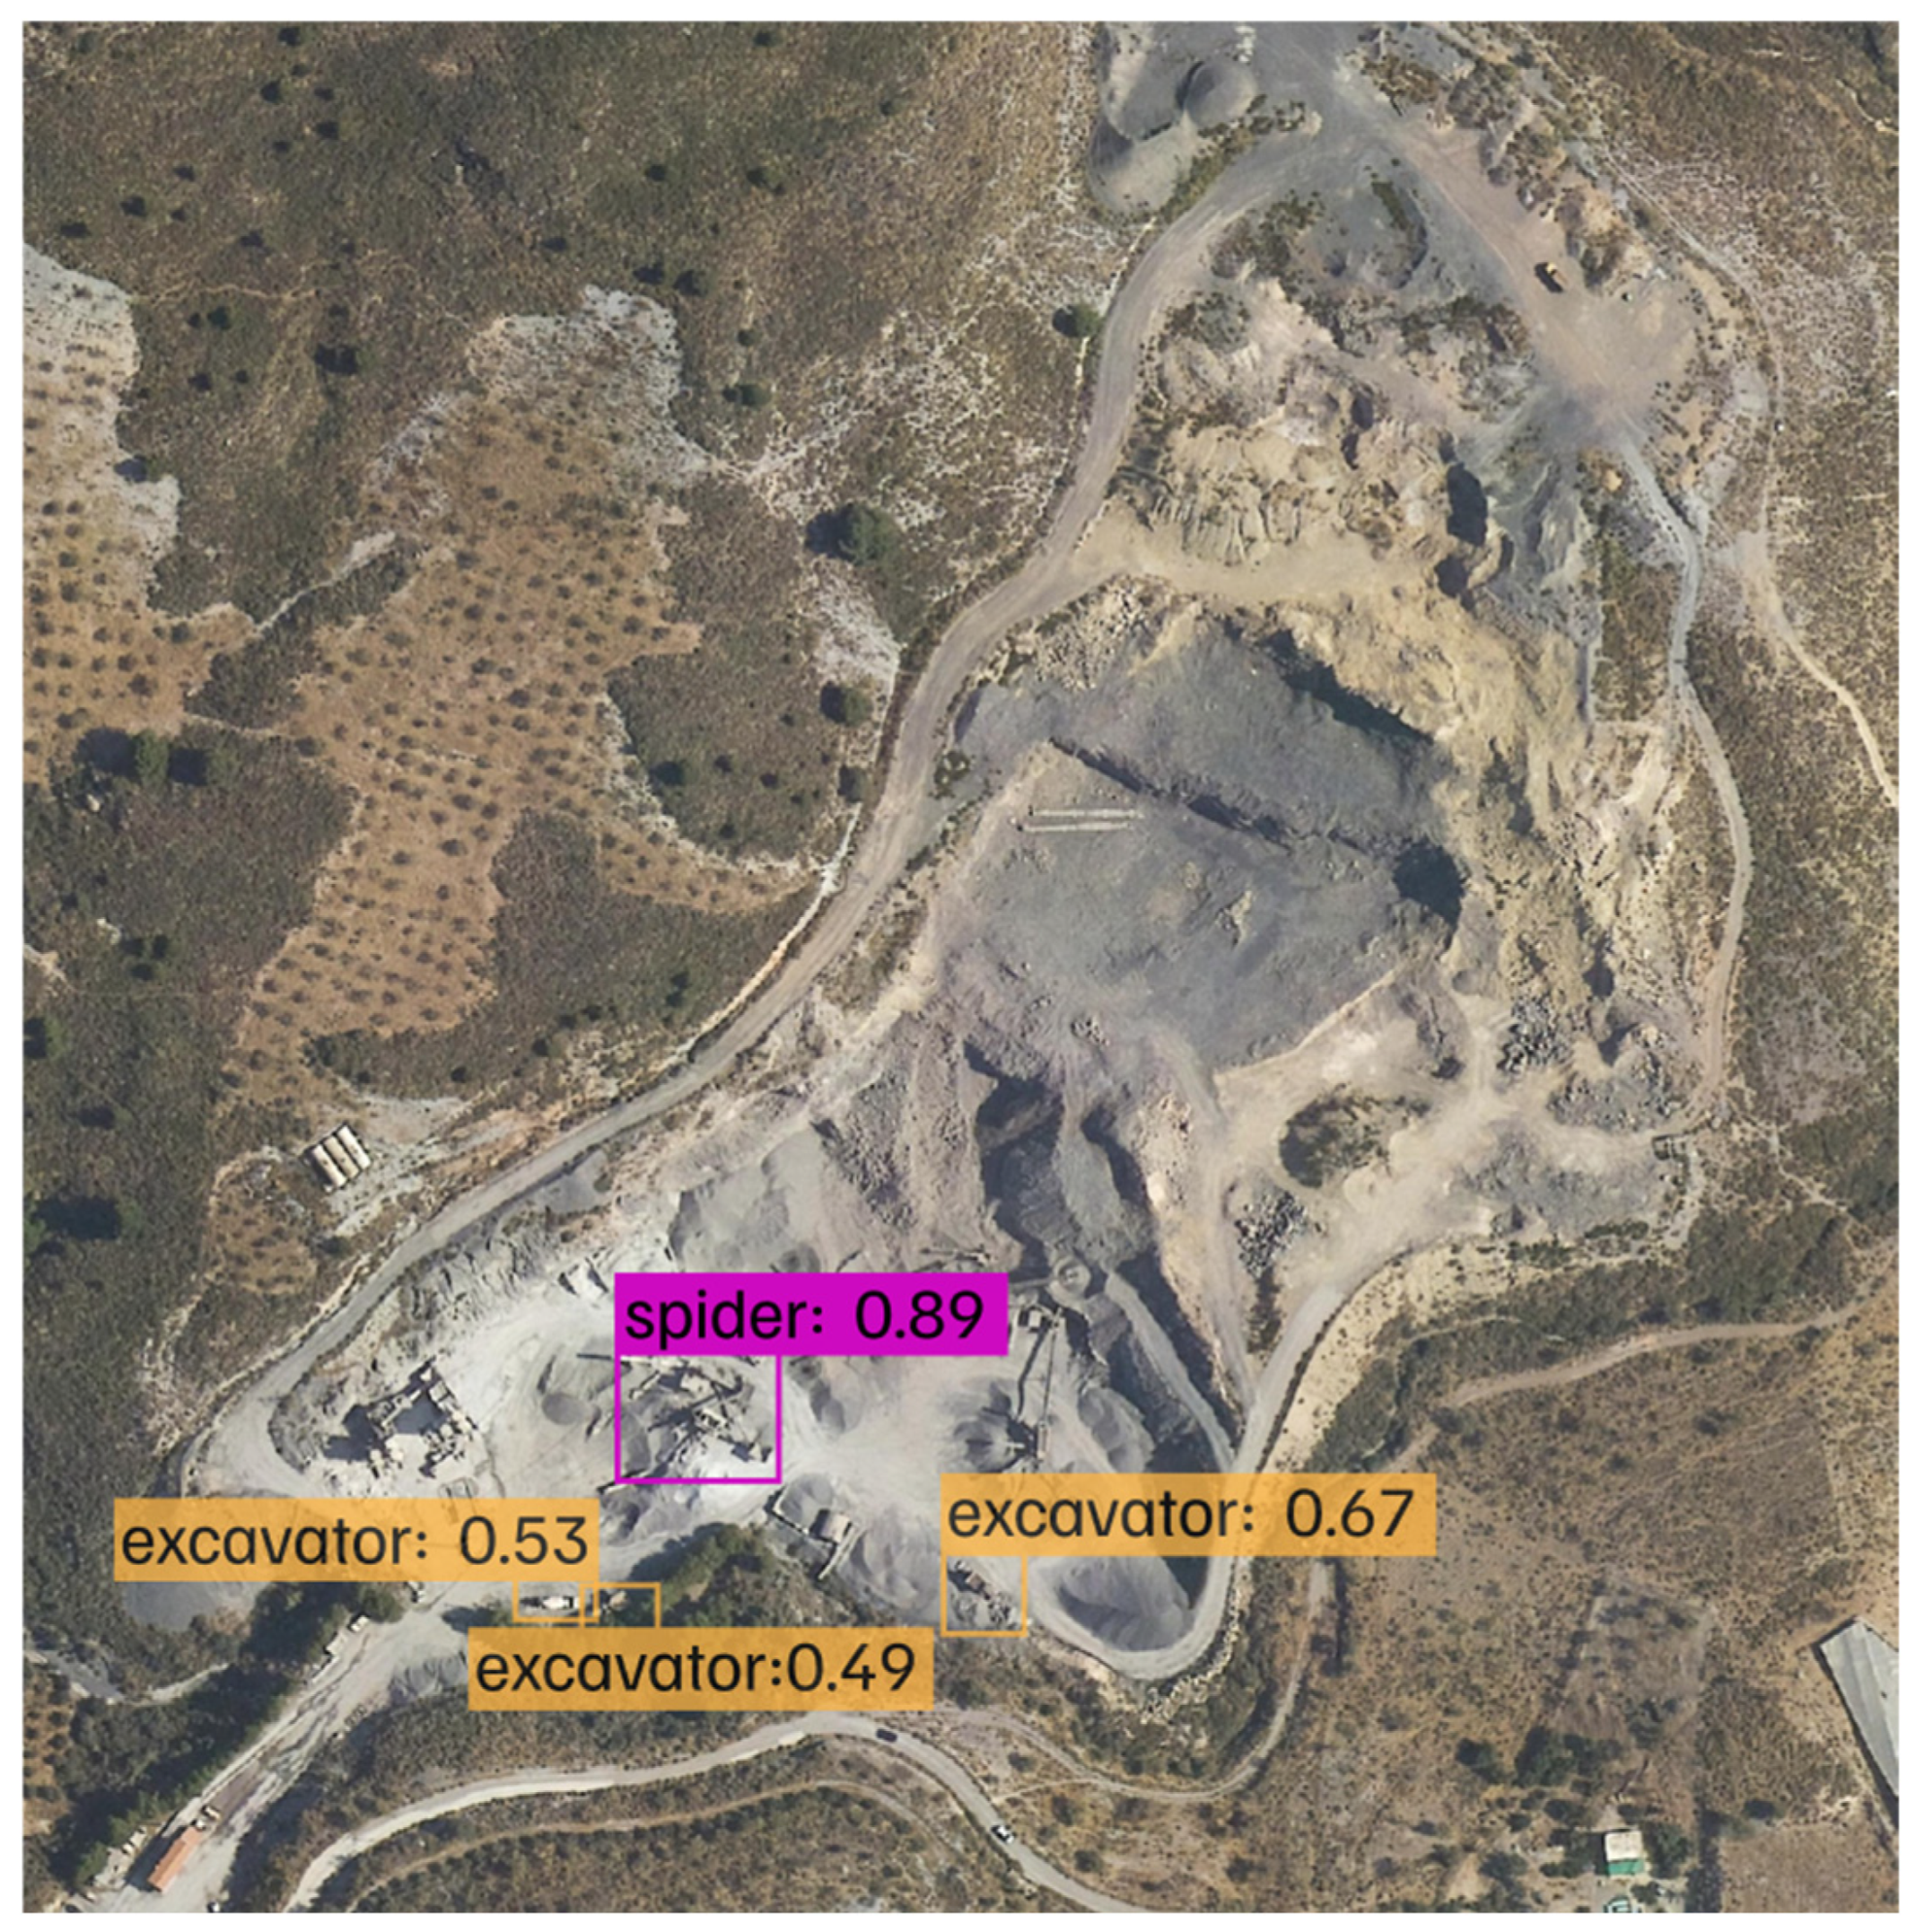
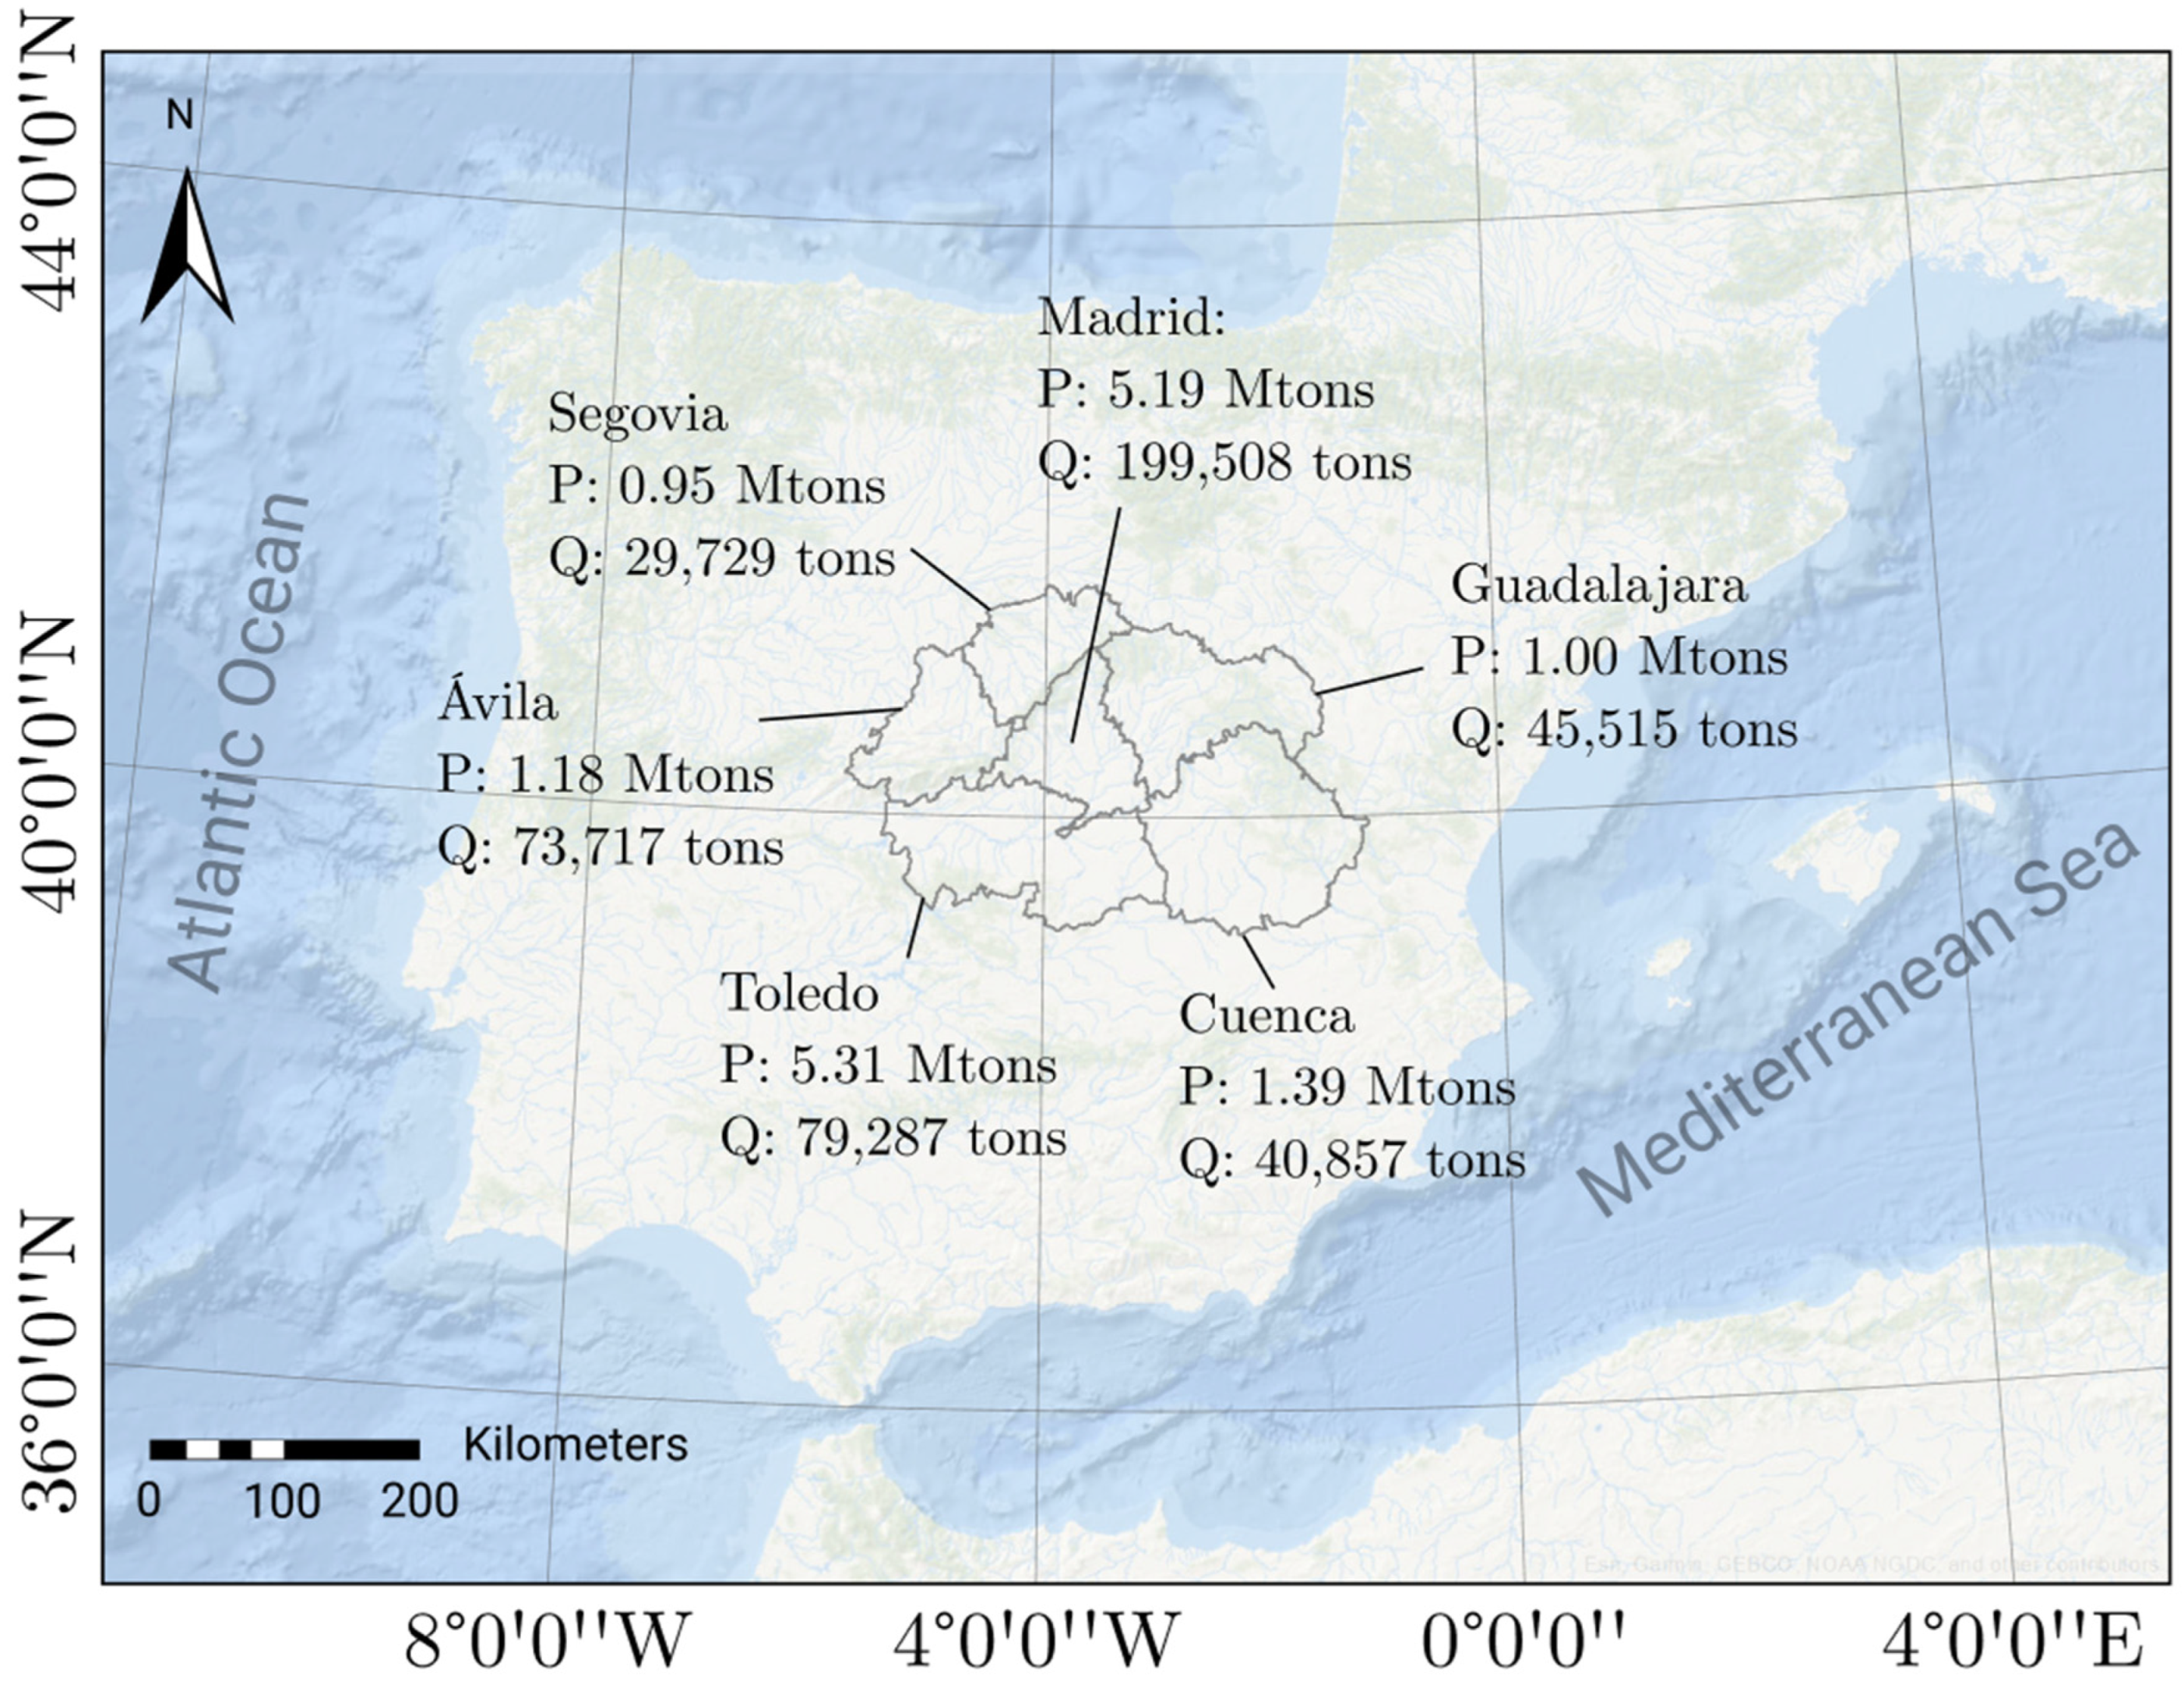
2.2.1. Location of the Quarries

Publicly available datasets relating to the location of quarries are not sufficiently actualized since they include quarries that are no longer operational and lack data on the most recently opened ones [16]. For this purpose, a quarry detection software based on artificial vision and machine learning was used [17]. This led to the development of an image analysis of the Madrid province and the provinces bordering it to update the operational quarries database. This software automatically detects quarries in satellite imagery, obtaining their perimeters, and checks for characteristic objects such as bulldozers, trucks, aggregate-crushing and -classifying facilities, etc. (Figure 2). Each of these objects within the quarry is detected with a percentage confidence level as it is recognized (the higher the better), which assesses whether the object is considered valid or not when screening the results.

2.2.2. Road Network

Based on the geometries of the Madrid Province road system and the neighboring provinces [36], the road system was filtered to remove all secondary and dirt roads, leaving only highways and main roads. A topological analysis of the lines and connection links was carried out to verify the integrity of the road geometries. This verification proved that there were many inaccuracies, poor connections, and junctions that made these geometries unusable. Therefore, a manual reconstruction of the road network was carried out until an interconnected network was achieved. In the five provinces surrounding Madrid, only the roads near active quarries were digitized. Subsequently, a road network was generated using the Geometry Network extension for ArcGIS Desktop 10.5 [38].

2.2.3. Rail Network

In the case of the railway network, freight transport can only be made on some of the lines, unlike road transport, which has no limitations. Due to this, the potential lines for freight transportation in each province were filtered from the downloaded railway geometries.
To discern the lines that can be used for freight transport, the Spanish state-owned railway company (Renfe Mercancías, Madrid, Spain) was contacted. Knowing these routes, a railway network was digitized in ArcGIS using the downloaded railway data as a base. Similarly to the road network, only those railway lines close to active quarries were digitized in the surrounding Madrid provinces.

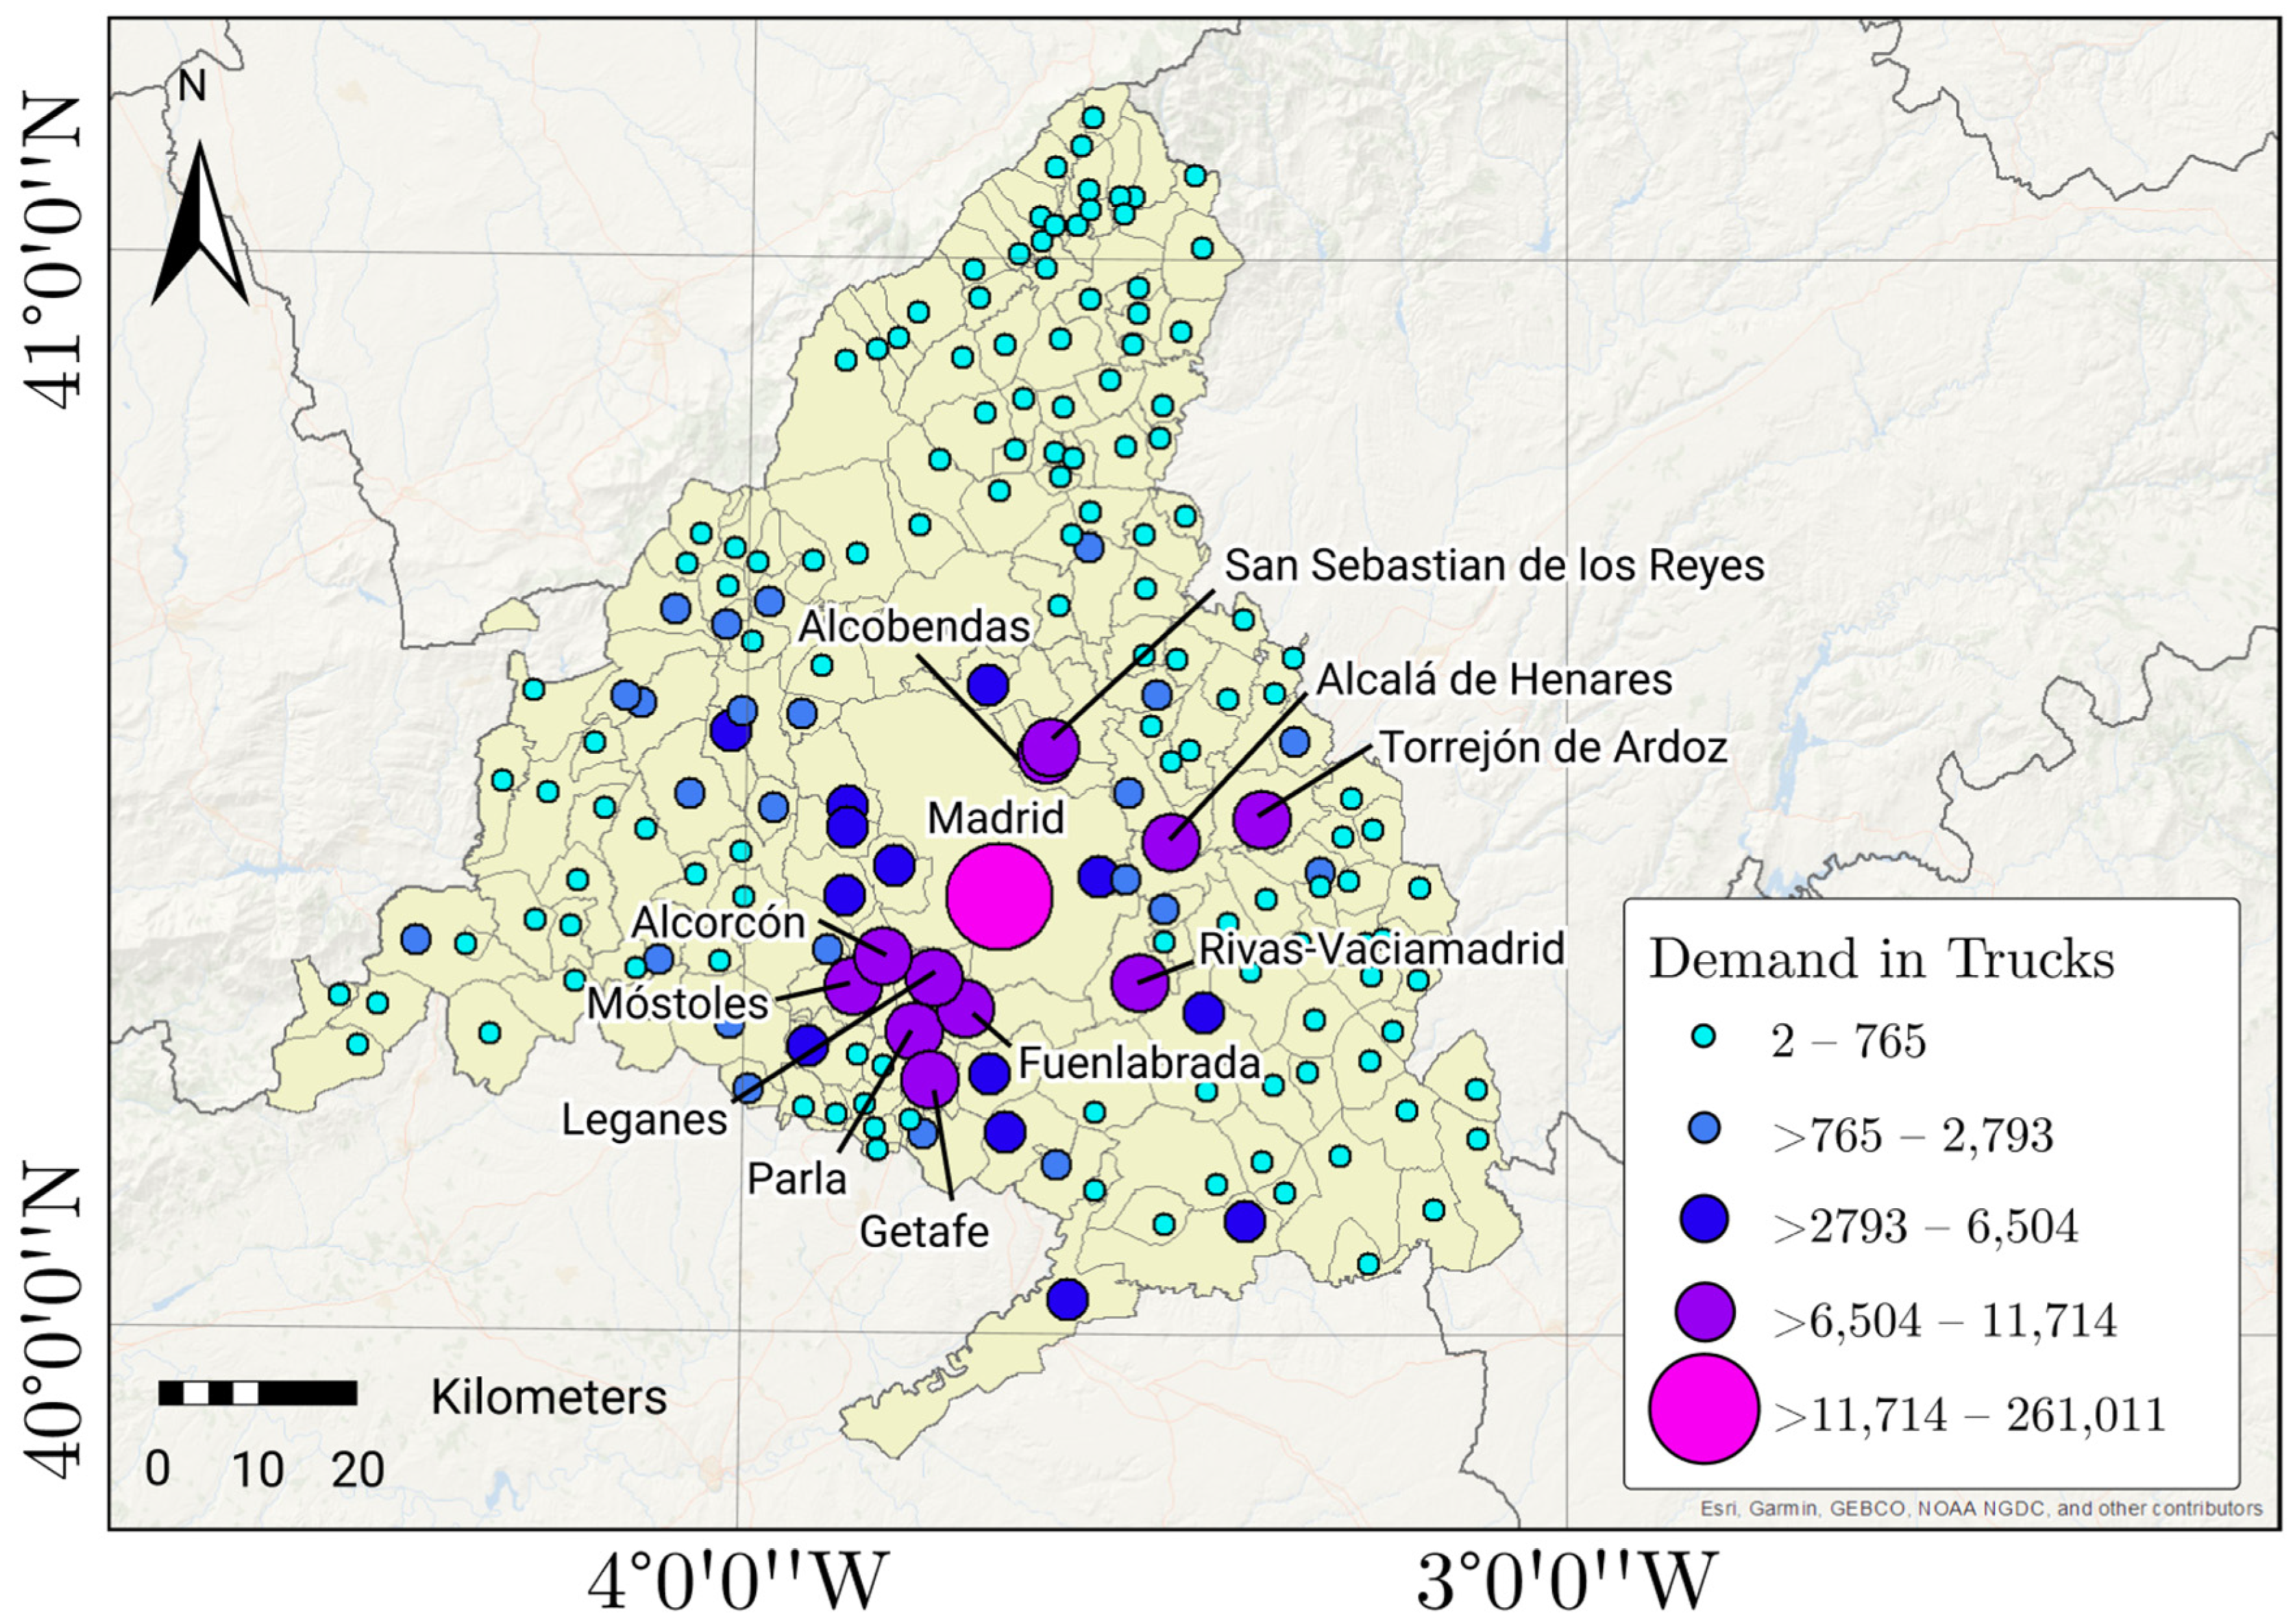
2.2.4. Production and Demand Values

Detailed information on the production of each aggregate quarry is not available due to confidentiality. Therefore, the average production of the quarries of each province was assigned to all active quarries in that province, taking the annual quantity of aggregates produced per province [39] and dividing it by the number of active quarries in each province. The average production was then assigned to the coordinates of the active quarries as supply points.
Average   production   per   province = total   aggregates   production number   of   active   quarries
The provincial demand for aggregates is known for all provinces in Spain [23], but a more detailed geographical distribution was required for this study. Therefore, the provincial demand has been distributed at the municipality level. This has been achieved by distributing the provincial demand according to the analysis of the total population and the change in population per year for all the villages [16,24]. Each demand figure has been assigned to the coordinates of the centroid of the municipality acting as demand points.

2.3. Methods of Analysis

This study uses Geographic Information Systems (GIS) to analyze the quarries located in the Madrid province and the provinces that border it, where most of the quarries that supply aggregates to the city of Madrid are located [17,24]. Urban areas within the Madrid province will be considered consumption points.
ArcCatalog and ArcMap software from the ArcGIS Desktop 10.5 suite, as well as ArcGIS Pro 2.9 [40,41,42], were used to develop the study. This software has the geospatial and route analysis tools necessary to carry out location–allocation studies, with the possibility of developing and executing a unique code in Python language to personalize geoprocessing. A script was developed that calculates the transport distances necessary to satisfy the demand for aggregates from the supply points (quarries) using road networks and considering the location of production and consumption areas. Figure 3A shows the methodology followed for the calculation of carbon emissions and costs for road-only aggregate transportation, while Figure 3B shows the methodology followed for the estimation of emissions and costs for intermodal train and road transportation of aggregates.

2.3.1. Road Distance Estimation Methodology

The analysis included the evaluation of the distances traveled by aggregate freight trucks between supply points (aggregate quarries) and consumption centers (towns and cities in the Madrid province) during the year 2020. For this calculation, the road network generated in ArcGIS Desktop was used, allowing the production centers to be realistically connected to the consumption centers and considering the distance traveled between the points on the route that the trucks would truly carry when transporting their freight. A script was generated in Python using the ArcPy library [43]. To give a realistic operation to the script, each demand center (city) was considered a sink within the transportation network, thus considering the sources as the production of all supply points (aggregates quarries). The model was launched by iterating the total production with respect to the consumption of each city. In each iteration, the nearest quarry was selected for each city, calculating whether the quarry’s production could meet the city’s needs. The quarry production was then transferred to the city according to its requirements, calculating the distance traveled along the road network. Once iterations of all cities were finished, the remaining production for each exploitation was recalculated, as well as the cities’ requirements, eliminating from the list those cities with their demand satisfied, as well as the exhausted quarries.
In subsequent iterations, the process was repeated until the demand of all consumption centers was satisfied. Once the process was completed, the total distance traveled was calculated. Moreover, considering the average transport capacity of the trucks in Spain (25.5 metric tons), the number of trips needed to transport all necessary production was calculated.
During the entire script calculation process, the distance driven by the transport truck from the point of origin to the destination was recorded, finally obtaining the total distance traveled to transport all the demanded aggregates.

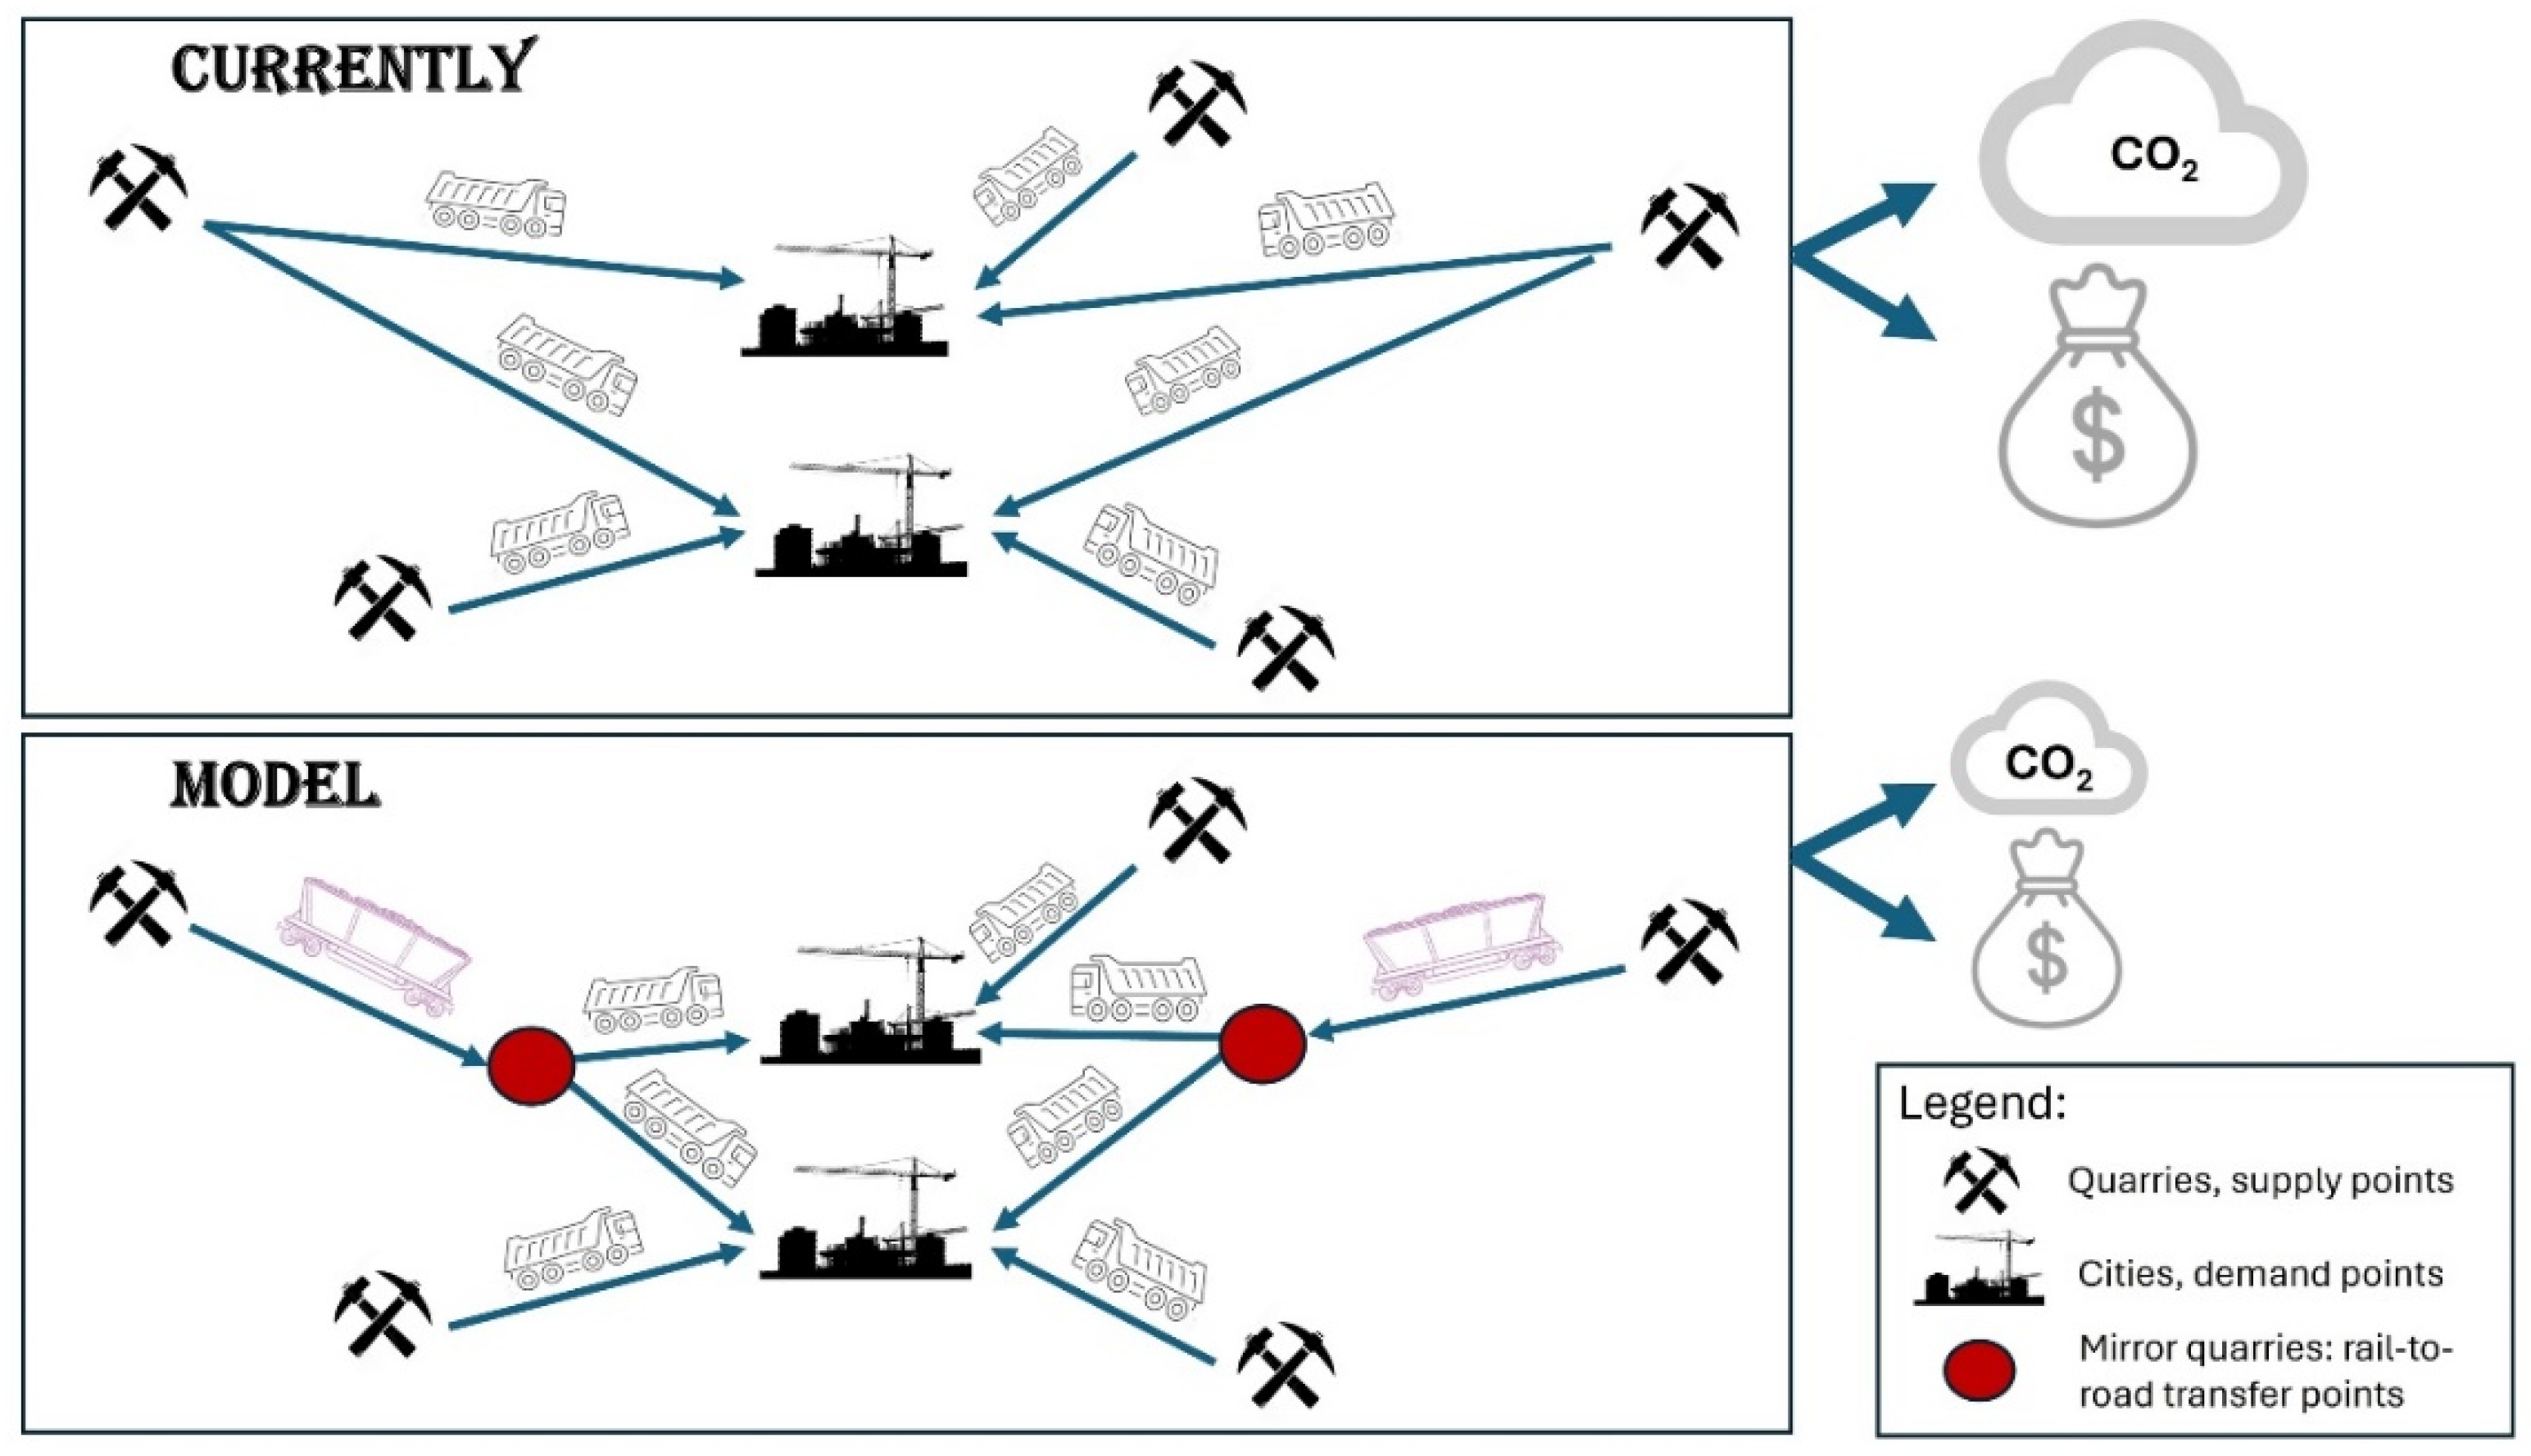
2.3.2. Combined Train/Road Distance Estimation Methodology

After calculating the total annual distance traveled by road for aggregate transportation, the potential of an intermodal train and truck system to reduce road travel distances was evaluated. Since four main rail lines serve freight transport in the region, a source quarry has been assigned to each rail line. The selection prioritized the quarries closest to the Madrid province and close to the railway line.
The potential areas where the material transported by train would be transferred to trucks are, in fact, modal shift terminals, named “intermodal terminals”, where the aggregates arrive by train and are loaded onto trucks for delivery to the final client. Material transported by train is automatically unloaded and placed in different silos and stockpiles according to their sizes. The locations of the intermodal terminals proposed in the study have not undergone any location optimization procedure, as this study is a preliminary test. Anyhow, some conditions have been set to propose their location:
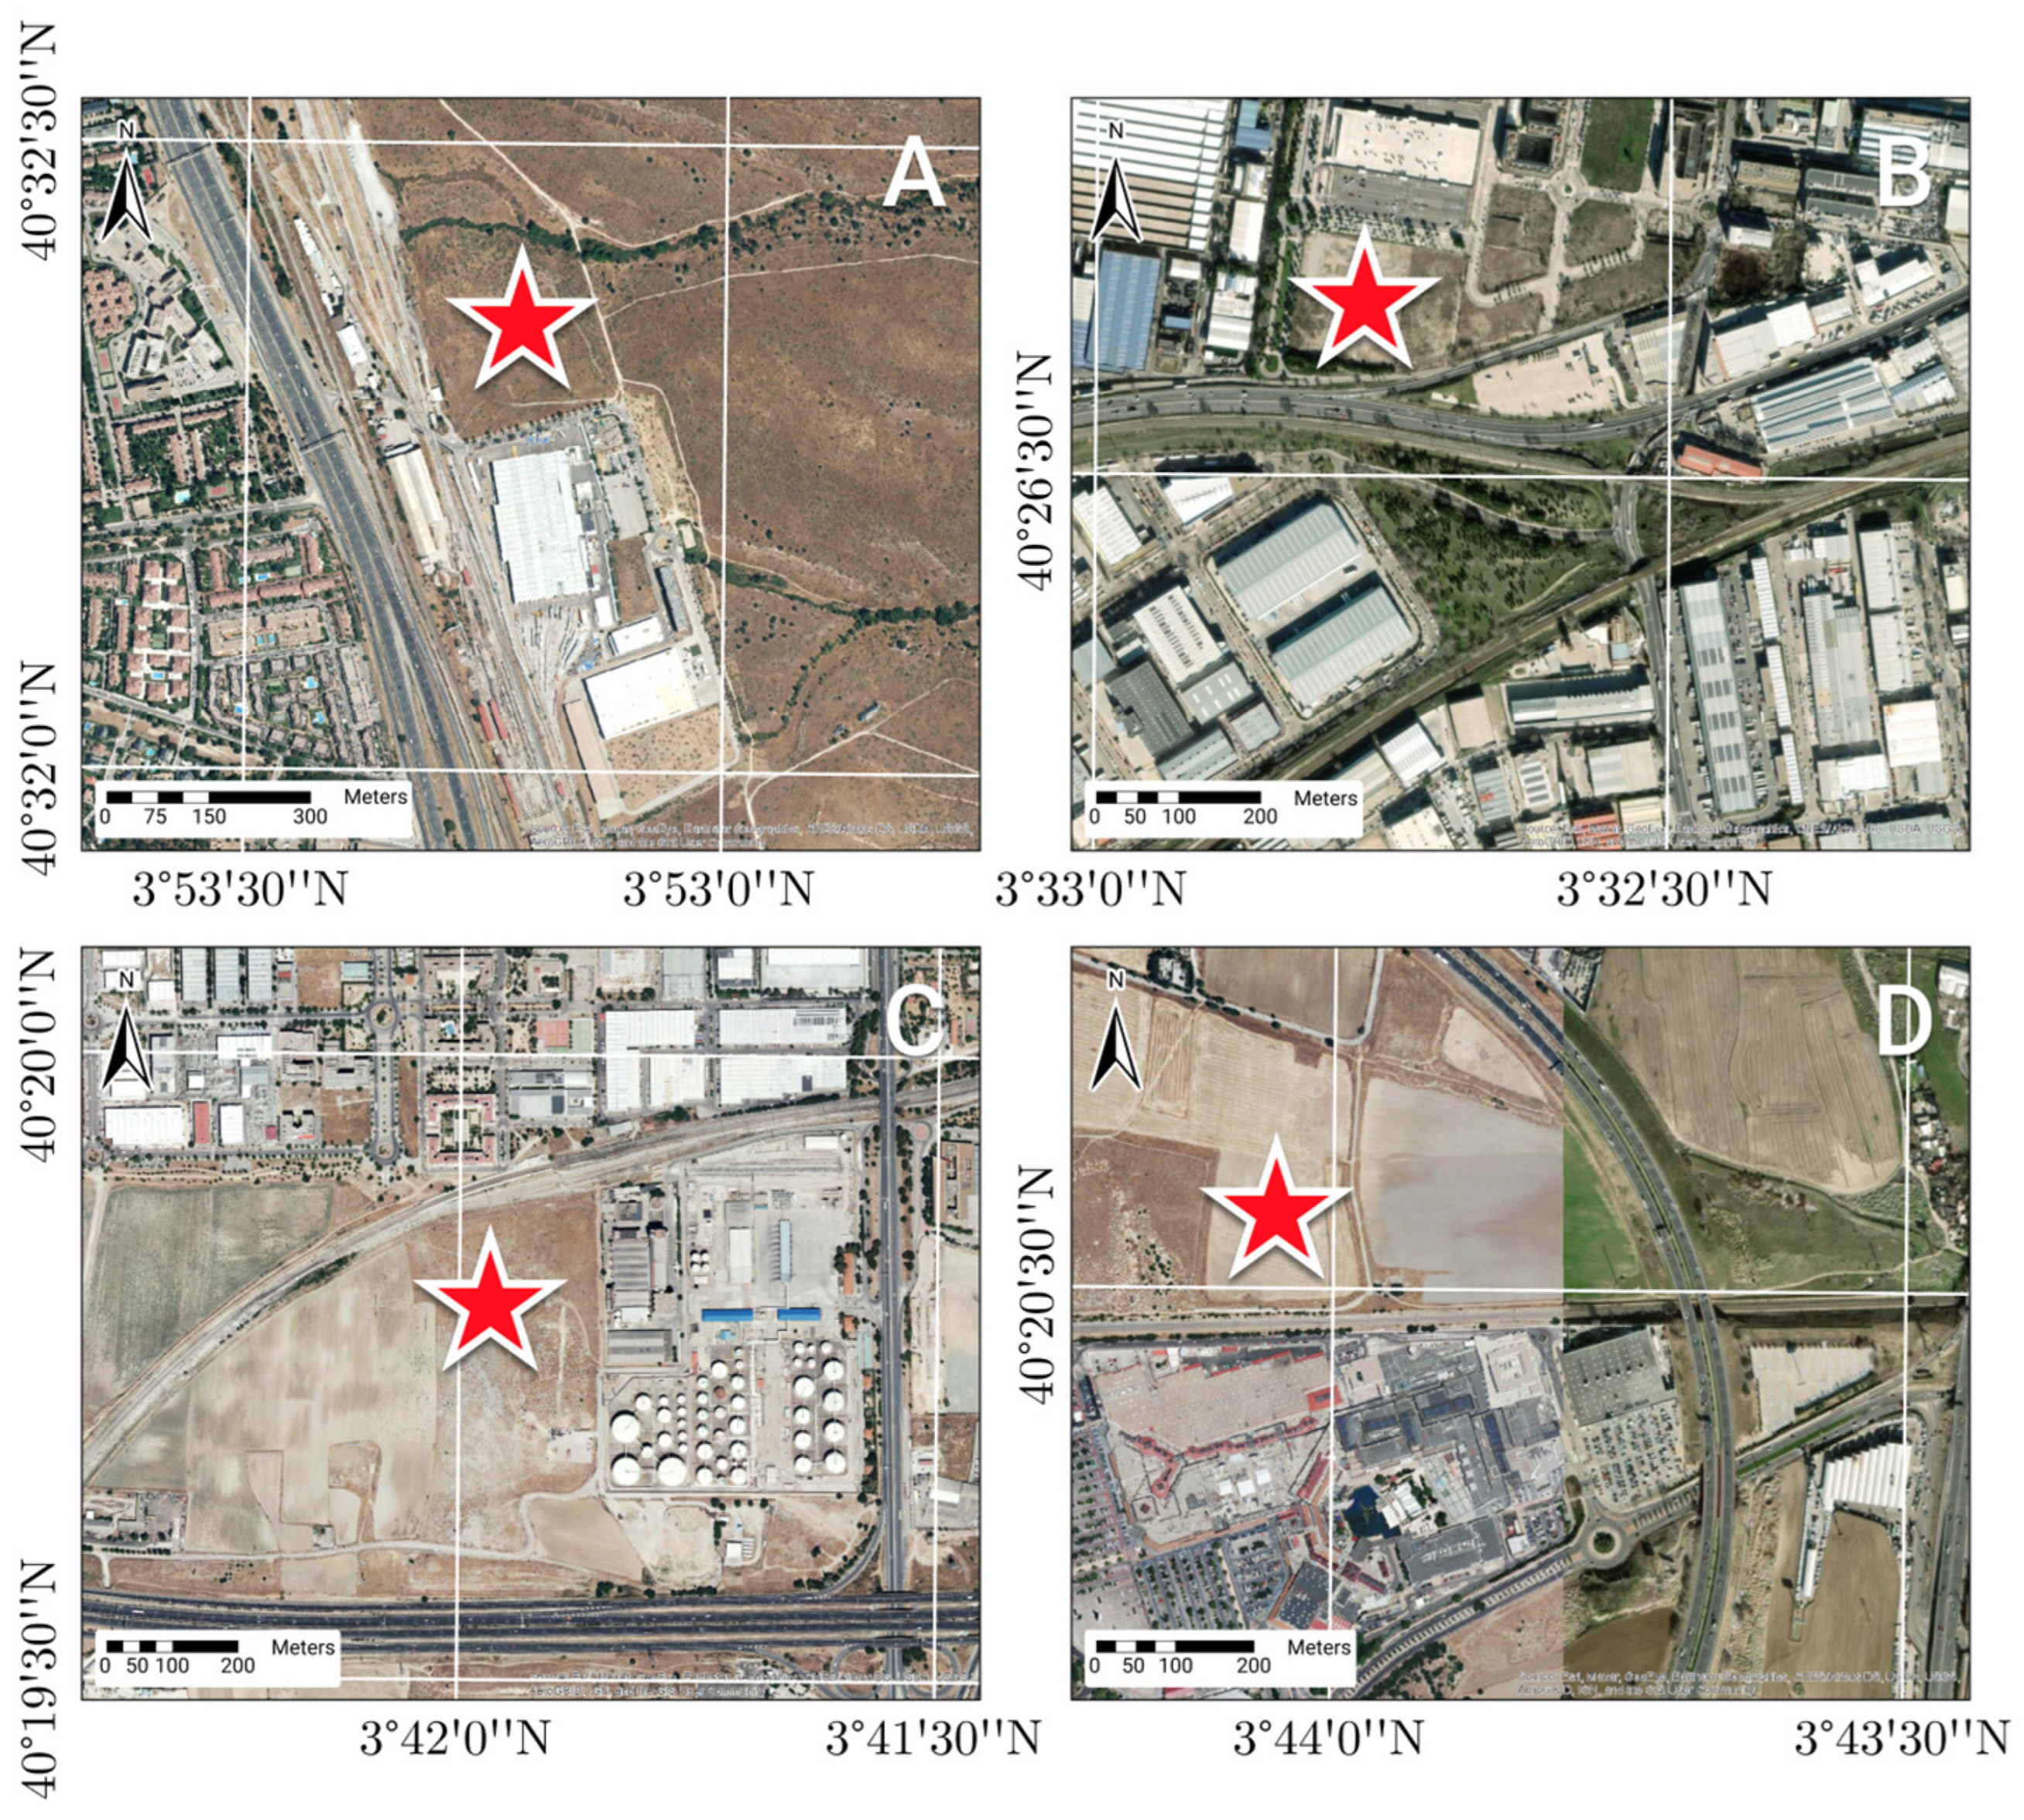
  • Only one intermodal terminal is defined for each of the four railway lines suitable for freight transport approaching Madrid: four intermodal terminals were defined.
  • The intermodal terminals must be adjacent to the railway lines.
  • Intermodal terminals must be located within industrial areas.
Four potential sites in industrial areas, one on each of the railway lines approaching Madrid City, have been selected as location points for intermodal terminals. The quarries feeding each intermodal terminal (source quarries) are, for each of the four railway lines entering Madrid province, the closest to the Madrid province border and next to the railway line. Figure 4 shows the location of the source quarries, the railway lines used, and the proposed location of the four intermodal terminals. Close-up images of the proposed sites for each intermodal terminal can be seen in Figure 5. The distances from the source quarries to the intermodal terminals by train are the following: the line entering Madrid from Avila province: 96 km, the line entering Madrid from Guadalajara Province: 50 km, the line entering Madrid from Cuenca province: 136 km, and the line entering Madrid from Toledo province: 23 km.
Once the location of the four intermodal terminals is established, an intermodal method of transport is established: rail using hopper-type wagons [44] for the main part of the trip, and truck for the final delivery to the demand points (last mile transportation). The script for the distance calculation was run again to obtain the distances considering the presence of the four intermodal terminals. Additionally, the distance between each intermodal terminal and its respective source quarry was calculated.

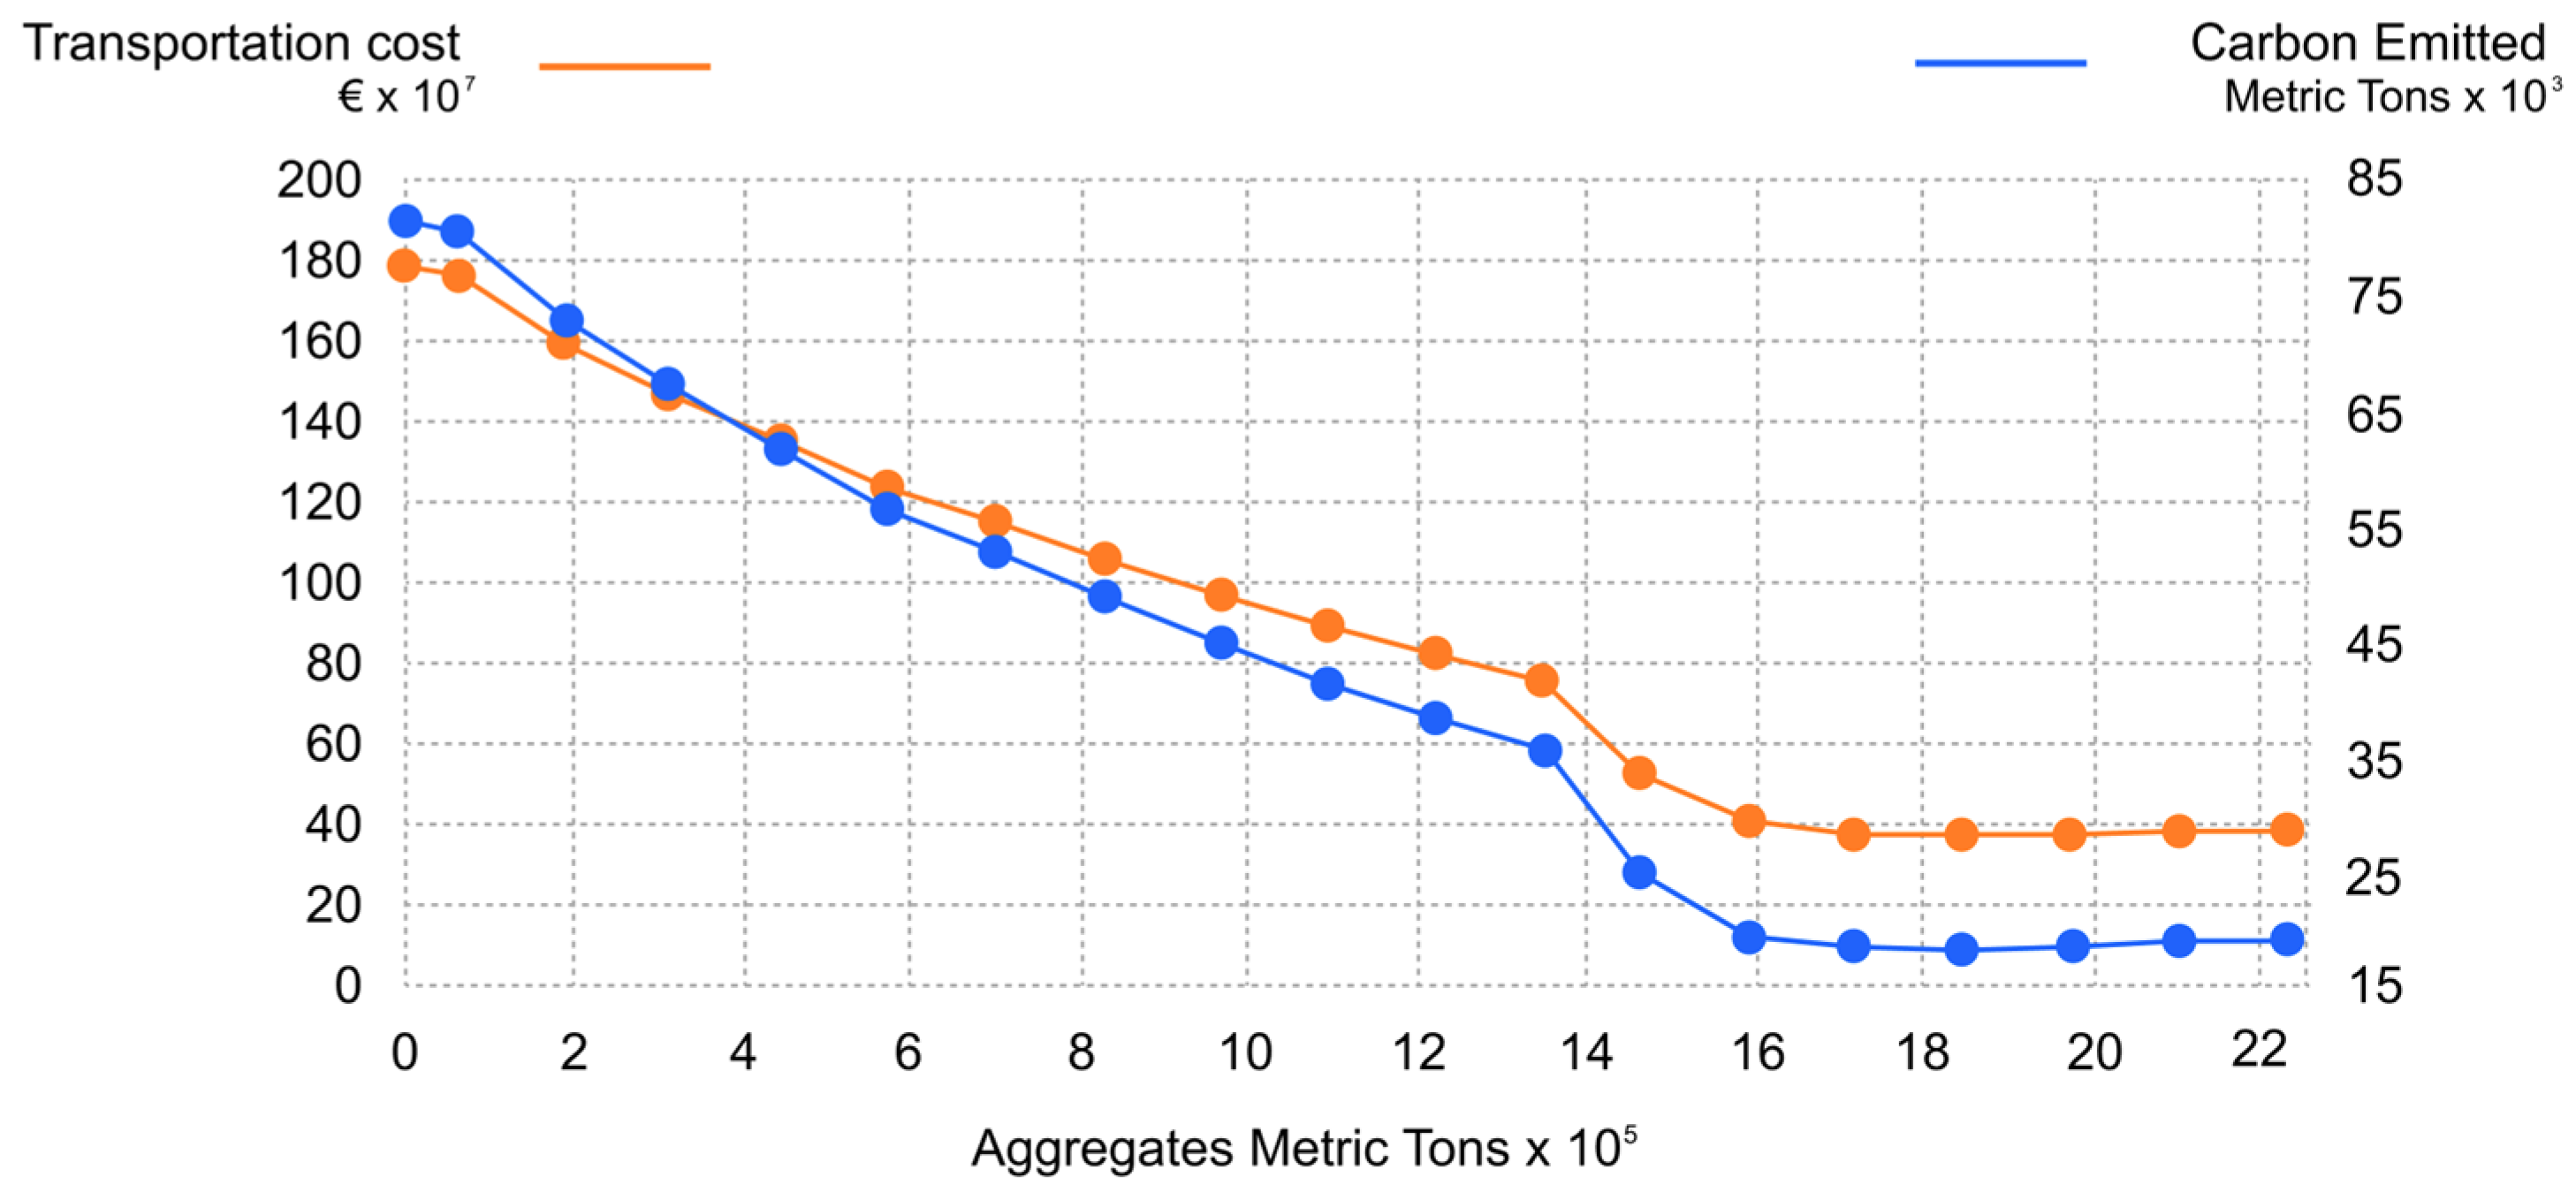
2.3.3. Emissions and Costs Calculation Methodology for Different Productions

A sensitivity analysis was performed taking into account different amounts of aggregates transported by rail: a battery of simulations was developed, where each of the intermodal terminals had its yearly production progressively increased by steps of 127,500 tons per year; the equivalent of 5000 trucks of 25.5 tons each [24].
This simulation was iterated 20 times, each time adding a production of 127,500 tons, reaching in the last series a total of 2,550,000 tons per intermodal terminal in the last step (the capacity of 400,000 of these trucks). For each element of the iteration, the distance calculation script was launched, obtaining, and logging the different calculations for each iteration.
The total kilometers resulting from the location–allocation scripts for each of the production levels have been recorded. The initial value, used as a reference, is the estimation of kilometers without using intermodal terminals, with all aggregates transported exclusively by road. Values obtained can be considered the minimum since the script minimizes the km traveled, but in the real world, it is not always the closest quarry that serves the closest demand point due to, for example, commercial reasons, temporary supply and demand imbalances, etc.
The total liters of fuel consumed by trucks is estimated by multiplying the total number of km traveled by the average fuel consumption per km of 0.55 L/km [24]. The fuel commercialized in Spain has a small portion of biodiesel (between 7% and 10%); therefore, to estimate the carbon emitted by fossil fuel, only 90% of the total amount of fuel consumed has been considered. The resulting liters of fuel have been multiplied by the emission factor of 2.6 kg of carbon per liter to obtain the total amount of carbon emitted [27].
Total   CO 2   Trucks   emission   =   Total   Truck   km 0.55 l   of   fuel km 0.9 2.6   kg   of   CO 2 l   of   fuel
The CO2 emissions due to the aggregates transported by rail have been estimated by multiplying the tons by the km (ton-km) and then by the average CO2 emissions given by Renfe of 8.3 gCO2/ton-km [45]. This average includes all emissions due to rail freight transport in the entire Spanish railway network.
Total   CO 2   train   emission   =   Total   train   km total   tons   transported 8.3   g   of   CO 2 ton _ km
For the cost estimation of the different options, there are no reliable figures for the cost of transporting aggregates by road in Spain because these are variable values due to the high impact of the fuel cost.
Total   Transport Cost = ( Total   Truck   km Total   ton   Cos t   per   ton _ km   for   Truck ) + ( Total   Train   km   Total   ton Cos t   per   ton_km   for   Train )
The cost of rail freight transport is also changing in Spain due to the opening of the rail network to new freight operators following the liberalization of the sector. To obtain a relative cost comparison between the different options (road-only vs. intermodal train and road with different amounts of transported aggregates), the average cost values for each mode of transport recently given by Van der Meulen [25] for road and rail in the Netherlands have been used.

3. Results

In the present study, the number of existing aggregate exploitations in the province of Madrid and in the five provinces surrounding it, as well as the distance to transport the aggregates from the quarries to the consumption points (cities) have been calculated.

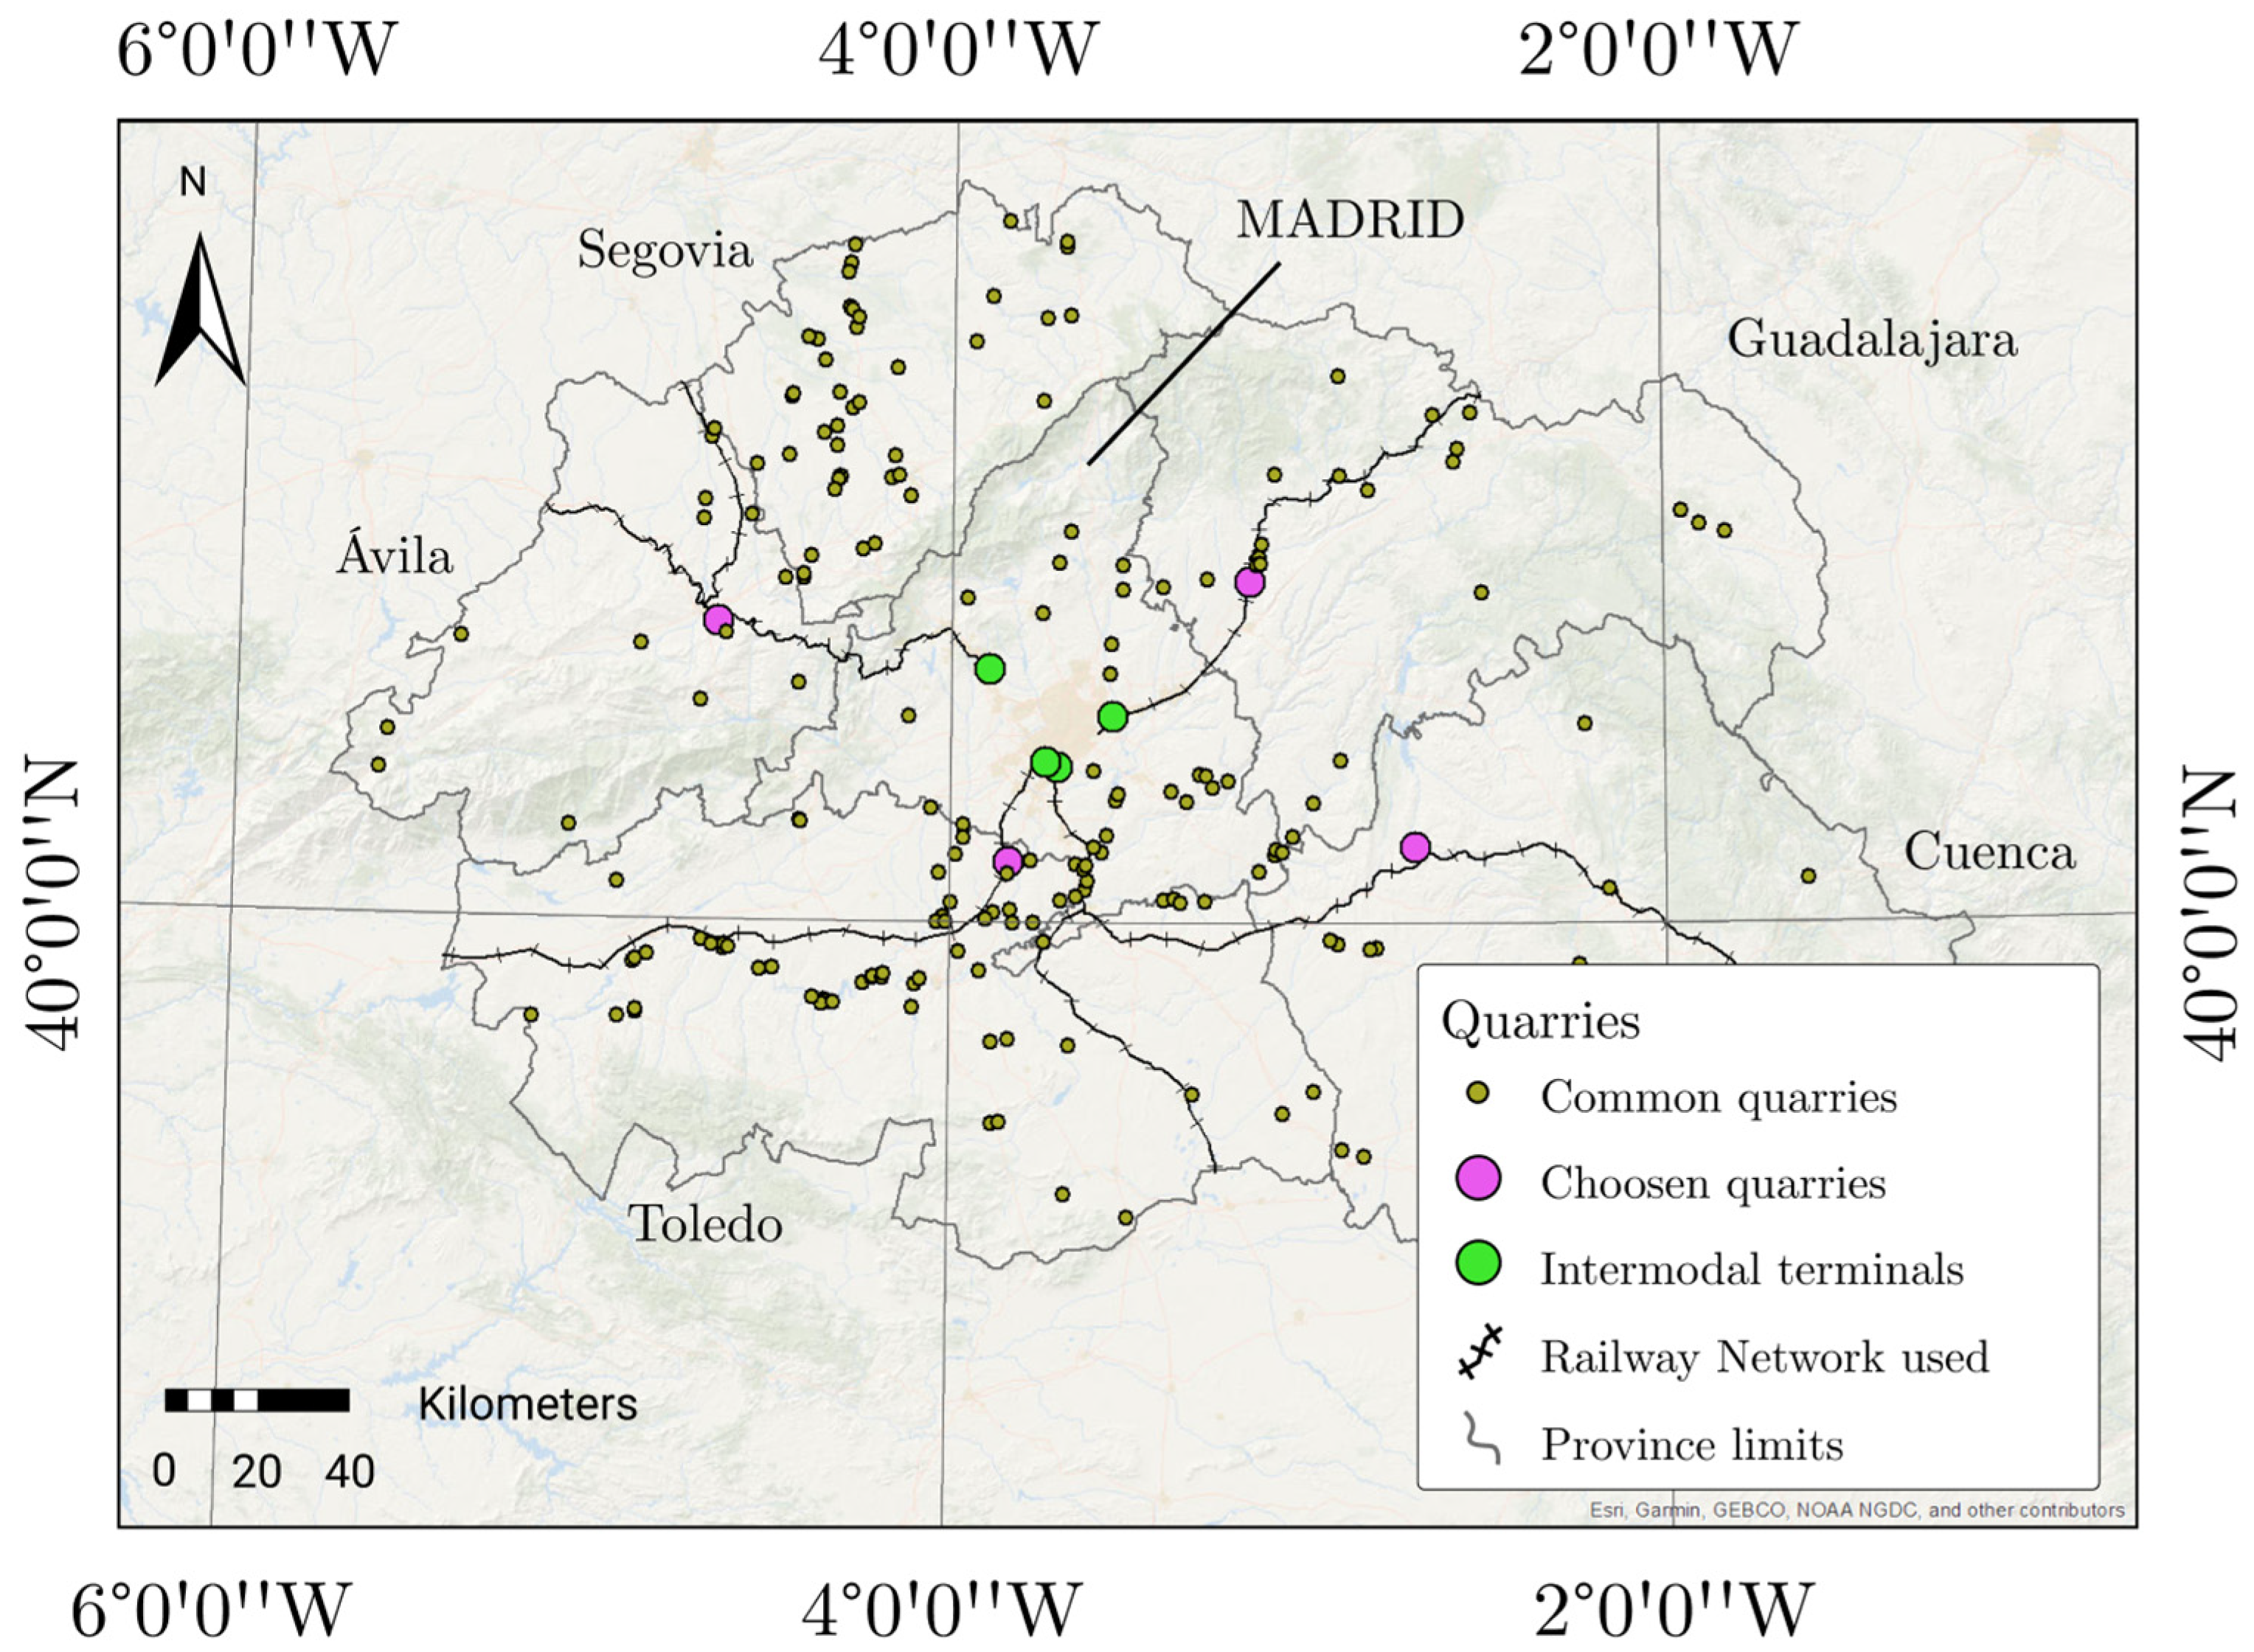
3.1. Quarries in Madrid and Surrounding Provinces

According to official databases, in 2020, there were 168 active quarries in Madrid and the surrounding provinces: 20 quarries in Madrid, 13 in Ávila, 33 in Segovia, 18 in Guadalajara, 31 in Cuenca and 53 in Toledo. After performing the artificial vision and machine learning analysis for quarry detection, the number of active quarries has increased to 211: there are 26 active quarries in Madrid (6 more than in the official sources), Ávila has 16 (3 more), Segovia has 42 (9 more), Guadalajara has 22 (4 more), Cuenca has 36 (5 more), and Toledo has 69 (16 more).

3.2. Railway and Road Network for Freight Transport

The digitized railway network sums up a total of 920 km (Figure 6). Differentiating between provinces, Madrid includes 162 km of railway, Avila has 171 km, Guadalajara has 112 km, Cuenca has 194 km, and Toledo has 281 km, while Segovia does not have usable railway lines entering Madrid province. A total of 7402 km of roads have been digitized to build the road network, most of them in the province of Madrid (2707 km), followed by Toledo (1274 km), Cuenca (1035 km), and Guadalajara, Segovia and Avila (924 km, 828 km and 614 km, respectively).

3.3. Aggregate Production and Demand

The total aggregate production in 2020 in the area of study was 15.02 Mt, with production in Toledo province of 5.31 Mt, which was the highest, followed by Madrid (5.19 Mt), Cuenca (1.39 Mt), Avila (1.18 Mt), Guadalajara (1.00 Mt) and Segovia (0.95 Mt) [39]. These province values have been divided by the number of active quarries in each province to obtain the mean province quarry production, resulting in 199,508 tons per quarry in Madrid, 79,287 tons in Toledo 73,717 tons in Ávila, 45,515 tons in Guadalajara, 40,857 tons in Cuenca, and 29,729 tons in Segovia (Figure 7). These tonnages have been divided by the average tonnage of aggregates transported by trucks (25.5 tons per truck) to determine the potential number of truckloads supplied by each quarry.
The Madrid province demand for aggregates in 2020 was ca. 12.34 Mt [23]. This figure segments the different cities and villages of the province according to their total population and their variation in population. The results indicate that Madrid City demands half of the total production, a dozen other municipalities demand more than 200,000 tons per year (Parla, Alcalá de Henares, Getafe, Alcorcón, Móstoles, Leganés, etc.) and the remaining demand belongs to the other 166 municipalities in Madrid (Figure 8). The demand of each municipality has been divided by the average tonnage transported by trucks (25.5 tons of aggregates per truck) to determine the number of trucks demanded by each municipality.

3.4. Total Distance Traveled and Carbon Emissions

To supply the aggregate demand for the Madrid province, trucking transport accounted for 56,830,403 km in 2020. Considering the average fuel price, the transport of aggregates had a fuel cost of EUR 178,248,558, and 73,141 metric tons of carbon were emitted. This amount of carbon results from only considering the emissions of using gas oil as fuel (pump-to-wheels emissions) and no other emissions associated with oil extraction, refining, transport, etc. (well-to-wheels emissions). This would be the base scenario for further comparison.
Once the calculation has been performed for road-only aggregate transport, the analysis is made by implementing the intermodal transport system including the four intermodal terminals in the quarries dataset. Starting the analysis considering the rail transport to each intermodal terminal of approximately 60,000 tons per year, the total direct truck transportation distance is 56,016,907 km (Table 1). This figure also includes road transport from the intermodal terminals to the demand points (“last mile” transport) and results in a reduction of 813,495 km compared to the base scenario. The change in transport mode has an associated cost of EUR 175,953,005 (reduction of EUR 2,295,552) and an emission of carbon of 72,246 metric tons of carbon (895 tons less) per year (Figure 9).
Breaking down this intermodal transport, it is observed that of the 56,016,907 km traveled in total, the trucks that have carried out direct road transport add up to 55,828,962 km (99.36%), being responsible for a carbon emission of 71,852 tons. Furthermore, the transport of material from intermodal terminals to consumption centers (considered “last mile” transport) totals 187,945 km (0,34%), emitting 242 tons of carbon.
When increasing the number of tons transported through the intermodal rail/road transport mode, a significant and progressive reduction in carbon emissions and costs is clearly obtained (Figure 9).

4. Discussion

4.1. Key Findings

The results of this study indicate that to reduce GHG emissions due to transportation, it is worth switching freight transportation from a road to a rail/road intermodal system, even for short transport distances (i.e., less than 100 km). This was first suggested by Bouchery and Fransoo [30] in a general study on the impact of railroad intermodality on carbon emissions and costs, in which they found that for large volumes and low distances of drayage in origin and destination, intermodality would also be feasible for short and medium distances. They also found that the reduction in costs and emissions was not continuous. They improved as volumes increased to a certain point, from which it began to worsen. They also suggested that the volume at which the emissions and cost optimum is reached was different for the two variables.
From the case under study—the aggregate transportation from supply to demand points in the Madrid region—this change in transport mode would remarkably reduce the carbon emissions of this activity. Transporting only 6% of the aggregates consumed in the province of Madrid by an intermodal rail/road system would mean a reduction of 10% of the carbon emissions when compared to the same quantity of aggregates being transported only by road. In terms of tons, when the combined intermodal terminals dispatch reaches 1.7 Mt (443,000 tons from each intermodal terminal), the reduction in carbon emission would be close to 25%, 17,400 carbon tons per year lower compared to the carbon emission produced through aggregates transported only by road. These estimates are pump-to-wheels emissions and do not consider other factors that would improve this reduction, i.e., the resulting decrease in the number of trucks needed, less oil extraction and refinement, and a decrease in the amount of fuel needed to be transported to the Madrid area.
Most of the benefits associated with a shared transport train and road are related to the higher transport capacity of trains compared to trucks, as well as the energy mix feeding the trains. In the case of Spain, most trains use electricity, and a nice portion of the electricity is produced by renewable sources. During 2022, the participation of renewable production in the Spanish electricity generation mix was up to 42.2%, mostly produced by wind energy (nearly 23% of the mix), photovoltaic solar energy (10.5%) and hydroelectric (ca. 7%). Furthermore, approximately 21% of the electricity generated in the country was nuclear. Together, almost two-thirds of the electrical generation in Spain is produced without carbon emissions. The main sources of carbon emissions from electricity generation in Spain are combined cycle gas feed plants (23%) and carbon-burning power plants (~3%) [46]. On the other hand, trucks currently run on gas oil, creating technical and efficiency barriers to change the source of energy used by road transport of goods to cleaner energy ones.
In addition, the analysis reveals a significant decrease in the cost of transporting aggregates. For the year 2020, the cost associated with the transportation of aggregates in the Madrid province was almost EUR 180 million, considering a cost of 0.246 EUR/ton-km for direct truck transportation that includes fix, variable, and labor costs. Incorporating the intermodal system, the annual transportation cost shows a significant decrease, reaching a minimum cost of EUR 39.5 million, which means a 78% decrease in the annual cost. Furthermore, there are additional benefits associated with the reduction in heavy road transport such as a decrease in road wear and maintenance and an improvement in road traffic.
The switch from a road to an intermodal train and road system is consistent with the Sustainable Development Goals (SDG) considered by the United Nations in 2015, specifically with objective SDG 11.2, which refers to accessible and sustainable transportation systems. Among the purposes of this objective, sustainable transportation seeks to achieve better integration of the economies of regions while respecting the environment [47].

4.2. Comparison of the Findings with the Literature

Measures such as the proposed change in the aggregate transportation mode would produce a relevant impact on the reduction in carbon emissions. Examples of changing transport modes with a resultant significant reduction in GHG emissions have been proposed by different authors: Reiter et al. [34], estimated an annual reduction in carbon emissions of between 587,000 and 2.9 million tons by replacing short-haul flights with rail services, although this measure would affect between 6 and 19 million passengers annually, which will almost double their travel time. Other authors, such as Dobruszkes et al. [32], reduce the impact of this measure on the reduction in carbon emissions, highlighting that most of the flight sector emissions are from long-distance flights. Other measures, on a local scale are the replacement of 100% diesel buses of the fleet of Madrid municipal urban buses public company (EMT) that transport more than 450 million passengers per year to buses that use compressed natural gas or are hybrid and electric. This has resulted in a reduction in carbon emissions of 7000 tons of carbon per year [48]. In this study, it is determined that a change to an intermodal transport of aggregates would produce a carbon emission reduction between 8000 and 55,000 tons of carbon per year, which seems relevant and should be considered when establishing policies that respect the environment in a sustainable way.
Another way to reduce the GHG emissions related to the transport of aggregates is by reducing the distances between the supply points and the demand areas. This same idea is followed by the Zero Kilometer initiative, a recent movement related to sustainability that seeks the most efficient way to minimize the impact of freight transportation. This initiative is derived from the Slow Food movement and proposes the consumption of local products, reducing the distance between the producer and the consumer. Construction with Zero-Kilometer materials in infrastructures is generalized, induced by the high volumes of materials employed in civil works and the cost of transporting these materials. Construction materials such as cement or steel products must be transported from their factories, but other materials such as fillings and loose materials are sourced from areas near the construction site to reduce their transport distances, the cost of transport, and the GHG emissions. In the case of building, historically, the construction industry was based on the use of zero-kilometer materials [29], employing the resources found next to the villages in most of the buildings, or reusing materials from unused buildings from previous cultures [28]. In recent times, this trend has changed and building materials are transported longer distances, mainly due to the intensive growth of cities, the industrialization and standardization of construction materials, the NIMBY effect (“Not In My Back Yard”), and the abundance and relatively low price of fossil fuels that facilitate road freight transport [24]. At present, there are anecdotic examples of Zero-Kilometer materials in modern buildings [49], and it seems unrealistic that this way of building and construction could become predominant in modern cities in the short and midterm. In the case of the Madrid province, the building materials industry is not following the Zero-Kilometer initiative: distances from the sources of materials to the demand points are progressively increasing. If this trend continues, one way to mitigate the impacts of increasing distances but reducing GHG emissions would be, as this study proposes, to implement an intermodal rail and road transport system for construction materials.

4.3. Strengths and Limitations

As explained previously, the proposed areas for the location of the intermodal terminals are the closest possible available areas to Madrid City to accomplish the three stated conditions. This does not mean that these precise locations are the best, or that the authorization for this activity would be granted; they have merely been used as potential locations in this study. Further analysis to optimize the location of these intermodal terminals using location–allocation techniques should be performed to improve the results by establishing the best locations, which would minimize costs and total emissions. The data employed in the study are averages in some of the variables (for example, aggregate production of the quarries in each province, CO2 emissions by rail transport, and costs) that give an overall good result for the study but could be improved with more precise information.
The strategy of reusing and recycling construction materials to reduce the amount of natural material needed and its movement from site to site is not always possible. For example, in the case of aggregates, reusing and recycling are limited in terms of the tonnage produced, and there are quality issues that prevent their use. The second easiest way to reduce emissions would be to extract the aggregates closer to the demand areas, but it seems, at least in the present Spanish context, unrealistic. Therefore, one way to reach the carbon reduction objectives would be to transition from road-only transport of material from production to demand points to a combined mode of transportation that would be promoted by the public sector.
The main strengths of the proposed aggregate intermodal rail/road transport are the reduction in CO2 emissions by reducing fossil fuel burning, the reduction in heavy traffic on the roads, reducing congestion and road safety issues, and in the case of the Madrid area, the use of existing infrastructure.
However, the economic advantages of this type of mixed transport end up being limited and even reversed when the material transported to intermodal terminals is very high [24] since transport from these terminals to the final consumption centers involves traveling longer distances, so the cost increases again, as can be seen towards the end of Table 1. This means that a cost/benefit analysis must be carried out that considers the evolution of the aggregates market to efficiently calculate the optimal intermodal transport range for the economy.

4.4. Policy Implications

To reduce carbon emissions, governments have enforced or are promoting different measures. The European Union (EU) has created an emissions trading system for industry and transport sectors and is forcing them to substitute, at least partially, conventional fuels with sustainable ones. Additionally, the EU is trying to progressively replace the current car fleet with electric, hybrid or hydrogen-powered vehicles and promotes energy-saving measures, increases in renewable energy production, and the improvement of the forest capacity to capture carbon [50]. Moreover, the EU is implementing measures such as the capture and geological underground storage of carbon. Each European country, at a national level, can also propose tools or measures to achieve the GHG emissions reduction targets. The added effect of all the applied measures is the reduction in the amount of carbon in the atmosphere. In the year 2022 the EU managed to reduce carbon emissions by around one-third with respect to levels in 1990 [51].
In the transport sector, the White Paper of the European Commission [10] stated a target of a 60% reduction in GHG emissions due to transport activities. To achieve this challenge, 10 measures were proposed, including the use of low-carbon sustainable fuels, the elimination of “conventionally fueled” cars in cities by 2050, ensuring that more than 50% of medium-distance passengers are transported by train by 2050, and switching 30% of road freight over 300 km to other modes such as rail or waterborne transport by 2030. There is no target or mention of intermodal switching for shorter distances of freight transport, although this study shows the potential of this measure for the reduction in carbon emissions related to transport.
In market economies, switching the mode of transport should be implemented by the private sector, although the public sector could play a facilitating role. The role of the public sector is key to implementing this methodology, even though the production and transport of aggregates is usually carried out by private companies. In the case of Madrid, no additional investment in infrastructure is required, but permits are required for such activity. On the other hand, the public sector would provide public land to install intermodal terminals, for example, by concession mechanisms for a certain time. The public sector would, at a very low cost and effort, promote a reduction in carbon emissions by favoring intermodal train and road transport of aggregates in such contexts. Therefore, its role is key, as government policies and legislation enablers are the most important factor in the success of the transition from unimodal road to intermodal train and road freight transportation [26].

5. Conclusions

This research shows that there are products (such as aggregates) in which, even if they are transported at distances less than 100 km, their transport from supply to demand points by a combined train and road system will significantly reduce carbon emissions by several thousand tons per year. This confirms the working hypothesis that intermodality over short distances can help reduce CO2 emissions related to transport. The products for which it would be worth exploring the switch to an intermodal mode of transportation would be those that are used in high quantities in urban areas, are non-perishable, are transported in bulk, and have relatively simple logistics. Construction materials are perfectly in line with these characteristics, and this methodology should be analyzed for other materials of similar character, such as cement and plaster.
This research has shown great potential for reducing carbon emissions by transporting aggregates from supply to demand points in the Madrid province by rail for the initial part of the trip and by truck for last-mile delivery. Emissions reduction would range from 8000 tons to 55,000 tons of carbon per year depending on the amount of aggregates transported initially by rail. For a realistic scenario with four intermodal terminals, with a material transfer capacity of 500,000 tons/year each, the reduction in carbon emissions could be around 20,000 tons compared to the base scenario.
Moreover, this analysis establishes that this change in transport mode would also be economically interesting. The aggregate producers should make precise calculations for the investment required and the return on this investment for transporting aggregates using the proposed intermodal system and optimize the location of the intermodal terminals.
Considering the potential interest of switching to intermodal train and road freight transport over short distances to reduce the carbon emitted in the transport of building materials, the public sector should promote it, with measures such as facilitating the permits for intermodal terminals (train and road transfer points), offering concessions of public land, etc. This change in transport mode would be an additional contribution to the global need to reduce GHG emissions and would help countries and the transport sector meet the challenging emissions-reduction objectives.
The proposed shift to intermodal transport, with quarries strategically located near consumption centers and materials transported predominantly by rail, demonstrates promising potential to significantly reduce CO2 emissions and lower transportation costs. This approach not only enhances the environmental sustainability of material transport but also highlights the importance of integrating rail into logistics planning, especially for regions with high demand for construction materials, such as the case of Madrid.

Author Contributions

Conceptualization, M.J.H., J.I.E.F. and J.G.B.; methodology, F.J.L.-A., M.J.H. and J.I.E.F.; software, F.J.L.-A.; validation, F.J.L.-A.; formal analysis, F.J.L.-A., M.J.H. and J.I.E.F.; investigation, M.J.H., J.I.E.F. and J.G.B.; data curation, F.J.L.-A. and J.G.B.; writing—original draft preparation, F.J.L.-A., M.J.H. and J.I.E.F.; writing—review and editing, M.J.H. and J.I.E.F.; funding acquisition, M.J.H. and J.I.E.F. All authors have read and agreed to the published version of the manuscript.

Funding

This research was funded by Fundación General UCM, grant numbers 4195235 and 4195441, and Fundación Agustín de Betancourt, grant number 62.12.23.

Institutional Review Board Statement

Not applicable.

Informed Consent Statement

Not applicable.

Data Availability Statement

Dataset available on request from the authors.

Acknowledgments

We would like to thank Ing. E. No-Varela, Operations Director of Renfe Mercancías, for all the information provided about the rail freight transportation system in Spain, and to ANEFA and Ministerio de Industria y Turismo of Spain for supplying updated information about the aggregates market in Spain. This research has been funded by project numbers 62.12.23 of the Fundación Agustín de Betancourt and 4195235 and 4195441 of the Fundación General UCM.

Conflicts of Interest

The authors declare no conflict of interest.

References

  1. Eun Oh, J.; Espinet Alegre, X.; Pant, R.; Koks, E.E.; Russell, T.; Schoenmakers, R.; Hall, J.W. Addressing Climate Change in Transport. Volume 2: Pathway to Resilient Transport; The World Bank: Singapore, 2016; p. 154. [Google Scholar]
  2. Eurostat. Net Greenhouse Gas Emissions. Available online: https://ec.europa.eu/eurostat/databrowser/view/SDG_13_10/default/table?lang=en (accessed on 15 September 2023).
  3. Wiegmans, B.; Champagne-Gelinas, A.; Duchesne, S.; Slack, B.; Witte, P. Rail and road freight transport network efficiency of Canada, member states of the EU, and the USA. Res. Transp. Bus. Manag. 2018, 28, 54–65. [Google Scholar] [CrossRef]
  4. Gialos, A.; Zeimpekis, V.; Madas, M.; Papageorgiou, K. Calculation and Assessment of CO2e Emissions in Road Freight Transportation: A Greek Case Study. Sustainability 2022, 14, 10724. [Google Scholar] [CrossRef]
  5. Jiang, R.; Wu, P.; Wu, C. Driving Factors behind Energy-Related Carbon Emissions in the U.S. Road Transport Sector: A Decomposition Analysis. Int. J. Environ. Res. Public Health 2022, 19, 2321. [Google Scholar] [CrossRef] [PubMed]
  6. Mendoza-Sanchez, J.F.; Alonso-Guzman, E.M.; Martinez-Molina, W.; Chavez-Garcia, H.L.; Soto-Espitia, R.; Obregón-Biosca, S.A.; Delgado-Alamilla, H. Measurement of CO2 Emissions by the Operation of Freight Transport in Mexican Road Corridors. Appl. Sci. 2023, 13, 11391. [Google Scholar] [CrossRef]
  7. IEA. Transport, Energy and CO2, Moving Toward Sustainability; International Energy Agency Report: Paris, France, 2009; p. 418. [Google Scholar]
  8. Milewski, D.; Milewska, B. Efficiency of the Consumption of Energy in the Road Transport of Goods in the Context of the Energy Crisis. Energies 2023, 16, 1257. [Google Scholar] [CrossRef]
  9. Heinold, A.; Meisel, F. Emission rates of intermodal rail/road and road-only transportation in Europe: A comprehensive simulation study. Transp. Res. Part D Transp. Environ. 2018, 65, 421–437. [Google Scholar] [CrossRef]
  10. European Commission. Transport White Paper—Roadmap to a Single European Transport Area—Towards a Competitive and Resource Efficient Transport System. Available online: https://eur-lex.europa.eu/LexUriServ/LexUriServ.do?uri=COM:2011:0144:FIN:en:PDF (accessed on 4 January 2024).
  11. Boldizsár, A.; Mészáros, F.; Sipos, T. Spatiality in freight transport efficiency. Acta Oeconomica 2023, 73, 327–345. [Google Scholar] [CrossRef]
  12. Sun, Y.; Sun, G.; Huang, B.; Ge, J. Modeling a Carbon-Efficient Road–Rail Intermodal Routing Problem with Soft Time Windows in a Time-Dependent and Fuzzy Environment by Chance-Constrained Programming. Systems 2023, 11, 403. [Google Scholar] [CrossRef]
  13. Kine, H.Z.; Gebresenbet, G.; Tavasszy, L.; Ljungberg, D. Digitalization and Automation in Intermodal Freight Transport and Their Potential Application for Low-Income Countries. Future Transp. 2022, 2, 41–54. [Google Scholar] [CrossRef]
  14. Escavy, J.I.; Herrero, M.J.; Trigos, L.; Sanz-Pérez, E. Demographic vs economic variables in the modelling and forecasting of the demand of aggregates: The case of the Spanish market (1995–2016). Resour. Policy 2020, 65, 101537. [Google Scholar] [CrossRef]
  15. UNEP GEAS. Sand, Rarer than One Thinks; UNEP GEAS: Sioux Falls, SD, USA, 2014; Volume 15. [Google Scholar]
  16. López-Acevedo, F.J.; Escavy, J.I.; Herrero, M.J. Application of Spatial Data Mining to national mines inventories for exploration and land planning of high place-value mineral resources. The case of aggregates in Spain. Resour. Policy 2022, 79, 103096. [Google Scholar] [CrossRef]
  17. López-Acevedo, F.J.; Herrero, M.J.; Escavy, J.I.; Peláez Fernández, M.A. Identification of Aggregates Quarries via Computer Vision Analysis as a Tool for Sustainable Aggregates Management and Land Planning. Sustainability 2024, 16, 3099. [Google Scholar] [CrossRef]
  18. UEPG. Aggregates Europe—UEPG Annual Review 2019–2020; UEPG: Ponta Grossa, Brazil, 2020. [Google Scholar]
  19. Aquino, C.; Inoue, M.; Miura, H.; Mizuta, M.; Okamoto, T. The effects of limestone aggregate on concrete properties. Constr. Build. Mater. 2010, 24, 2363–2368. [Google Scholar] [CrossRef]
  20. Yılmaz, M.; Tuğrul, A. The effects of different sandstone aggregates on concrete strength. Constr. Build. Mater. 2012, 35, 294–303. [Google Scholar] [CrossRef]
  21. Escavy, J.; Herrero, M. The use of location–allocation techniques for exploration targeting of high place-value industrial minerals: A market-based prospectivity study of the Spanish gypsum resources. Ore Geol. Rev. 2013, 53, 504–516. [Google Scholar] [CrossRef]
  22. Global Market Insights Inc. Construction Aggregates Market Size—By Product (Sand, Gravel, Crushed Stone), by Application (Residential, Commercial, Nonbuilding Construction). Industry Analysis Report & Global Forecast, 2023–2032. Available online: https://www.gminsights.com/industry-analysis/construction-aggregates-market (accessed on 26 September 2023).
  23. ANEFA. Revista Anual 2019–2020; ANEFA: Mont de Marsan, France, 2020; Volume 84. [Google Scholar]
  24. Escavy, J.I.; Herrero, M.J.; Lopez-Acevedo, F.; Trigos, L. The progressive distancing of aggregate quarries from the demand areas: Magnitude, causes, and impact on CO2 emissions in Madrid Region (1995–2018). Resour. Policy 2022, 75, 102506. [Google Scholar] [CrossRef]
  25. Van der Meulen, S.; Grijspaardt, T.; Mars, W.; Van der Geest, W.; Roest-Crollius, A.; Kiel, J. Cost Figures for Freight Transport—Final Report; Panteia: Zoetermeer, The Netherlands, 2023; p. 86. [Google Scholar]
  26. Gandhi, N.; Kant, R.; Thakkar, J.J. Evaluation of benefits due to adoption of enablers of unimodal road to intermodal railroad freight transportation. Transp. Policy 2024, 146, 295–311. [Google Scholar] [CrossRef]
  27. Agioutantis, Z.; Komnitsas, K.; Athousaki, A. Aggregate transport and utilization: Ecological footprint and environmental impacts. Bull. Geol. Soc. Greece 2013, 47, 1960–1969. [Google Scholar] [CrossRef]
  28. Almagro, A.; Almagro-Gorgea, M. El Anfiteatro en la Hispania Romana. Coloquio Internacional; Junta de Extremadura, Consejería de Cultura y Patrimonio: Badajoz, Spain, 1992; Available online: https://dialnet.unirioja.es/servlet/libro?codigo=10510 (accessed on 15 April 2024).
  29. Coli, M.; Donigaglia, T.; Tanganelli, M. Historical construction materials at Firenze (Italy): A selected supply at km 0. In Proceedings of the VI Congegno Internazionale, ReUSO Messina, Messina, Italy, 11–13 October 2018; pp. 1353–1362. [Google Scholar]
  30. Bouchery, Y.; Fransoo, J. Cost, carbon emissions and modal shift in intermodal network design decisions. Int. J. Prod. Econ. 2015, 164, 388–399. [Google Scholar] [CrossRef]
  31. Campisi, D.; Gastaldi, M. Environmental protection, economic efficiency and intermodal competition in freight transport. Transp. Res. Part C Emerg. Technol. 1996, 4, 391–406. [Google Scholar] [CrossRef]
  32. Dobruszkes, F.; Mattioli, G.; Mathieu, L. Banning super short-haul flights: Environmental evidence or political turbulence? J. Transp. Geogr. 2022, 104, 103457. [Google Scholar] [CrossRef]
  33. Pinto, J.T.d.M.; Mistage, O.; Bilotta, P.; Helmers, E. Road-rail intermodal freight transport as a strategy for climate change mitigation. Environ. Dev. 2018, 25, 100–110. [Google Scholar] [CrossRef]
  34. Reiter, V.; Voltes-Dorta, A.; Suau-Sanchez, P. The substitution of short-haul flights with rail services in German air travel markets: A quantitative analysis. Case Stud. Transp. Policy 2022, 10, 2025–2043. [Google Scholar] [CrossRef]
  35. IGME. Base de Datos de Recursos Minerales (BDMIN); IGME: Madrid, Spain, 2023. [Google Scholar]
  36. IGN. Download Center; IGN: Los Angeles, CA, USA, 2023. [Google Scholar] [CrossRef]
  37. Gobierno de España. Real Decreto 1071/2007, de 27 de Julio, por el que se Regula el Sistema Geodésico de Referencia Oficial en España. 2007, 1071/2007, 4. Available online: https://www.boe.es/buscar/doc.php?id=BOE-A-2007-15822 (accessed on 2 September 2023).
  38. ESRI. What is the ArcGIS Network Analyst Extension? 10.5th ed; Environmental Systems Research Institute: Beijing, China, 2016. [Google Scholar]
  39. IGME. Estadística Minera de España; IGME: Madrid, Spain, 2021; Volume 445. [Google Scholar]
  40. ESRI. ArcGIS Desktop ArcCatalog, Version 10.5; Environmental Systems Research Institute: Beijing, China, 2016.
  41. ESRI. ArcGIS Desktop ArcMap, Version 10.5; Environmental Systems Research Institute: Beijing, China, 2016.
  42. ESRI. ArcGIS Pro, Version 2.9; Environmental Systems Research Institute: Beijing, China, 2021.
  43. ESRI. ArcGIS Arcpy, Version 10.5; Environmental Systems Research Institute: Beijing, China, 2016.
  44. Renfe. Fleet of Railway Carriages. Available online: https://www.renfe.com/es/en/renfe-group/corporations/renfe-freight/freight-products/fleet-of-railway-carriages (accessed on 4 January 2024).
  45. Renfe. Renfe Permite un Ahorro de 305 Millones de euros en Términos de Impacto Ambiental. Available online: https://www.renfe.com/es/es/grupo-renfe/comunicacion/renfe-al-dia/sala-de-prensa/renfe-permite-ahorro-trescientos-cinco-millones-euros-terminos-impacto-ambiental (accessed on 29 October 2024).
  46. REData. Estructura de la Generación por Tecnologías (GWh). Available online: https://www.ree.es/es/datos/generacion/estructura-generacion (accessed on 28 September 2023).
  47. United Nations General Assembly. SDG 11.2: Sustainable Transport. Available online: https://sdgs.un.org/topics/sustainable-transport (accessed on 4 January 2024).
  48. EMT. EMT Dejará de Emitir 21.300 Toneladas de Gases Invernadero Hasta 2022. Available online: https://www.emtmadrid.es/Noticias/EMT-dejara-de-emitir-21-300-toneladas-de-gases-(1).aspx (accessed on 4 January 2024).
  49. ArchDaily. Zero Kilometer Materials: Preserving the Environment and Local Cultures. Available online: https://www.archdaily.com/958893/zero-kilometer-materials-preserving-the-environment-and-local-cultures (accessed on 4 January 2024).
  50. Duch, J. Reducing Carbon Emissions: EU Targets and Policies; Directorate General for Communication Article; European Parliament: Brussels, Strasbourg, 2023. [Google Scholar]
  51. Sanderson, K.; Wong, C. EU unveils controversial climate target: What scientists think. Nature 2024, 626, 467. [Google Scholar] [CrossRef]
Figure 1. Graphical summary of this study: evaluation of CO2 emissions and the economic cost to accommodate the demand for aggregates with the currently used transport mode (road-only transport) and the proposed intermodal rail/road transport model that seeks to reduce CO2 emissions as well as transport costs.
Sustainability 16 09871 g001
Figure 2. Examples of element detection within an aggregate quarry using computer vision.
Sustainability 16 09871 g002
Figure 3. Flow diagram of the methodology followed for the estimation of carbon emissions and costs of aggregate transportation: (A) by road and (B) by intermodal rail and road.
Sustainability 16 09871 g003
Figure 4. Location of the production quarries, with the source quarries in purple and their respective intermodal terminals in green.
Sustainability 16 09871 g004
Figure 5. Close-up view of the potential location of the proposed intermodal terminals, all in industrial areas and near railway lines: (A) North site, (B) East site and (C,D) south sites. The stars indicate the proposed location of the intermodal terminals.
Sustainability 16 09871 g005
Figure 6. Road network (in red) and railway network (in black) of Madrid and its surrounding provinces: Ávila, Segovia, Guadalajara, Cuenca, and Toledo.
Sustainability 16 09871 g006
Figure 7. Location of the provinces analyzed with their annual production of aggregates (P) and average production per quarry (Q) for the year 2020.
Sustainability 16 09871 g007
Figure 8. Demand for aggregates in the different villages in Madrid province measured in number of trucks. Those with the highest demand are labeled for reference.
Sustainability 16 09871 g008
Figure 9. Evolution of cost and carbon emissions with increasing amount of aggregates being transported by the intermodal rail/road transport mode. As intermodal transport increases, the economic costs and CO2 emissions decrease until they reach minimums, from which they slightly increase.
Sustainability 16 09871 g009
Table 1. Results of emission and costs for the different scenarios.
Intermodal Terminals Production
(Tons per Quarry)
Direct Truck Transportation
(km)
Carbon Emitted by Trucks
(Tons)
Carbon Emitted by Train
(Tons)
Total Carbon Emissions
(Tons)
Carbon
Reduction
(%)
Total Transport Cost
(EUR)
-56,830,40373,144-73,141-178,248,558
59,82956,016,90772,09415272,2461.2175,953,006
187,32950,668,78165,21147565,68610.2159,724,107
314,82946,390,61259,70579960,50317.3146,851,130
442,32942,429,63254,607112255,72923.8134,973,016
569,82938,854,28750,005144551,45129.7124,304,447
697,32935,853,60946,144176947,91234.5115,438,320
824,82932,801,69342,216209244,30839.4106,411,483
965,07929,792,68438,343244840,79144.297,573,777
1,092,57927,244,31335,063277137,83548.390,126,311
1,220,07924,879,85732,020309535,11552.083,255,693
1,347,57922,732,33929,257341832,67555.377,065,504
1,462,32915,231,37419,603370923,31268.154,029,677
1,589,82911,095,91514,280403318,31375.041,604,307
1,717,32910,234,82513,172435617,52876.039,449,000
1,844,8299,971,62312,833467917,51376.139,168,966
1,972,3299,842,75212,668500317,67075.839,310,261
2,099,8299,842,75212,668532617,99475.439,855,761
2,227,3299,842,75212,668565018,31775.040,401,260
Disclaimer/Publisher’s Note: The statements, opinions and data contained in all publications are solely those of the individual author(s) and contributor(s) and not of MDPI and/or the editor(s). MDPI and/or the editor(s) disclaim responsibility for any injury to people or property resulting from any ideas, methods, instructions or products referred to in the content.

