Assessing the Spatial Distribution of Carbon Emissions and Influencing Factors in the Yellow River Basin


Abstract
1. Introduction
2. Research Data and Methods
2.1. Study Area
2.2. Carbon Emission Estimates and Data Sources
2.2.1. Estimation of Carbon Emissions
2.2.2. Data Sources
2.3. Research Methodology
2.3.1. Standard Deviation Ellipse
2.3.2. Theil Index
2.3.3. Kernel Density Estimates
2.3.4. Geographic Detectors
3. Results and Discussion
3.1. Results Analysis
3.2. Spatial and Temporal Distribution Characteristics
3.3. Analysis of the Global and Local Characteristics of Carbon Emissions
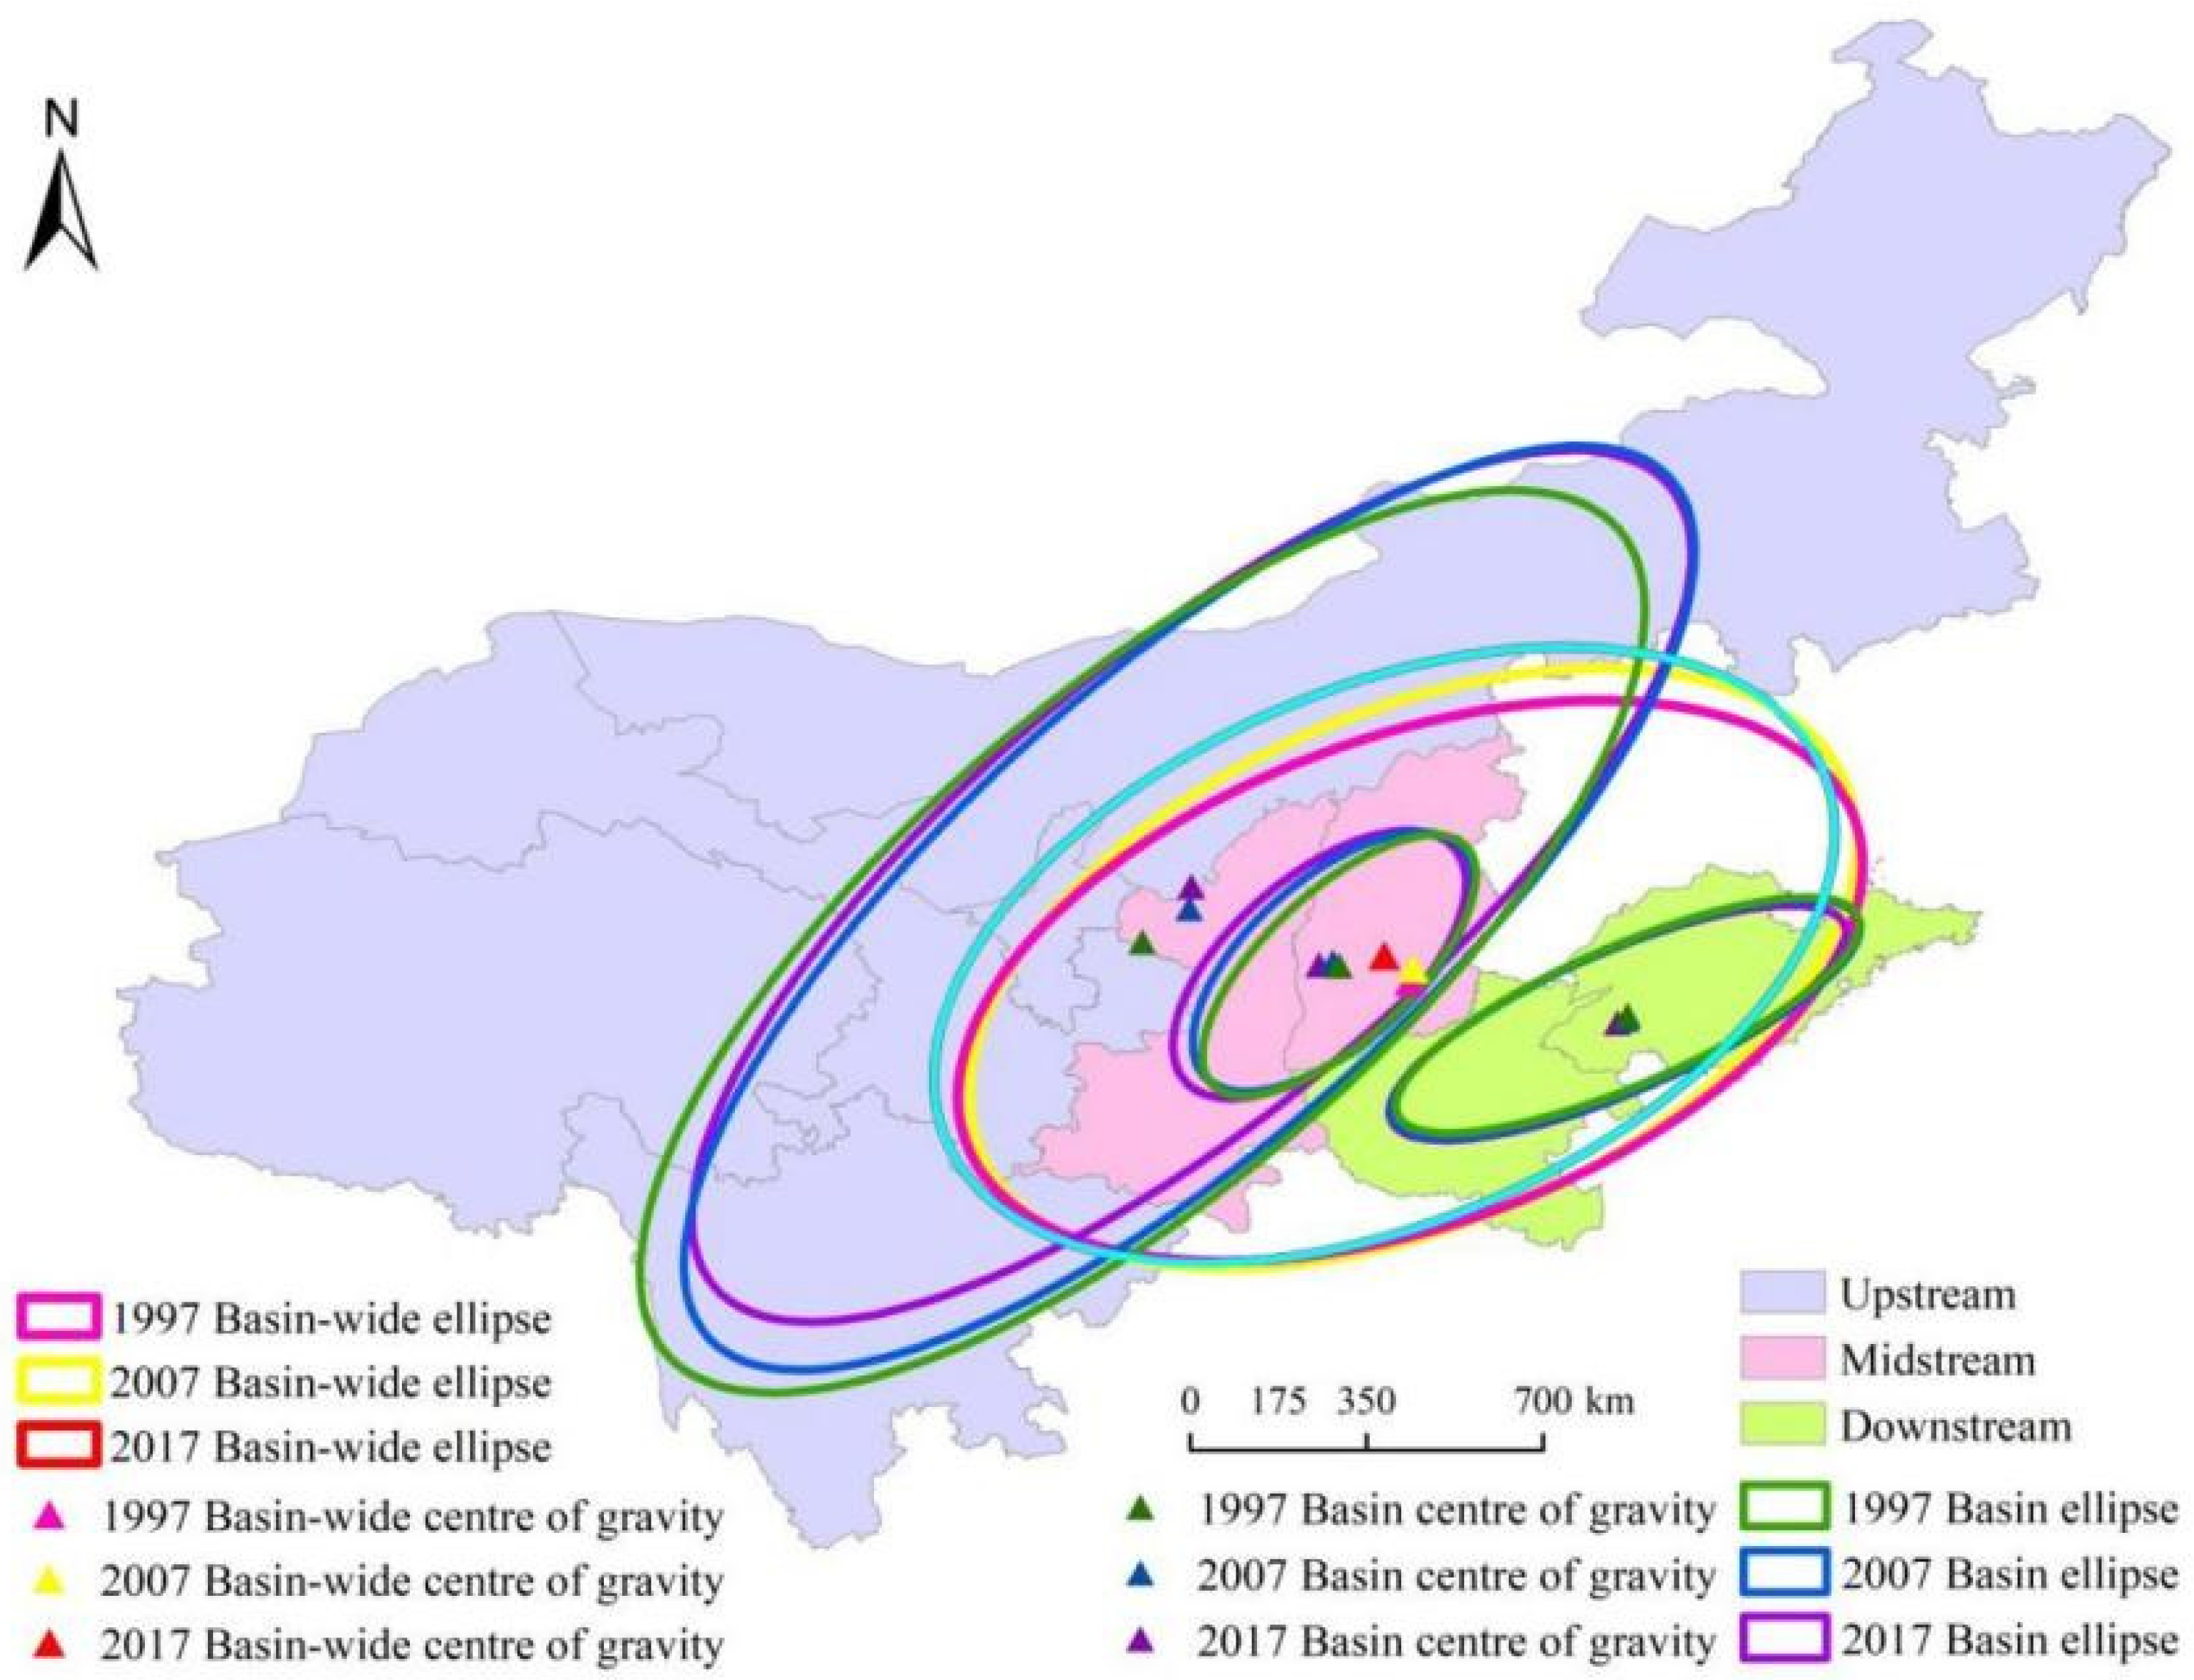
3.4. Shift in the Center of Gravity of Carbon Emissions and Standard Deviation Ellipse Analysis
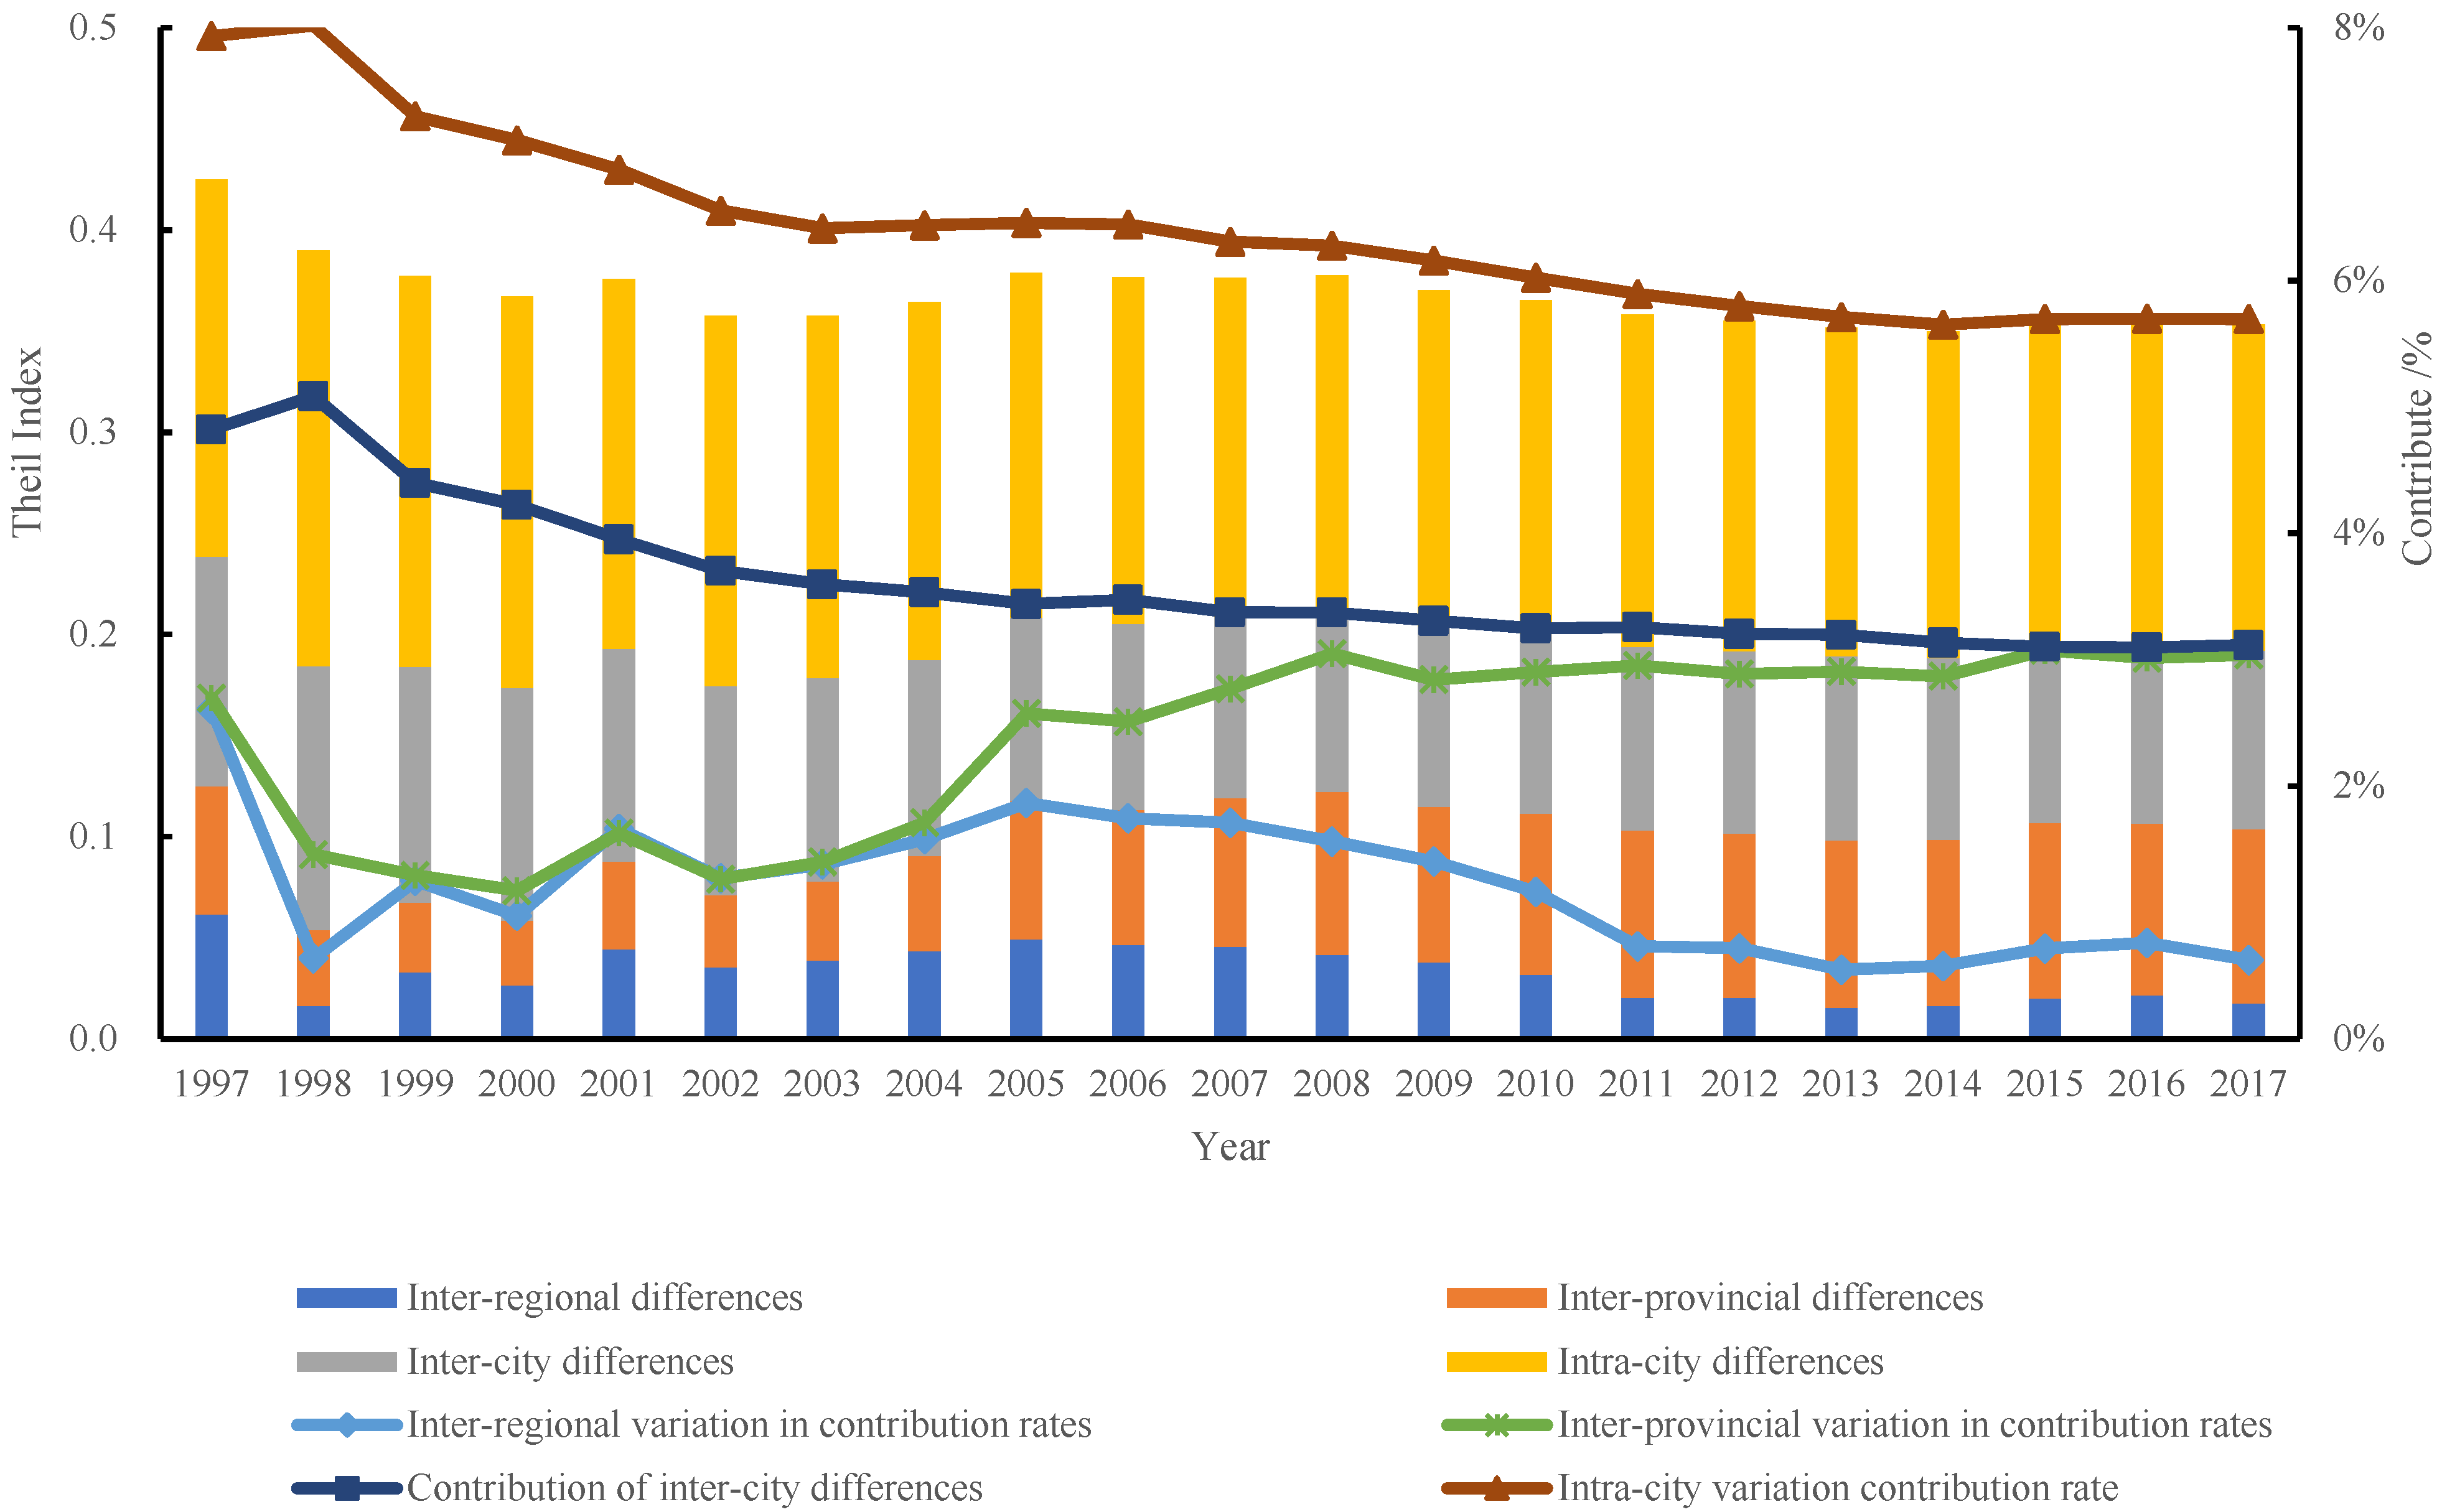
3.5. Spatial Differences in Carbon Emissions and Their Decomposition
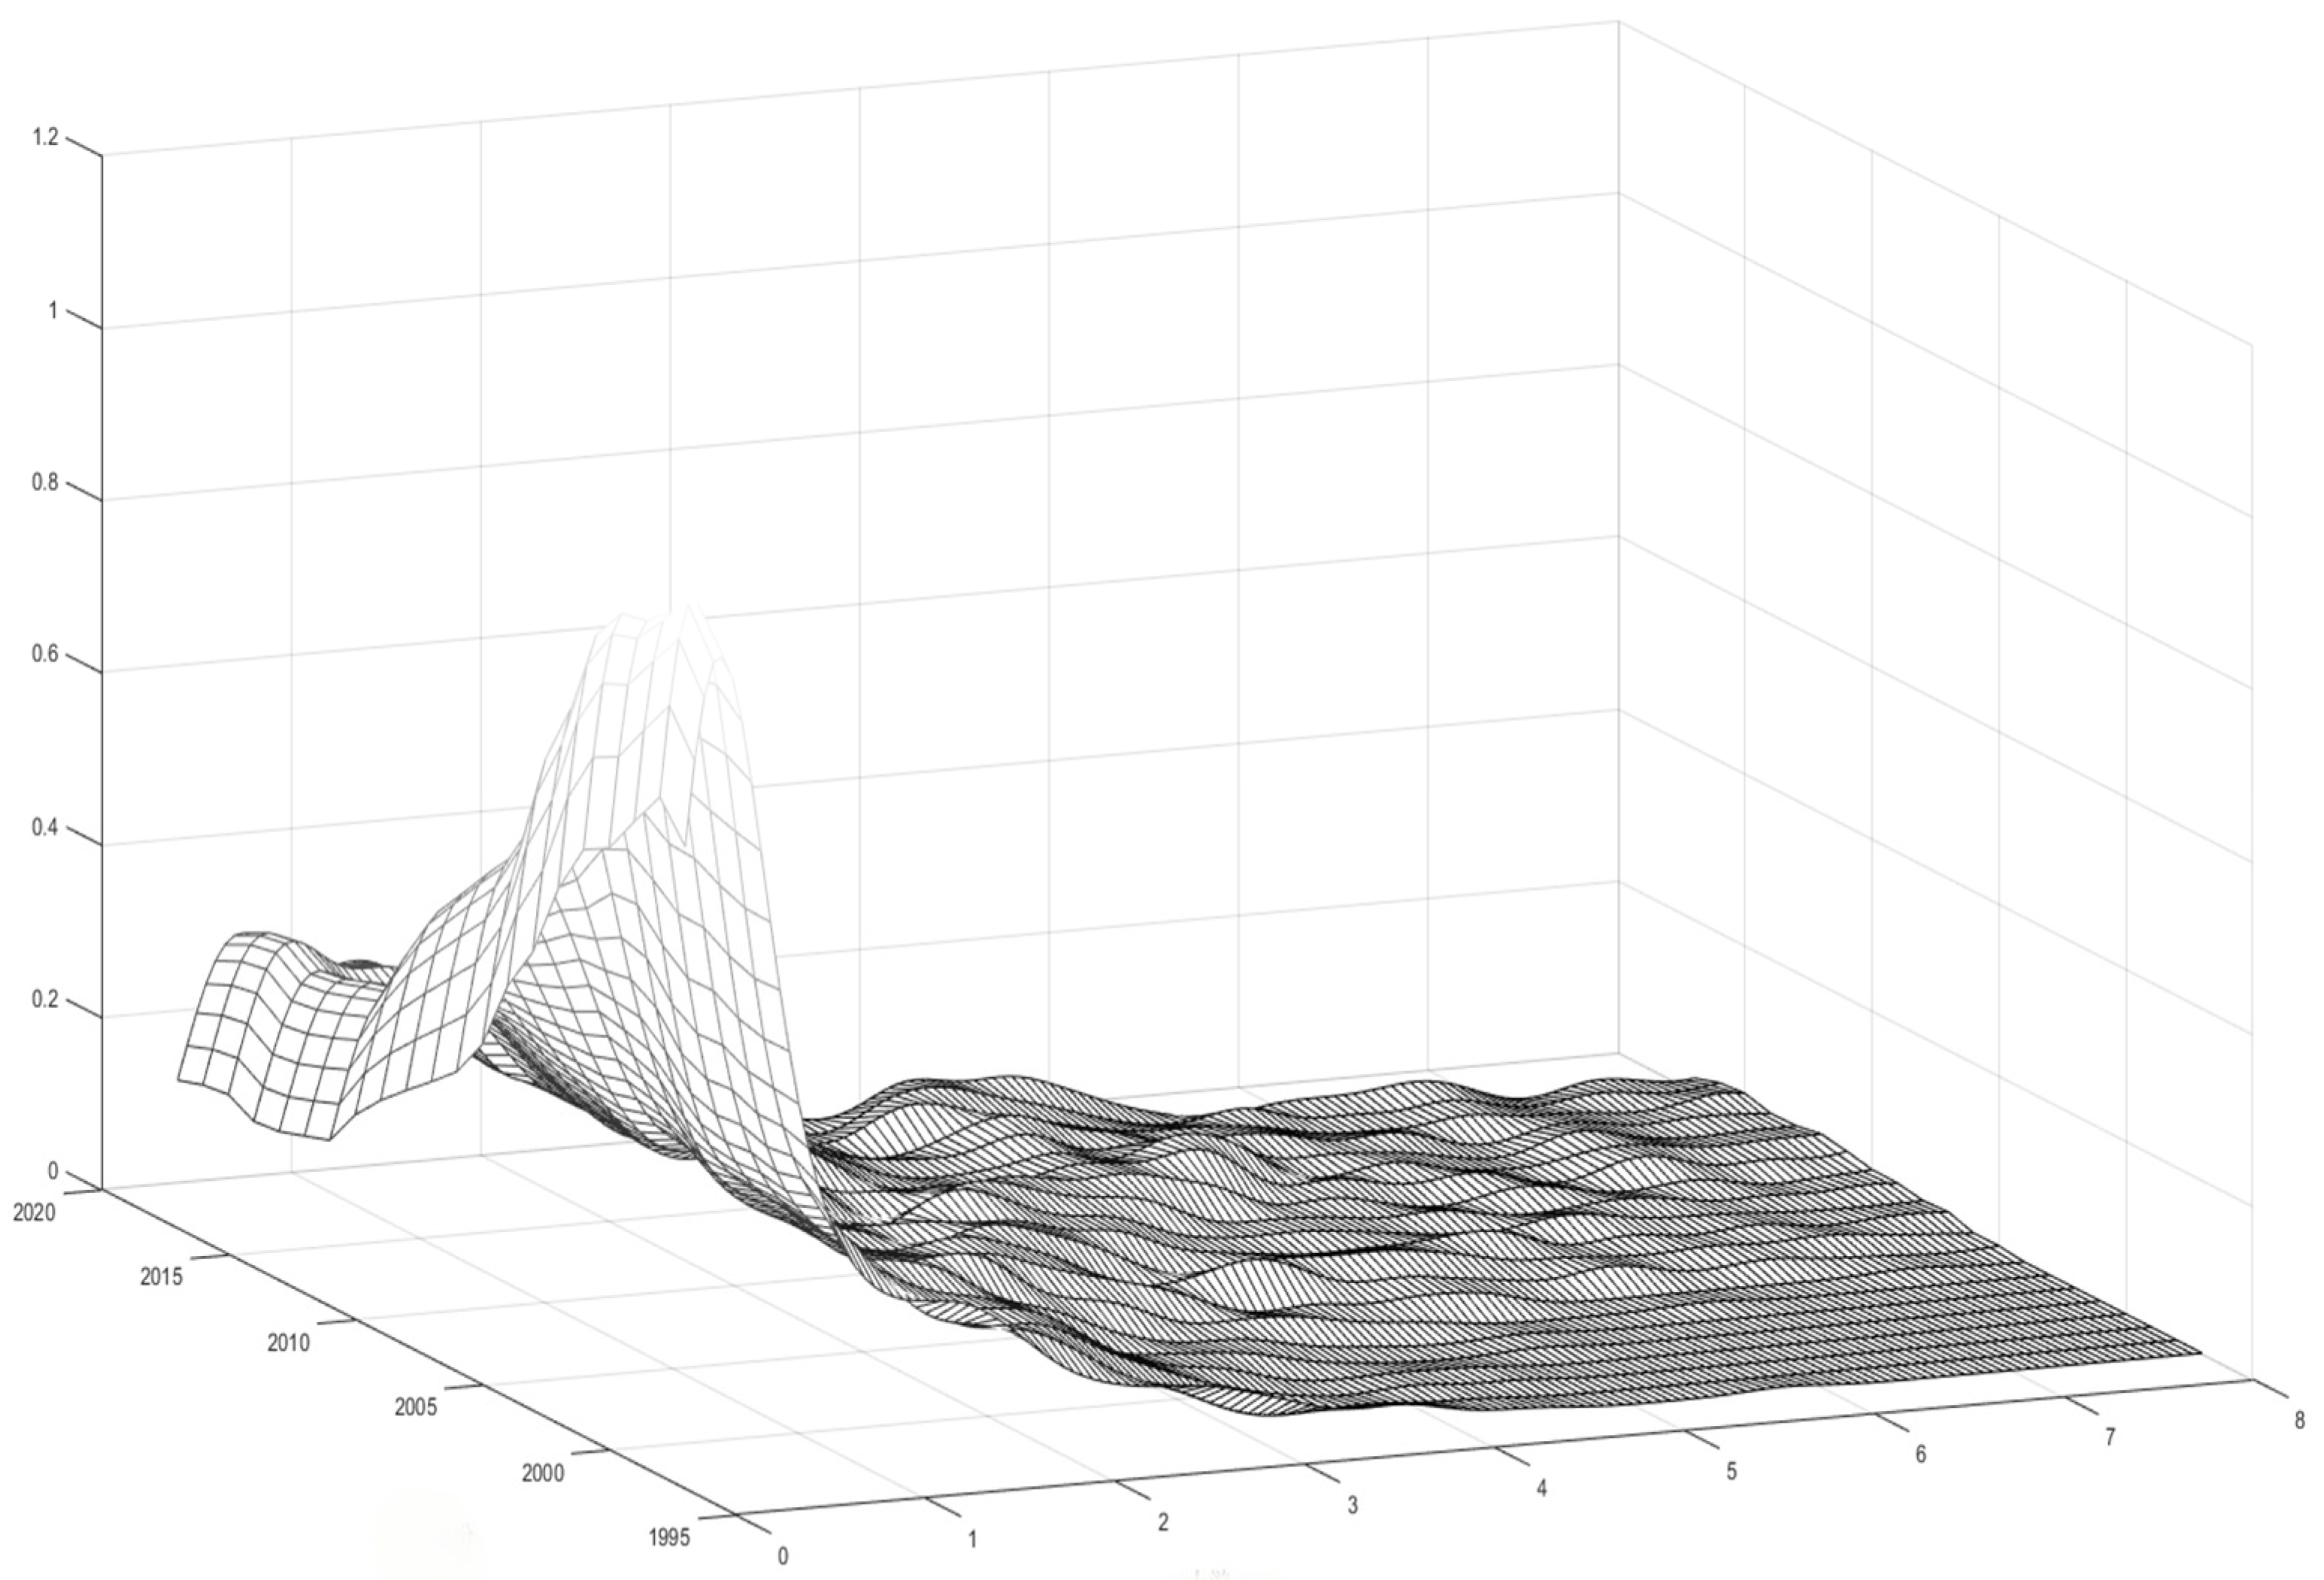
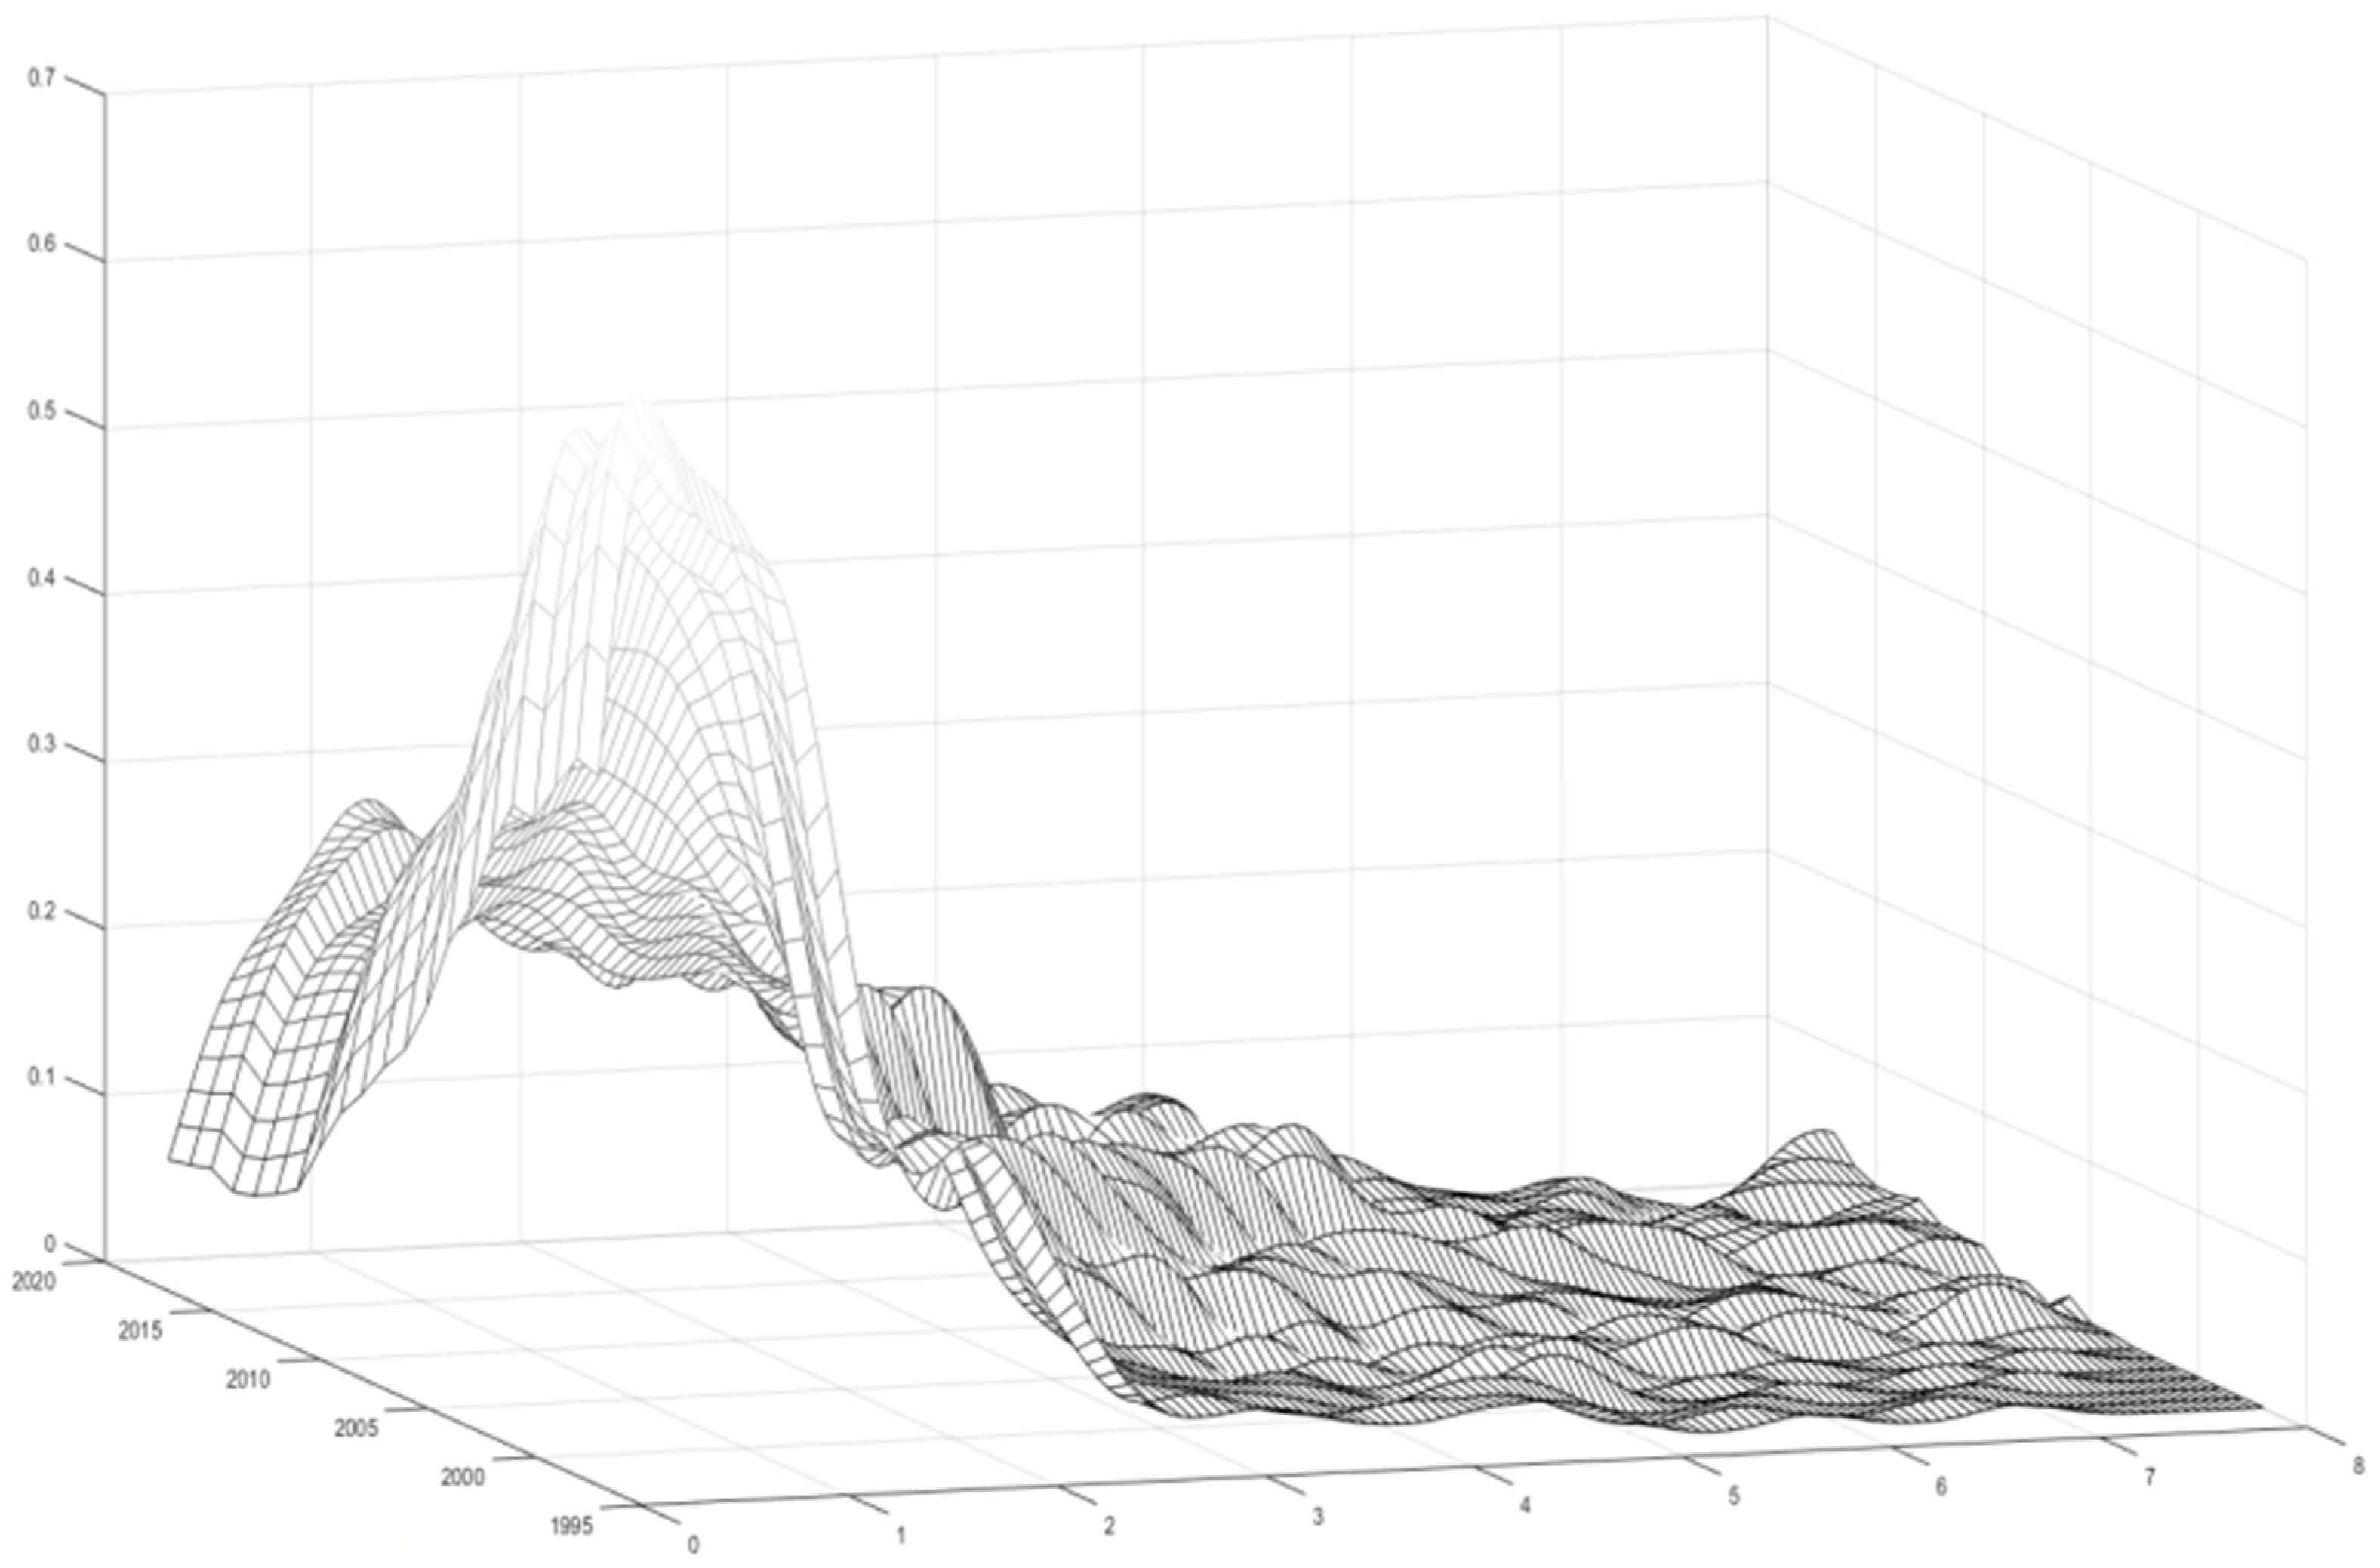
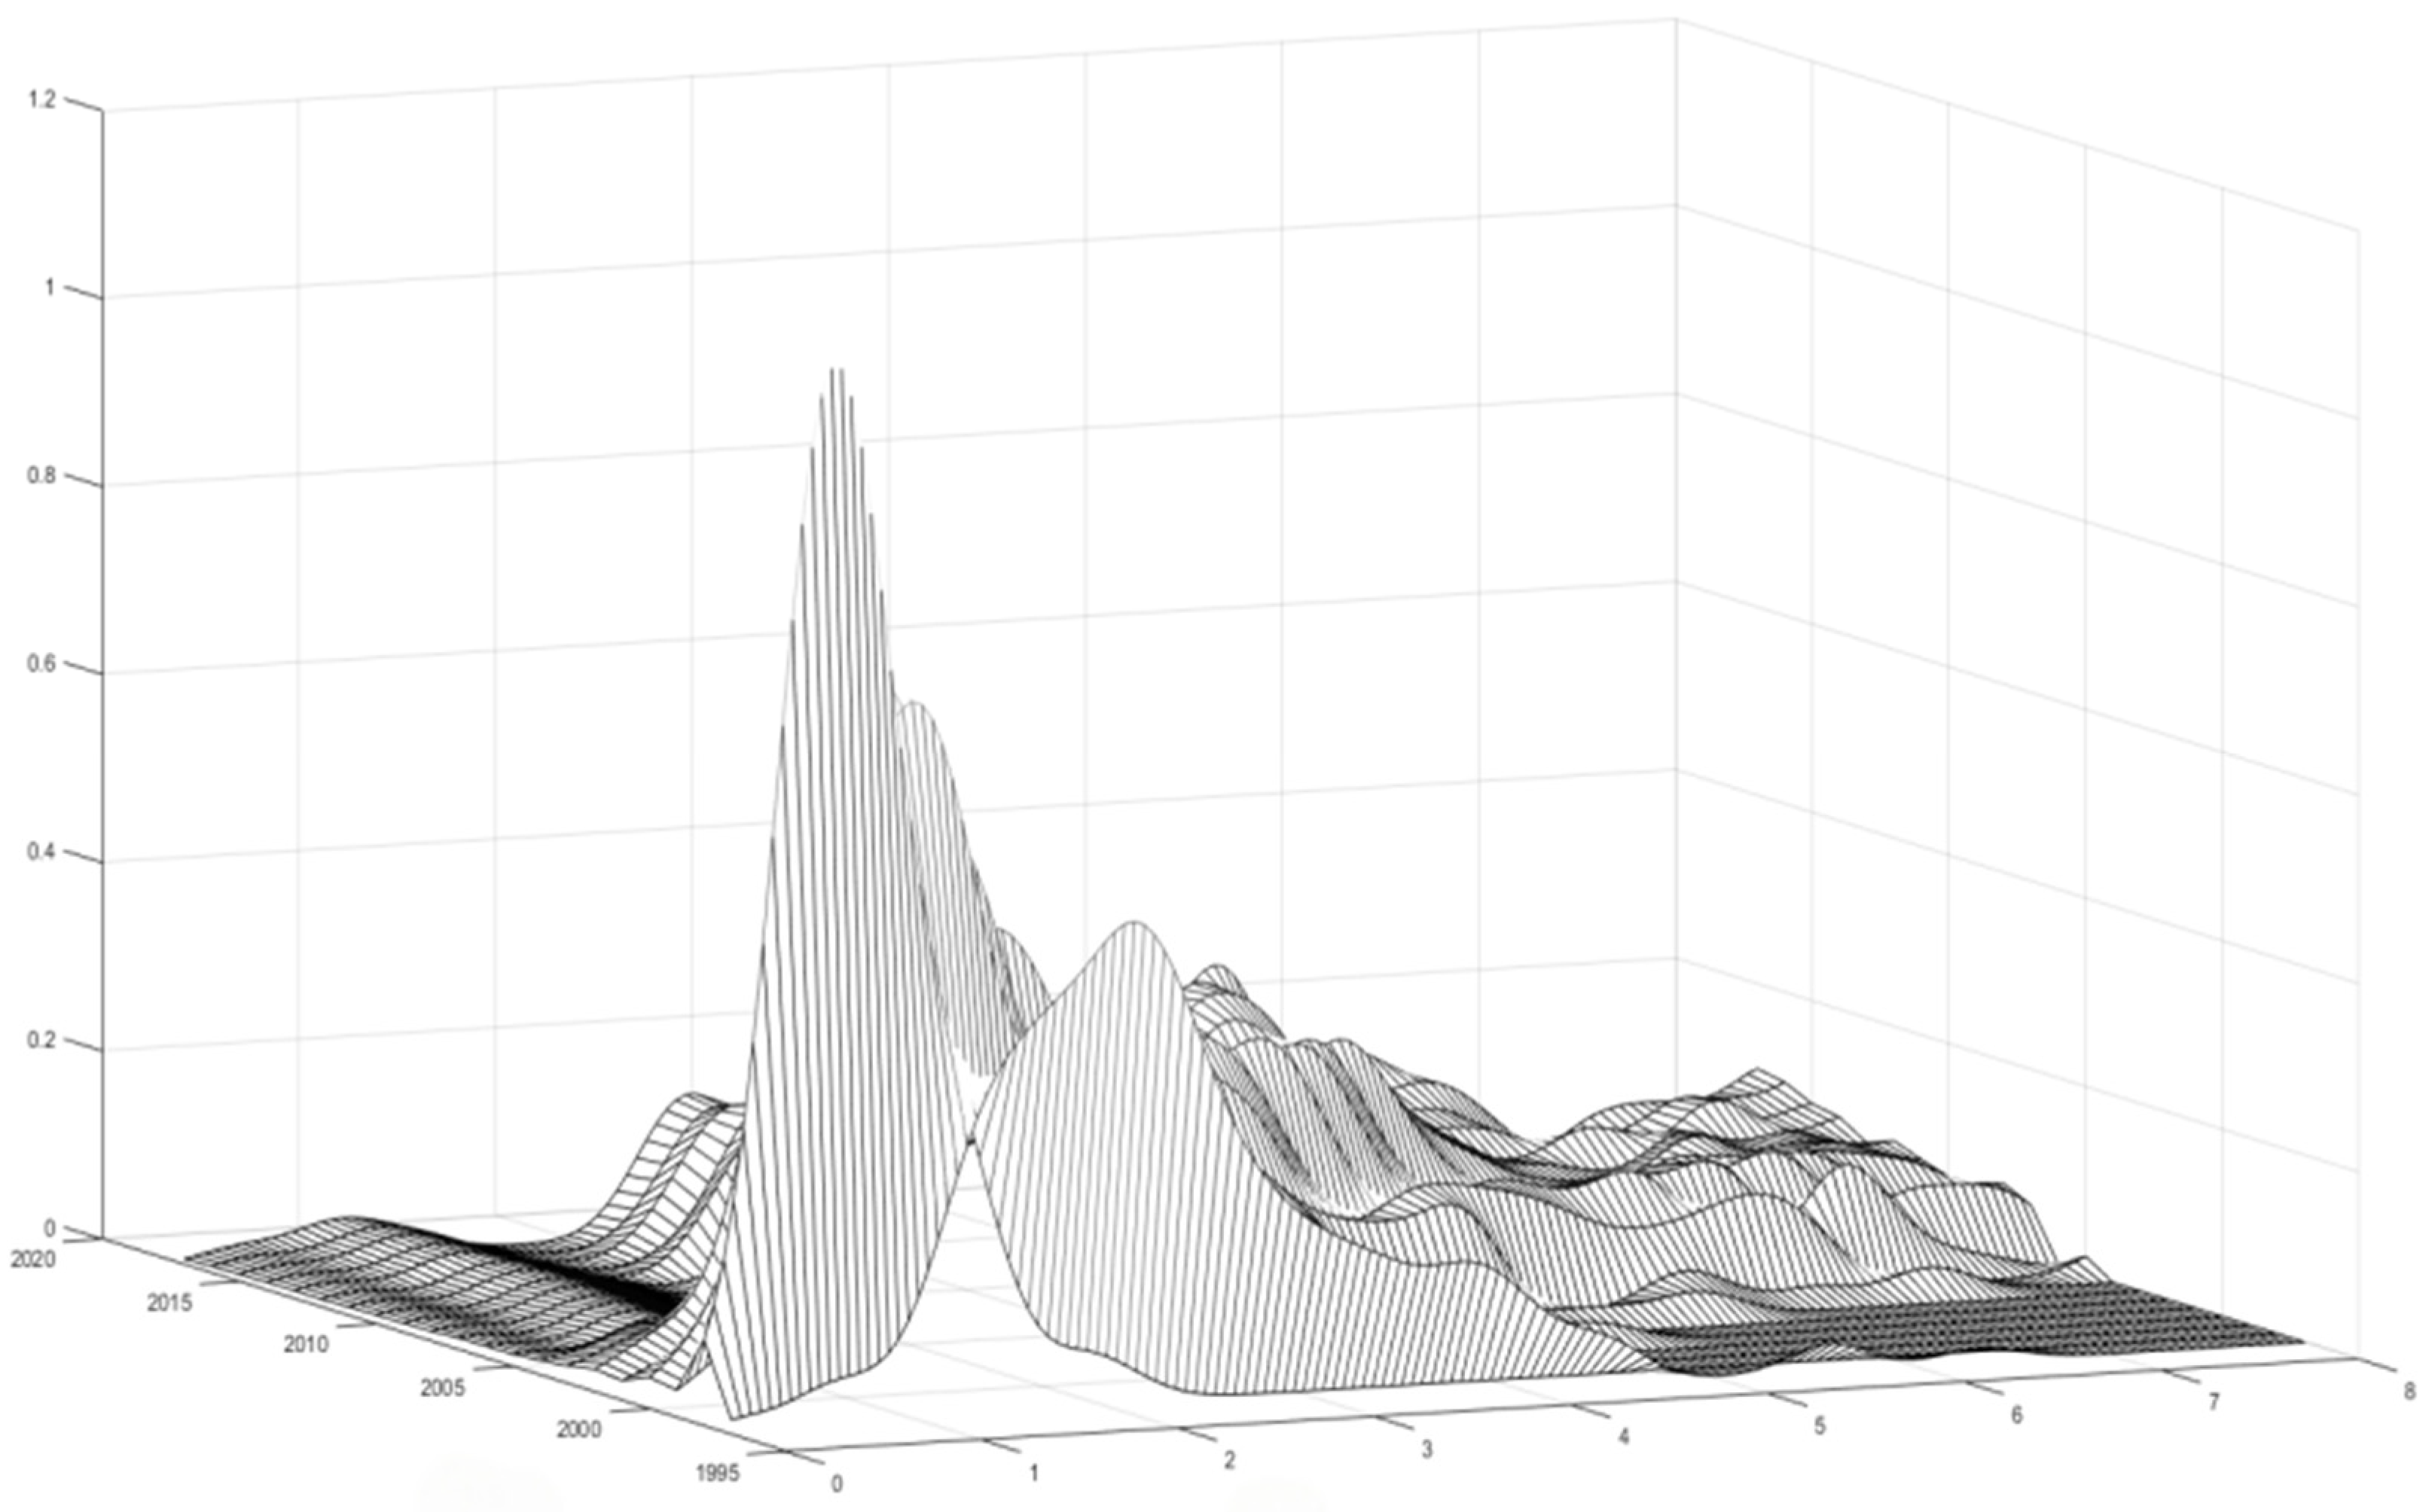
3.6. Dynamic Evolution of Spatial and Temporal Distribution
3.7. Analysis of Factors and Mechanisms Influencing Carbon Emissions
3.8. Discussion
4. Conclusions and Policy Implications
4.1. Conclusions
4.2. Policy Implications
Author Contributions
Funding
Institutional Review Board Statement
Informed Consent Statement
Data Availability Statement
Conflicts of Interest
References
- Yu, X.; Wan, K.; Du, Q. Can carbon market policies achieve a “point-to-surface” effect?—Quasi-experimental evidence from China. Energy Policy 2023, 183, 113803. [Google Scholar]
- Zhao, B.; Sun, L.; Qin, L. Optimization of China’s provincial carbon emission transfer structure under the dual constraints of economic development and emission reduction goals. Environ. Sci. Pollut. Res. 2022, 29, 50335–50351. [Google Scholar]
- Mielnik, O.; Goldemberg, J. Communication the evolution of the “carbonization index” in developing countries. Energy Policy 1999, 27, 307–308. [Google Scholar]
- Zhang, J. Evaluating regional low-carbon tourism strategies using the fuzzy Delphi- analytic network process approach. J. Clean. Prod. 2017, 141, 409–419. [Google Scholar] [CrossRef]
- Li, Y.; Hou, W.; Zhu, W.; Li, F.; Liang, L. Provincial carbon emission performance analysis in China based on a Malmquist data envelopment analysis approach with fixed-sum undesirable outputs. Ann. Oper. Res. 2021, 304, 233–261. [Google Scholar]
- Wang, S.; Fang, C.; Wang, Y. Spatiotemporal variations of energy-related CO2 emissions in China and its influencing factors: An empirical analysis based on provincial panel data. Renew. Sustain. Energy Rev. 2016, 55, 505–515. [Google Scholar]
- Shi, K.; Chen, Y.; Yu, B.; Xu, T.; Chen, Z.; Liu, R.; Wu, J. Modeling spatiotemporal CO2 (carbon dioxide) emission dynamics in China from DMSP-OLS nighttime stable light data using panel data analysis. Appl. Energy 2016, 168, 523–533. [Google Scholar]
- Meng, X.; Han, J.; Huang, C. An improved vegetation adjusted nighttime light urban index and its application in quantifying spatiotemporal dynamics of carbon emissions in China. Remote Sens. 2017, 9, 829. [Google Scholar] [CrossRef]
- Cui, X.; Lei, Y.; Zhang, F.; Zhang, X.; Wu, F. Mapping spatiotemporal variations of CO2 (carbon dioxide) emissions using nighttime light data in Guangdong Province. Phys. Chem. Earth Parts A/B/C 2019, 110, 89–98. [Google Scholar] [CrossRef]
- Zhou, K.; Yang, J.; Yang, T.; Ding, T. Spatial and temporal evolution characteristics and spillover effects of China’s regional carbon emissions. J. Environ. Manag. 2023, 325, 116423. [Google Scholar]
- Cheng, Y.; Wang, Z.; Ye, X.; Wei, Y.D. Spatiotemporal dynamics of carbon intensity from energy consumption in China. J. Geogr. Sci. 2014, 24, 631–650. [Google Scholar] [CrossRef]
- Zhang, L.; Weng, D.; Xu, Y.; Hong, B.; Wang, S.; Hu, X.; Wang, Z. Spatio-temporal evolution characteristics of carbon emissions from road transportation in the mainland of China from 2006 to 2021. Sci. Total Environ. 2024, 917, 170430. [Google Scholar] [CrossRef] [PubMed]
- Nie, Y.; Wan, K.; Wu, F.; Zou, W.; Chang, T. Local government competition, development zones and urban green innovation: An empirical study of Chinese cities. Appl. Econ. Lett. 2021, 29, 1509–1514. [Google Scholar] [CrossRef]
- Zhang, Y.; Yu, Z.; Zhang, J. Research on carbon emission differences decomposition and spatial heterogeneity pattern of China’s eight economic regions. Environ. Sci. Pollut. Res. 2022, 29, 29976–29992. [Google Scholar] [CrossRef] [PubMed]
- Wang, L.; Zhang, M.; Song, Y. Research on the spatiotemporal evolution characteristics and driving factors of the spatial connection network of carbon emissions in China: New evidence from 260 cities. Energy 2024, 291, 130448. [Google Scholar] [CrossRef]
- Nie, C.; Lee, C.C. Synergy of pollution control and carbon reduction in China: Spatial–temporal characteristics, regional differences, and convergence. Environ. Impact Assess. Rev. 2023, 101, 107110. [Google Scholar] [CrossRef]
- Zhang, C.Y.; Zhao, L.; Zhang, H.; Chen, M.N.; Fang, R.Y.; Yao, Y.; Zhang, Q.P.; Wang, Q. Spatial-temporal characteristics of carbon emissions from land use change in Yellow River Delta region, China. Ecol. Indic. 2022, 136, 108623. [Google Scholar] [CrossRef]
- Guo, X.M.; Fang, C.L. How does urbanization affect energy carbon emissions under the background of carbon neutrality? J. Environ. Manag. 2023, 327, 116878. [Google Scholar]
- Sun, W.; Huang, C. Predictions of carbon emission intensity based on factor analysis and an improved extreme learning machine from the perspective of carbon emission efficiency. J. Clean. Prod. 2022, 338, 130414. [Google Scholar] [CrossRef]
- Meng, Z.; Wang, H.; Wang, B. Empirical analysis of carbon emission accounting and influencing factors of energy consumption in China. Int. J. Environ. Res. Public Health 2018, 15, 2467. [Google Scholar] [CrossRef]
- Rong, T.; Zhang, P.; Zhu, H.; Jiang, L.; Li, Y.; Liu, Z. Spatial correlation evolution and prediction scenario of land use carbon emissions in China. Ecol. Inform. 2022, 71, 101802. [Google Scholar] [CrossRef]
- Wang, Y.; Liao, M.; Xu, L.; Malik, A. The impact of foreign direct investment on China’s carbon emissions through energy intensity and emissions trading system. Energy Econ. 2021, 97, 105212. [Google Scholar] [CrossRef]
- Vaninsky, A. Factorial decomposition of CO2 emissions: A generalized Divisia index approach. Energy Econ. 2014, 45, 389–400. [Google Scholar] [CrossRef]
- Zhang, Q.; Xu, C.Y.; Yang, T. Variability of water resource in the Yellow River basin of past 50 years, China. Water Resour. Manag. 2009, 23, 1157–1170. [Google Scholar] [CrossRef]
- Gong, W.; Zhang, H.; Wang, C.; Wu, B.; Yuan, Y.; Fan, S. Analysis of urban carbon emission efficiency and influencing factors in the Yellow River Basin. Environ. Sci. Pollut. Res. 2023, 30, 14641–14655. [Google Scholar] [CrossRef] [PubMed]
- Yuan, X.; Sheng, X.; Chen, L.; Tang, Y.; Li, Y.; Jia, Y.; Qu, D.; Wang, Q.; Ma, Q.; Zuo, J. Carbon footprint and embodied carbon transfer at the provincial level of the Yellow River Basin. Sci. Total Environ. 2022, 803, 149993. [Google Scholar] [CrossRef] [PubMed]
- Rong, T.; Zhang, P.; Jing, W.; Zhang, Y.; Li, Y.; Yang, D.; Yang, J.; Chang, H.; Ge, L. Carbon dioxide emissions and their driving forces of land use change based on Economic Contributive Coefficient (ECC) and Ecological Support Coefficient (ESC) in the lower Yellow river region (1995–2018). Energies 2020, 13, 2600. [Google Scholar] [CrossRef]
- Song, M.; Gao, Y.; Zhang, L.; Dong, F.; Zhao, X.; Wu, J. Spatiotemporal evolution and driving factors of carbon emission efficiency of resource-based cities in the Yellow River Basin of China. Environ. Sci. Pollut. Res. 2023, 30, 96795–96807. [Google Scholar] [CrossRef]
- Guo, W.; Li, Y.; Li, P.; Zhao, X.; Zhang, J. Using a combination of nighttime light and MODIS data to estimate spatiotemporal patterns of CO2 emissions at multiple scales. Sci. Total Environ. 2022, 848, 157630. [Google Scholar] [CrossRef]
- Chen, J.; Gao, M.; Cheng, S.; Hou, W.; Song, M.; Liu, X.; Liu, Y.; Shan, Y. County-level CO2 emissions and sequestration in China during 1997–2017. Sci. Data 2020, 7, 391. [Google Scholar] [CrossRef]
- Song, Y.; Wu, P.; Gilmore, D.; Li, Q. A spatial heterogeneity-based segmentation model for analyzing road deterioration network data in multi-scale infrastructure systems. IEEE Trans. Intell. Transp. Syst. 2020, 22, 7073–7083. [Google Scholar] [CrossRef]
- Liu, J.; Shi, T.; Huang, L. A Study on the Impact of Industrial Restructuring on Carbon Dioxide Emissions and Scenario Simulation in the Yellow River Basin. Water 2022, 14, 3833. [Google Scholar] [CrossRef]
- Wang, S.; Li, G.; Fang, C. Urbanization, economic growth, energy consumption, and CO2 emissions: Empirical evidence from countries with different income levels. Renew. Sustain. Energy Rev. 2018, 81, 2144–2159. [Google Scholar] [CrossRef]
- Liu, J.P.; Zhang, X.B.; Song, X.H. Regional carbon emission evolution mechanism and its prediction approach driven by carbon trading-A case study of Beijing. J. Clean. Prod. 2018, 172, 2793–2810. [Google Scholar] [CrossRef]
- Wang, X.; Shen, Y.; Su, C. Spatial-temporal evolution and driving factors of carbon emission efficiency of cities in the Yellow River Basin. Energy Repr. 2023, 9, 1065–1070. [Google Scholar] [CrossRef]
- Sadorsky, P. Do urbanization and industrialization affect energy intensity in developing countries? Energy Econ. 2013, 37, 52–59. [Google Scholar] [CrossRef]
- Han, Y.; Wang, X.; Zhe, C. Carbon emissions, ecological efficiency, and the economic development stage: Evidence from the Yellow River Basin. Sci. Program. 2022, 2022, 2216781. [Google Scholar] [CrossRef]
- Wei, W.; Du, H.; Ma, L.; Liu, C.; Zhou, J. Spatiotemporal dynamics of CO2 emissions using nighttime light data: A comparative analysis between the Yellow and Yangtze River Basins in China. Environ. Dev. Sustain. 2024, 26, 1081–1102. [Google Scholar] [CrossRef]
- Sun, W.; Huang, C. How does urbanization affect carbon emission efficiency? Evidence from China. J. Clean. Prod. 2020, 272, 122828. [Google Scholar] [CrossRef]
- Yang, S.; Fu, W.; Hu, S.; Ran, P. Watershed carbon compensation based on land use change: Evidence from the Yangtze River Economic Belt. Habitat Int. 2022, 126, 102613. [Google Scholar] [CrossRef]
- Guo, A.; Yang, C.; Zhong, F. Influence mechanisms and spatial spillover effects of industrial agglomeration on carbon productivity in China’s Yellow River Basin. Environ. Sci. Pollut. Res. 2023, 30, 15861–15880. [Google Scholar] [CrossRef] [PubMed]


| Entire Basin | Upper Reaches | Middle Reaches | Lower Reaches | |
|---|---|---|---|---|
| 1997 | 1.167 | 0.780 | 0.956 | 1.766 |
| 1998 | 0.846 | 0.667 | 0.916 | 0.954 |
| 1999 | 1.003 | 0.722 | 0.961 | 1.326 |
| 2000 | 1.025 | 0.759 | 1.021 | 1.294 |
| 2001 | 1.116 | 0.777 | 0.996 | 1.574 |
| 2002 | 1.162 | 0.832 | 1.091 | 1.564 |
| 2003 | 1.382 | 0.982 | 1.265 | 1.900 |
| 2004 | 1.585 | 1.113 | 1.403 | 2.239 |
| 2005 | 1.999 | 1.417 | 1.642 | 2.936 |
| 2006 | 2.244 | 1.610 | 1.858 | 3.263 |
| 2007 | 2.414 | 1.763 | 1.960 | 3.520 |
| 2008 | 2.615 | 1.967 | 2.101 | 3.777 |
| 2009 | 2.789 | 2.117 | 2.279 | 3.971 |
| 2010 | 3.059 | 2.401 | 2.512 | 4.265 |
| 2011 | 3.434 | 2.888 | 2.868 | 4.545 |
| 2012 | 3.496 | 2.933 | 2.938 | 4.619 |
| 2013 | 3.471 | 3.025 | 2.920 | 4.468 |
| 2014 | 3.549 | 3.082 | 2.959 | 4.604 |
| 2015 | 3.389 | 2.908 | 2.756 | 4.504 |
| 2016 | 3.492 | 2.972 | 2.829 | 4.674 |
| 2017 | 3.552 | 3.110 | 2.876 | 4.669 |
| Impact Factor | q | ||||
|---|---|---|---|---|---|
| Basin-Wide | Upstream | Midstream | Downstream | ||
| Economic development | GDP | 0.359 | 0.469 | 0.394 | 0.370 |
| Population | HC | 0.108 | 0.109 | 0.200 | 0.280 |
| Industrial agglomeration | IA | 0.157 | 0.130 | 0.310 | 0.139 |
| Urbanization | Urban | 0.232 | 0.169 | 0.158 | 0.353 |
| Government support | Government | 0.022 | 0.022 | 0.064 | 0.207 |
| Interaction Factor | Basin-Wide | Upstream | Midstream | Downstream |
|---|---|---|---|---|
| GDP × HC | 0.5706 | 0.6915 | 0.7120 | 0.7458 |
| GDP × IA | 0.4595 | 0.5874 | 0.6098 | 0.6605 |
| GDP × Urban | 0.4231 | 0.6002 | 0.6244 | 0.4823 |
| GDP × Government | 0.3752 | 0.5359 | 0.4735 | 0.5681 |
Disclaimer/Publisher’s Note: The statements, opinions and data contained in all publications are solely those of the individual author(s) and contributor(s) and not of MDPI and/or the editor(s). MDPI and/or the editor(s) disclaim responsibility for any injury to people or property resulting from any ideas, methods, instructions or products referred to in the content. |
© 2024 by the authors. Licensee MDPI, Basel, Switzerland. This article is an open access article distributed under the terms and conditions of the Creative Commons Attribution (CC BY) license (https://creativecommons.org/licenses/by/4.0/).
Share and Cite
Wan, K.; Yu, X.; Zou, K. Assessing the Spatial Distribution of Carbon Emissions and Influencing Factors in the Yellow River Basin. Sustainability 2024, 16, 9869. https://doi.org/10.3390/su16229869
Wan K, Yu X, Zou K. Assessing the Spatial Distribution of Carbon Emissions and Influencing Factors in the Yellow River Basin. Sustainability. 2024; 16(22):9869. https://doi.org/10.3390/su16229869
Chicago/Turabian StyleWan, Kai, Xiaolin Yu, and Kaiti Zou. 2024. "Assessing the Spatial Distribution of Carbon Emissions and Influencing Factors in the Yellow River Basin" Sustainability 16, no. 22: 9869. https://doi.org/10.3390/su16229869
APA StyleWan, K., Yu, X., & Zou, K. (2024). Assessing the Spatial Distribution of Carbon Emissions and Influencing Factors in the Yellow River Basin. Sustainability, 16(22), 9869. https://doi.org/10.3390/su16229869