Article

A Comparative Analysis of the Sustainable Development of Urban Agriculture in Chengdu and Singapore

International College, China Agricultural University, Beijing 100083, China
*
Author to whom correspondence should be addressed.
Sustainability 2024, 16(22), 9814; https://doi.org/10.3390/su16229814
Submission received: 20 September 2024 / Revised: 17 October 2024 / Accepted: 9 November 2024 / Published: 11 November 2024

Abstract

:
With the deepening global concern for sustainable development, urban agriculture has received more and more attention as an important combination of urban development and ecological environmental protection. This paper provides a comprehensive evaluation and comparison of two areas, Chengdu and Singapore, in terms of their capacity for sustainable development of urban agriculture through an empirical analysis method. To make a multidimensional evaluation index system, the study uses the hierarchical analysis method (AHP) and the fuzzy comprehensive evaluation method. The index covers important areas like the level of agricultural development, the intensity of applied inputs, the rate of energy use, the rate of resource utilization, and the level of agricultural factors. The results show that Chengdu performs significantly in terms of resource utilization rate and agricultural factor level, while Singapore performs better in terms of energy utilization rate. The study provides targeted recommendations, including strengthening scientific and technological innovation, policy support, and ecological and environmental protection, with the aim of providing references and lessons for the sustainable development of urban agriculture in the two places and other areas around the world.

1. Introduction

In the context of globalization and urbanization, urban agriculture emerges as a novel agricultural development model that can effectively alleviate land pressure during the urbanization process. Urban agriculture is increasingly recognized for its multifaceted benefits, including providing fresh food for urban residents, enhancing the urban ecological environment, and improving the quality of life for inhabitants. However, the advancement of urban agriculture faces numerous challenges, including resource limitations, environmental contamination, and technological obsolescence. Consequently, addressing how to achieve sustainable development in urban agriculture has become a matter of global significance. In this context, Chengdu and Singapore represent two distinct urban agricultural development models. Chengdu, as a major agricultural city-state in southwestern China, leverages its abundant land and water resources to support a resource-driven agricultural model. On the other hand, Singapore, a highly urbanized city-state with extremely limited land resources, adopts a technology-driven approach to optimize land use and agricultural productivity. By comparing these two areas, we aim to explore how different resource conditions and technological approaches influence the sustainable development of urban agriculture, providing insights for other areas with varying agricultural capacities. Figure 1 shows the geographical locations of Chengdu and Singapore. This map provides a clear visualization of the distinct geographical contexts in which the two cities operate, further enhancing the understanding of their respective agricultural development models and resource conditions.
In recent years, there has been a gradual increase in research activity within the field of sustainable urban agriculture. A considerable number of distinguished scholars have conducted valuable research in the field of urban agriculture. For example, Marvin et al. (2024) highlighted the significance of regulating environmental agricultural urbanization for urban studies, thereby offering a valuable perspective for comprehending the role of urban agriculture in urban development [1]. In the same year, Agnès et al. (2024) investigated the multifaceted impacts of urban agriculture on individuals, locations and the natural environment, emphasizing its capacity to enhance food security, ecological sustainability, and community development. This offers valuable insights into our comprehension of the integrated advantages of urban agriculture [2]. Panotra et al. (2024) focus on the innovative role of vertical farming in meeting the challenges of 21st-century agriculture, providing us with new ideas for exploring ways to modernize urban agriculture [3]. Olivia et al. (2023) offers a comprehensive analysis of the environmental, social, and psychological benefits associated with urban agriculture in Singapore. Their research provides an empirical foundation for evaluating and enhancing the social value of urban agricultural practices [4]. This comparative study between Chengdu and Singapore offers an opportunity to evaluate sustainable urban agriculture development across two geographically and economically distinct regions. Chengdu’s traditional, resource-intensive agricultural practices contrast sharply with Singapore’s modern, high-tech, land-efficient farming methods. Such a comparison enables us to draw lessons from both areas and provides a more comprehensive understanding of sustainable urban agriculture in varied contexts. The findings of these studies demonstrate that urban agriculture is not merely a productive endeavor; it is also an integrated system that can facilitate socially, economically, and environmentally sustainable development.
The acceleration of urbanization has led to a significant focus on urban agriculture as a crucial element of sustainable urban development, attracting considerable attention from both academic and practical perspectives. Several studies have explored different dimensions of urban agriculture, offering strategic insights and practical solutions. For instance, Qi Limei (2023) examined the innovation and transformation paths of urban agriculture, emphasizing the critical role of innovation in promoting its development. This research provides strategic guidance for the innovation-driven growth of urban agriculture [5]. Similarly, in 2023, Liu and Zhang studied the science and technology service model in the context of modern urban agriculture in Chengdu. They highlighted how technology services can enhance agricultural productivity and quality, offering practical references for improving competitiveness [6]. At the local level, Xie Ruiwu (2023) used Chengdu as a case study to reflect on the modernization of urban agriculture, proposing a series of strategies to further its development [7]. In 2022, Zhang Xiang and Zeng Renzhi investigated the social functionality of three-dimensional green spaces in Singapore, offering innovative ideas for optimizing urban agriculture in constrained urban spaces [8]. From a broader perspective, Yang Jiayi (2022) and Zhong Jiali et al. (2022) analyzed the barriers to sustainable urban agriculture from multiple angles, proposing solutions to address these challenges and contributing to a comprehensive understanding of sustainable practices [9,10]. Further, Meng Ying Yang (2021) presented a case study on Singapore’s innovative approach to urban agriculture, which showcases the city-state’s ability to efficiently use limited land resources and provides valuable insights for international comparisons [11]. In 2021, Ding Li et al. conducted a study on the sustainable development path of urban agriculture in China, offering theoretical and practical support tailored to China’s specific conditions [12].
Despite the growing body of research on the sustainable development of urban agriculture, several knowledge gaps remain. Specifically, there is limited comparative analysis between areas with distinct agricultural development models and resource conditions, such as resource-driven and technology-driven approaches. This gap is particularly evident in the context of areas like Chengdu, which benefits from abundant natural resources, and Singapore, which faces severe resource constraints but excels in technological innovations for agriculture. This study aims to fill this gap by providing a cross-regional comparison of sustainable urban agriculture between these two areas.
While this study addresses the gap by offering valuable insights into the sustainable development of urban agriculture across two distinct contexts, it is important to acknowledge several limitations that may influence the findings. First, the data sources for Chengdu and Singapore may vary in terms of availability and consistency, potentially affecting the comparability of results across these two areas. Additionally, while Chengdu represents a resource-driven agricultural model and Singapore a technology-driven model, this study focuses on these two specific areas, limiting the generalizability of the findings to other urban contexts. Furthermore, the use of the Analytic Hierarchy Process (AHP) and Fuzzy Comprehensive Evaluation methods involves expert judgment, which, although beneficial for evaluating complex systems, may introduce subjective biases. Future research could benefit from incorporating additional objective evaluation methods or expanding the sample to include more areas with varying urban agriculture practices.
The main innovation of this study lies in its comparative approach, which integrates the hierarchical analysis method (AHP) and the Fuzzy Comprehensive Evaluation method to evaluate the sustainability of urban agriculture across diverse development models. The Analytic Hierarchy Process (AHP) was chosen for its ability to break down complex decision-making processes into a hierarchical structure, allowing for the quantification of the relative importance of each factor through pairwise comparisons. This method is particularly advantageous when dealing with multidimensional evaluation criteria, as it enables the assignment of accurate weights to various indicators based on expert judgment. Additionally, the Fuzzy Comprehensive Evaluation method is employed to handle the inherent uncertainties and ambiguities present in subjective assessments, making it especially useful in evaluating the sustainability of urban agriculture in diverse contexts. By combining these two methods, we ensure a robust, objective, and comprehensive assessment of sustainable urban agriculture across different development models. By examining Chengdu and Singapore, this study offers new insights into how different urban agriculture practices can be adapted to varying resource and technological contexts, providing valuable lessons for other areas worldwide.
As a hub for science, technology, commerce, and transport in southwestern China, Chengdu is endowed with favorable natural conditions and rich agricultural resources. As a result, China’s level of urban agriculture development is a leading example. Singapore, an urban country with constrained land resources and an extremely high population density, has a distinctive agricultural development model, particularly in the realms of vertical agriculture and the utilization of contemporary agricultural technology. This has resulted in notable advancements. The present study selects Chengdu and Singapore as case studies with the objective of examining the strategies and practices of sustainable urban agriculture development in diverse geographical, economic, and cultural contexts through comparative analysis.
This study begins with an introduction to the research methodology and the evaluation index system’s construction. The use of AHP allows us to establish a structured hierarchy of sustainability indicators and determine their relative importance based on expert input. This is particularly beneficial for multi-criteria decision-making processes in the evaluation of urban agriculture. Meanwhile, the Fuzzy Comprehensive Evaluation method enhances the robustness of the results by accounting for uncertainties and subjective variations in the data, ensuring that the final evaluation captures the complexity of sustainable urban agriculture development across different geographical, economic, and technological contexts. It then proceeds to undertake a quantitative evaluation of the sustainable development capacity of urban agriculture in the two locations in question.

2. Research Methods

2.1. Purpose and Method

This study aims to make a comprehensive evaluation of the sustainable development capacity of urban agriculture in Chengdu and Singapore. To achieve this goal, the hierarchical analysis method (Analytic Hierarchy Process, AHP) was used to quantify urban agriculture’s sustainable development capacity. The hierarchical analysis (AHP) method is a commonly employed technique for decision-making. The method establishes a hierarchical model, decomposes complex problems into multiple component factors, and determines the relative importance of each factor through pair comparison, thereby enabling the calculation of each factor’s weight. In this study, the AHP was employed to ascertain the relative weights of each first-level and second-level index within the evaluation index system. However, recognizing the limitations of the AHP in providing a fully objective assessment of agricultural sustainability, we also incorporated Data Envelopment Analysis (DEA) to enhance the robustness of the evaluation. DEA is used to evaluate the relative efficiency of resource utilization, complementing the AHP’s focus on weight determination. This combination of methods ensures a more comprehensive and reliable evaluation of the sustainable development capacity of urban agriculture in both areas.
The specific steps of the evaluation process are as follows:
(1)
The construction of the evaluation index system is based on the theoretical framework of sustainable development of urban agriculture and the actual situation of the two locations. It includes multiple dimensions.
(2)
The index weight must be determined. This is achieved by applying the hierarchical analysis method, which allows the relative weight of each evaluation index to be determined through expert scoring and consistency testing.
(3)
Data standardization: To mitigate the impact of varying indicators, the raw data are standardized, ensuring the fairness and accuracy of the evaluation results.
(4)
Comprehensive evaluation calculation: The comprehensive score of the sustainable development of urban agriculture in Chengdu and Singapore is calculated by using the fuzzy comprehensive evaluation method, combined with the index weight and standardized data.
(5)
Results analysis: The calculation results are analyzed, the differences in the sustainable development ability of urban agriculture in the two places are compared, and their respective advantages and deficiencies are identified.
This study aims to provide quantitative evaluation results for the sustainable development of urban agriculture in Chengdu and Singapore, as well as a reference basis for future agricultural development strategies, using the above evaluation methods.

2.2. Construction of the Index System

Shen and Xiu (2012) discussed the development of agricultural science and technology parks in China, drawing on foreign experiences. Their research highlights the importance of technology transfer and innovation in enhancing the sustainability of urban agriculture [13]. In order to comprehensively evaluate the sustainable development ability of urban agriculture in Chengdu and Singapore, this study has constructed a multi-dimensional index system. The system looks at important things like the level of agricultural development, the input intensity of application supplies, the rate of energy and resource use, and the level of agricultural elements. Its goal is to show the two places’ sustainable agricultural development from various angles (Table 1).

2.2.1. First-Level Indicators

Level 1 indicators include:
(1) Agricultural development level: It is a reflection of the overall state of development within the regional agricultural economy.
(2) Input intensity of application supplies: Measuring the use of agricultural chemicals such as chemical fertilizers, pesticides, and agricultural film.
(3) Energy utilization rate: It is to assess the use of petrochemical energy and renewable resources in agriculture.
(4) Resource utilization rate: This measure assesses the efficiency with which resources such as grain output, contribution to the value of agricultural output, agricultural science and technology, and high-standard farmland area are utilized.
(5) Level of agricultural factors: This level encompasses basic agricultural factors such as the area of cultivated land, the size of agricultural parks, and the export and import of agricultural products.

2.2.2. Secondary Indicators

The secondary indicators specifically include:
(1) Total regional agricultural value: reflecting the total output value of the agricultural industry.
(2) Average income of regional farmers: to measure the average income level of farmers.
(3) Engel coefficient of farmers: expressed in percentage, reflects the consumption structure of farmers.
(4) Strength of fertilizer use: expressed in KG/m2, measuring the ratio of the use of fertilizer to the total farmland area.
(5) Pesticide use intensity: expressed in KG/m2, measuring the ratio of the use of pesticide to the total cultivated land area.
(6) Strength of agricultural film use: expressed in KG/m2, measuring the ratio of the use of agricultural film to the total arable land area.
(7) The utilization coefficient of irrigation water: expressed in percentage, reflecting the effective utilization rate of irrigation water.
(8) Rainfall: expressed in mL, reflecting the region’s precipitation situation.
(9) Energy utilization intensity: to measure the ratio of petrochemical energy consumption to total agricultural output value in KG/billion.
(10) The intensity of renewable resource utilization: expressed in percentage, measuring the ratio of the consumption of renewable resources to petrochemical resource consumption.
(11) Agricultural carbon emissions: expressed as a percentage, reflecting the total carbon emissions of agricultural activities.
(12) Grain output: KG, which measures the region’s grain production.
(13) Contribution of output value of tourism agriculture: in terms of millions, reflecting the contribution of tourism agriculture to the regional economy.
(14) Contribution rate of agricultural science and technology: expressed in terms of millions, which reflects the contribution of tourism agriculture to regional economies.
(15) Area of high standard farmland: expressed in units to measure its size.
(16) Farmland area: expressed in m2, reflecting the land area that can be used for agricultural production.
(17) Area of agricultural park: expressed in m2 to measure the total area of agricultural park.
(18) Export of agricultural products: expressed in billions, reflecting the number of agricultural products exported.
(19) Import of agricultural products: expressed in terms of hundreds of millions, which reflects the total amount of agricultural products imported.

2.2.3. Index Attributes and Positive and Negative Direction

Each of the secondary indicators is assigned specific attributes to label their positive or negative impact on the evaluation of sustainable development capacity.
(1) Positive indicators: An increase in positive indicators contributes to enhancing sustainable development capacity. For example, indicators such as total regional agricultural value, regional average farm household income, food production, utilization coefficient of irrigation water, grain yield, and contribution rate of agricultural science and technology are all considered positive because they reflect growth and efficiency in urban agricultural development.
(2) Negative indicators: An increase in negative indicators may have a detrimental impact on sustainable development capacity. Negative indicators include fertilizer use intensity, pesticide use intensity, agricultural film use intensity, agricultural carbon emissions, and agricultural product import. These indicators are categorized as negative due to their potential environmental burden or resource dependence.
By considering these clearly defined positive and negative indicators, this study comprehensively evaluates the sustainable development capacity of urban agriculture in Chengdu and Singapore, providing strategic suggestions for improving agricultural sustainability in both regions.

2.2.4. Determination of the Weight of the Index System

The weight determination is a critical step in constructing the index system, which affects the accuracy and rationality of the evaluation results. The hierarchical analysis method (Analytic Hierarchy Process, AHP) was used to determine the weight of each indicator.
  • Basic Principles of Hierarchical Analysis (AHP)
Hierarchical analysis is a multi-criterion decision-making method. By establishing a hierarchical model, complex problems can be decomposed into multiple component factors, which can then be evaluated in terms of their relative importance through pair comparison. This allows the weight of each factor to be calculated. This approach has been widely applied in multi-criteria decision-making scenarios.
2.
Calculation steps of index weights at all levels
To calculate the weight coefficient of each index in the judgment matrix, the square root method was applied. The key calculation steps are as follows:
(1) Arrange each index element’s data in matrix form and calculate the product of each row’s elements. The calculation formula is:
M i = j = 1 n a i j ( i , j = 1 , 2 n )
(2) The square root method is then applied to compute the eigenvector. The calculation formula is:
W i ¯ ¯ = M i n
(3) The eigenvector is normalized to obtain the final weight vector:
W i = W i ¯ ¯ / i = 1 n W i ¯ ¯
The consistency test is conducted by calculating the maximum eigenvalue ( λ m a x ), the consistency index (CI), and the consistency ratio (CR). The CR formula is:
λ max C R = C I R I
where RI is the random index that depends on the order of the matrix. If the CR is less than 0.1, the judgment matrix is considered to have satisfactory consistency.
3.
Calculation of weights
The weights are calculated by solving the eigenvalue problem of the judgment matrix. The steps include:
(1) Calculate the eigenvalue and eigenvector of the judgment matrix.
(2) Choose the eigenvector corresponding to the maximum eigenvalue as the weight vector W.
(3) Normalize the eigenvector to obtain the final weight vector.
4.
Application of weighting results
The calculated weights are applied in the subsequent evaluation model to ensure that the evaluation results reflect the contribution of each indicator to the sustainable development capacity of urban agriculture.

2.3. Weight Calculation of Indicators at All Levels

2.3.1. Calculate the Weight of Each Index

Table 2, Table 3, Table 4, Table 5, Table 6 and Table 7 present the weight calculation results obtained using the above methodology for each level of the indicators. The consistency tests confirm that the judgment matrices meet the consistency requirement (CR < 0.1), ensuring the reliability of the calculated weights.

2.3.2. Conformance Test

(1) Consistency test- -A matrix
λ max = i = 1 n A W i n W i = 5.296 ,   C I = λ max n n 1 = 5.296 5 5 1 = 0.074
RI = 1.12, CR = CI/RI = 0.066 < 0.1. The results of this matrix calculation are acceptable.
(2) Agreement test- -B1 matrix
λ max = i = 1 n A W i n W i = 3.074 ,   C I = λ max n n 1 = 3.074 3 3 1 = 0.037
RI = 0.52, CR = CI/RI = 0.071 < 0.1. The results of this matrix calculation are acceptable.
(3) Agreement test- -B2 matrix
λ max = i = 1 n A W i n W i = 5.357 ,   C I = λ max n n 1 = 5.357 5 5 1 = 0.089
RI = 1.12, CR = CI/RI = 0.079 < 0.1. The results of this matrix calculation are acceptable.
(4) Agreement test- -B3 matrix
λ max = i = 1 n A W i n W i = 3.009 ,   C I = λ max n n 1 = 3.009 3 3 1 = 0.004
RI = 0.52, CR = CI/RI = 0.008 < 0.1. The results of this matrix calculation are acceptable.
(5) Agreement test- -B4 matrix
λ max = i = 1 n A W i n W i = 4.194 ,   C I = λ max n n 1 = 4.194 4 4 1 = 0.064
RI = 0.89, CR = CI/RI = 0.072 < 0.1. The results of this matrix calculation are acceptable.
(6) Consistency test- -the B5 matrix
λ max = i = 1 n A W i n W i = 4.108 ,   C I = λ max n n 1 = 4.108 4 4 1 = 0.036
Checking the table gives RI = 0.89 and CR = CI/RI = 0.041 < 0.1. The results of this matrix calculation are acceptable.
In summary, the weight of each first-level index is agricultural development level W1 = 0.0369, investment strength of application supplies W2 = 0.2828, energy utilization rate W3 = 0.4405, resource utilization W4 = 0.1520, and level of agricultural elements W5 = 0.0878. The weight assigned to each level is as follows: regional agricultural value, W11 = 0.2721; average income of regional farmers, W12 = 0.6080; farmer Engels coefficient, W13 = 0.1199; and the strength of chemical fertilizer used, W21 = 0.0415. The intensity of pesticide use is W22 = 0.2900, the strength of agricultural film use is W23 = 0.4199, the irrigation water utilization coefficient is W24 = 0.1681, rainfall is W25 = 0.0805, and the energy utilization intensity is W31 = 0.2973. The utilization intensity of energy and renewable resources is W32 = 0.5390, the agricultural carbon emissions are W33 = 0.1638, the grain yield is W41 = 0.2677, the contribution of tourism to agricultural output value is W42 = 0.1075, the contribution rate of agricultural science and technology is W43 = 0.5676, the high-standard farmland area is W44 = 0.0572, the cultivated land area is W51 = 0.2778, the cultivated land area is W52 = 0.1393, the export of agricultural products is W53 = 0.5134, and the import of agricultural products is W54 = 0.0695.

2.4. Data Standardization

2.4.1. Sources of the Raw Data

Wang et al. (2021) conducted an assessment of urban agriculture for evidence-based food planning in Chengdu, highlighting the importance of data-driven strategies in shaping agricultural policies. Their research underscores the value of standardized data in evaluating and enhancing the sustainability of urban agriculture [14]. The basic raw data of sustainable agricultural development in Chengdu were obtained from the Chengdu Statistical Yearbook and WI Data for 2017–2023, and then the basic raw data of sustainable agricultural development in Singapore was obtained from the official websites of the Singapore Department of Statistics, the Singapore Food Agency, and the Ministry of National Development of Singapore. Then, we obtained the basic raw data of sustainable agricultural development in Singapore through the official websites of the Singapore Department of Statistics, the Singapore Food Agency, and the Ministry of National Development of Singapore. The raw data of the indicators (i.e., the actual indicator values) were collated and calculated, as shown in Table 8 and Table 9 below:

2.4.2. Data Standardization Method

In this paper, vector normalization is selected as the method for normalizing the raw data. The specific process is as follows:
(1) Setting indicators: There are M evaluation objects and N evaluation indicators, which together form the initial matrix.
X = { x i j }
where the original data of the index represent the jth index value of the ith evaluation object x i j .
(2) The data were processed. The meaning of the positive index and negative index values differs; the higher the positive index value, the better, and the lower the negative index value, the better. The index of the calculation unit is not unified to avoid interference between the index dimension and positive and negative orientation using the vector standardization method of the original data matrix.
Positive   indicator :   y i j = x i j min { x 1 j , , x n j } max { x 1 j , , x n j } min { x 1 j , , x n j }
Reverse   indicator :   y i j = max { x 1 j , , x n j } x i j max { x 1 j , , x n j } min { x 1 j , , x n j }
where y i j is the standard value of the indicator, x i j is the raw data, and min { x 1 j , , x n j } and max { x 1 j , , x n j } are the minimum and maximum values of the indicator, respectively.
To ensure data comparability, the data for each year were standardized on a year-by-year basis. Since the data span multiple years and external conditions may vary across different years, year-by-year standardization helps avoid inconsistencies in cross-year data and maintains the relative consistency within each year’s dataset. This approach allows us to more accurately capture the trend of changes in each indicator over time and ensures the objectivity and reliability of the results.

2.4.3. Data Standardization Results

The raw data for the indicators in Table 2 and Table 3 were standardized using the vector normalization method formula, and the results of the calculations are presented in Table 10 and Table 11 below:

3. Analysis of the Evaluation Results

3.1. Evaluation Results

The overall evaluation results of the sustainable development capacity of urban agriculture in Chengdu and Singapore, as well as the evaluation results of the first-level indicators and the second-level indicators, can be derived using the evaluation model
B = k = 1 n W k i i = 1 m k W k i C k i
and the weights of the indicators calculated above. The weights of the indicators were determined using the Analytic Hierarchy Process (AHP), which involved constructing a judgment matrix based on expert evaluations. The maximum eigenvalue of the matrix was calculated, followed by a consistency check to ensure that the consistency ratio (CR) was less than 0.1, indicating satisfactory consistency. After normalization, the eigenvalues were used to assign final weights to the indicators.
The scoring algorithm for each secondary index follows this formula: Take 2018 as an example. To ensure the reliability of the calculated scores, a sensitivity analysis was conducted. This analysis tested how small variations in the assigned weights would impact the final evaluation scores. The results of the sensitivity analysis confirmed that the scores remained stable despite slight changes in the weights, demonstrating the robustness and reliability of the evaluation model.
S 11 = W 11 C 11 , S 21 = W 21 C 21 , S 31 = W 31 C 31 , S 41 = W 41 C 41 , S 51 = W 51 C 51
Similarly, the scores for the other level II indicators were obtained, as shown in Table 12.
The following is the algorithm used to calculate the scores for each level 1 indicator:
B 1 = W 11 C 11 + W 12 C 12 + W 13 C 13
B 2 = W 21 C 21 + W 22 C 22 + W 23 C 23 + W 24 C 24 + W 25 C 25
B 3 = W 31 C 31 + W 32 C 32 + W 33 C 33
B 4 = W 41 C 41 + W 42 C 42 + W 43 C 43 + W 44 C 44
B 5 = W 51 C 51 + W 52 C 52 + W 53 C 53 + W 54 C 54
According to the above formula, the evaluation value of SDR capacity and primary indicators can be calculated, as shown in Table 13. Among them, B1 represents agricultural development level, B2 represents application input intensity, B3 represents energy utilization rate, B4 represents resource utilization rate, and B5 represents agricultural factor level.

3.2. Analysis of the Data Results

Here is a line graph made from the data in Table 7 that shows the evaluation values for the secondary indicators of urban agriculture’s sustainable development capacity in Chengdu and Singapore. As mentioned earlier, the indicator weights were determined through AHP, and the reliability of the results was confirmed through a sensitivity analysis. This gives a more detailed picture of the results. It can be observed that both areas’ agricultural sustainability capacity shows an upward trend. The agricultural sustainability capacity of Chengdu increased from 0.5758 in 2018 to 0.7180 in 2022, representing a growth of approximately 0.25 times. In comparison, Singapore’s agricultural sustainability capacity rose from 0.3923 in 2018 to 0.6837 in 2022, indicating a growth of approximately 0.74 times.

3.2.1. Level of Agricultural Development

The agricultural development level in Chengdu is increasing year by year, while the agricultural development level in Singapore drops first and then rises, showing a slight trend of decline. Gao, Y.L. (2014) in his master’s thesis evaluated the development level of modern urban agriculture in Chengdu and its influencing factors, pointing out that Chengdu has made significant progress in agricultural technology and policy support [15]. From 2018 to 2019, Chengdu’s agricultural development was weaker than Singapore’s agricultural development level. Jiao et al. (2020) studied the strategies to accelerate the high-quality development of urban agriculture in Chengdu, proposing suggestions to enhance agricultural production efficiency through policy optimization and technological innovation [16]. From 2020 to 2022, Chengdu’s agricultural development level surpassed Singapore’s agricultural development level. Zhang and Li (2011) analyzed the problems and countermeasures in urban agriculture in Chengdu, offering strategic recommendations for enhancing the city’s agricultural sector [17]. The level of agricultural development is closely related to the total regional agricultural value, farmers’ per capita income, and the Engel coefficient. The rapid improvement in agricultural development can be attributed to the increase in regional agricultural output value, the rise in farmers’ per capita income, the enhancement of farmers’ lives, and the decrease in the Engel coefficient of farmers. With the sustainable development of agriculture, the level of agricultural development will continue to improve. Yu’s (2018) study underscored the close correlation between the sustained decline in Engel’s coefficient and the expansion of farmers’ income and the enhancement of their quality of life. This finding aligns with the evidence indicating an uptick in overall agricultural production [18].

3.2.2. Investment Intensity of Application Supplies

In Chengdu, the investment intensity of application products shows a trend of small fluctuation in the first four years and a sharp increase in the last year. Overall, Singapore’s application product investment intensity fluctuates, exhibiting a slight declining trend. From 2018 to 2019, there was a weaker investment intensity in Chengdu’s application than in Singapore’s application. From 2020 to 2022, the investment intensity of Chengdu’s application exceeded that of Singapore’s application. Song (2014) conducted a study on the development of urban agriculture in Chengdu, providing a detailed analysis of the city’s approach to integrating agriculture into its urban fabric [19]. The input intensity of application products is mainly determined by the use intensity of chemical fertilizer, pesticide, agricultural film, irrigation water, and rainfall. Reducing the use intensity of chemical fertilizer, pesticides, and agricultural film can reduce non-point source pollution and improve the origin environment, thus increasing the input intensity of application products. The increase in irrigation water utilization coefficient and rainfall is also an important reason for the rapid increase in application products’ input intensity. The input intensity of agricultural application products is a problem that cannot be ignored in the agricultural production process.

3.2.3. Energy Utilization Rate

The energy utilization rate in Chengdu and Singapore exhibited a trend of first declining and then increasing. However, Chengdu’s energy utilization rate generally decreased, while Singapore’s energy utilization rate generally increased. From 2018 to 2019, Chengdu’s energy utilization rate was stronger than Singapore’s. From 2020 to 2022, Singapore’s energy utilization rate surpassed that of Chengdu. The increase in energy utilization intensity and agricultural carbon emissions are important reasons for the continuous decline in the energy utilization rate. Liu and Zhao (2013) explored low-carbon urban development strategies based on urban agriculture, emphasizing the potential of urban agriculture to contribute to carbon emissions reduction [20]. Enhancing the rate of agricultural energy utilization can foster sustainable development, lower the cost of agricultural production, and implement significant measures to safeguard the ecological environment. These measures may include optimizing the energy use structure, enhancing energy efficiency, promoting energy conservation and emissions reduction technologies, bolstering policy support and guidance, and implementing concrete and effective measures to boost the rate of agricultural energy utilization.

3.2.4. Resource Utilization Rate

Both Chengdu and Singapore show a general increase in resource utilization. Xiao and Tang (2018) evaluated the green sustainable development ability of agriculture using the entropy method, providing a quantitative analysis of the city’s agricultural efficiency. Their study contributes to the understanding of resource utilization in urban agriculture [21]. The resource utilization rate is mostly based on food production, the contribution value of tourist agriculture, the contribution rate of agricultural science and technology, and the area of high-standard farmland. The main reasons for the fast rise in the resource utilization rate are more food production, higher contribution values for tourist agriculture and agricultural science and technology, and stronger construction of high-standard farmland. Improving the utilization rate of agricultural resources is an important way to achieve sustainable agricultural development. Agricultural resource utilization faces many challenges and problems and requires the joint efforts of the government, farmers, and society to strengthen scientific and technological innovation, policy support, and the cultivation of farmers’ awareness in order to promote the improvement of agricultural resource utilization.

3.2.5. Level of Agricultural Elements

The level of agricultural factors in Chengdu shows a trend of increasing year by year, while the level of agricultural factors in Singapore shows a fluctuation trend and a small upward trend. From 2018 to 2020, Chengdu’s level of agricultural elements was weaker than Singapore’s. From 2021 to 2022, the level of agricultural elements in Chengdu surpassed that of agricultural elements in Singapore. Agricultural factors directly determine the potential and efficiency of agricultural production. Que and Wang (2014) conducted research on the urban agriculture planning models of metropolises, with a case study of Chengdu, offering insights into the planning and development of urban agriculture [22]. The increase in the cultivated land area and the area of agricultural parks and the optimal development of the import and export trade of agricultural products are important reasons for the rapid improvement in the level of agricultural factors.

3.3. Summary

Between 2018 and 2022, Chengdu’s and Singapore’s agricultural sustainable development capacity showed continuous growth. In 2022, Chengdu’s agricultural sustainable development capacity exceeded that of Singapore. Chengdu has shown an upward trend in the four aspects of agricultural development level, input intensity of application supplies, resource utilization rate, and agricultural factors, and a downward trend in energy utilization rate. Zhang (2016) explored the sustainable development of urban modern agriculture in Chengdu, highlighting the city’s efforts to balance agricultural productivity with environmental sustainability [23]. Singapore showed an upward trend in energy utilization rate, resource utilization rate, and agricultural factor level, and a downward trend in agricultural development level and input intensity of application supplies (Figure 2). Kang, R. (2018) mentioned that sustainable development models and improvement paths of urban agriculture are key to achieving sustainable development in urban agriculture. The study shows that optimizing resource utilization and introducing advanced technology can significantly improve the production efficiency and environmental benefits of urban agriculture [24].
To ensure the reliability of these findings, a sensitivity analysis was conducted to test how small changes in the weights of the indicators affected the final evaluation scores. The results of the sensitivity analysis demonstrated that the overall trends remained stable, confirming the robustness of the evaluation model. Additionally, the weights assigned to each indicator were validated using a consistency check, further verifying the reliability of the evaluation results.

4. Comparison of the Sustainable Development of Urban Agriculture Between Chengdu and Singapore

4.1. Comparison of Development Models

The development models of urban agriculture and low-carbon agriculture in Chengdu and Singapore reflect their own unique geographical, economic, and cultural characteristics. Through the empirical analysis, the hierarchical analysis method (AHP) and the Fuzzy Comprehensive Evaluation method are used to quantitatively evaluate the sustainable development ability of urban agriculture in the two places, thus providing data support for the comparative analysis.
Chengdu’s urban agriculture model primarily relies on intensive and efficient resource utilization, resulting in productive agriculture. Chengdu has improved the efficiency of agricultural production through the industrial management mode of large-scale planting and the integration of agricultural products. Empirical analysis shows that the contribution rate of agricultural science and technology progress in Chengdu reached more than 60%, and the annual output value of sightseeing agriculture reached CNY 10 billion. These data highlight the remarkable achievements of Chengdu in agricultural modernization and diversified development.
The urban agriculture model in Singapore is characterized by a focus on high-tech and high-value agricultural applications. Dai et al. (2019) explored the integration of vertical agriculture with the urban landscape in Singapore, pointing out that vertical farms not only improve land use efficiency but also beautify the urban environment [25]. As a city-country with limited land resources, Singapore has developed modern and intensive agricultural science and technology parks and vertical agriculture in order to optimize land utilization and reduce carbon emissions. The empirical analysis demonstrates that the vertical agricultural area in Singapore accounts for 10% of the total agricultural area, resulting in a reduction in agricultural carbon emissions of over 30%. This reflects the efficacy of Singapore’s approach to low-carbon agriculture. The article in Yunnan Agriculture (2002) provided an overview of urban agriculture in Singapore, showcasing the city-state’s innovative approaches to agricultural development within urban settings. This case study offers insights into Singapore’s high-tech and land-efficient farming methods [26].
A comparative analysis reveals that Chengdu and Singapore adopt disparate approaches to the advancement of urban and low-carbon agriculture. Chengdu places an emphasis on the efficient use of resources and the diversification of agricultural products, whereas Singapore prioritizes the application of advanced technology and the intensive use of land. Gan (2007) discussed how Singapore has integrated urban agriculture into land use planning to address food security and land scarcity issues [27]. The findings of the empirical analysis demonstrate the disparate approaches and outcomes of the two locations in enhancing agricultural productivity, safeguarding the natural environment, and fostering rural economic advancement. Ma et al. (2021) discussed the role transition and potential benefits of urban agriculture globally and its implications for China. This research provides a broader perspective on the evolving role of urban agriculture in sustainable development, offering insights for both Chengdu and Singapore [28].
For example, Chengdu agricultural irrigation water consumption is about 4000 cubic meters/hectare, while Singapore is only 2000 cubic meters/hectare, indicating that Singapore has obvious advantages in terms of agricultural water efficiency. In addition, Chengdu has effectively improved agricultural water use efficiency by promoting water-saving irrigation technology and implementing agricultural water price reform, while Singapore has made full use of urban space by building urban farms and vegetable garden communities for agricultural production, reducing the occupation of land and water resources.
The quantitative evaluation results of this study provide an in-depth comparative perspective on the development of urban and low-carbon agriculture in Chengdu and Singapore, as well as a reference basis for future agricultural development strategies in both places. It is recommended that the two places continue to strengthen scientific and technological innovation and application, focus on ecological environmental protection, promote industrial integration and development, and enhance policy support and guidance in order to achieve a higher level of sustainable development.

4.2. Comparison of Resource Utilization Efficiency

This study, based on an in-depth analysis of urban and low-carbon agricultural development in Chengdu and Singapore, further assesses the performance of the two regions in terms of resource use efficiency. Mei et al. (2020) analyzed the hotspots in the development of urban agriculture in China, identifying key areas of focus for research and policy intervention. Their work contributes to the understanding of the challenges and opportunities in advancing urban agriculture in a sustainable manner [29]. Through empirical analyses, we were able to gather specific information on how much water is used for farming, irrigation systems, the use of water-saving technologies, and the recycling of water resources. This gave us a way to compare how efficiently resources are used in the two regions.
Water resource utilization in Chengdu: The Chengdu region benefits from a humid subtropical climate with relatively abundant annual precipitation but uneven seasonal distribution. According to data from 2018 to 2022, water use for agricultural irrigation in Chengdu is on a downward trend year over year, decreasing from 4000 to 3500 cubic meters per hectare (m3/ha). This improvement is mainly due to the widespread application of water-saving irrigation technologies such as sprinkler irrigation and micro-irrigation, as well as the implementation of agricultural water price reform, which has effectively enhanced agricultural water use efficiency.
Water recycling in Singapore: As a city-state with a tropical rainforest climate, Singapore has abundant and evenly distributed precipitation throughout the year, providing favorable moisture conditions for agriculture. Empirical analysis shows that Singapore’s agricultural irrigation water consumption is only 2000 cubic meters per hectare, much lower than that of Chengdu, thanks to its advanced water resource management and recycling technologies. The construction of urban farms and community gardens not only makes full use of urban space but also significantly reduces the occupation of land and water resources. China Agricultural Informatics (2012) examined the progression of urban agriculture in Singapore, emphasizing the role of high-tech agriculture in enhancing food self-sufficiency and addressing the challenges of land scarcity. The report underscored how Singapore’s innovative approaches to urban agriculture serve as a model for other densely populated cities facing similar constraints [30].
Soil type and water conservation: Chengdu has a variety of soil types, including loam and clay. Different soils have different water retention capacity and permeability. Data from empirical analyses show that Chengdu has progressed in improving soil water use efficiency through improved soil management and adoption of adaptive irrigation strategies. Singapore, on the other hand, has effectively adapted to its limited land resources and improved agricultural water use efficiency through soil improvement techniques. Zhao (2013) discussed the development of urban modern agriculture along the path of low-carbon green agriculture, emphasizing the importance of sustainable practices in reducing the environmental footprint of agricultural activities [31].
Climate impacts resource utilization efficiency: The climate characteristics of the two places have a direct impact on agricultural water demand and irrigation system design. The seasonal precipitation pattern in Chengdu requires more flexible irrigation management, while uniform precipitation in Singapore facilitates more stable irrigation plans.
Conclusion comment: According to empirical analysis, Chengdu and Singapore have advantages in resource utilization efficiency. Through the promotion of water-saving technology and agricultural water price reform, Chengdu has effectively improved the efficiency of agricultural water use. Singapore, on the other hand, has demonstrated its efficient agricultural water practices under limited resources through efficient water management and recycling, as well as soil improvement techniques. The successful experience of the two places provides valuable lessons for other regions, especially in how to improve the efficiency of resource utilization through technological innovation and policy guidance.

4.3. Comparison of Sustainability Strategies

Chengdu and Singapore have each demonstrated unique strategies and practices in the sustainable development of urban agriculture. Chengdu’s strategies for sustainable urban agriculture development include efficient resource use, eco-friendly agriculture, and the integration of agriculture and tourism. Yue (2016) discussed concepts for promoting low-carbon development in urban modern agriculture, emphasizing the importance of sustainable practices in reducing the environmental impact of agricultural activities [32]. Through large-scale cultivation and industrialized agricultural management, Chengdu has improved its efficiency in utilizing basic agricultural resources such as land and water. Meanwhile, the promotion of advanced agricultural technologies and equipment, such as intelligent irrigation systems and precise fertilizer application technologies, has further enhanced agricultural production efficiency. Chengdu also focuses on developing eco-friendly agriculture, promoting the resourceful use of agricultural waste, and reducing agricultural pollution. In addition, Chengdu has made use of its rich agricultural resources and humanistic landscapes to develop sightseeing agriculture and rural tourism, promoting the integrated development of agriculture and tourism, increasing farmers’ incomes, and promoting the diversification of the rural economy.
Singapore’s strategy for sustainable urban agriculture development includes high-tech drive, vertical agriculture development, and urban agriculture integration with the city-state. Singapore’s urban agriculture is driven by high technology, which has improved the efficiency of agricultural production and the quality of agricultural products through the construction of modern agricultural science and technology parks and the application of advanced biotechnology and information technology. Song et al. (2021) researched the current situation and countermeasures of urban modern agriculture in Chengdu, offering strategic insights into the challenges and opportunities facing the city’s agricultural sector [33]. As land resources are limited, Singapore has made significant efforts to develop vertical agriculture, making use of vertical space for agricultural production and achieving efficient use of land. Vertical agriculture also reduces the use of pesticides and chemical fertilizers, lowering environmental pollution. Singapore has closely integrated urban agriculture with city-state life by building urban farms and community gardens to enable citizens to have close contact with and an understanding of agriculture, thus enhancing their awareness of and respect for agriculture.
When comparing the sustainable development strategy of urban agriculture in Chengdu and Singapore, it becomes evident that Chengdu prioritizes the efficient use of resources and the protection of the agricultural ecological environment, while Singapore places more emphasis on the application of advanced technology and the efficient use of land. Chengdu fosters the sustainable development of urban agriculture through the development of eco-friendly agriculture and the integration of agriculture and tourism. Singapore realizes the high efficiency and sustainable development of urban agriculture through the development of vertical agriculture and the integration of urban agriculture and areas.
In addition to technological innovation and policy support, economic, social, and climate factors also play a crucial role in the sustainable development of urban agriculture. Economically, urban agriculture contributes to the local economy by creating jobs, increasing food security, and generating income through the integration of tourism and agriculture, as observed in Chengdu. Singapore, with its advanced agricultural technology, enhances its economic competitiveness by producing high-value agricultural products for both local consumption and export.
Socially, urban agriculture improves community well-being by providing access to fresh and locally grown food, promoting healthier lifestyles, and strengthening community engagement. In Chengdu, the integration of tourism with agriculture has fostered social development by attracting tourists and increasing rural incomes. Singapore’s urban farming initiatives, such as community gardens and urban farms, have facilitated social cohesion by involving local citizens in sustainable food production, raising awareness about food security and sustainability.
From a climate perspective, both Chengdu and Singapore face challenges due to changing weather patterns and the need to adapt agricultural practices to climate variability. Chengdu’s water-saving irrigation technologies and Singapore’s vertical farming systems both contribute to reducing the environmental impact of agriculture and enhancing resilience to climate change. These strategies highlight the importance of addressing climate-related risks as part of a broader framework for sustainable urban agriculture development [34].
For example, according to the data, the number of agricultural science and technology parks in Chengdu has reached 20, and the contribution rate of agricultural science and technology progress has reached more than 60%. Singapore’s vertical agricultural area has reached 10%, and the number of urban farms has risen to over 100. These data not only demonstrate the remarkable achievements of Chengdu and Singapore in the field of technological innovation and industrial integration but also reflect their broader contributions to the local economy, social engagement, and environmental protection. Through scientific and technological innovation, both places have realized significant improvements in agricultural production and the protection of the ecological environment. This progress provides a valuable reference for other regions striving to achieve sustainable urban agriculture, highlighting how technology-driven advancements can be integrated with economic, social, and climate-related sustainability goals.

5. Conclusions and Recommendations

5.1. Conclusions

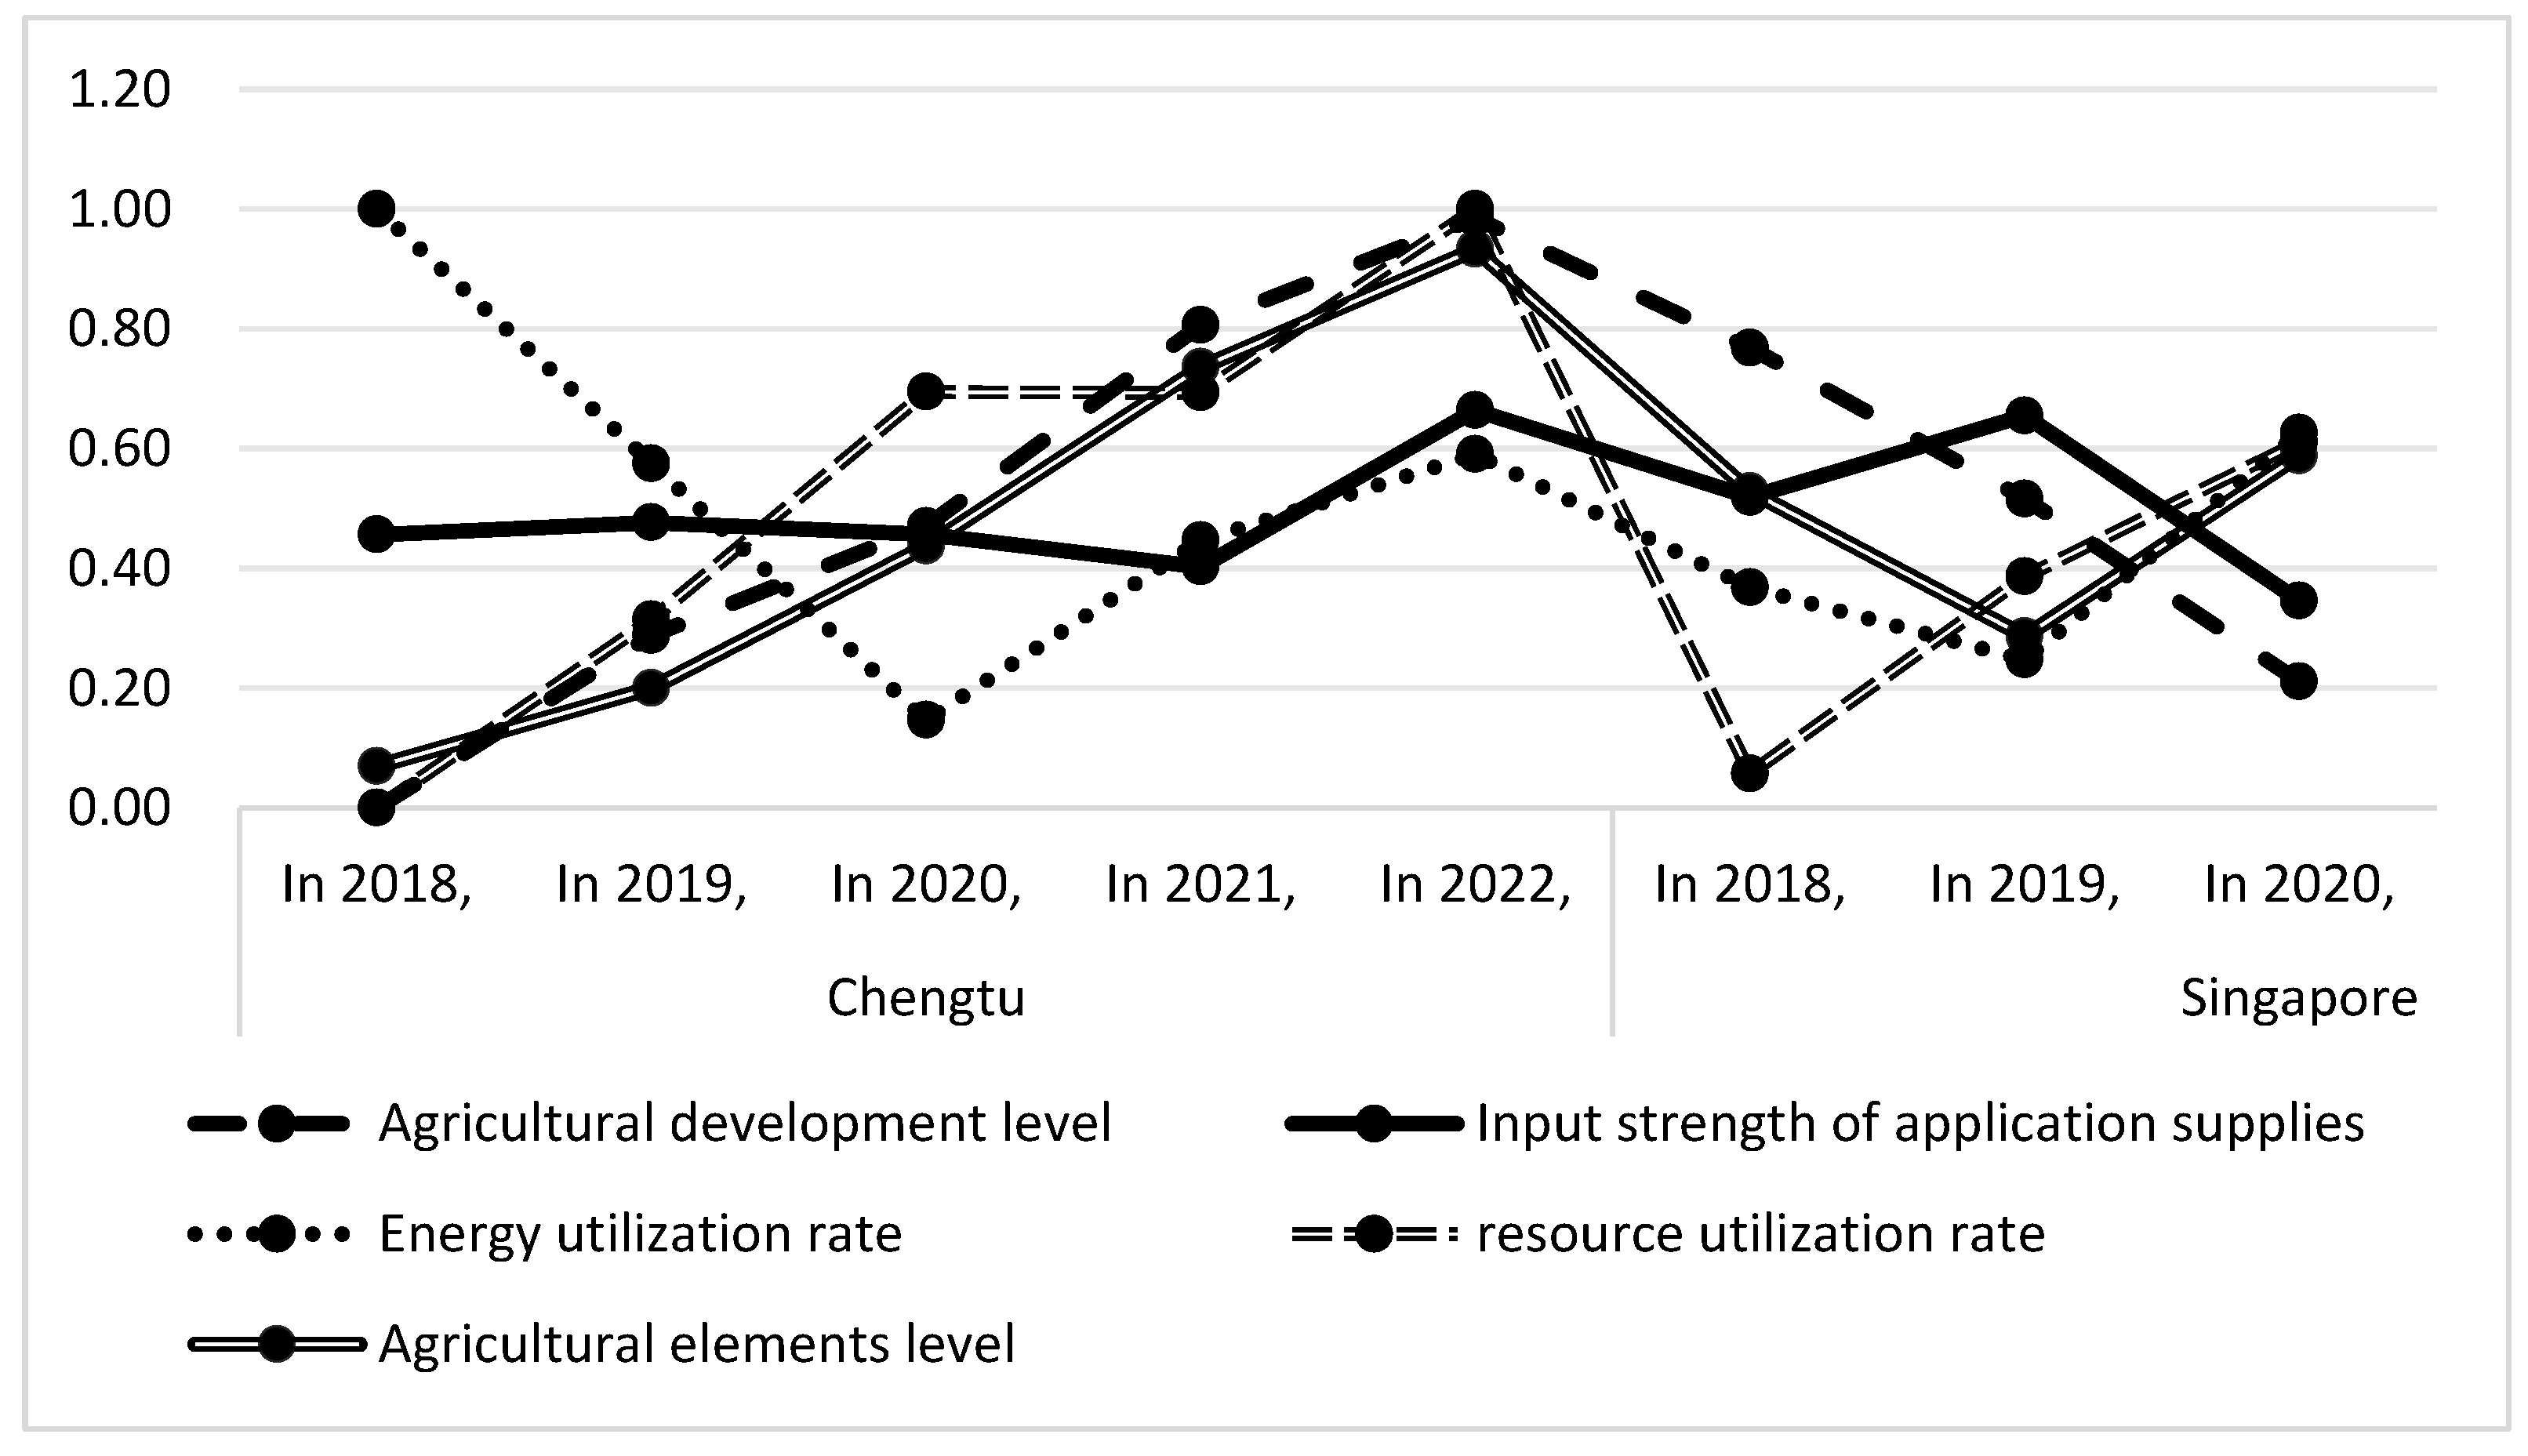
This study conducted a comprehensive evaluation of the sustainable development capacity of urban agriculture in Chengdu and Singapore through the empirical analysis method. The results show that during the period of 2018–2022, Chengdu’s agricultural sustainable development capacity was on an overall upward trend, especially in the resource utilization rate and the level of agricultural factors. However, there is still room for improvement in Chengdu in terms of the intensity of applied inputs. Song et al. (2020) explored the current situation and countermeasures of urban modern agriculture in Chengdu within the framework of rural revitalization strategies. Their research provides a comprehensive view of the city’s efforts to promote sustainable agricultural practices as part of its broader rural development goals [35]. Singapore performs better in terms of energy utilization, but it fluctuates in terms of the level of agricultural development and the intensity of applied inputs.
The key innovations of this study are as follows. First, this research provides a novel comparative analysis of two distinct urban agricultural models: Chengdu, a resource-rich city with a traditional agricultural development model, and Singapore, a city-state that relies on high-tech solutions to optimize land use. This cross-regional comparison offers valuable insights into the diversity of urban agriculture practices and their respective challenges and opportunities for sustainable development. Second, the use of a multidimensional evaluation index system, combined with the Analytic Hierarchy Process (AHP) and Fuzzy Comprehensive Evaluation, allows for a comprehensive and systematic assessment of urban agriculture sustainability. This methodological framework is an innovative contribution to the field, as it integrates both qualitative expert judgment and quantitative data. Third, the empirical findings highlight the strengths and weaknesses of both areas, with Chengdu excelling in resource utilization and agricultural factors, and Singapore leading in technological innovation and energy efficiency. These insights not only enrich the academic discourse but also offer practical recommendations for areas worldwide aiming to enhance their sustainable agricultural practices.
In addition to the local findings, this study offers valuable international implications. Areas with diverse resource endowments and technological capacities can benefit from understanding the tailored approaches to sustainable agriculture used by Chengdu and Singapore. For areas rich in natural resources, like Chengdu, the focus should be on optimizing resource efficiency while maintaining economic growth through diversification. For land-scarce, highly urbanized areas, like Singapore, the emphasis on technology-driven solutions such as vertical farming provides a blueprint for maximizing agricultural output while minimizing environmental impact. These findings are particularly relevant to areas facing rapid urbanization and global challenges such as food security and climate change.
Despite the valuable insights provided by this comparative analysis, the study has certain limitations. First, the data used for this research were collected from public sources, and any inconsistencies in data collection methods between the two areas could have impacted the results. Additionally, while Chengdu and Singapore represent two distinct urban agricultural models, they do not encompass the full spectrum of urban agricultural practices globally. This may limit the generalizability of the findings to other areas with different socio-economic or environmental contexts. Lastly, the evaluation methodologies, such as the Analytic Hierarchy Process (AHP) and Fuzzy Comprehensive Evaluation, involve a degree of subjective expert judgment, which might introduce bias. Future research could benefit from exploring alternative methods or incorporating more objective data to enhance the robustness of the findings.

5.2. Enlightenment for the Sustainable Development of the Two Places

Gottlieb (2001) explored the evolution of environmentalism and the potential for new pathways towards sustainable urban development, including the integration of urban agriculture. His work provides a theoretical backdrop against which the practical strategies of urban agriculture in Chengdu and Singapore can be assessed, offering a historical perspective on the role of urban agriculture in sustainable development [36]. As an agricultural town in Southwest China, Chengdu’s strategy for sustainable agricultural development should focus on improving the eco-efficiency and economic benefits of agricultural production. First and foremost, strengthening the regulation of pesticide and chemical fertilizer use and promoting efficient water-saving irrigation techniques are key measures to reduce agricultural surface pollution and protect the ecological environment. Secondly, Chengdu should make full use of its rich agricultural resources to enhance the agricultural output value through the development of diversified agricultural industries, which can not only increase farmers’ income but also promote the diversified development of the regional economy. Finally, increasing investment in agricultural science and technology research and development, as well as improving the contribution rate of agricultural science and technology, are effective ways to promote the modernization of Chengdu’s agriculture and enhance its competitiveness.
As a city-state with limited land resources, Singapore’s agricultural development strategy needs to pay particular attention to the efficient use of limited resources. Focusing on agricultural industry diversification and increasing the value added of agricultural products are important ways to improve market competitiveness. Zhu (1999) further discussed urban agriculture in Singapore, emphasizing the city-state’s continued innovation in agricultural practices [37]. At the same time, Singapore needs to strengthen its cooperation with the international market and expand its export channels for agricultural products in order to enhance the international influence of its agriculture. Cao et al. (2019) constructed an evaluation system for the sustainable development of urban agricultural ecology, proposing policy recommendations such as intensive use of agricultural resources, comprehensive utilization of agricultural waste, and energy saving and emissions reduction in agriculture [38]. The promotion of vertical and urban agriculture would not only improve land use efficiency but also reduce reliance on natural resources, which is crucial for a city-state like Singapore.
From an international perspective, the sustainable development strategies of Chengdu and Singapore offer valuable lessons for areas worldwide. For resource-rich areas, adopting measures to enhance the eco-efficiency of agricultural production, such as the integration of agriculture with tourism and the development of diversified agro-industries, provides a sustainable pathway for growth. Meanwhile, areas facing land scarcity can look to Singapore’s vertical farming and urban agriculture models to make better use of space and reduce resource dependency. Encouraging international collaboration on agricultural technology, policy innovation, and resource management will also be crucial for addressing shared challenges such as climate change, food security, and urban expansion.
In addition, both Chengdu and Singapore should reinforce the role of scientific and technological innovation in agricultural advancement and facilitate the implementation of intelligent and precision agricultural technologies. To facilitate sustainable agricultural development, it is imperative that both locations enhance their policy support systems and implement policy incentives and financial subsidies. Furthermore, raising awareness about ecological and environmental protection, promoting ecological and recycled agricultural models, and reducing the impact of agricultural production on the environment are common challenges for the two locations. The integration and development of agriculture with tourism, culture, and other industries will not only serve to diversify farmers’ income sources but also enhance agriculture’s comprehensive benefits. The reinforcement of agricultural education and training, as well as the enhancement of farmers’ capacity to master and apply modern agricultural technology, are critical elements in the pursuit of long-term sustainable development for both locations. Ultimately, the implementation of a long-term monitoring and evaluation framework to periodically assess the sustainable development potential of urban agriculture and to promptly adjust and optimize policy measures will assist the two regions in attaining a harmonious symbiosis between agriculture and the environment, thereby facilitating the advancement of the regional economy.

Author Contributions

Conceptualization, Y.Z. and Z.Z.; methodology, Z.L.; validation, Z.Z., Y.Z. and X.N.; formal analysis, M.H.; investigation, Y.Z.; resources, Z.Z.; data curation, Y.Z.; writing—original draft preparation, Y.Z.; writing—review and editing, Y.Z.; visualization, X.N.; supervision, M.H.; project administration, Z.L. All authors have read and agreed to the published version of the manuscript.

Funding

This research received no external funding.

Institutional Review Board Statement

Not applicable.

Informed Consent Statement

Not applicable.

Data Availability Statement

The data of Chengdu’s agricultural development level are obtained from Sichuan Provincial Department of Agriculture and Rural Affairs: http://nynct.sc.gov.cn, the level of agricultural development in Singapore from the Singapore Department of Statistics: https://www.singstat.gov.sg, Szechwan shi supplies input intensity from Chengdu Chengdu Municipal Statistics Bureau: https://cdstats.chengdu.gov.cn, the intensity of energy use and agricultural level from CEI data: https://ceidata.cei.cn, Singapore’s farmers related economic data from Singapore Food Agency: https://www.sfa.gov.sg. Accessed on 19 September 2024.

Conflicts of Interest

The authors declare no conflicts of interest.

References

  1. Marvin, S.; Rickards, L.; Rutherford, J. The Urbanisation of Controlled Environment Agriculture: Why Does It Matter for Urban Studies? Urban Stud. 2024, 61, 1430–1450. [Google Scholar] [CrossRef]
  2. Fargue-Lelièvre, A.; Hawes, J.K.; Goldstein, B.; Poniży, L.; Dorr, E. What Do We Really Know about Urban Agriculture’s Impact on People, Places, and the Planet? Bull. At. Sci. 2024, 80, 174–177. [Google Scholar] [CrossRef]
  3. Panotra, N.; Belagalla, N.; Mohanty, L.K.; Ramesha, N.M.; Vikash; Tiwari, A.K.; Abhishek, G.J.; Gulaiya, S.; Yadav, K.; Pandey, S.K. Vertical Farming: Addressing the Challenges of 21st Century Agriculture through Innovation. Int. J. Environ. Clim. Change 2024, 14, 664–691. [Google Scholar] [CrossRef]
  4. Nicholas, S.O.; Groot, S.; Harré, N. Understanding Urban Agriculture in Context: Environmental, Social, and Psychological Benefits of Agriculture in Singapore. Local Environ. 2023, 28, 1446–1462. [Google Scholar] [CrossRef]
  5. Qi, L.M. Innovation of Development Models and Pathways for Transformation and Upgrading of Urban Agriculture in the New Era. Agric. Econ. 2023, 30–31. [Google Scholar] [CrossRef]
  6. Liu, J.; Zhang, G.W. Research on Agricultural Technology Service Models under the Background of Modern Urban Agriculture in Chengdu. Sci. Technol. Sichuan Agric. 2023, 16–18. [Google Scholar] [CrossRef]
  7. Xie, R.W. Practices and Reflections on the Modernization of Urban Agriculture: A Case Study of Chengdu. Agric. Compr. Dev. China 2023, 4–10. [Google Scholar]
  8. Zhang, X.; Zeng, R.Z. Social Functions of Skyrise Greenery Space in Buildings of Singapore. Chin. Overseas Archit. 2022, 22–27. [Google Scholar] [CrossRef]
  9. Zhong, J.L.; Sun, Q.; Wei, C.X. Current Issues and Countermeasures in the Development of Urban Agriculture in Chengdu. South China Agric. 2022, 16, 118–120. [Google Scholar] [CrossRef]
  10. Yang, J.Y. An Analysis of Problems and Pathways for the Sustainable Development of Urban Agriculture. China Food 2022, 127–129. [Google Scholar]
  11. Yang, M.Y. Singapore: Building a Model of Urban Agriculture with Modern Technology. China Urban Rural Financ. News 2021, B03. [Google Scholar]
  12. Ding, L.; Liu, H.Q.; Jin, Y.; Chen, S.G.; Hou, Y.Y.; Lu, K. The Path of Sustainable Development of Urban Agriculture in China. Chin. J. Trop. Agric. 2021, 41, 120–124. [Google Scholar]
  13. Shen, X.Q.; Xiu, C.B. Developing Agricultural Science and Technology Parks in China by Learning from Foreign Experience. Mod. Econ. Explor. 2012, 78–81. [Google Scholar] [CrossRef]
  14. Wang, N.; Zhu, L.; Bing, Y.; Chen, L.; Fei, S. Assessment of Urban Agriculture for Evidence-Based Food Planning: A Case Study in Chengdu, China. Sustainability 2021, 13, 3234. [Google Scholar] [CrossRef]
  15. Gao, Y.L. Evaluation of the Development Level and Influencing Factors of Modern Urban Agriculture in Chengdu. Master’s Thesis, Sichuan Agricultural University, Ya’an, China, 2014. [Google Scholar]
  16. Jiao, J.; Nie, Y.R.; Zhang, X.M.; Jin, Y.X.; Chen, W.Z.; Gao, Y.; Chen, X.; Mu, Y. Research on Countermeasures of Accelerating the High Quality Development of Urban Agriculture—Based on Chengdu Bidding Evaluation. Chin. J. Agric. Resour. Reg. Plan. 2020, 41, 201–206. [Google Scholar]
  17. Zhang, H.; Li, X.Y. Analysis of Problems and Countermeasures in Urban Agriculture in Chengdu. J. Anhui Agric. Sci. 2011, 39, 18317–18319. [Google Scholar] [CrossRef]
  18. Yu, B. The Impact of Economic Reform on Farmers’ Welfare and Food Demand in China: An Analysis through Engel Curve. China Agricultural Economic Review Sci. 2018, 10, 65–77. [Google Scholar] [CrossRef]
  19. Song, Y.Y. Research on the Development of Urban Agriculture in Chengdu. Master’s Thesis, Southwest Jiaotong University, Chengdu, China, 2014. [Google Scholar]
  20. Liu, C.G.; Zhao, J.L. Research on Low-Carbon Urban Development Strategies Based on Urban Agriculture. Shandong Soc. Sci. 2013, 140–144. [Google Scholar] [CrossRef]
  21. Xiao, Y.; Tang, H. Evaluation of the Green Sustainable Development Ability of Chengdu Agriculture Based on Entropy Method. DEStech Trans. Econ. Bus. Manag. 2018, 153–159. [Google Scholar] [CrossRef]
  22. Que, Y.; Wang, H.R. The Research on the Urban Agriculture Planning Models of Metropolis:A Case Study of Chengdu. J. Anhui Agric. Sci. 2014, 42, 5537–5540. [Google Scholar] [CrossRef]
  23. Zhang, Y. Research on the Sustainable Development of Urban Modern Agriculture in Chengdu. Master’s Thesis, Chengdu University of Technology, Chengdu, China, 2016. [Google Scholar]
  24. Kang, R. Research on Sustainable Development Models and Improvement Paths for Urban Agriculture. Agric. Jilin 2018, 40, 65. [Google Scholar] [CrossRef]
  25. Dai, F.; Zhao, W.R.; Chen, H. Exploring the Integration of Vertical Agriculture and Urban Landscape: Research and Inspiration from Singapore’s Vertical Farms. Urban. Archit. 2019, 16, 128–132. [Google Scholar] [CrossRef]
  26. Yunnan Agriculture Urban Agriculture in Singapore. Yunnan Agric. 2002, 31.
  27. Gan, Q.H. Urban Agriculture in Singapore. Old Lib. Area Built 2007, 62–63. [Google Scholar] [CrossRef]
  28. Ma, E.P.; Cai, J.M.; Lin, J.; Liao, L.W.; Han, Y. The Role Transition and Potential Benefits of Overseas Urban Agriculture and Its Implications for China. World Reg. Stud. 2021, 30, 136–147. [Google Scholar] [CrossRef]
  29. Mei, M.; Wu, L.; Huang, Y.H. Analysis of Hotspots in the Development of Urban Agriculture in China. Mod. Agric. Sci. Technol. 2020, 218–220. [Google Scholar] [CrossRef]
  30. China Agricultural Informatics Urban Agriculture in Singapore. China Agric. Inform. 2012, 38–39.
  31. Zhao, Y.Z. Developing Urban Modern Agriculture Along the Path of Low-Carbon Green Agriculture. China Venture Cap. 2013, 92–95. [Google Scholar]
  32. Yue, H.Y. Concepts for Promoting Low-Carbon Development of Urban Modern Agriculture. Agric. Econ. 2016, 28–30. [Google Scholar] [CrossRef]
  33. Song, Y.; Guan, L.L.; Xu, X. Research on the Current Situation and Countermeasures of Urban Modern Agriculture: A Case Study of Chengdu. China Econ. 2021, 272–274. [Google Scholar] [CrossRef]
  34. Zhang, X.; Li, Y.; Wang, Q. Sustainable Urban Agriculture: Insights into Economic, Social, and Climate Factors. Buildings 2024, 14, 2165. [Google Scholar]
  35. Song, Y.; Guan, L.L.; Yang, L. Research on the Current Situation and Countermeasures of Urban Modern Agriculture Based on the Rural Revitalization Strategy: A Case Study of Chengdu. Mod. Agric. 2020, 4–5. [Google Scholar] [CrossRef]
  36. Gottlieb, R. Environmentalism Unbound: Exploring New Pathways for Change; Urban and Industrial Environments; MIT Press: Cambridge, MA, USA, 2001; ISBN 978-0-262-07210-6. [Google Scholar]
  37. Zhu, P.R. Urban Agriculture in Singapore. World Agric. 1999, 12–13. [Google Scholar]
  38. Cao, Z.W.; Zhou, P.; Gao, Y.; Li, Q.; Liu, C.Y.; Xu, H. Study on Evaluation System on Urban Agro-Ecological Sustainability. J. Shanghai Jiaotong Univ. Sci. 2019, 37, 19–24. [Google Scholar] [CrossRef]
Figure 1. Geographical location of Chengdu (China) and Singapore.
Sustainability 16 09814 g001
Figure 2. Evaluation value of sustainable development capability of urban agriculture in Chengdu and Singapore.
Sustainability 16 09814 g002
Table 1. Indicator system for sustainable development capability of urban agriculture in Chengdu and Singapore.
Target LayerLevel 1 IndicatorsSecondary IndicatorsUnitAttributePositive/Negative
Urban agriculture
sustainable development capacity: A
Agricultural development level B1Total regional agriculture C11100,000,000The first month of the lunar yearPositive
Average income of regional farmers C12CNY 10,000/personThe first month of the lunar yearPositive
Farmer Engel coefficient C13%BurdenNegative
Application supplies input strength B2Strength of chemical fertilizer use C21kg/hm2BurdenNegative
Pesticide use intensity C22kg/m2BurdenNegative
Agricultural film use intensity C23kg/m2BurdenNegative
Utilization coefficient of irrigation water C24%The first month of the lunar yearPositive
Rainfall C25mLThe first month of the lunar yearPositive
Energy utilization rate B3Energy utilization intensity: C31kg/100,000,000BurdenNegative
Utilization intensity of renewable resources C32%The first month of the lunar yearPositive
Agricultural carbon emissions C33tonBurdenNegative
Resource utilization rate B4Grain yield C4110,000 tonsThe first month of the lunar yearPositive
Sightseeing agriculture contribution value C42100,000,000The first month of the lunar yearPositive
Contribution rate of agricultural science and technology C43%The first month of the lunar yearPositive
High-standard farmland area C4410,000 m2The first month of the lunar yearPositive
Level of agricultural elements B5Cultivated land area C5110,000 m2The first month of the lunar yearPositive
Agricultural park area C5210,000 m2The first month of the lunar yearPositive
Agricultural product export C53100,000,000The first month of the lunar yearPositive
Agricultural product import C54100,000,000BurdenNegative
Table 2. Judgment matrix A–B and weight calculation results.
AB1B2B3B4B5Weight
B111/81/71/51/40.0369
B2811/3260.2828
B3731350.4405
B451/21/3120.1520
B541/61/51/210.0878
Table 3. Judgment matrix B1–C1 and weight calculation results.
B1C11C12C13Relative WeightTotal Weight
C1111/330.27210.0100
C123140.6080.0224
C131/31/410.11990.0044
Table 4. Judgment matrix B2–C2 and weight calculation results.
B2C21C22C23C24C25Relative WeightTotal Weight
C2111/71/61/51/30.04150.0117
C22711/3270.290.0820
C23631340.41990.1187
C2451/21/3130.16810.0475
C2531/71/41/310.08050.0228
Table 5. Judgment matrix B3–C3 and weight calculation results.
B3C31C32C33Relative WeightTotal Weight
C3110.520.29730.1310
C322130.5390.2374
C330.50.33333333310.16380.0722
Table 6. Judgment matrix B4–C4 and weight calculation results.
B4C41C42C43C44Relative WeightTotal Weight
C41141/450.26770.0407
C421/411/420.10750.0163
C4344180.56760.0863
C441/51/21/810.05720.0087
Table 7. Judgment matrix B5–C5 and weight calculation results.
B5C51C52C53C54Relative WeightTotal Weight
C51131/230.27780.0244
C521/311/430.13930.0122
C5324170.51340.0451
C541/31/31/710.06950.0061
Table 8. Raw data of evaluation indicators for sustainable development capacity of agriculture in Chengdu.
Secondary IndicatorsIn 2018In 2019In 2020In 2021In 2022
C1117,010.7017,838.0019,962.3020,789.4022,074.70
C122.212.442.642.913.09
C1336.6036.0036.5035.8035.90
C2192.9091.7090.8090.3089.50
C220.00160.00140.00130.00130.0012
C230.250.290.320.350.33
C2455.0055.3055.7055.9056.20
C251107.501229.60918.30984.501334.40
C3125362965320233513247
C3223.36 22.1520.6222.8923.17
C3321.3023.5026.5033.2029.50
C41225.90227.90230.60227.00231.90
C4245.6048.6055.6262.4175.98
C4358.2060.1062.1063.2063.50
C44201,260.00214,386.67238,693.33259,180.00268,560.00
C51331,993.33331,993.33332,000.00332,013.33332,033.33
C5223.4827.0134.7545.5648.89
C532746.903309.804106.804841.205005.10
C542236.302512.903047.403380.803341.30
Table 9. Raw data of evaluation indicators for sustainable development capacity of urban agriculture in Singapore.
Secondary IndicatorsIn 2018In 2019In 2020In 2021In 2022
C1112.3611.4110.6413.0213.56
C1241.2039.5338.1137.1639.48
C1312.309.6010.258.638.70
C21136.00156.00174.00185.00169.23
C220.02500.04500.04600.06300.0390
C230.120.020.140.200.13
C2422.3025.6027.5032.5036.50
C252936.143021.802953.203195.002895.00
C3112531325145215661682
C3236.2535.2539.5241.0242.85
C330.100.100.050.050.05
C41125.00163.00178.00189.00192.36
C423.904.004.104.204.30
C4380.7082.0083.1084.4084.80
C44730.00690.00670.00660.00650.00
C5197.124697.124597.124497.124397.1242
C524.025.127.2014.6515.00
C53790.40597.80992.601115.301143.10
C54720.20760.80960.301134.501241.60
Table 10. Data standardization results of Chengdu agricultural sustainable development capability evaluation indicators.
Secondary IndicatorsIn 2018In 2019In 2020In 2021In 2022
C110.00000.16340.58290.74621.0000
C120.00000.25260.48850.79481.0000
C130.00000.75000.12501.00000.8750
C210.00000.35290.61760.76471.0000
C220.00000.37140.71430.80001.0000
C231.00000.60000.30000.00000.2000
C240.00000.25000.58330.75001.0000
C250.45470.74810.00000.15911.0000
C311.00000.47360.18280.00000.1276
C321.00000.55840.00000.82850.9307
C331.00000.81510.56300.00000.3109
C410.00000.33330.78330.18331.0000
C420.00000.09870.32980.55331.0000
C430.00000.35850.73580.94341.0000
C440.00000.19500.55620.86061.0000
C510.00000.00000.16670.50001.0000
C520.00000.13910.44360.86881.0000
C530.00000.24930.60220.92741.0000
C541.00000.75830.29130.00000.0345
Table 11. Data standardization results of sustainable development capability evaluation indicators for urban agriculture in Singapore.
Secondary IndicatorsIn 2018In 2019In 2020In 2021In 2022
C110.58900.26370.00000.81511.0000
C121.00000.58590.23670.00000.5755
C130.00000.73570.55861.00000.9809
C211.00000.59180.22450.00000.3218
C221.00000.47370.44740.00000.6316
C230.41991.00000.30940.00000.3646
C240.00000.23240.36620.71831.0000
C250.13710.42270.19401.00000.0000
C311.00000.83220.53610.27040.0000
C320.13160.00000.56180.75921.0000
C330.00000.00001.00001.00001.0000
C410.00000.56410.78680.95011.0000
C420.00000.25000.50000.75001.0000
C430.00000.31710.58540.90241.0000
C441.00000.50000.25000.12500.0000
C511.00000.75000.50000.25000.0000
C520.00000.10020.28960.96811.0000
C530.35320.00000.72400.94901.0000
C541.00000.92210.53950.20540.0000
Table 12. Evaluation values of secondary indicators for sustainable development of urban agriculture in Chengdu and Singapore.
AreaSecondary IndicatorsIn 2018In 2019In 2020In 2021In 2022
Chengdu0.00000.00160.00580.00750.01000.0000
0.00000.00570.01090.01780.02240.0000
0.00000.00330.00060.00440.00390.0000
0.00000.00410.00720.00890.01170.0000
0.00000.03050.05860.06560.08200.0000
0.11870.07120.03560.00000.02370.1187
0.00000.01190.02770.03560.04750.0000
0.01040.01710.00000.00360.02280.0104
0.13100.06200.02390.00000.01670.1310
0.23740.13260.00000.19670.22090.2374
0.07220.05890.04070.00000.02240.0722
0.00000.01360.03190.00750.04070.0000
0.00000.00160.00540.00900.01630.0000
0.00000.03090.06350.08140.08630.0000
0.00000.00170.00480.00750.00870.0000
0.00000.00000.00410.01220.02440.0000
0.00000.00170.00540.01060.01220.0000
0.00000.01120.02720.04180.04510.0000
0.00610.00460.00180.00000.00020.0061
Singapore0.00590.00260.00000.00820.01000.0059
0.02240.01310.00530.00000.01290.0224
0.00000.00320.00250.00440.00430.0000
0.01170.00690.00260.00000.00380.0117
0.08200.03880.03670.00000.05180.0820
0.04980.11870.03670.00000.04330.0498
0.00000.01100.01740.03410.04750.0000
0.00310.00960.00440.02280.00000.0031
0.13100.10900.07020.03540.00000.1310
0.03120.00000.13340.18020.23740.0312
0.00000.00000.07220.07220.07220.0000
0.00000.02300.03200.03870.04070.0000
0.00000.00410.00810.01220.01630.0000
0.00000.02740.05050.07790.08630.0000
0.00870.00440.00220.00110.00000.0087
0.02440.01830.01220.00610.00000.0244
0.00000.00120.00350.01180.01220.0000
0.01590.00000.03270.04280.04510.0159
0.00610.00560.00330.00130.00000.0061
Table 13. Evaluation values of sustainable development capability of urban agriculture in Chengdu and Singapore.
AreaA Particular YearAgricultural Development LevelInput Strength of Application SuppliesEnergy Utilization RateResource Utilization RateAgricultural Elements LevelSustainable Development Capacity of Agriculture
ChengduIn 20180.00000.45651.00000.00000.06950.5758
In 20190.28800.47660.57530.31450.20010.4642
In 20200.47060.45680.14660.69460.43750.3551
In 20210.80620.40260.44650.69330.73610.5102
In 20220.98500.66410.59051.00000.93290.7180
SingaporeIn 20180.76830.51890.36820.05720.52860.3923
In 20190.51620.65490.24740.38650.28640.3971
In 20200.21090.34610.62600.61090.58840.5260
In 20210.34170.20120.65340.85430.70580.5492
In 20220.73960.51770.70280.94280.65270.6837
Disclaimer/Publisher’s Note: The statements, opinions and data contained in all publications are solely those of the individual author(s) and contributor(s) and not of MDPI and/or the editor(s). MDPI and/or the editor(s) disclaim responsibility for any injury to people or property resulting from any ideas, methods, instructions or products referred to in the content.

