Article

Human-Centered Systems Thinking in Technology-Enhanced Sustainable and Inclusive Architectural Design

by
Stanislav Avsec
1,*,
Magdalena Jagiełło-Kowalczyk
2,
Agnieszka Żabicka
2,
Joanna Gil-Mastalerczyk
3 and
Agata Gawlak
4
1
Faculty of Education, University of Ljubljana, Kardeljeva Ploščad 16, 1000 Ljubljana, Slovenia
2
Faculty of Architecture, Cracow University of Technology, ul. Podchorazych 1, 30-084 Kraków, Poland
3
Faculty of Civil Engineering and Architecture, Kielce University of Technology, Domaszowska 7, 25-314 Kielce, Poland
4
Faculty of Architecture, Poznan University of Technology, ul. Piotrowo 2, 61-138 Poznań, Poland
*
Author to whom correspondence should be addressed.
Sustainability 2024, 16(22), 9802; https://doi.org/10.3390/su16229802
Submission received: 19 September 2024 / Revised: 2 November 2024 / Accepted: 8 November 2024 / Published: 10 November 2024
(This article belongs to the Special Issue Sustainable Education: Theories, Practices and Approaches)

Abstract

:
Human-centered systems thinking (HCST) can be seen as a promising enabler of effective Industry 5.0. This study primarily examined whether architecture students consider themselves systems thinkers and how this affects their design thinking, digital competency, and engagement in sustainable and inclusive design practices. Next, this study also examined the students’ HCST profiles, their stability, and the roles of digital competency, design thinking, motivation, and risk propensity in human-centered design. Using a person-oriented approach and cluster analysis, a sample of Polish architecture students from three universities (n = 208) was classified based on their self-perceived HCST ability. Three profiles were identified, namely high, average, and low HCST. A multivariate analysis of variance (MANOVA) revealed that the HCST profiles differed significantly in terms of design thinking and digital competencies, while multinomial logistic regression (MLR) analysis revealed that perceived intrinsic motivation predicted that students would be more likely to have a high HCST profile. MLR also revealed an undefined role of risk propensity in the context of HCST in inclusive and sustainable architecture design education. The findings indicate that it is essential to recognize and support students with low HCST throughout their education. It is also suggested to change the focus of architecture study programs to promote students’ systems thinking, and to encourage course designers to create novel and tailored technology-enhanced integrated human-centered design and systems thinking.

1. Introduction

In today’s rapidly evolving architecture education landscape, fostering skills that enable students to engage in sustainable and inclusive design has become increasingly vital, especially for sociotechnical transformations toward Industry 5.0 [1]. Industry 5.0, which is future-oriented and cross-sectoral, promotes a humanized vision of technological transformation and is central to balancing the current and future needs of individuals with sustainable optimization of energy consumption, materials processing, and product accessibility and lifecycle [1,2]. Moreover, it is shifting the paradigm by introducing a new approach that focuses less on technology itself and more on the collaboration between humans and technology. This evolution highlights the idea that future progress will be driven by this synergy [3], which essentially encompasses the human-centric approach, personalization, customization and accessibility, sustainability and social responsibility, advanced technologies, and resilience and adaptability, where the main role of technology is to enhance human work rather than simply automating it, leading to a more sustainable, personalized, and ethical industrial and educational landscape [4,5]. This evolution has significant implications for undergraduate architecture education, where future architects must be equipped to meet evolving societal and industry demands. By embracing Industry 5.0 principles, e.g., human-centric design, sustainability and resilience, advanced technology integration, collaborative and interdisciplinary learning, and the adoption of immersive technologies [3], undergraduate architecture programs can produce architects who are adept at leveraging advanced technologies while maintaining a strong focus on human needs and sustainability [5]. This integration ensures that graduates are prepared to create innovative, resilient designs that address complex societal challenges.
As individuals, teams, organizations, and communities, and as a society, we face many complex, multifaceted challenges [6], such as climate change, social inequality, and technological advancement, and there is a growing emphasis on equipping students with systems thinking and design thinking capabilities [7,8,9,10,11,12]. These cognitive frameworks allow learners to approach problems holistically, considering the interconnectedness of various elements within a system, and to innovate solutions that are both sustainable and inclusive. While knowledge about the factors related to design and systems thinking approaches for revolutionizing Industry 5.0 has significantly increased in recent years [8,9,13,14,15,16,17,18], a clear articulation of the human-centered approach, which could balance dynamic human vison and technology, is still lacking. A solution can be seen in HCST as a promising approach to increase the quality of education and life. Moreover, it encourages the design of systems that are not only effective but also empathetic and responsive to human needs and contexts [19]. The aim of HCST is to create systems thinking methodologies that are deeply rooted in human experience, making them more accessible, relevant, and effective in order to address real-world problems. Due to the complex and often ambiguous discourse surrounding HCST, there is limited scientific literature addressing its potential as a pedagogical approach for promoting effective, inclusive, and sustainable design. This new approach, which is needed now more than ever, would enhance future-oriented and responsible physical–digital convergence [20] through human perception, cognition, and experience for better understanding and systems modeling [19].
IDEO [6], a global design and consulting firm specializing in innovative solutions, collaborates with organizations to develop products, services, and business strategies across various industries and academia. Additionally, IDEO also offers a course on HCST (https://www.ideou.com/; accessed on 18 August 2024). IDEO’s approach to HCST evolved from its focus on design thinking, a methodology that emphasizes empathy with users, ideation, and prototyping. The company applies these principles at the systems level, considering not just individual products or services, but how these elements fit within larger ecosystems and societal contexts. This active learning approach involves understanding human needs, behaviors, diversity, and contexts in order to design solutions that are not only innovative but also sustainable and impactful on a broader scale [6] by developing critical thinking skills, enhancing students’ ability to synthesize and transfer knowledge to and from other settings and contexts [21].
Some elements of systems thinking complemented with design thinking and person-centered approaches for human-centric solutions can be seen in health care, medicine, and environmental studies [22,23,24,25,26,27]. Examples of integrating systems and design thinking can also be found in engineering and design [28,29], while in technology and architecture education, according to the Web of Science (WoS) and Scopus databases, no studies have focused on HCST to date. Therefore, in the present study, we established a path model for HCST-related factors and examined architecture students’ HCST profiles, their stability during sustainable and inclusive design education, and the associations with the perceived self-concept related to the use of information and communication technology (ICT), design thinking, motivation, and risk propensity.

1.1. Architecture Education and Current Challenges

Architecture education and practice today face several critical challenges that affect both students and professionals, such as a disconnect between education and practice, sustainability and environmental responsibility, economic pressures, cutting-edge technology integration, the need for universal design for inclusivity and accessibility, health and wellbeing, revolutionary materials and construction innovations, social relevance, and public perception [30,31,32]. These problems stem from rapid changes in technology, societal needs, economic pressures, and evolving professional demands on one side, while from the perspective of design pedagogy, there is not enough support to cope with the current challenges, since architectural practices are quite often rigorously structured and steeped in tradition [33]. Thus, architecture education appears to be at a pivotal crossroads, where integrating HCST and cutting-edge technology could play an essential role in fostering inclusive and sustainable design practices. In this evolving landscape, a critical focus on the ICT and digital systems self-concept is emerging, as these elements are increasingly seen to influence students’ engagement and proficiency in leveraging digital tools for innovative, critical, and conceptual creative design thinking [34].
HCST as an iterative process places people at the forefront of the design process, ensuring that architectural solutions are not only functional and aesthetically pleasing but also enhance wellbeing, accessibility, and inclusivity [5,9,13]. This approach emphasizes understanding the complex interactions between individuals, communities, and the environments they inhabit, in order to create spaces that are responsive to diverse needs [23,27,35], and which are inclusive, experimental, and decolonized for the co-creation of a body of knowledge [21].
The role of ICT in this educational framework cannot be overstated. As students develop their ICT self-concept—their confidence in and perception of their ability to use technology—they become more engaged in and effective at employing digital tools, such as building information modeling, virtual reality, artificial intelligence, simulators, and modeling tools [30,31,36,37,38]. These technologies are revolutionizing the way architects approach design and systems thinking, enabling more precise data-driven and creative solutions that are adaptable to the ever-changing demands of society [39].
Moreover, integrating inclusive and sustainable design principles into the curriculum is crucial [5,30,40], as well as leveraging systems thinking, long-term thinking, collaboration, and engagement [38,41]. Sustainable and inclusive design concepts can be delivered using different didactical approaches, such as action-oriented learning, problem- and project-based learning, experiential learning, and interdisciplinary approaches [40]. Educators are increasingly recognizing that sustainable architecture is not merely about reducing the environmental impact but also about creating equitable and accessible spaces for all [42]. By fostering an inclusive mindset, students are encouraged to design with a broad range of human experiences in mind, ensuring that their work benefits people across different socioeconomic backgrounds, abilities, and cultures [5].
In this evolving landscape, architecture education must holistically combine HCST, ICT self-concept development, and engagement in design thinking, all while emphasizing the importance of inclusive and sustainable design [31]. This integrated approach might be promising for equipping future architects with the skills and insights they need to address the complex challenges of our time and contribute meaningfully to the creation of a more just and sustainable built environment. Moreover, by integrating these approaches, architects can develop holistic, user-centered solutions that address sustainability, inclusivity, and the complexity inherent in modern architectural projects [31].
This study also explored the intricate relationships between students’ systems thinking and design thinking and their ICT self-concept and engagement in learning during sustainable and inclusive design processes. By examining how these cognitive and affective domains intersect, we aim to uncover insights that could enhance educational practices in architecture design education.

1.2. Systems Thinking and Design Thinking, Engagement in Learning and Digital Competencies

Systems thinking is one of the key enhancers of and a core competency for education for sustainable development, together with engagement, collaboration, and action orientation, to better cope with and understand the dynamics of today’s systems [38] and their complex, intractable, ambiguous, dynamic, and open-ended challenges [35]. There are several definitions of systems thinking, but the most relevant for the purpose of this study is that of Arnold and Wade [43], who defined systems thinking as “a system of synergistic analytic skills used to improve the capability of identifying and understanding systems, predicting their behaviors, and devising modifications to them in order to produce desired effects”. Arnold and Wade [44] asserted that competencies for systems thinking, which include both gaining systemic insight and using that insight to understand and affect systems, can be used at the same time, in parallel and in series, to reinforce each other, allowing systems thinkers to gain deeper insights into systems of interest. Cabrera and Cabrera [7] proposed a framework for delivering systems thinking in the classroom using the distinction, systems, relationship, and perspectives (DSRP) theory, which also utilizes Arnold and Wade’s [43] principles of systems thinking for effectively leveraging skills that support systems thinking across the domains of mindset, content, structure, and behavior [44]. The objective of bridging different mental models and creating a comprehensive understanding of systems that can apply across various contexts through DSRP can be supported with human-centric functional modelling which can decompose parts of a system based on human perception using a mathematical and perceptual framework that can represent all possible behaviors within a system’s functional state space [19]. Thus, to achieve transformative change, students are enabled to leverage their competencies and practices to better understand and describe systems and to determine which strategic interventions are most likely to contribute to desired and meaningful change [19,35].
Systems thinking is a cognitive competency and is theorized to impact digital competency, engagement in learning, cognitive and affective empathy, self-efficacy, leadership, decision-making, knowledge creation and transfer, perceived anxiety, and risk attitude [35,38,41,45,46,47,48]. In addition, a dynamic framework of systems thinking can better inform pedagogical approaches for metacognitive learning, promoting the interdisciplinarity necessary for resiliency, and addressing adaptable learning [18,49] to better assess, analyze, and explain how the world functions together in human development [18].
Systems thinking can be implemented at different levels of thinking. The first level involves basic data gathering, focusing on observable facts, such as what happened and who was involved. A deeper level of thinking looks at patterns and trends over time, identifying cause–effect relationships. An even deeper level considers how various factors interact within the system, focusing on the structure and dynamics behind these interactions. The deepest level involves mental models, which are the beliefs and assumptions that influence behavior, reasoning, and decision-making. These models are often hidden but are crucial for understanding why things work or do not work [50]. Understanding these levels can enhance our awareness and comprehension of complex socio-technical systems [49]. Systems thinking, by its holistic, analytical, abstract, conceptual, and relationship-oriented nature, can complement design thinking, is deeply anchored in empathy, and is creative, tangible, experimental, and action-oriented [6,17,27]. Both systems and design thinking are often considered as innovative and active approaches for problem-solving, where design is rather human-centered, with a variety of reasoning and creative thinking mechanisms, but also involving several constraints [12]. Design is an inherently situated activity that operates on both social and personal levels. Socially, design is contextually grounded, influenced by the environment, stakeholders, and materials involved in the design situation. On a personal level, it is shaped by the designer’s previous experiences and knowledge. These dual aspects of situatedness engage a wide array of cognitive processes, which are essential for addressing and solving design challenges effectively [12]. Leveraging design cognition in human-centered design can increase student engagement in learning, through cooperative, collaborative, interdisciplinary, and problem-based activities [10].
Systems thinking enhances architecture students’ holistic planning skills by teaching them to view projects as interconnected systems involving environmental, social, and economic factors [13,17]. For instance, students might design sustainable buildings that integrate energy efficiency, waste reduction, and community engagement. Design thinking fosters empathy for diverse users through user-centered approaches, such as involving different stakeholders in the design process to create inclusive and accessible spaces [32,33]. Together, these concepts promote adaptive thinking by encouraging flexible and innovative problem-solving, enabling students to develop designs that can adjust to changing conditions and complex challenges [36].
Design thinking, as a solution-driven and learning-oriented approach [51], offers opportunities to support students’ achievements in terms of conceptual, procedural, and metacognitive knowledge on different taxonomic levels [46]. According to Delen and Sen [52], the effect size of design-based learning with regard to students’ academic achievement ranges from weak to strong depending on the discipline and research design. A review study by Dragičević et al. [16] showed that design thinking might enhance digital transformation, help to humanize systems and the technological world, facilitate interdisciplinarity, and connect societal value and sustainability. Mayer and Schwemmle [15] argued that design thinking can affect academic achievement and learning objective achievement and convey and improve technical skills, such as programming and research skills, especially in technology-mediated experiential learning. In the context of the present study, we chose to define design thinking as “a human-centered approach to innovation that puts the observation and discovery of often highly nuanced, even tacit, human needs right at the forefront of the innovation process” [53], since it highlights two important parts of human-centered design that underlie all design thinking processes, a problem and a solution space [54]. Thus, it may have an impact through integration, reframing, enablement, and collaborative engagement [54].
Complementing systems thinking with design thinking involves integrating the holistic and analytical perspective of systems thinking with the creative and human-centered approach of design thinking [17]. Moreover, systems thinking can bring change to design and shape future designers’ thinking and behavior by leveraging a profoundly philosophical and holistic view [17]. By combining systems thinking with design thinking, organizations and individuals can create solutions that are not only innovative and user-centered but also robust, sustainable, and aligned with the broader system dynamics [27]. This integrated approach is particularly powerful in addressing the complex, multifaceted challenges in today’s world [27], where human vision can be well balanced with technology for sustainable development [20,38]. Moreover, an integrated approach can affect students’ engagement in learning, especially cognitive and behavioral [41], while cognitive–motivational engagement might mediate the effect of technology on student achievement [41,55]. Systems thinking enables architects to address sustainability by viewing buildings as interconnected components within larger environmental and social systems, ensuring eco-friendly and holistic designs [5]. Design thinking promotes inclusivity through a human-centered approach, focusing on the diverse needs and experiences of users [32]. Together, these methodologies help architects tackle complex problems by integrating multidisciplinary insights and fostering innovative, adaptable solutions that consider multiple stakeholders and systemic impacts [34].
Student engagement can be seen as multidimensional construct, consisting of behavioral, cognitive, emotional, and social engagement [56], while for the purpose of our study, we complemented engagement with the dimensions of aesthetics and somatic engagement [41]. Students, when highly cognitively engaged, are rather self-regulated, show higher levels of self-efficacy, and are mastery goal-oriented [41], while behavioral engagement refers to participation in classes or tasks [56]. Emotional engagement, as a very important aspect of the human-centered approach, captures students’ positive attitudes and feelings about learning, school, and reactions to teachers and peers [56], while social engagement further deepens interactions, communication, and collaboration in work and learning [41].
Architecture education, due to its nature, puts great importance on aesthetic and somatic engagement to increase the quality and wellbeing of people’s lives [57,58]. Thus, engagement can be linked with positive educational and emotional outcomes, but its dynamic nature can also be considered, since it can vary across the school or work experience [56]. Moreover, students’ engagement patterns (time spent, assignment completion rate, feedback behavior) can also vary depending on the method or approach applied in the teaching or learning process, and, as such, they have predicting power for the acquisition of digital competencies, such as data and information literacy [59]. When students have a higher level of perceived innovation in learning, this can affect all dimensions of engagement, while the perception of innovative technology used in the classroom may predict only emotional and behavioral dimensions, as argued by Gunnes et al. [60]. When students are highly cognitive–motivationally engaged with ICT and digital systems and tools, they will effectively develop and adapt digital skills using self-regulation for learning and acquire new knowledge and skills in different learning environments [61]. Students highly engaged in ICT show higher interest, perceived digital competency, and self-directedness toward technology, while using technology as a subject for different interactions, communication, collaboration, and evaluation [62].
Nowadays, with the introduction of artificial intelligence through different tools, apps, and technologies, it can be a powerful driver for transforming existing methods, processes, and design frameworks to the dynamic context of behavioral, environmental, cognitive, and motivational change using a human-centered design approach integrated in systems thinking [63]. Human-centeredness can serve as a catalyst for integrating systems and design thinking, where socioeconomic and natural systems, including people and the physical environment, can be considered [63]. This could enhance and build empathy in the wider socio-technological transformation dynamics [63]. Boy [9] argued that human-centered design is crucial for the development of complex systems in the 21st century, and requires a multidisciplinary approach that integrates human factors, organizational structures, and technological advancements from the very beginning of the design process. Sanders et al. [14] asserted that a human-centered approach was more transformational with students who prioritized user feedback, valued communication about their designs, and balanced meeting their course requirements with incorporating user-desired design elements. On the contrary, students who focus heavily on modeling, have computer-aided design expertise, can develop complex prototypes, and adhere to quantitative metrics and course requirements may have limited experience with human-centered design [14]. It might be that the interdisciplinarity and transdisciplinarity of contents and contexts enabled by systems thinking allow us to successfully address even complex problems [26]. A human-centered approach contextualized into systems thinking and supported with ICT and artificial intelligence may better accommodate proactive students or learners in terms of anticipating intelligence [63], being more goal-oriented, and striving for goals [64].
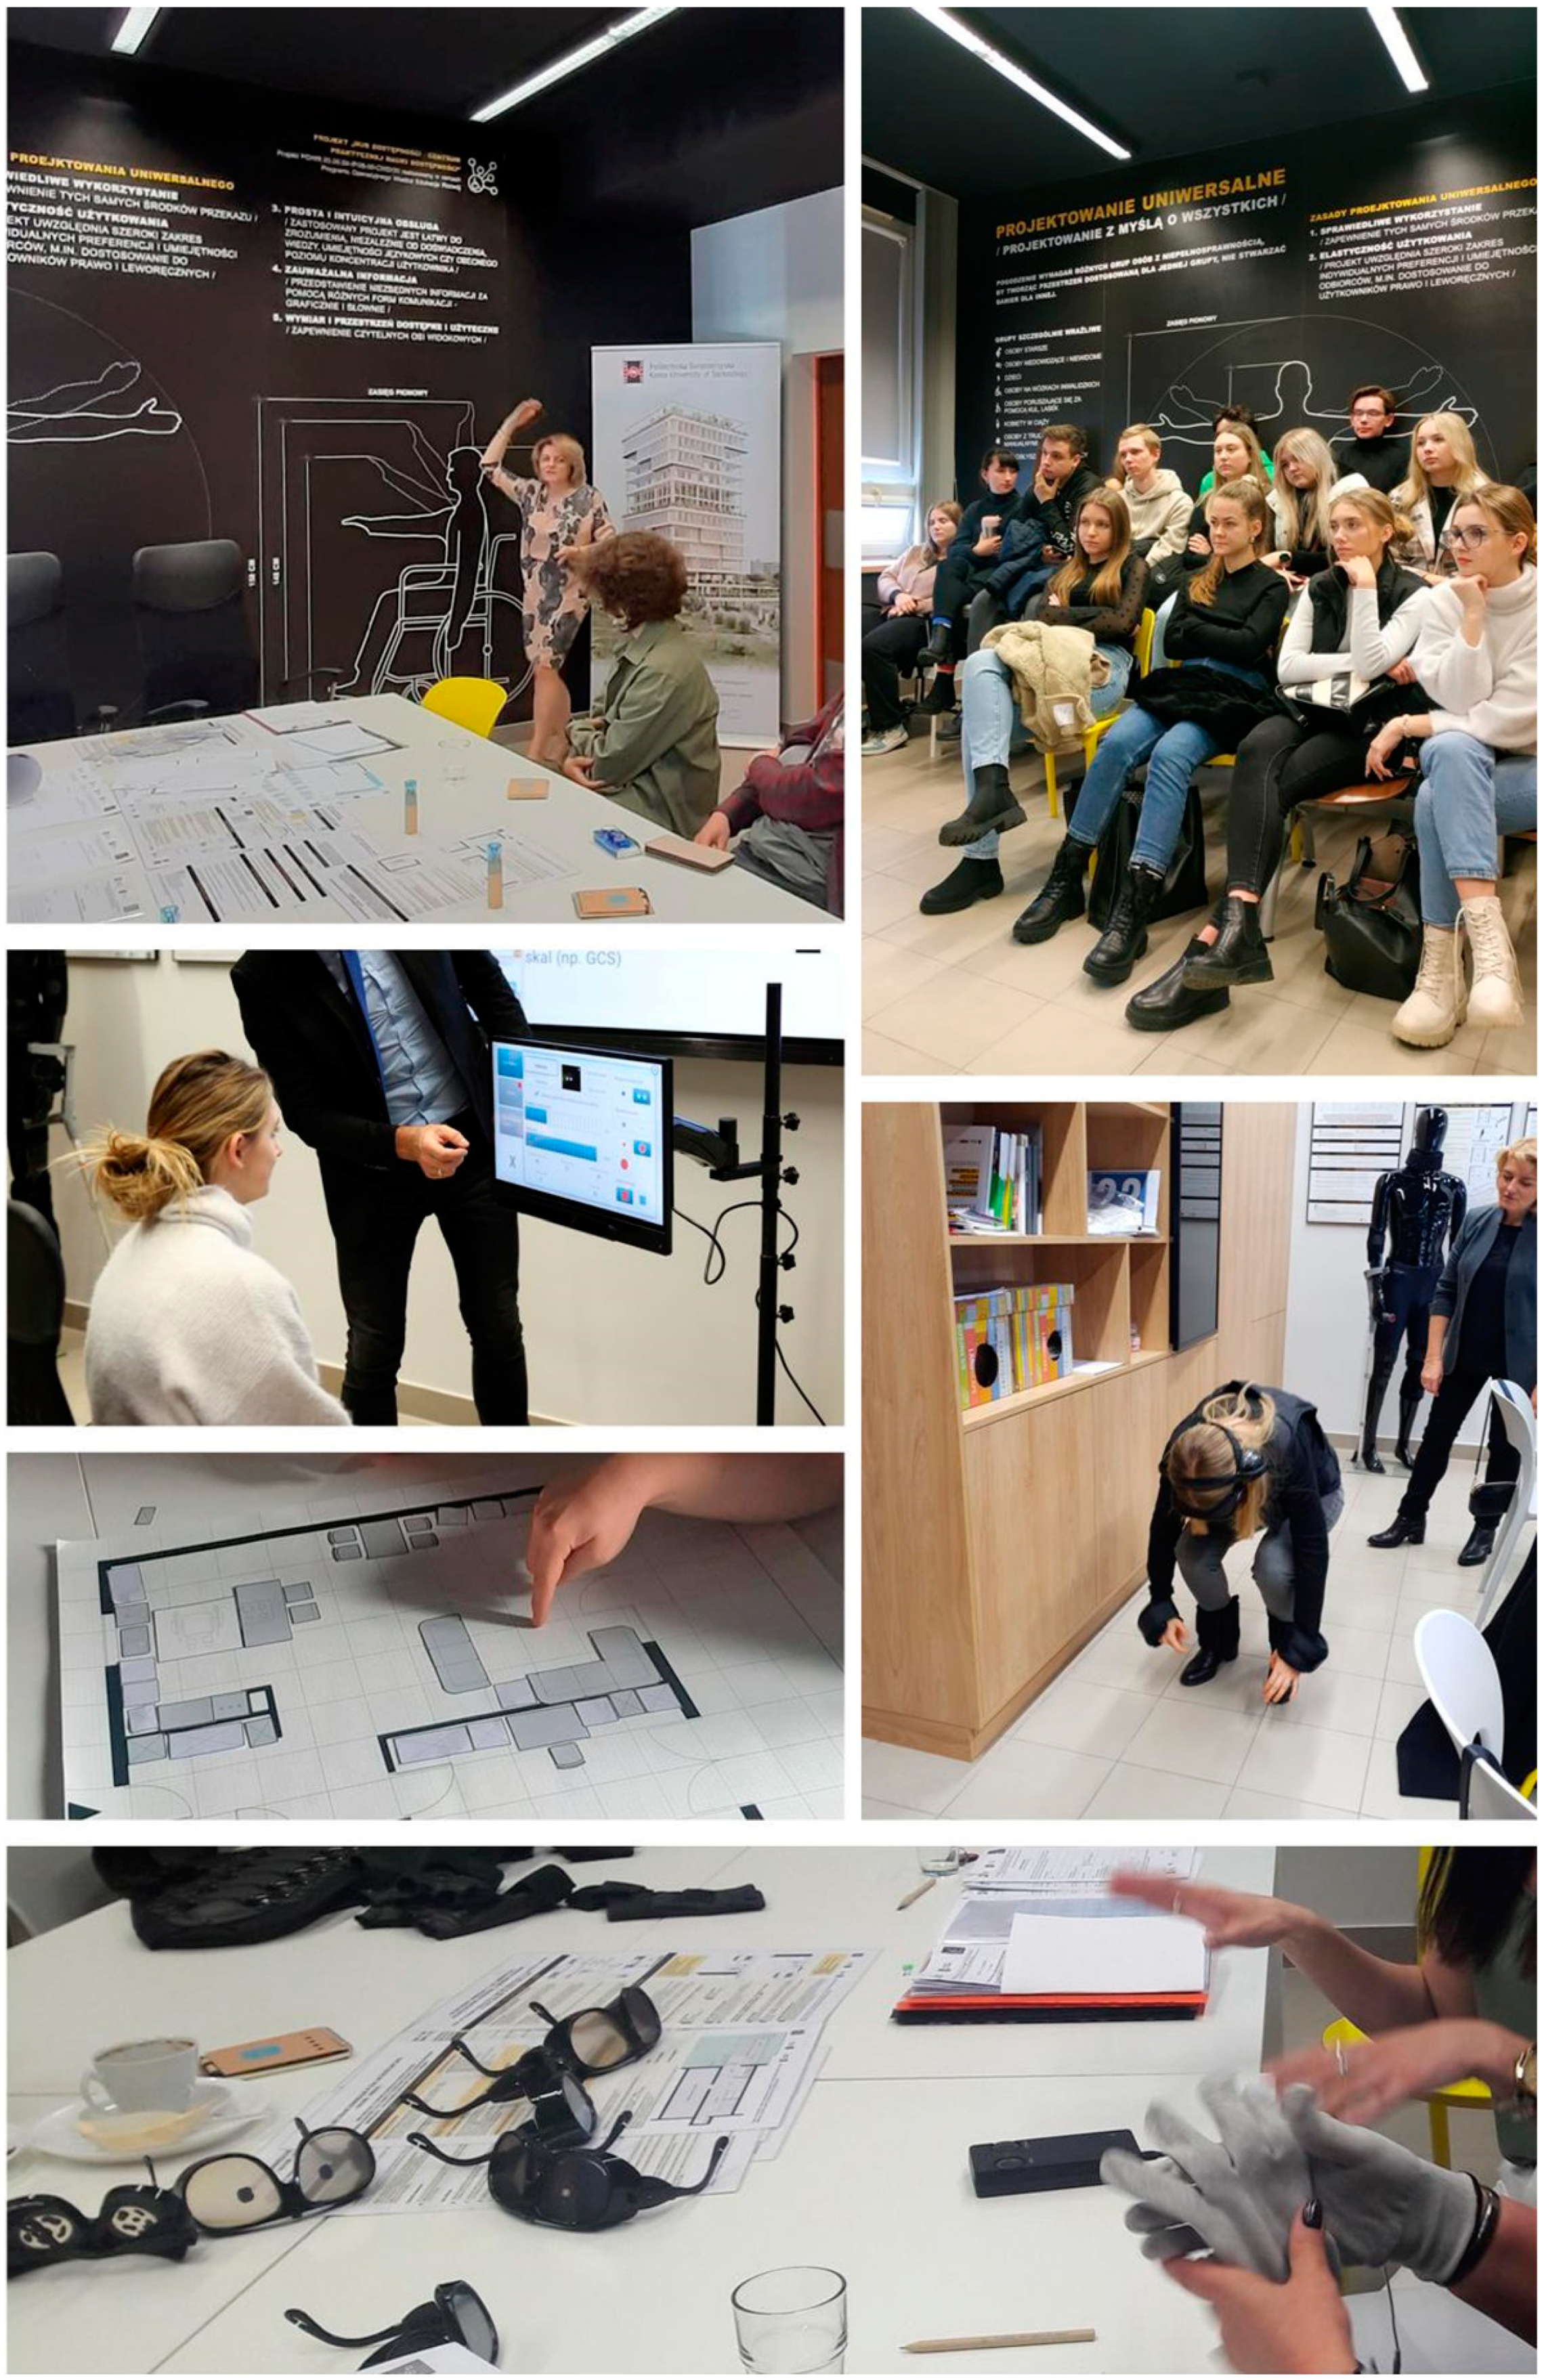
Architectural pedagogy can incorporate systems thinking and design thinking by using project-based learning, experiential learning, simulation workshops, and interdisciplinary collaboration [33]. For example, students engage in real-world design challenges that require them to address sustainability and inclusivity, developing holistic and empathetic solutions. Simulation tools, such as digital modeling or age-simulation suits, help students experience design from various perspectives, enhancing empathy [34]. Additionally, interdisciplinary projects with other fields, like environmental science or urban planning, foster a comprehensive, systems-oriented approach to architectural problem-solving [30,32].

1.3. Objectives of the Current Study

The current study aims to deepen understanding of how architecture students engage with technology-enhanced learning environments, particularly in the context of sustainable and inclusive design. Specifically, the objectives (OBJs) are as follows:
  • OBJ 1: To investigate the relationships between architecture students’ systems thinking, design thinking, ICT self-concept, and engagement levels when learning about sustainable and inclusive design.
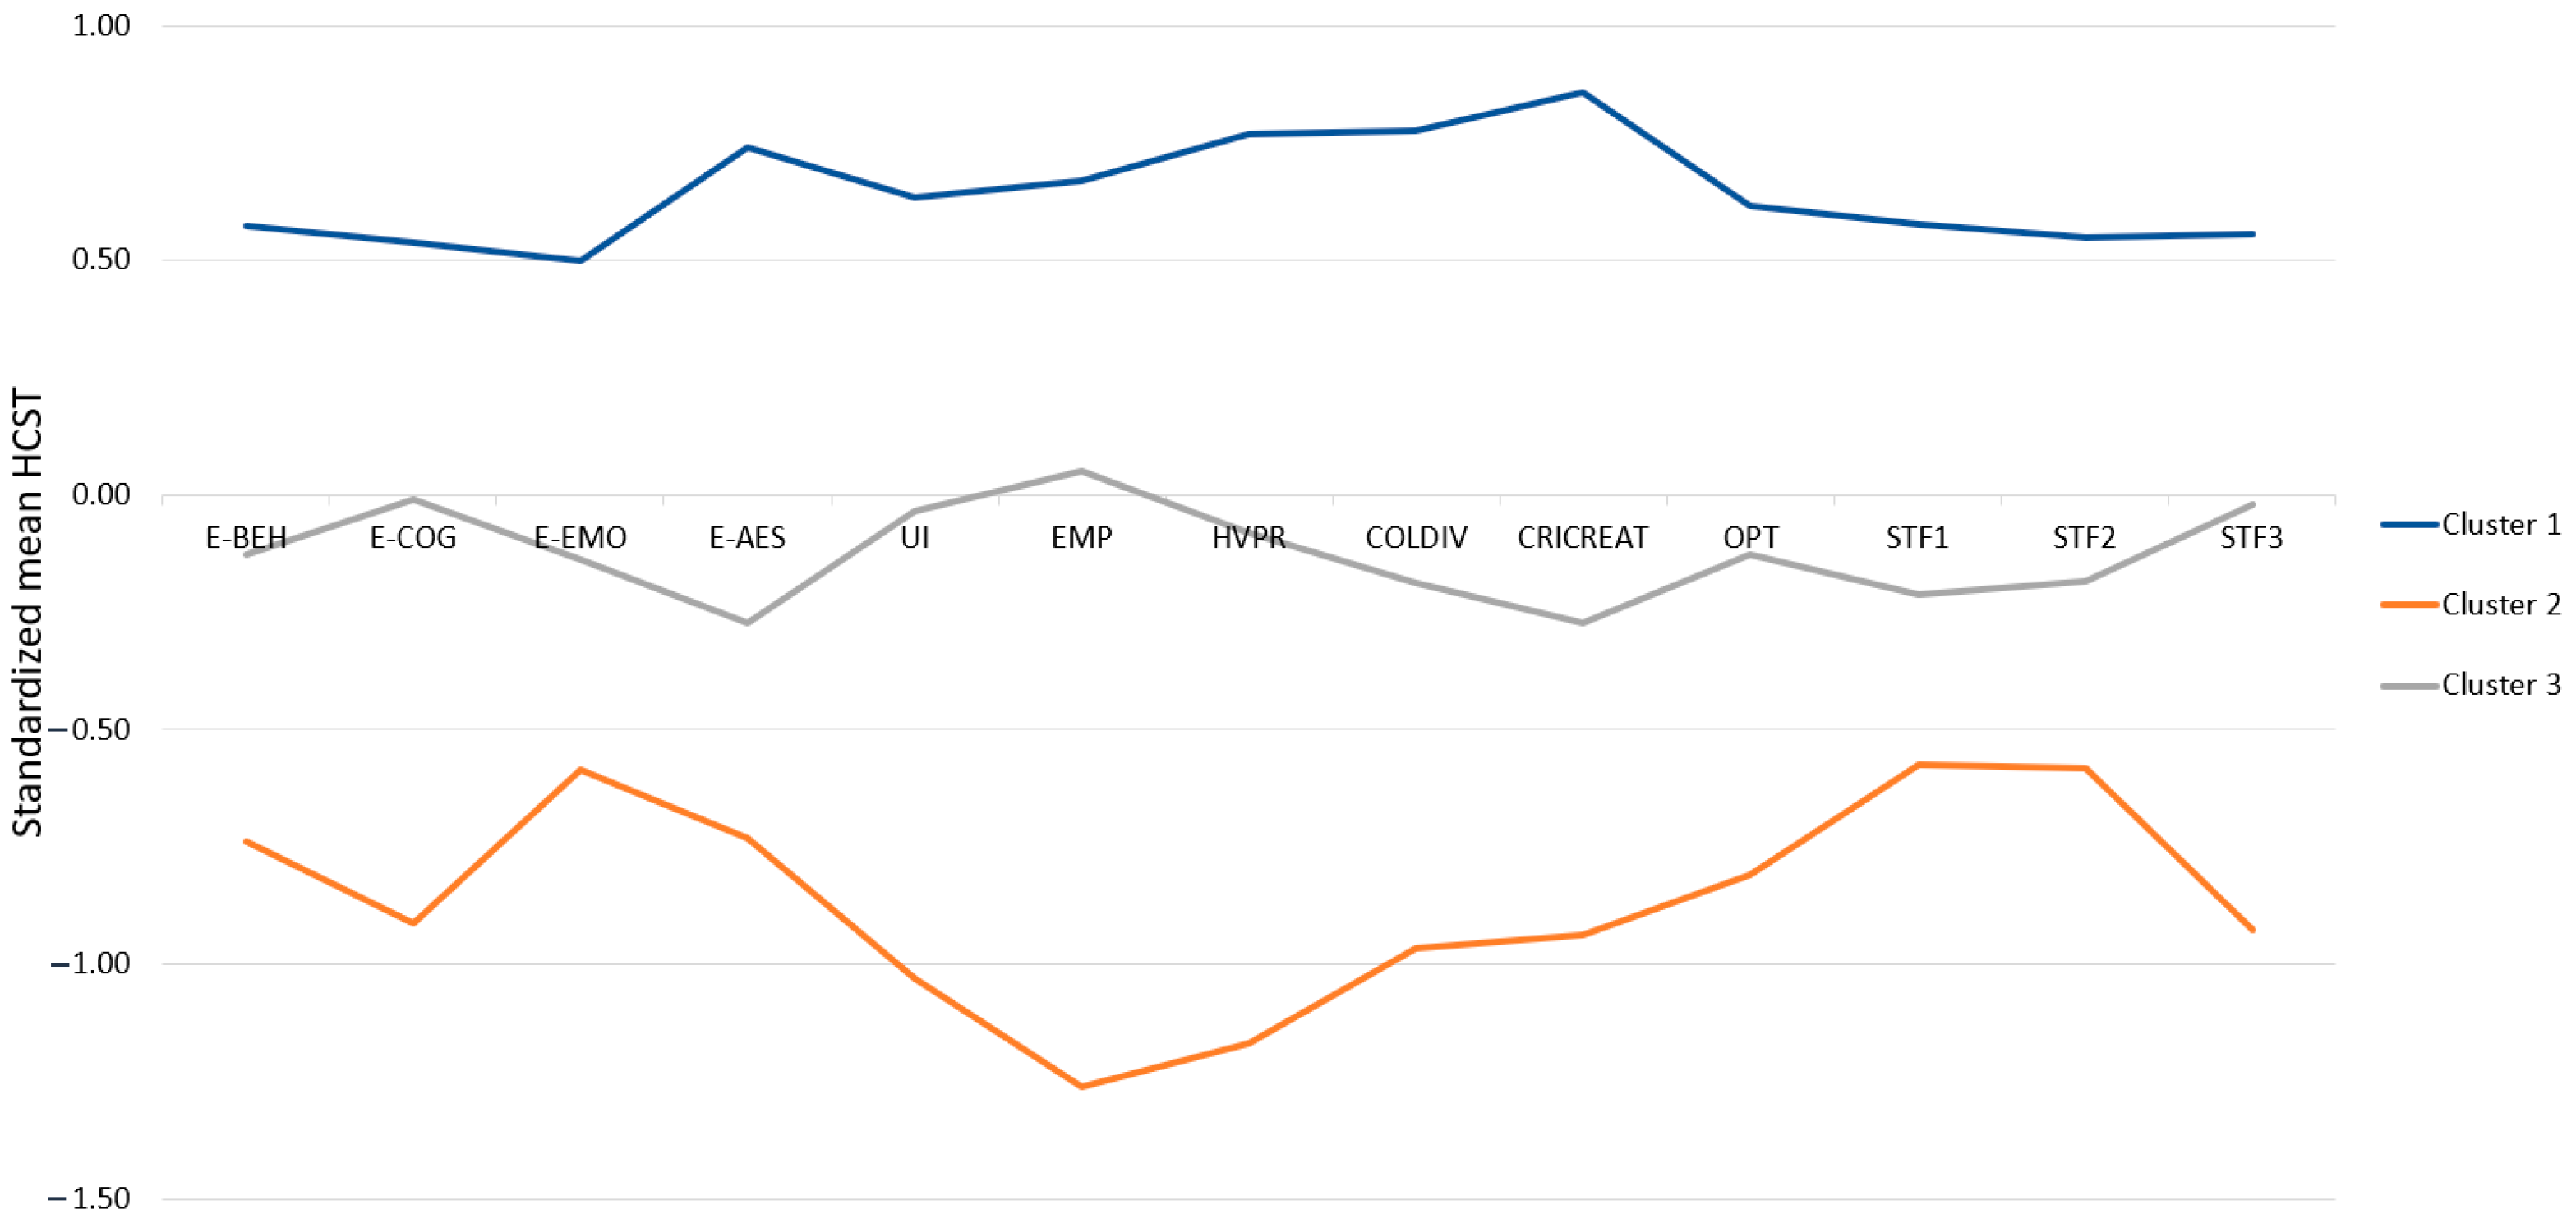
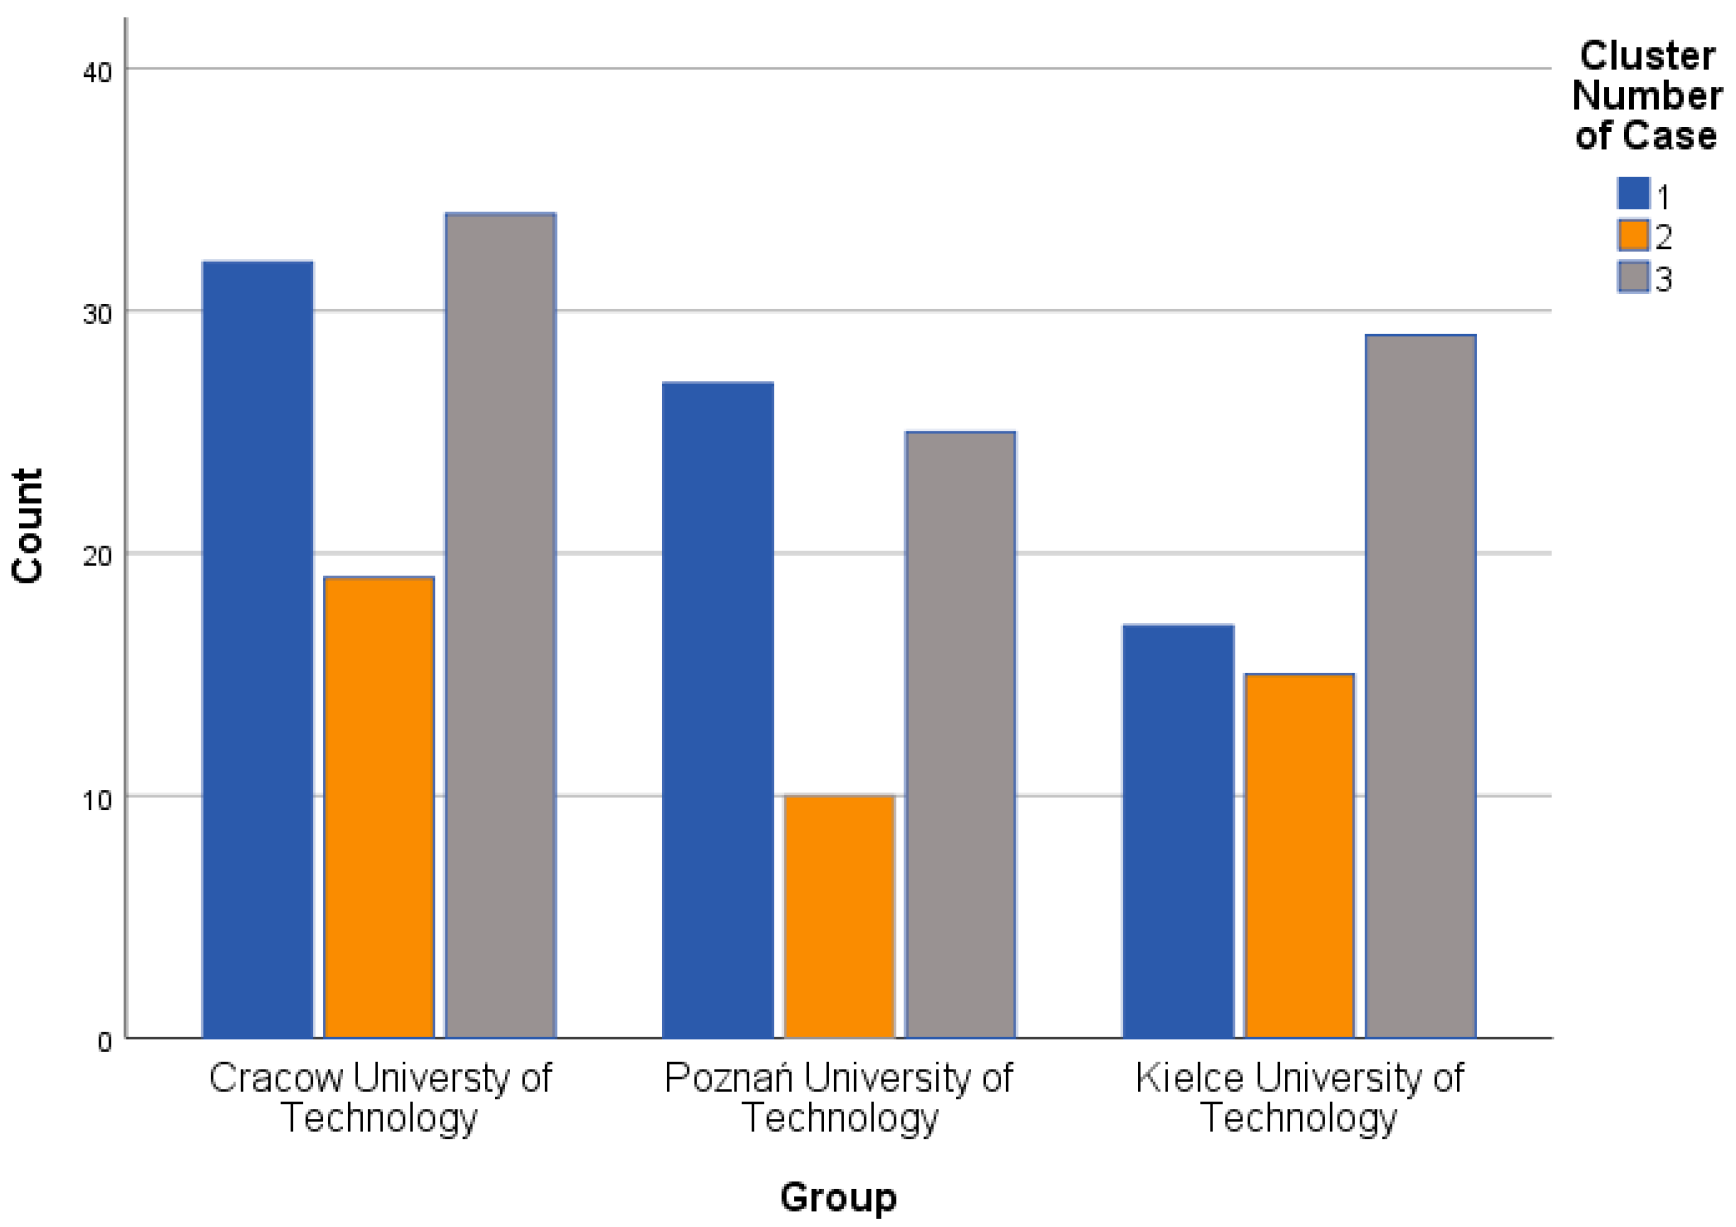
  • OBJ 2: To identify and characterize distinct HCST profiles among architecture students based on their engagement, design cognition, and emotional responses during sustainable and inclusive design learning.
  • OBJ 3: To examine the differences in ICT self-concept, perceived design thinking ability, and grade point average (GPA) among students with different HCST profiles.
  • OBJ 4: To determine how prior knowledge, intrinsic motivation, and risk propensity predict the likelihood of students exhibiting high HCST profiles.
To achieve these objectives, the following research questions (RQs) and corresponding hypotheses were formulated:
  • RQ1: How are students’ systems thinking and design thinking connected to their ICT self-concept and engagement when learning about sustainable and inclusive design?
Hypothesis 1a.
There is a positive correlation between students’ systems thinking abilities and their ICT self-concept in the context of sustainable and inclusive design learning.
Hypothesis 1b.
Students with higher design thinking abilities will demonstrate higher levels of engagement when learning about sustainable and inclusive design.
  • RQ2: Which HCST profiles can be discerned based on students’ engagement, design cognition, and emotions when learning about sustainable and inclusive design?
Hypothesis 2.
Distinct HCST profiles exist among architecture students, characterized by varying levels of engagement, design cognition, and emotional responses in sustainable and inclusive design learning.
  • RQ3: How do students with different HCST profiles differ concerning their ICT self-concept, perceived design thinking ability, and grade point average (GPA)?
Hypothesis 3a.
Students with high HCST profiles will have a higher ICT self-concept compared to those with lower HCST profiles.
Hypothesis 3b.
Students with high HCST profiles will report higher perceived design thinking abilities.
Hypothesis 3c.
Students with high HCST profiles will have higher GPAs than students with lower HCST profiles.
  • RQ4: How do prior knowledge, intrinsic motivation, and risk propensity predict the likelihood of students exhibiting high HCST profiles?
Hypothesis 4a.
Prior knowledge positively predicts the likelihood of a student exhibiting a high HCST profile.
Hypothesis 4b.
Higher levels of intrinsic motivation are associated with a greater likelihood of students having high HCST profiles.
Hypothesis 4c.
Students with a higher propensity for risk-taking are more likely to exhibit high HCST profiles.
By addressing these objectives, this research aims to contribute to the body of knowledge in design, technology, and engineering education, particularly in the context of sustainable and inclusive design. The findings are expected to offer valuable insights for educators and policymakers seeking to cultivate more effective and inclusive learning environments that not only enhance students’ design capabilities but also foster a strong ICT self-concept and sustained engagement in learning. To our best knowledge, this is the first study examining architecture students’ HCST profiles together with ICT self-concept, design thinking, intrinsic motivation, and risk propensity. Despite the novelty and uniqueness of the study, we still assume that students with high HCST might also have high perceived ICT self-concept and design thinking, together with higher intrinsic motivation. In analyzing risk propensity, it is important to consider that students with high HCST ability may experience a range of impacts—positive, negative, or neutral. Any of these outcomes can occur depending on the context and nature of the risks involved.

2. Materials and Methods

This study is guided by four research questions: the first determines the relationships among constructs that might be relevant to HCST during inclusive and sustainable architecture design (RQ1), and the next three examine dimensionality and profile validity using a person-centered approach (RQ2–RQ4). Combining variable-centered and person-centered approaches can be particularly beneficial in research and analysis when addressing complex phenomena that require understanding both individual differences and general patterns [65].

2.1. Study Context

The aim of the architecture study programs delivered at universities engaged in this study is to consider cultural background and social inclusion, understood as supporting people with special needs (elderly people, children, and people with all kinds of disabilities) in architectural and interior design, assuming accessibility, the principles of universal design, and multiculturalism. A properly designed architectural structure and its interior allow people with physical disabilities to function comfortably and facilitate development. The architecture of a structure and its interior can also have an impact on emotions, so considering people with mental disabilities, it is important to consciously use space, color, and lighting, which can have a beneficial effect on supporting the treatment of anxiety, stress, or depression. Considering multiculturalism in architectural and interior design can have a positive impact on the aspect of cultural interpenetration. The program involves exploring the architecture and interior design practices of various cultures in order to sensitize future designers to the needs of space users and to indicate the directions of possible borrowing, e.g., floor seats inspired by Japanese interiors or minimalist means of expression as in Scandinavian interiors.
For architecture and interior design, the main users taken into consideration are people without any mental or physical barriers, although we have to include elderly people, children, and people with all kinds of mental and physical disabilities everywhere. To understand what kinds of physical disabilities people might have, teachers and students have the opportunity to experience them with various types of goggles (for vision disabilities), orthopedic crutches, wheelchairs, or special equipment that allows them to imagine wearing dentures or having muscle problems. Students have to include in their projects both sustainable and inclusive design for urban, architectural, and interior design. This emphasizes the importance of integrating human insights throughout the entire process, from initial problem identification and system visualization to redesign, testing, and future adaptation. The approach is iterative, with a strong focus on continuous learning and improvement.
As part of the design coursework, students are continually made aware of sustainable universal architectural and urban design. From their first projects, students are oriented toward the concept of an accessible city, meeting the needs of society today and generations of all ages in the future. It is important to pay attention to enhancing the quality of life for people with disabilities. Thus, inclusive architecture design is closely linked to United Nations Sustainable Development Goal 11: Sustainable cities and communities [66]. This goal aims to make cities and human settlements inclusive, safe, resilient, and sustainable. It focuses on creating accessible infrastructure and urban environments that meet the needs of all people, including marginalized groups, such as people with disabilities, older people, women, and children. For these reasons, students are eager to participate in experiments and simulation workshops. With the help of specialized equipment for and simulators of different types of defects and illnesses (e.g., GERT, the age simulation suit), they have the chance to realistically test and experience first-hand the needs of people with different problems. In this way, by interacting with these special items, they can accurately recognize the causes and types of conditions, e.g., motor conditions, of people with specific disabilities. As a result, these empirical activities and the opportunity to learn about different aspects of the individual functioning of seniors and people with various dysfunctions influence their creative design activities and represent an important impetus for creating an environment that provides accessible living conditions for all.
ICT plays a crucial role in modern architectural education by providing students with digital tools and systems that enhance design, visualization, analysis, and collaboration. These technologies enable architecture students to develop sophisticated projects that meet today’s professional standards. Students in the inclusive and sustainable design course effectively utilized ICT tools and digital systems, aligning their use with each tool’s core functionalities and intended purposes, e.g., CAD software, BIM, the 3D modeling and rendering software Rhinoceros, the parametric and algorithmic design tool Grasshopper, visualization and rendering tools, virtual reality and augmented reality tools, digital fabrication tools, the geographic information system (GIS), collaboration tools (MS Teams), and learning management systems (Moodle). By mastering these technologies, students enhance their design capabilities, analytical skills, and collaborative abilities. The use of these tools reflects the industry’s move towards digitalization, sustainability, and innovation, preparing students to contribute meaningfully to the built environment.
The mind map in Figure 1 outlines a structured process for applying HCST to design and systems change.
Some of the sustainable and inclusive design activities are shown in Appendix A. An entire simulation workshop process is shown in the composite Figure A1, following a procedure consisting of the following: (a) A theoretical introduction and instruction to participate in simulation experiments that provide the opportunity to test various ailments first-hand by testing simulators of specific diseases and defects. (b) Empirical experience with mobility disability. A comprehensive integrated special education tool with an eye control (C-Eye PRO) allows people with mobility disabilities to control a computer and surf the web using an eye-tracking device. (c) Experience with eye defects and diseases and simulated hand tremor. An in-depth exploration of the needs of blind and visually impaired people and people with senile hand tremor and the barriers they face. (d) Dynamic simulation workshops. Experiments in the form of simulations of the limitations of people with disabilities are carried out around barriers generated by the interior space and the equipment, empirical explorations of the laboratory space in the GERT old-age suit, and simulations of age and intellectual disabilities are generated through a multi-sensory experience: blurred vision, difficulty moving, pain, tinnitus, etc. (e) Conceptual design of a flat for a person with a mobility disability. The task is related to furnishing a flat in a multi-family building, using any kind of arrangement with basic equipment and considering the requirements of the person’s physical and mental comfort, aesthetics, and ergonomic principles as well as a correct relationship with the environment, assuming that the rooms are grouped into day and night zones. In addition, each flat should have a conservatory and possibly a loggia or balcony, and in the case of a flat located on the ground floor of a building, the design of a terrace, garden, and the immediate surroundings (Appendix A). Figure A1 shows well how the digital twin can be used as a technology that enables the connection between virtual and physical space, thus shaping physical–digital convergence, as Barat and Kayser [20] argue.
Figure A2 shows a presentation of the second project task (semester 2). The conceptual designs combine a range of design and simulation approaches, tested experimentally on different types of objects and spaces. Finally, Figure A3 shows the conceptual design of an urban interior (an urban square, shaping the human living environment in a contemporary city, and the principles of urban composition) and the design of an object adapted to the needs of people with disabilities (a mini-center for urban/tourist/student information or a mini-library, with an area of up to 35 m2) in relation to the surroundings, the space of the square, and the context of urban development (Appendix A).

2.2. Participants and Procedure

This study is part of 2 bigger studies, namely “Architecture education for the 21st century,” launched in 2022 by the Cracow University of Technology (CUT) as the promoting organization, with the cooperation of the University of Ljubljana under a project also launched in 2022, “Developing the twenty-first century skills needed for sustainable development and quality education in the era of rapid technology-enhanced changes in the economic, social and natural environment” (grant no. J5-4573). For the purpose of the current study, 3 architecture faculties were included, namely CUT, Poznan University of Technology (PUT), and Kielce University of Technology (KUT). The final sample consisted of 208 undergraduate students. The largest share of participants was from CUT (n = 85, 40.80%), while students from PUT and KUT were almost evenly distributed (n = 62, 29.80% and n = 29.40%, respectively). The mean age of the participants was 19.98 years (SD = 1.41, min 18, max 29 years). The sample represented the gender distribution of architecture students in Poland: 74.5% (n = 155) of participants were female and 25.5% (n = 53) were male [41]. All students who completed all questionnaires reported their gender.
The three universities were selected based on their distinctive approaches to architecture education, each emphasizing different aspects of human-centered design, technology integration, and sustainability. This diversity enables a more comprehensive exploration of HCST development across varied educational contexts. Moreover, by selecting universities from different geographical regions of Poland and of different sizes, we also wanted to take a broader perspective on HCST in architectural education. The geographic diversity and different sizes of the institutions help address cultural and institutional variations that may influence students’ learning experiences and perspectives. The selected three universities have established reputations in sustainable and inclusive design, which aligns well with the study’s focus on HCST. The study programs at these institutions emphasize human-centered and systems-based approaches, making them ideal settings for examining the integration of HCST concepts. Undergraduate architecture students were chosen because they are at a critical stage of developing foundational design thinking skills. Focusing on undergraduates allows for assessing how HCST concepts are introduced and understood early in architectural education, which is essential for long-term educational strategies. The universities selected for this study follow accredited architecture programs that adhere to standards recognized within the discipline. This ensures that the sample represents a high level of academic rigor and is relevant to broader educational practices in architecture.
The appropriateness of the sample size, including its power analysis, was checked by G*Power v. 3.1.9 (Heinrich-Heine-Universität Düsseldorf, Düsseldorf, Germany) [67]. A priori power analysis was performed for the study, taking logistic regression for the validation of the model where required power was set at (1 − β) 0.80, α = 0.05, 2-sided testing, and odds ratio = 1.71. Using these settings, total sample size was calculated and determined for this study as n = 179, indicating that the sample size of 208 participants involved in the current study would yield reliable and valid sample estimates for the target population. The sample size of 208 would also be sufficient for conducting cluster analysis, where the rule of thumb was applied for 15 clustering variables with a minimum sample size of 150 [68]. Using an online sample size calculator (https://sample-size.net/means-effect-sizeclustered/; accessed on 15 July 2024) and the following settings: 2-sided testing, power (1 − β) = 0.80, 5 expected clusters with a size of 35, moderate effect size effect of 0.5, and within-cluster correlation coefficient 0.02, the total sample size, including adjustments for clustering, was 205. For the purpose of data analysis, we excluded students who did not entirely complete the survey (n = 45), and the effective response rate was 38.5%, which is comparable with average response rates for online surveys [69].
The sample’s validity is supported by the selection of participants from a range of university settings, ensuring a varied perspective on HCST in architecture education. This choice enhances the study’s applicability to similar educational contexts while recognizing that findings may differ in other educational frameworks.
The data collection for the current study was carried out at the end of the summer semester of academic year 2023–2024, when 4 questionnaires were delivered to students online via Google Forms. Before proceeding with the questions, students were informed about the study, including the purpose, benefits, procedure, consequences, confidentiality of their responses, data analysis, and use of results. Students who agreed to take part in the study gave informed consent. All consent forms were collected via Google Forms and securely archived at CUT. The American Psychological Association’s Ethical Principles and the ethical guidelines of the Polish National Board on Research Integrity were carefully followed during the whole project. This study was officially approved by the corresponding ethical committee or board at all 3 involved universities, and all ethical statements were collected and archived at CUT.

2.3. Measures

This study investigated students’ engagement with learning, self-concept in relation to ICT, systems thinking, design thinking, human-centeredness, and motivational traits during sustainable and inclusive design activities. These variables were assessed using a Likert scale. Additionally, students self-reported their GPA and design course grades, which were later verified through their records at the university’s Office of Student Affairs. The GPA and design course grades were measured on a scale from 1 to 5, with a minimum grade of 2 required for successful design work. All 6 measures, along with the finalized survey instruments, are provided in the Supplementary Materials under the title “Student HCST Survey”.

2.3.1. Student Engagement

The students’ engagement was measured using the Student Engagement Instrument (SEI), which was used and validated in our previous study [41]. The SEI is based on original instruments developed by Naibert and Barbera [70] and Diessner [58]. The SEI uses a 6-point Likert scale (from 1 = strongly disagree to 6 = strongly agree) and consists of 24 items aimed at measuring students’ engagement in learning within the following categories:
  • Behavioral (E-BEH, 4 items);
  • Cognitive (E-COG, 4 items);
  • Emotional (E-EMO, 5 items);
  • Social (E-SOC, 4 items);
  • Aesthetic (E-AES, 3 items);
  • Somatic engagement (E-SOM, 4 items).
Although the instrument was validated in our previous study [41], we validated the survey constructs to provide evidence of the construct as well as convergent and discriminant validity with reliability analysis. Exploratory factor analysis (EFA) was performed to verify the acceptability of the measurement of engagement constructs. Principal axis factoring (PAF) estimation was used with Promax rotation, which revealed a 6-factor solution. All extracted communalities were greater than 0.5 and loadings were greater than 0.5, as proposed by Tabachnik and Fidel [71]. The Kaiser–Meyer–Olkin (KMO) measure of sampling adequacy was 0.79, indicating the reliability of the PAF and the compactness of the correlations, and confirming the sample’s ability to produce distinct components (Bartlett’s test of sphericity was significant, p < 0.001). The total variance explained with 6 factors was 59.4%, which is above the threshold of 0.5 suggested by Hair et al. [72]. The number of constructs formed for student engagement with learning was checked and confirmed by Velicer’s MAP test [73], which indicated 6 components. The reliability of the student engagement constructs was provided using McDonald’s ω estimation method, which was calculated using Hayes’ macro for SPSS (downloaded from www.afhayes.com; accessed on 5 July 2024) [74]. The convergent and discriminant validity of the constructs (Table 1 and Table 2) were assessed using SmartPLS4 software (www.smartpls.com; accessed on 18 July 2024).
As is shown in Table 1, all average variance extracted (AVE) values are above the threshold of 0.5, whereas the square root of AVE (bold diagonal), McDonald’s ω, and composite reliability (CR) are larger than 0.7, the threshold suggested by Hair et al. [72]. The values of correlation coefficients (off-diagonal) indicate small to large convergence [75]. Thus, the results in Table 1 indicate the convergent validity for the adapted constructs, and high convergent validity supports the retention of all dimensions of student engagement with learning [76]. The reliability of each construct was estimated using McDonald’s ω, which revealed moderate to high reliability for all scales (from 0.74 to 0.85) [77].
In this study, discriminant validity was examined using the heterotrait–monotrait (HTMT) approach proposed by Hensler et al. [78] and controlled using the Fornell–Larcker criterion, which checks whether the AVE associated with constructs is greater than the shared variance between constructs [79]. As shown in Table 2, the HTMT values are below the more conservative threshold of 0.85 [80], while the AVE values on the diagonal are larger than the average shared variance (ASV) (values in parentheses), thus supporting the discriminant validity of the measures, as argued by [76,81].

2.3.2. Self-Concept Related to ICT

The students’ self-concept related to ICT was measured using an adapted 25-item instrument original developed by Schaufell et al. [82], which was used and validated in our previous study [41]. For the assessment, a 6-point Likert scale ranging from 1 (strongly disagree) to 6 (strongly agree) was used. Students were asked to choose the option that best described their learning situation.
Before submitting data for EFA, the EFA assumptions were checked. Bartlett’s test of sphericity was significant (p < 0.001) and indicated that the correlation matrix was not random, while the KMO measure of sampling adequacy (0.94) was above the threshold of 0.5 [71]. After establishing assumptions, EFA using the PAF estimation method and Promax rotation revealed a 5-factor structure. Communalities after extraction ranged from 0.60 to 0.85, and each item had a clear primary loading on one factor greater than |0.5|. The number of factors retained in the model was also checked using Velicer’s MAP test, which indicated a 5-factor solution, i.e., 5 factors explained 72.3% of the variance in the model. The dimensions of ICT self-concept with number of items were as follows:
  • General data and information literacy (SC-GL, 5 items);
  • Communication and collaboration (SC-CO, 4 items);
  • Processing, storing, and generating content (SC-PSGC, 8 items);
  • Safe application (SC-SA, 4 items);
  • Solving problems (SC-SP, 4 items).
Next, we assessed convergent validity, and the results are shown in Table 3. All AVE values are above the threshold of 0.5, whereas the square root of AVE (bold diagonal), McDonald’s ω, and CR are larger than 0.7, the threshold suggested by Hair et al. [72]. The values of correlation coefficients (off-diagonal) indicate large convergence [75]. Thus, the results in Table 3 indicate convergent validity for the adapted constructs, and high convergent validity supports the retention of all dimensions of the student self-concept related to ICT [76]. The reliability of each construct was estimated using McDonald’s ω, which revealed high reliability for all scales (from 0.90 to 0.94) [77].
Table 4 indicates the establishment of discriminant validity for the ICT-SC constructs. The HTMT values are below the more conservative threshold 0.85 [80], while the AVE values on the diagonal are larger than average shared variance (ASV) (values in parentheses), thus supporting the measures’ discriminant validity, as argued by [76,81].

2.3.3. Systems Thinking

Students’ systems thinking was measured by means of the Systems Thinking Scale (STS), originally developed by Moore et al. [83]. The scale comprises 20 items, to be answered on a 6-point Likert scale (0 = never to 5 = always). The questions ask students how confident they feel about being able to recognize, understand, and synthesize the interactions and interdependencies in a set of components designed for a specific purpose [83], in our case sustainable and inclusive design. Even though we used and validated this instrument in our previous study [41], for the purpose of the current study we also provide evidence of construct, convergent, and discriminant validity. EFA using PAF estimation and Promax rotation revealed a 3-factor structure. Communalities after extraction ranged from 0.51 to 0.76, and each item had a clear primary loading on one factor greater than |0.5|. The number of factors retained in the model was also checked using Velicer’s MAP test, which indicated a 3-factor solution. Thus, we also confirmed the findings from our previous study [41]. Three factors explained 62.2% of the variance in the model. The final instrument for measuring systems thinking comprised 11 items. The scores for each item were summed to generate a total STS score, ranging from 0 to 55. The dimensions of systems thinking and the corresponding number of items included in the instrument were contextualized within the following factors:
  • Sequence of events and causal sequence (STF1, 4 items);
  • Interrelations of factors, patterns of relationships, and feedback (STF2, 4 items);
  • Multiple causations possible and variations of different types (STF3, 3 items).
Next, we assessed convergent validity, and the results are shown in Table 5. All AVE values are above the threshold of 0.5, whereas the square root of AVE (bold diagonal), McDonald’s ω, and CR are larger than 0.7, the threshold suggested by Hair et al. [72].
The values of correlation coefficients (off-diagonal) indicate moderate convergence [75]. Thus, the results in Table 5 indicate convergent validity for the adapted constructs, and moderate convergent validity supports the retention of all dimensions of student systems thinking [76]. The reliability of each construct was estimated using McDonald’s ω, which revealed moderate reliability for all scales (from 0.80 to 0.82) [77].
Table 6 indicates the establishment of discriminant validity of STS constructs. HTMT values are below the more conservative threshold 0.85 [80], while AVE values on the diagonal are larger than average shared variance (ASV) (values in parenthesis), thus supporting the measures’ discriminant validity, as argued by [76,81].
The shared variance between 2 constructs is less than 49%; thus there were no concerns regarding evidence of discriminant validity, as argued by Cheung et al. [84].

2.3.4. Design Thinking

Using mindset theory to map design thinking among architecture students, we considered the findings of Dosi et al. [85] and Vignoli et al. [86], paying special attention to their design thinking mindset. We used and validated Dosi et al.’s [85] design thinking mindset in our previous study [41], but the results suggested the establishment of the limits of the theoretical definitions of mindset that the instrument could inform personal or peer reflections on elements that a student needs to improve [86]. Thus, for the purpose of the current study, we adapted that questionnaire to the sustainable and inclusive design context based on the design thinking mindset by Vignoli et al. [86]. An entire questionnaire called “Design and Me” consists of 74 items and uses a 6-point Likert assessment scale ranging from 1 (strongly disagree) to 6 (strongly agree).
EFA was conducted to examine the construct validity of the questionnaire, using PAF extraction with Promax rotation. Prior to EFA, the factorability of the data was appraised with the KMO test (KMO = 0.91) and Bartlett’s test (p < 0.001). The results were in the excellent range according to Tabachnick and Fidel [71] and Capobianco et al. [87]. Considering various possible factor structures, inspecting a screen plot indicated that as few as 7 factors could be retained, while Velicer’s MAP test indicated a 6-factor solution. The final questionnaire to map students’ design thinking consisted of 31 items, structured within the following 6 constructs:
  • Collaboration and openness to different perspectives (DT-COL, 4 items);
  • Creativity and abductive thinking (DT-CREAT, 8 items);
  • Empathy (DT-EMP, 4 items);
  • Learning orientation and optimism about having an impact (DT-LO, 7 items);
  • Learning by making and doing (DT-MD, 4 items);
  • Embracing risk and tolerating uncertainty (DT-RISK, 4 items).
All factor loadings for the outer model were higher than 0.7, while extracted communalities ranged from 0.50 to 0.81. A 6-factor solution explained 68.2% of the variance in the model. Next, we assessed convergent validity, and the results are shown in Table 7. All AVE values are above the threshold of 0.5, whereas the square root of AVE (bold diagonal), McDonald’s ω, and CR are larger than 0.7, the threshold suggested by Hair et al. [72].
The values of correlation coefficients (off-diagonal) indicate moderate to high convergence [75]. Thus, the results in Table 7 indicate convergent validity for the adapted constructs, and moderate to high convergent validity supports the retention of all dimensions of student design thinking [76]. The reliability of each construct was estimated using McDonald’s ω, which revealed moderate to high reliability for all scales (from 0.81 to 0.90) [77].
Table 8 indicates the establishment of discriminant validity of design thinking constructs. HTMT values are below the more conservative threshold 0.85 [80], while AVE values in the diagonal are larger than the average shared variance (ASV) (values in parentheses), thus supporting the measures’ discriminant validity, as argued by [76,81].
The shared variance between 2 constructs is less than 49%, a threshold recommended by [84]; thus, there were no concerns regarding evidence for discriminant validity showing a degree of distinctness of latent constructs, as argued by Cheung et al. [84].

2.3.5. Human-Centeredness

In the context of design thinking, human-centeredness refers to a design and problem-solving approach that prioritizes the needs, experiences, and wellbeing of people under two principles: finding the right problem and fulfilling human needs by design [24,86]. For human-centricity, it is essential to empower individuals so they can enhance their skills and competencies in collaboration with digital technologies [2]. A literature review [9,12,14,15,19,23,27,63] indicates a gap in the research of established or validated measures for human-centeredness in design work; thus, we synthetized an approach to better understand human behavior while designing. Based on processes of design cognition and metacognition, we followed the frameworks of Gero and Milovanovic [12] and Kavousi et al. [88] to determine dimensions, which was also supported by the model of IDEO [6] (https://www.ideou.com/collections/courses/products/human-centered-systems-thinking; accessed on 14 July 2024). The concept of human-centeredness in problem solving is reflected in being empathy driven, promoting user involvement, being focused on usability and accessibility, having iterative design, being holistic, and fostering collaboration and diverse perspectives, crucial and creative thinking, and sustainability [12,24,39]. For the purpose of this study, we developed an instrument with 29 items categorized into 6 dimensions, as follows:
  • Collaboration and diversity (COLDIV, 4 items);
  • Critical and creative thinking, and decision-making (CRICREAT, 9 items);
  • Empathy (EMP, 4 items);
  • Holistic view and problem reframing (HVPR, 6 items);
  • Optimism about having an impact (OPT, 3 items);
  • User involvement (UI, 3 items).
For the assessment, a 6-point Likert scale, ranging from 1 (strongly disagree) to 6 (strongly agree), was used.
EFA was conducted to examine the construct validity of the questionnaire, using PAF extraction with Promax rotation. Prior to EFA, the factorability of the data was appraised with the KMO test (KMO = 0.92) and Bartlett’s test (p < 0.001). The results were in the excellent range according to Tabachnick and Fidel [71] and Capobianco et al. [87]. Considering various possible factor structures, inspecting a screen plot indicated that as few as 7 factors could be retained, while Velicer’s MAP test indicated a 6-factor solution. A 6-factor solution explained 69.4% of the variance in the model, while extracted communalities ranged from 0.50 to 0.79. Next, we assessed convergent validity, and the results are shown in Table 9. All AVE values are above the threshold of 0.5, whereas the square root of AVE (bold diagonal), McDonald’s ω, and CR are larger than 0.7, the threshold suggested by Hair et al. [72].
The values of correlation coefficients (off-diagonal) indicate moderate to high convergence [75]. Thus, the results in Table 9 indicate the convergent validity of the adapted constructs, and moderate to high convergent validity supports the retention of all dimensions of student human-centeredness [76]. The reliability of each construct was estimated using McDonald’s ω, which revealed moderate to high reliability for all scales (from 0.78 to 0.91) [77].
Table 10 indicates the establishment of the discriminant validity of human-centeredness constructs. The HTMT values are below the more conservative threshold of 0.85 [80], while the AVE values on the diagonal are larger than the average shared variance (ASV) (values in parentheses), thus supporting the measures’ discriminant validity, as argued by [76,81].
The maximum shared variance between 2 constructs is 50%, which is just above the threshold recommended by Cheung et al. [84]. Since the correlation between 2 constructs does not exceed 0.80 [80], there was no increased cause for concern regarding the evidence for discriminant validity to show a degree of distinctness of latent constructs, as argued by Cheung et al. [84].

2.3.6. Intrinsic Motivation and Risk Propensity

The intrinsic motivation of a student or employee plays an important role in design- and research-based activities, since it can spur research skills, productivity, persistence in activity, flexibility, spontaneity, and creativity [89,90]. Moreover, intrinsic motivation is believed to drive risk-taking behavior [89,91]. Thus, we developed an instrument considering both intrinsic motivation and risk-taking ability. The instrument for measuring students’ intrinsic motivation and risk propensity consisted of 5 subscales. One subscale related to risk propensity was developed based on Vignoli et al. [86] and Zhang et al. [92], while 3 types of intrinsic motivation were measured with an adapted and modified version of the Academic Motivation Scale [93]: intrinsic motivation to know, to accomplish things, and to experience stimulation in the architecture education context. In total, the instrument contained 19 items that were assessed on a 6-point Likert scale ranging from 1 (strongly disagree) to 6 (strongly agree). The structure of the instrument was as follows:
  • Intrinsic motivation to accomplish things to make a difference (INTM-A1, 3 items);
  • Intrinsic motivation to accomplish things, being forward-thinking, and actively pursuing objectives (INTM-A2, 3 items);
  • Intrinsic motivation to experience stimulation, involve hands-on activities, and allow for deep immersion into the content (INTM-E, 3 items);
  • Intrinsic motivation to know (INTM-K, 6 items);
  • Risk propensity (RP, 4 items).
We conducted EFA to provide evidence of the construct validity. KMO = 0.89, which is above the threshold of 0.5 proposed by Tabachnick and Fidel [71], suggests that the data were suitable for factor analysis, while Bartlett’s test of sphericity was significant (p < 0.001), indicating that factor analysis was appropriate. EFA with PAF rotation with oblique rotation revealed a 5-factor underlying structure, which explained 63.5% of the variance. Communalities after extraction ranged from 0.45 to 0.75. Parallel approaches to determine the number of factors to retain were used; both a scree plot and Velicer’s MAP test suggested a 5-factor solution.
Next, we established the convergent validity, in which items measuring intrinsic motivation and risk propensity converge to represent the underlying construct (see Table 11). AVE extracted and composite reliability were reviewed along with McDonald’s ω. All AVE values are above the threshold of 0.5, whereas the square root of AVE (bold diagonal), McDonald’s ω, and CR are larger than 0.7, the threshold suggested by Hair et al. [72]. The results indicate that the explained variance is larger than the error variance, confirming that all variables exceeded the reliability criterion [94].
The results in Table 11 indicate convergent validity for the adapted constructs, and the moderate to high convergent validity supports the retention of all dimensions of student motivation and risk propensity subscales [76].
To establish discriminant validity, we assessed whether the reflective construct exhibited a stronger relationship with its own indicators than those of any other construct in the model [94].
As shown in Table 12, establishing the discriminant validity of motivation and risk propensity constructs yielded distinctive constructs. The HTMT values are below the more conservative threshold of 0.85 [80], while the AVE values on the diagonal are larger than average shared variance (ASV) (values in parentheses), thus supporting the measures’ discriminant validity, as argued by [76,81].
A parallel analysis of cross-loadings revealed no threats to discriminant validity, since no indicator cross-loads on other constructs were found, and the difference in loading was greater than 0.1, as recommended by Cheung et al. [84].

2.4. Data Analysis

For data analysis, we used IBM SPSS Statistics (v.25) and partial least squares–structural equation modeling (PLS-SEM) [94], which is recommended when the primary objective of applying SEM is to identify and predict target dimensions [78]. SmartPLS4 software was used.

2.4.1. Descriptive Statistics and Normality Tests

All scales and subscales were reported with mean (M), standard deviation (SD), and confidence interval (CI) values. Data distribution was tested against the measures of symmetry (skewness) and tailedness (kurtosis), while the Shapiro–Wilk test was used to test the normality of data distribution.

2.4.2. Statistical Validity and Analysis

For construct validity, we followed a three-step procedure, using EFA to identify the underlying structure of constructs and SmartPLS4 software to establish convergent and discriminant validity. Next, to provide evidence of reliability and internal consistency, we calculated McDonald’s omega using Hayes’ Omega macro for SPSS (downloaded from www.afhayes.com; accessed on 1 July 2024) and composite reliability using SmartPLS4.
SmartPLS4 was used for predicting and identifying key driver constructs, then testing the model to answer the first research question. To address the second research question, we employed a two-step clustering approach combining both hierarchical and non-hierarchical methods. This strategy enhances the robustness and reliability of the clustering results by leveraging the strengths of each method. Initially, hierarchical cluster analysis was conducted using Ward’s method with squared Euclidean distance [95]. Ward’s method minimizes the total within-cluster variance. This method iteratively merges clusters that result in the smallest increase in the overall sum of squared distances within clusters [95]. As the measure of dissimilarity between observations, the squared Euclidean distance amplifies larger differences, making it effective for distinguishing distinct clusters [95]. The variables used for clustering included student engagement and human-centeredness in design complemented with self-reported systems thinking ability. The scales used for assessing these variables differed in the number of points; thus, the data were standardized. Following this, k-means cluster analysis was carried out to validate and refine the cluster solution obtained from the hierarchical analysis [95]. Using the cluster centers from the hierarchical analysis as initial seed points, we conducted k-means clustering with the predetermined number of clusters. The algorithm iteratively reassigned observations to clusters based on the nearest cluster center, recalculating centers until convergence was achieved. We compared cluster memberships from both methods to assess consistency. High agreement indicates stable and reliable clusters. Next, we calculated internal validation indices the silhouette coefficient to evaluate the cohesion and separation of clusters followed by profiling each cluster based on the mean values of the variables to interpret and label the clusters meaningfully, e.g., high HCST, average HCST, and low HCTS. Finally, to ensure the robustness of our clustering solution, we conducted a validation procedure with external validation variables, as proposed by Gore [95]. We included additional variables not used in the clustering process, such as GPA, to examine whether the clusters differed significantly on these external factors using ANOVA.
Each cluster was analyzed to understand its characteristics. For instance, one cluster might represent students with high engagement and systems thinking ability but moderate human-centeredness. We ensured that the identified clusters align with the existing theories and literature on student engagement and systems thinking, enhancing the validity of our findings.
By integrating hierarchical and k-means clustering methods and conducting comprehensive validation checks, we ensured a robust identification of distinct HCST profiles among students. This methodological rigor enhances the credibility of our findings and provides valuable insights into the variations in student engagement, human-centeredness in design, and systems thinking ability.
Cluster membership was used in the next step of analysis. To examine the third research question, we conducted preliminary analyses to assess the normal distribution of the data, homogeneity of variance, and multicollinearity between constructs. These analyses revealed no violation of assumptions. Thus, multivariate analysis of variance (MANOVA) was used to examine whether HCST profiles are related to individual learner characteristics (research question 3). Students’ ICT self-concept, perceived design thinking ability, and GPA were included as dependent variable. For the effect size, we used partial η2, which can be estimated as follows: η2 = 0.01 is weak, η2 = 0.09 is moderate, and η2 = 0.25 is strong [96]. MANOVA is appropriate for addressing the third research question because it allows us to simultaneously examine the differences among students with varying HCST profiles across multiple dependent variables [72]. Moreover, MANOVA considers the potential interrelationships among these outcomes, providing a more comprehensive understanding of how students’ HCST profiles influence multiple facets of their academic and personal development. Next, by using MANOVA, we are reducing the risk of Type I error and considering all dependent variables simultaneously, leading to more reliable results [72]. MANOVA does not just reveal whether students with different HCST profiles differ, but it also reveals which combinations of variables (or individual variables) contribute most to these differences [72]. This can clarify whether certain profiles are associated with particular patterns across ICT self-concept, perceived design thinking ability, and GPA, which may not be apparent if examined separately.
To examine the fourth research question, we used MLR to examine whether prior knowledge, intrinsic motivation, or risk propensity predicts HCST. MLR allows us to model the relationship between multiple independent variables and a categorical dependent variable with more than two categories. This method is suitable for addressing RQ4 due to its ability to (1) handle categorical outcomes with multiple categories, (2) model the influence of multiple predictors, (3) estimate probabilities and odds ratios, (4) accommodate non-linearity and interaction effects, and (5) function effectively when the assumptions of normality or homoscedasticity are not met [71,77]. The contribution of MLR to understanding differences among HCST profiles can be seen in the following ways:
  • Identifying key predictors: MLR helps determine which factors significantly influence the likelihood of students being in a high HCST profile category.
  • Understanding relative influence: By analyzing the coefficients, we can understand the relative importance of prior knowledge, intrinsic motivation, and risk propensity in predicting HCST profiles.
  • Informing interventions: The results can guide educational interventions by highlighting areas (e.g., boosting intrinsic motivation) that could enhance students’ HCST profiles.
  • Exploring complex relationships: The method allows for the exploration of complex relationships [77], including potential interactions between predictors, contributing to a deeper understanding of how these factors collectively affect HCST profiles.
By using MLR, this study can offer valuable contributions to educational research and practice by identifying key factors that promote higher-order cognitive skills and traits among students.

3. Results

3.1. Students’ Systems and Design Thinking in Relation to Their ICT Self-Concept and Engagement in Learning

Table 13 shows descriptive statistics for the research scales and subscales. The values of skewness and kurtosis as shown in the table are in acceptable ranges (−2 to +2 and −7 to +7, respectively), as proposed by Hair et al. [72]. The Shapiro–Wilk test gave a p-value indicating the probability that the data were normal distributed (p > 0.05). Thus, scale distributions could be generally considered normal.
Engagement, design thinking, and systems thinking were rated similarly with the highest mean values, while SC-ICT was rated the lowest. For the engagement scale, it seems that behavioral and cognitive engagement prevailed, while social and somatic factors were not so highly rated.
Students’ self-concept related to ICT was the highest in the collaboration and communication dimension, and the lowest in problem solving with ICT. Systems thinking subscales were estimated similarly, while students’ perception of design thinking ability ranged from 3.51 (embracing risk) to 4.82 (empathy).
Secondly, we assessed the relationships between variables using Pearson correlations to understand how the variables were related to one another on a bivariate level and if the assumption for testing the model was met in terms of linear association. No high correlations were detected, indicating no concerns with multicollinearity, as shown in Table 14.
To further investigate the connection between SC-ICT and engagement, the effect of systems thinking on engagement, SC-ICT and design thinking, and the effect of design thinking on SC-ICT and engagement, PLS-SEM analysis was performed, with paths specified according to the theoretical model derived from the literature review.
The PLS-SEM results were evaluated in a three-step procedure. First, the overall fit of the estimated model was evaluated through the bootstrap-based test of the overall model fit, and the standardized root mean square residual (SRMR) as a measure of the approximate fit to obtain empirical evidence for the proposed theory, as proposed by Benitez et al. [97]. In the present study, the PLS-SEM yielded an SRMR value of 0.06, which was below the recommended threshold of 0.08 [97] and is usually considered evidence of good fit [72]. The normed fit index (NFI) value was 0.87, which indicates a reasonably good fit but falls slightly below the generally accepted threshold for a strong model fit, which is typically 0.90 or higher [72]. Both d_ULS (i.e., the squared Euclidean distance) and d_G (i.e., the geodesic distance) offer values that are not significant (0.58 and 0.19, respectively), indicating a good model fit [94,97,98].
Second, we assessed the outer model, in which all loadings were above 0.7, while the composite reliability values ranged from 0.71 to 0.95, confirming that the items consistently represent the same latent construct [97]. Cronbach’s alpha values of constructs ranged from 0.71 to 0.88, indicating reliable constructs. The cut-off values of 0.70 for Cronbach’s alpha and composite reliability measure appear to be acceptable and are widely applied in PLS-SEM research [98]. The convergent validity of the constructs was assessed using the AVE. The AVEs were between 0.60 and 0.68, which is above the threshold value of 0.5 [72] and, thus, proves the convergent validity of the constructs. The recommended measure of discriminant validity is the HTMT of the correlations [98], and the HTMT values were less than the conservative cut-off value of 0.85 for all constructs. After establishing the validity of the outer measurement model, we now assess the inner structural model.
Third, we assessed the predictive relevance of the inner model using the Q2predict criterion [99]. Q2 was calculated through a blindfolding PLSpredict procedure and is particularly important for evaluating the predictive accuracy of endogenous constructs [98]. When running PLSpredict, we used the default choices with 10 folds and 10 repetitions, which generally offers a good trade-off between an increase in precision and runtime [99], with the assumption that the sample size is large enough [100]. Q2predict values for each indicator larger than zero indicate the acceptable predictive accuracy of the structural model [100,101]. In this study, all indicators yield Q2predict values above 0 and ranging between 0.02 and 0.28, which indicates small to medium predictive relevance, as suggested by Shmueli et al. [99]. Additionally, we assessed multicollinearity by calculating the VIF for all constructs. All VIF values were below the recommended threshold of 5, indicating that there are no significant collinearity issues among the constructs [101]. As the VIF results indicate, the model showed no signs of multicollinearity among the constructs, with the highest VIF value being below 2.5 [98]. This confirms that collinearity is not a concern in our analysis.
In the structural model (Figure 2), we analyzed both direct and indirect effects to test the relationships. This analysis involved examining the R2 value, the significance of effects using the t-value and p-value, and the effect size, using Cohen f2 for direct effects. Cohen’s f2 categorizes effect sizes as small (≥0.02), medium (≥0.15), or large (≥0.35) [102]. Additionally, grade point average (GPA) was included as a control variable in the model to account for its potential confounding effects. Next, we added design project grade (DPG) as an endogenous variable to understand the magnitude and direction of each variable’s effect when using R2 to indicate the proportion of variance explained by other variables in the model.
The results of the path analysis indicate a low influence of students’ SC-ICT on their engagement in learning (β = 0.120, Cohen’s f2 = 0.02) and no significant influence on DPG (p > 0.05). Students’ systems thinking showed a medium effect on design thinking (β = 0.460, Cohen’s f2 = 0.23), and a small effect on DPG (β = 0.275, Cohen’s f2 = 0.10), engagement (β = 0.194, Cohen’s f2 = 0.04), and SC-ICT (β = 0.175, Cohen’s f2 = 0.03). Students’ design thinking ability had a lower influence on DPG (β = 0.159, Cohen’s f2 = 0.03) and SC-ICT (β = 0.292, Cohen’s f2 = 0.08), and a medium effect on engagement (β = 0.398, Cohen’s f2 = 0.18). GPA as a control variable had moderate effects on both DPG (β = 0.347, Cohen’s f2 = 0.20) and systems thinking (β = 0.381, Cohen’s f2 = 0.17). A small effect of student engagement on DPG was detected (β = 0.167, Cohen’s f2 = 0.03).
A bootstrap procedure was used for the detection of significant direct and indirect path coefficients. Table 15 summarizes the analysis results of these significant direct and indirect effects within the model (p < 0.05).
For significant direct effects, the effect size ranged from 0.02 to 0.24 (small to moderate), and the largest effect was detected for systems thinking → design thinking. The control variable GPA significantly affected DPG and systems thinking ability (0.21 and 0.18, respectively), while no significant effects of GPA were detected for other variables in the model (p > 0.05).
The significant indirect effects shown in Table 15 reveal a small effect size according to the measure υ2, as proposed by Gaskin et al. [103], which categorizes indirect effects less than 0.01 as no effect, 0.01 to 0.04 as a small effect, 0.04 to 0.09 as a medium effect, and 0.09 and above as a large effect. When the significance of effect size (p < 0.05) is less than 0.01, Gaskin at al. [103] suggest considering the research context, the sample size, and the phenomenon in the interpretation. For a sample size of less than 400 and a new phenomenon under investigation, an effect size less than 0.01 should be considered a false negative; thus, it can be treated as small for the purposes of interpretation.
The model evaluation was carried out in several stages. Firstly, VIF values for all variables were checked, and no indication of multicollinearity was detected; since the values were less than 3, a conservative threshold proposed by Hair et al. [72]. Next, adjusted R2 values for endogenous variables ranged from 0.145 to 0.478, which can be considered as small to moderate according to the interpretation by Hair et al. [94] that R2 values of 0.75, 0.50, and 0.25 represent strong, moderate, and small effects, respectively. However, the R2 value should be interpreted in the context of research, and a value as low as 0.10 is considered satisfactory, as suggested by Hair et al. [101].
Lastly, to evaluate the predictive capability of our model, we ran a cross-validated predictive ability test, in which average loss difference values are negative using indicator averages as a prediction benchmark. The number of folds was set to six, with six repetitions. Significant predictive power was found for DPG, systems thinking, and overall (t = 4.38 and p < 0.001, t = 2.88 and p = 0.004, and t = 1.98 and p = 0.04, respectively). This means that our proposed model has lower average loss than the indicator averages, indicating significantly better predictive capability than that of the prediction benchmark [104].

3.2. HCST During Sustainable and Inclusive Design Studio Course

3.2.1. Descriptive Statistics

To examine the second research question, we hypothesized a theoretical concept of HCST which can be conceptualized through different stages. Firstly, through different types of engagement, students foster collaboration to ensure they have the diverse perspectives they need for learning [14,27]. Next, human-centeredness focuses on understanding and prioritizing the needs, experiences, and values of the people involved, ensuring that solutions are designed with their context in mind [9,12]. Lastly, systems thinking emphasizes understanding the interconnectedness of components within the system, looking at the bigger picture to identify root causes and long-term implications [18,19,39].
Since the descriptive statistics of engagement and systems thinking are reported in Table 13, hereafter we provide descriptions of human-centeredness according to the constructs validated in the methodological part (see Table 16).

3.2.2. Preprocessing and Transformation of Variables

Once we selected variables of HCST, we further preprocessed and transformed them to prepare them for clustering. We cleaned the data, addressed missing values, and eliminated outliers, while the transformation process involved normalizing and standardizing the variables so that they had consistent ranges and distributions.
Next, we used EFA with principal component analysis (PCA) as the extraction method and Oblimin rotation to reduce the number of variables while retaining the most significant features for clustering. The results of Bartlett’s test (chi-square = 1032.04, p < 0.001) and KMO value = 0.87 indicate the general feasibility of using EFA on the dataset [71]. A set of 13 variables was selected to form a three-factor solution, which explained 65.25% of variance in the model. All factor loadings were higher than 0.5, a threshold set by Tabachnick and Fidel [71].
Correlations between variables representing HCST are shown in Table 17. The three-factor solution clearly indicates the three dimensions: engagement (four variables), human-centeredness (six variables), and systems thinking ability (three variables).
The values for correlations between variables of HCST are positive, which points to a positive linear relationship between each pair of variables. This implies a consistent trend across all variable pairs, with increases in one variable being associated with increases in the others.

3.2.3. Profiles of Human-Centered Systems Thinkers

Before we began with clustering, we determined the number of clusters using different methods. In order to obtain coherent clusters which were distinct and meaningful for the purpose of the study, we first utilized hierarchical and k-means clustering. Next, we verified the number of clusters through the indices of the Akaike information criterion (AIC) and the Schwarz–Bayesian criterion (BIC) and the silhouette score as the most often used metrics in such cases [105,106]. As a first step, inspecting the dendrogram created in hierarchical clustering using Ward’s method with squared Euclidian distance indicated a two- to six-cluster solution, but changes in the agglomeration coefficient pointed to a three-cluster solution. Next, we conducted k-means and calculated the membership for two to six possible cluster solutions. Convergence for all examined clusters solutions was achieved in eight or nine iterations, indicating strong and stable structure solutions. Then, we calculated and analyzed the silhouette score to assess how well the clusters were separated. The silhouette score indicated a two-cluster solution, which would provide the most distinct groups. After exploring the clustering with the silhouette score, we evaluated the model using AIC and BIC for different numbers of clusters. Each measure pointed to a different solution or clusters to be selected (see Table 18).
The AIC is most commonly used in k-means to determine the number of clusters, but it does not perform well in applications where the sample is rather small [107]. Thus, we relied on the BIC, which takes the sample size into account, and in our case it pointed to a three-cluster solution. The silhouette index is useful in the case of compact, clearly separated, and roughly spherical clusters, as argued by Rossbroich et al. [107].
Additionally, we used one-way ANOVA with the post hoc Bonferroni test for multiple comparisons as one way to validate the k-means results. The analysis revealed that differences between clusters across the variables were significantly different for all cases (p < 0.05) for the three-factor solution, while this was not the case for the four- and five-cluster solutions. The AIC suggesting five clusters might mean that the model fit improves with more clusters, even if those clusters are not as distinct. Moreover, more clusters (such as five) might lead to over-segmentation, making the solution harder to interpret and use [105]. After considering the results of k-means, three architecture student groups with distinct and strong profiles were identified and labeled as follows: (1) high human-centered systems thinker (HSCT) (n = 76), (2) low human-centered systems thinker (n = 44), and (3) average human-centered systems thinker (n = 88). A three-cluster solution, as a reasonable middle ground, can present a balance between the model fit and simplicity [105,106]. The standardized mean scores for the clustering variables by group are presented in Figure 3.
The higher HCST profile included 36.54% of students who showed higher aesthetic engagement and ability for critical and creative thinking. The low HCST profile was the smallest, with 21.15% of students, and these students reported much lower empathy, holistic views, problems reframing ability, and an ability to understand multiple possible causations and variations of different types in systems. It seems they invested less interest and time in learning in the design studio. Finally, the average HCST profile included the largest group of students, 42.31%, and to optimize learning, they engaged cognitively and were more empathetic when designing.
Additionally, using cross-tabs, we examined the composition of HCST profile clusters based on the universities the students were attending. Cross-tab analysis indicated that there was no significant correlation between the cluster membership and university of enrolled students (chi-square = 3.82, p = 0.43 > 0.05, Cramer’s V = 0.10) (see Figure 4).

3.3. HCST Profiles in Relation to Students’ ICT Self-Concept and Perceived Design Thinking Ability and Their GPA

To examine the impact of HCST profiles on students’ self-reported level of ICT proficiency and design thinking, MANOVA was conducted. The results of MANOVA show significant differences in the HCST profiles in terms of self-concept related to ICT and design thinking (Pillai’s trace = 0.93; F (24, 390) = 14.18; p < 0.001; partial η2 = 0.465). Levene’s test of the equality of error variances revealed that across all dependent variables, the homogeneity assumption is satisfied (p > 0.05). The effect of cluster membership on ICT self-concept and design thinking ability is significant for all dependent variables (see Table 19). The significance level was set at 0.05 for all analyses.
Regarding students’ self-concept related to ICT, the findings show significant differences for all variables, with effect sizes ranging from small to medium (0.048 to 0.158), according to Cohen et al. [96]. Post hoc comparisons of variables according to cluster membership revealed that HCST significantly (p < 0.05) affects competency for digital content generation and analysis and reflection using ICT. Students in the high HCST cluster had higher perceived collaboration and communication using ICT compared to low and average HCST clusters. The level of general data and information literacy for average and low HCST profiles is similar (mean difference = 0.23, p = 0.78), while high HCST affects data and information literacy for both low and average HCST profiles (p < 0.05). The level of safe and secure use of digital systems in problem solving differs between high and low HCST profiles (p < 0.05). Moreover, students with an average HCST profile demonstrated similar levels of ICT self-concept related to safety and security as students with a low HCST profile (mean difference = 0.46, p = 0.07) and a high HCST profile (mean difference = 0.21, p = 0.74).
Regarding students’ design thinking ability, the findings show significant differences (p < 0.05) for all variables, with effect sizes ranging from small to large (0.051 to 0.502). Students in the high HCST cluster had a higher perception of design thinking and more experience than their counterparts in the low and average HCST clusters. Post hoc comparisons revealed that self-reported levels of design thinking differed significantly (p < 0.05) across cluster profiles, except for the variable DT-RISK. Self-reported ability to embrace risk in design learning activities was similar for high and average HCST (mean difference = 0.39, p = 0.053, >0.05). This implies that the difference might be significant, but it is right on the edge, so it is not quite conclusive. Next, the mean difference in self-reported risk-embracing ability between students with average HCST and low HCST is 0.23, with a p-value of 0.67, suggesting that this difference is not statistically significant.
Cluster differences were also detected as significant in terms of GPA (p < 0.01). The post hoc test revealed that students in the high HCST cluster outperformed their counterparts in the low and average HCST clusters. Moreover, it seems that the GPA of students in the low and average HCST clusters was similar (mean difference = 0.12, p = 0.99).

3.4. Predicting High HCST Based on Prior Knowledge, Intrinsic Motivation, and Risk Propensity

For the predictive study, we first provide descriptive statistics and 95% confidence intervals for the measures involved in the study (see Table 20). The mean values for the motivation subscales are relatively high, indicating a generally strong motivation among the students, with negative skewness values suggesting that the scores are slightly skewed to the left, meaning more students scored higher on these scales. The average score for risk propensity is just about at the midpoint of the scale, ranging from 1 to 6.
To investigate the extent to which perceived motivation, risk propensity, and GPA predicted group membership during the sustainable and inclusive design studio course, MLR analyses were carried out on the HCST profile variable as a reference category (see Table 21).
The overall evaluation of the model shows a good fit, since the chi-square values for both Pearson and deviance were not significant (444.50, p = 0.07; 296.37, p = 1.00) with 400 degrees of freedom. The pseudo R2 values (Cox and Snell, Nagelkerke, and McFadden), which are approximations of how much variation in the outcome is explained by the model, were calculated (0.50, 0.57, and 0.328, respectively). The pseudo R-square values indicate that the model has moderate to excellent explanatory power, with Nagelkerke’s R-square indicating a reasonably high level of explanation of variance (57%) and McFadden’s R-square values between 0.2 and 0.4, indicating an excellent fit [108]. An evaluation of the classification table revealed that 68.8% of students were classified correctly.
The results in Table 21 mainly confirm our expectation that students with a higher GPA and higher intrinsic motivation would have a high HCST profile, but we cannot argue for all types of intrinsic motivation. Students who have higher intrinsic motivation to accomplish things, are forward-thinking, and actively pursue objectives were in the high HCST cluster compared to the low HCST cluster (p = 0.036), but we cannot argue that students in the average HCST cluster had a lower perception of proactivity motivation than high HCST cluster students (p = 0.12, >0.05). The next important finding yielded by this study concerns the role of risk propensity in HCST. It seems that risk propensity, which can play a role in decision-making, innovation, and creativity [49,85,109], might not be inherent in highly capable human-centered systems thinkers (p > 0.05) because of the need for user-centered, evidence-based, ethical, and sustainable design solutions [9,110]. Based on the results in Table 21, we cannot argue that high HCST students have a higher perceived level of risk propensity compared to low and average HCST students (p = 0.710 and p = 0.218, respectively). These students might prioritize careful, informed decision-making to ensure that their designs effectively meet user needs without introducing unnecessary risk [38,48].
To highlight the significant differences across the HCST profiles, Table 22 summarizes the main findings from analyses of students’ ICT self-concept, design thinking abilities, GPA, intrinsic motivation, and risk propensity. This table showcases how students with high HCST profiles generally report greater self-concept in ICT skills, particularly in collaboration, communication, and problem-solving. High HCST students also exhibit stronger design thinking skills across nearly all facets, alongside higher GPAs, as compared to their low and average HCST counterparts. Notably, intrinsic motivation plays a significant role in differentiating high HCST profiles, with high levels across all subscales. However, risk propensity does not emerge as a significant distinguishing factor among HCST groups, suggesting that high HCST students may prioritize careful and informed decision-making over risk-taking tendencies.
Table 22 provides a concise view of the significant findings from the Table 19 and Table 21, focusing on which constructs show notable differences among HCST profiles and the associated statistical details.
The results of this study indicate that students with high HCST profiles demonstrate advanced digital competencies, engagement, and empathy, aligning with theoretical frameworks that emphasize systems thinking as an enabler of holistic understanding and creative problem-solving [7,17,27]. Systems thinking theory posits that individuals who can identify interconnections within complex systems are better equipped to address multifaceted challenges [12,18], a critical skill in sustainable and inclusive design [45,47]. The findings support this by showing that high HCST students have a better grasp of interconnected design elements and demonstrate heightened awareness of users’ diverse needs.
Furthermore, the study reinforces design education theories that advocate for human-centered, iterative, and reflective practices in learning environments. Students with high HCST profiles align with design thinking models, which emphasize empathy, collaboration, and experimentation [41,44]. This profile’s characteristics confirm that embedding systems thinking within the curriculum does not only enhance students’ technical skills but also fosters empathy-driven design, a critical component in user-centered theories, as argued by Davis et al. [45]. By quantifying students’ HCST capabilities, the study provides empirical backing for theories that propose integrated systems and design thinking approaches in education as foundational for producing resilient and adaptive designers [46]. This contribution highlights the potential for HCST-based curricula to bridge theoretical and practical gaps in architectural education, preparing students for complex real-world scenarios.

4. Discussion

4.1. Students’ Systems and Design Thinking in Relation to Their ICT Self-Concept and Engagement in Learning

The first aim of the study was to examine the relationships between educational practices, architecture students’ characteristics, and outcomes. Therefore, we looked at the connections between the main dimensions of systems and design thinking as educational approaches adopted in the design course, ICT self-concept and engagement in learning, and design project grade as the outcome of the inclusive and sustainable design course. Prior knowledge in terms of GPA was used as a control variable, since it helps to account for variations in academic performance, which can be influenced by a range of factors, including the rigor of the curriculum, grading standards, and the overall academic environment at the institution. The results reveal a moderate to strong correlation between how architecture students perceived themselves as systems thinkers and all the other dimensions. It seems that the weakest, but significant, correlation between systems thinking and ICT self-concept and engagement is composed only of behavioral, cognitive, and aesthetic engagement as the most influential in the model, confirming the findings reported by Avsec et al. [41] and Blokland and Reniers [49]. Moreover, digital literacy and technology use can be influenced by one’s systems thinking ability and vice versa in terms of using digital technologies not just for application but also for reshaping mindsets and strategies to fit the context of use, confirming the findings of Habbal et al. [110]. Systems thinking together with digital systems may, directly and indirectly through design thinking, affect engagement in sustainable and inclusive education, which is aligned with a study by Green et al. [38]. Systems thinking also mediates the relationship between GPA and DPG, design thinking, and engagement, further contributing to understanding future design thinking [17,27].
A positive and strong correlation was also found between students’ design thinking and engagement and their ICT self-concept. It seems that systems thinking, as the strongest predictor of design thinking, may further develop the design cognition needed for higher engagement in the design course, in which digital competencies for problem solving, content generation, and analysis and reflection are utilized [12,30,41]. Systems thinking increases students’ design thinking, which affects their engagement, leading to students feeling more competent to apply inclusive, sustainable, and interdisciplinary design practices, confirming the findings of Shrier et al. [23] and Peng et al. [111].
Investigating the components of systems thinking, students indicated that they felt they were better at understanding sequences of events and causal sequences, and multiple causations and variations of different types, but had less understanding of interrelations of factors, patterns of relationships, and feedback behavior. It seems that understanding feedback behavior can be a critical point of systems thinking to enhance sustainable education, confirming the results of studies by Avsec et al. [41], Green et al. [38], Marcos-Sanchez et al. [112], and Pohl et al. [27].
We did not find direct support for digital competency predicting DPG, which might be attributed to an overemphasis on technology over creativity, a loss of conceptual understanding, reduced collaboration, and an over-reliance on digital tools, which can hinder effective communication and integration with non-digital aspects of a project, pointing to a lack of absorptive capacity and confirming the findings of Kasteli et al. [113] and de Vasconcellos et al. [114]. Thus, reinforcing student engagement through teacher–student co-agency may be an effective way to foster architecture students’ digital capabilities and prepare them for the increasingly digital and artificial intelligence enhanced learning environment [115]. Although there are no prior studies with a similar design, the results are in line with those of a study by Ibrahim and Aldawsari [116], in which digital self-efficacy was found to be a mediator enabling students to obtain access to unlimited educational resources and enhance their interactions in the learning environment [116]. There should also be other reasons, such as digital systems offering many preset templates and solutions that can lead to uniformity in design, digital competency not always equating to understanding user needs, and designers with advanced digital skills being tempted to use all the features available in a software program, leading to overly complex designs [117,118]. As argued by Vidergor [119], perceived ease of use will not always result in adoption of technology due to factors of motivation or peer influence around adopting ICT, which may not necessarily change their personal feelings toward the technology.

4.2. HCST During Sustainable and Inclusive Design Studio Course

Our results reveal three distinct HCST profiles. Slightly over one-third of the students belonged to the high HCST group and were, accordingly, highly engaged with their work and perceived high levels of human-centeredness and systems thinking. On the contrary, low HCST students were less engaged in design practices, perceived low human-centeredness in design tasks, and were not so confident in their systems thinking ability. These students represented just above one-fifth of the sample. The largest HCST profile group represented 42.31% of the sample in the study, and their perception of and experience with engagement, human-centeredness, and systems thinking was between high and low HCST. These HCST profiles illustrate how systems thinking, when integrated into design education, shapes student engagement, empathy, and design cognition.
To our knowledge, this study is the first of its kind, and no previous studies on latent or clustered HCST profiles exist, thus we can discuss HCST profiles partially according to and across their constructs. Since the human-centeredness constructs are derived from design thinking, we can compare these constructs to those of design thinking. Our study reveals that the strongest indicators of high HCST are critical and creative thinking, collaboration and diverse perspectives, and a holistic view of problem reframing, confirming the findings of Avsec [46], who reported that those constructs are the most influential in design thinking cluster formation. User involvement and empathy were perceived as lower among both low and high HCST students compared to other human-centeredness constructs. This is partly aligned with the study of Avsec [46], which found that user involvement was also perceived as low in all clusters, together with embracing risk and creative confidence. Highly engaged students showed high levels of engagement in every other subscale, with the highest peak in aesthetic engagement, while those with low engagement had the highest peak in emotional engagement. It seems that the low HCST profile group had low levels of cognitive–motivational engagement, which might further lead to lower human-centeredness and performance, confirming the findings of Li and Zhu [55]. It seems that highly engaged, self-effective, and motivated students had higher scores on human-centeredness and systems thinking constructs, which could lead to better performance in technology-enhanced design, thus promoting sustainable development, confirming the results of studies by Peng et al. [111], Selina and Schwemmle [15], Melles at al. [24], and Dragičević et al. [16]. Systems thinking constructs for the high HCST profile are almost evenly developed, with high scores, while the low HCST profile has a visible decline in STF3, which is an understanding of multiple concepts and variations of different types. It seems that this construct might be decisive in understanding the complexity and interconnectedness of systems in the real world. Students who are more able to capture the complexity, diversity, and dynamic nature of systems will be more effective at analysis, decision-making, and problem-solving, especially in an environment characterized by complexity and change. Similar findings were also reported by Green et al. [38], Avsec et al. [41], Talley and Hull [35], and Habbal et al. [110].
High HCST students, for instance, exhibit a greater ability to perceive complex interconnections, suggesting that robust systems thinking training enhances holistic understanding in design contexts. This finding aligns with systems thinking theories that argue for the importance of feedback loops and causal reasoning as being foundational to understanding sustainability challenges [41,42,44,49]. The fact that high HCST students display increased digital competence and cognitive engagement further supports theories emphasizing that technology integration fosters adaptability and resilience within complex systems [34,37]. These competencies enable students to navigate the dynamic feedback processes intrinsic to sustainable design, reinforcing theories that advocate for systems-based learning models in complex fields, like architecture [41].
From a sustainable design education perspective, HCST profiles confirm the importance of embedding human-centered approaches in curriculum development, as students with high HCST scores demonstrated strong empathy and a user-centered mindset [27,35]. This insight advances design education theories by illustrating that systems thinking, coupled with empathy-driven practices, can nurture a mindset geared toward inclusive, adaptive, and sustainable design [12,43,54]. Additionally, the average HCST profile highlights the transitional nature of students who are developing, yet not fully integrating, systems and design thinking skills [28]. This finding points to a need for iterative and scaffolded curriculum structures, a contribution that informs educational models promoting gradual competency development [41]. The presence of a low HCST group, in contrast, underscores challenges in reaching students less inclined toward systems-based approaches, calling for differentiated instructional methods that reinforce fundamental systems thinking principles [38]. These profiles collectively underscore the theoretical importance of HCST as a bridge between sustainability and design education, suggesting that HCST-focused curricula could catalyze meaningful advancements in sustainable design practices and theory as argued by Choi et al. [39].
Further, the cross-tab analysis indicated that cluster membership is not associated with the specific university where students are enrolled. This lack of an association strengthens the validity and robustness of HCST clusters, as it suggests that the clustering is not influenced by the particular university but reflects broader, more generalizable patterns. Thus, as an approach, it has potential for use in different educational settings in order to revolutionize Industry 5.0, confirming and supporting the endeavors of several authors [13,17,18,19,26,27,63,110] toward developing a universal, integrated human-centered approach to achieve sustainable and resilient systems, especially for employees [2].

4.3. HCST Profiles in Relation to Students’ ICT Self-Concept and Perceived Design Thinking Ability and Their GPA

Consistent with our third hypothesis, the three student HCST profiles differed in all five dimensions of ICT self-concept. Highly engaged HCST students had better data and information literacy, collaborated more, generated more digital content and used ICT more for analysis, were better able to use ICT safely and securely, and used ICT more for problem solving in the sustainable and inclusive design course compared to low HCST students, supporting the association between high perceived HCST and high self-concept related to ICT. It appears that highly capable HCST students have effectively utilized digital twins in the design studio to foster deeper integration between cyberspace and physical space, accelerating the convergence of the physical and digital worlds, as confirmed by the findings of Barat and Kayser [20]. By leveraging ICT for monitoring, control, and decision-making, more accurate mapping and tracking of product or system lifecycles can be achieved. This enhanced connectivity seems to improve the understanding of dynamic changes, enabling continuous optimization and refinement throughout the lifecycle, as argued by Barat and Kayser [20]. At the same time, low and average HCST students only differed in self-concepts related to communication and collaboration, content generation, and the use of ICT for analysis and reflection. This might indicate an association between increased HCST and increased digital competency, especially with regard to collaboration and communication, content generation, analysis, and reflection using ICT. These results support previous research findings suggesting that the profiles of students with a higher self-concept in terms of ICT are more likely to reflect higher levels of engagement, human-centeredness, and systems thinking [24,39,41,60,62,119,120].
The same analysis was performed across design thinking constructs, showing that the high HCST profile differed from the low and average HCST profiles. Highly engaged HCST students had more creativity, were more oriented toward learning, had more empathy, embraced risk, collaborated more and had diverse perspectives, and learned more by completing the in sustainable and inclusive design course compared to low and average HCST students, supporting the association between high HCST and high perceived design thinking ability. This result supports the findings of previous studies suggesting that highly competent designers who are highly engaged, human-centered, and have strong systems thinking are needed for effective human-centered design [9,12,14,16,27,63].
The analysis of the relationship between cluster membership and GPA revealed that the high HCST cluster differed significantly from the low and average HCST clusters, while the average and low clusters were not distinctive. It seems that students in the high HCST cluster may possess superior cognitive abilities, social skills, or both. These traits likely enable them to better understand and process academic material, leading to higher academic performance, which aligns with findings from previous studies [13,23,111,121]. Similar GPAs in the low and average HCST clusters might be attributed to some background or systemic factors. Since the GPAs are generally high in the sample, there might be a ceiling effect where differences between low and average HCST students are not apparent because both groups are clustered near the upper end of the GPA scale. Perhaps students in the low HCST cluster might be compensating for their lower cognitive and social abilities through other means, such as by using additional study time, being tutored, or having a strong support system [111].

4.4. Predicting High HCST Based on Prior Knowledge, Intrinsic Motivation, and Risk Propensity

In our study, we also observed higher levels of HCST among architecture students and investigated the extent to which intrinsic motivation, risk propensity, and GPA would predict group membership during the inclusive and sustainable design course. An important finding of this study is that students not engaged in HCST reported lower perceived intrinsic motivation than highly engaged or moderately engaged students. This is valid for intrinsic motivation to accomplish things to make a difference, to experience stimulation, involve hands-on activities, allow for deep immersion in the content, and for intrinsic motivation to know. This finding may reflect that perceived learning motivation, and motivation to make a difference and experience simulation, promote higher HCST engagement in the study, which is in line with previous studies [15,16,33], since understanding motivation is essential to influencing behaviors through design [111]. It was interesting that perceived proactive motivation, which is a general strength of HCST [14,64], did not seem to play a role for intrinsically motivated students with average HCST engagement. It seems that proactive motivation has predictive power only when comparing high and low HCST, while there is no predictive power when comparing low and average HCST. Similarly, Sanders et al. [14] found that enhanced human-centeredness does not necessarily translate to increased self-confidence or motivation in design. It seems that more proactivity in design can lead to heightened awareness of the complexity of the design, which can result in HCST uncertainty and reduced confidence [14]. Moreover, proactivity in HCST can fail due to overemphasizing personal assumptions, rushing the design process, being resistant to change, neglecting contextual factors, and putting pressure on team dynamics, leading to less collaborative and inclusive design outcomes [54,64,110].
Students with greater prior knowledge are more likely to be in the high HCST cluster and to be more highly motivated. When comparing the high and low HCST clusters, there is a weak argument for predictive value (p = 0.029). We suspect that GPA is less predictive when comparing low and high HCST profiles because the cognitive skills that GPA typically measures do not align well with the metacognitive and holistic thinking required for HCST. Perhaps individuals with low HCST rely more heavily on linear, straightforward thinking and struggle with complex systems or situations requiring empathy and holistic understanding. This finding is, to a large extent, supported by the findings of Kavousi et al. [88], Gero and Milovanovic [12], and Boy [9].
An important finding of this study is that risk propensity did not significantly predict HCST group membership for the sustainable and inclusive design course (p > 0.05). Thus, we cannot argue that the best risk-takers are highly engaged and intrinsically motivated students with high HCST. Since risk propensity is a rather individual characteristic and not situational [122], and it is also part of self-esteem and a perceived need for achievement [123], it might be that students with high risk propensity prioritize speed, innovation, or aggressive goals, and might overlook critical human factors, such as safety, user experience, and wellbeing [48,49]. Moreover, it could be that risk-takers might underestimate the importance of involving diverse stakeholders in the decision-making process [124] or fail to consider the long-term consequences of their actions on the system as a whole when designing [89]. Since systems thinking requires an appreciation of the interdependencies within a system, a high risk propensity might lead to decisions that ignore these interdependencies, resulting in solutions that address one problem but create new issues elsewhere or even reduce the resilience of the system [122].
On the other hand, high HCST students tend to engage in more complex, holistic thinking, and their broader perspective might lead them to make decisions that are less influenced by their inherent risk propensity and more by their nuanced understanding of the system [48]. It seems that high HCST students are more adaptive and responsive to feedback from the system they are operating within [14], that they have heightened system awareness and better cognitive and emotional regulation, and that they can recognize and mitigate cognitive biases, including those related to risk perception [9,110,111]. In contrast, low or average HCST individuals might rely more on their inherent risk propensity because they lack the same depth of systems thinking, ethical consideration, or adaptive capability. This reliance could make risk propensity a predictor of their decision-making behavior [35,38].

4.5. Limitations of the Study and Future Research

The present study has some limitations and offers directions for future studies. The results presented in this paper are based on inclusive and sustainable design courses carried out in the Polish setting, positioning it in a specific educational context with its own opportunities and constraints. As the sample only comes from three universities in one country, it may not represent the entire spectrum of architectural education worldwide. More research is, thus, needed in order to make generalizable claims.
Many factors play a role in the course setting, and in this study, for instance, student and teacher demographics were not considered, including gender effects, teacher experiences, attitudes, etc. Despite the number of factors for success in the final design project revealed by this study, empirical research is still needed to yield new findings for theory building.
The present study used both variable- and person-centered approaches. Using a variable-centered approach, we investigated design and systems thinking, ICT self-concept and engagement, and their relationships, controlled with GPA and based on a literature review. These relationships indicate a need for further studies adding direct or indirect variables connected to existing variables—for example, using flow theory when investigating the optimal experience with ICT, adding motivation, goal orientation, and self-efficacy, and splitting HCST skills based on taxonomy to understand how each level impacts self-efficacy and technology-enhanced design practices.
The variables were measured using self-report metrics, which appear to be rather subjective. Thus, some tests and observations of design practices are needed in future studies—for example, digital competency and systems thinking tests.
Using a person-centered approach, we mapped students for cluster analysis only once; thus, an investigation of the stability of and changes in the HCST dimensions is lacking. Additional research into the developmental dynamics of HCST dimensions and clusters is advised.
The limitations of a cross-sectional study, especially in the context of exploring HCST in architecture education, might include the following: (1) Lack of developmental insight. The cross-sectional nature of this study provides a single time-point analysis of HCST profiles, which limits insights into how these profiles evolve over time. A longitudinal approach could reveal how students’ thinking changes, improves, or regresses due to various educational interventions or experiences. (2) Inability to identify causal relationships. While cross-sectional studies can identify associations, they cannot establish causality. (2) Susceptibility to cohort effects. The study’s findings might reflect characteristics specific to the sample group at the time of data collection, which may not be generalizable over time. In architecture education, for example, changing trends or pedagogical styles might mean that today’s students have different HCST profiles than those in future cohorts. (3) Temporal context limitations. Cross-sectional studies capture data at one specific point in time, which means they may miss out on external factors or trends that could influence the development of HCST. Longitudinal studies could better account for shifts in educational policies, technological advancements, or societal attitudes toward sustainability and inclusivity. (4) Difficulty in tracking individual growth. Cross-sectional studies do not allow for the examination of individual developmental trajectories. Without following students over time, it is challenging to assess how each individual’s HCST profile might mature and what specific factors (such as courses, internships, or projects) contribute to their personal development.
Finally, considering types of motivation, only intrinsically motivated behaviors were investigated as possible predictors of high HCST, while extrinsic motivations, such as support or motivational intervention and amotivation, were not studied, and these might be included in future research. Similarly, risk propensity was investigated in terms of personal characteristics, while context- or domain-specific factors were not covered. Thus, studies on the specifics in the context of architecture design education would also be of value to the HCST field.

5. Conclusions and Implications of the Current Findings

To address the purpose of this study, we first examined the relationships between educational practices, architecture students’ characteristics, and outcomes, and then identified and explored distinct HCST profiles and the stability of and changes in the students’ profiles during engagement in technology-enhanced inclusive and sustainable design-based learning.
The study showed that when students feel that they are competent systems thinkers, they are better design thinkers, have higher digital competency, and are more engaged in human-centered design activities. Increased engagement can be developed by optimizing the experience with digital systems, being more empathic, and engaging in creative and learning-oriented design thinking activities when collaboration and learning by doing are emphasized. Feedback behavior was found to be crucial to making changes in the system. Teachers should pay attention to feedback mechanisms when students (re)design systems through different learning loops, using different means, such as technology-enhanced graphic organizers, in order to give students more opportunities to identify early signs of progress.
There are some practical implications of the results of the current study. They may be beneficial for researchers and educational leaders planning inclusive and sustainable design courses for students in a technology-enhanced learning environment. The results would also be beneficial for practitioners in the fields of urban planning and development, residential architecture, and the design of workplaces, healthcare facilities, and educational and social centers to create architectural designs that are both inclusive and sustainable, ensuring that spaces are accessible, resilient, and environmentally responsible.
To develop practical implications for a curriculum in architectural education that effectively integrates HCST, several concrete recommendations can be made. Firstly, educators should design curricula that emphasize project-based and experiential learning, allowing students to engage directly with sustainable and inclusive design challenges. For example, incorporating simulation workshops where students experience accessibility barriers firsthand can deepen empathy and understanding, as noted in the study’s findings. Furthermore, integrating systems thinking methodologies, such as causal mapping and feedback loops, can be beneficial. This approach helps students recognize the interconnected nature of design elements, preparing them to create sustainable and adaptable structures. Encouraging cross-disciplinary collaboration is also crucial; architectural students should work with peers in relevant fields, like sociology, engineering, environmental studies, and urban planning, to address complex, real-world issues holistically. Policymakers, on the other hand, can support these educational shifts by incentivizing programs that prioritize inclusive, human-centered design and by fostering partnerships between educational institutions and industry. Adjusting assessment methods to evaluate students’ integration of systems thinking, supporting these initiatives through policy and resources, partnering with industry and community organizations, promoting research and innovation, and incorporating global and cultural perspectives will further solidify the adoption of HCST in architectural education programs.
Highly engaged and intrinsically motivated human-centered systems thinkers are a crucial part of effective inclusive and sustainable architecture design education. The findings show that 21% of students are characterized by low HCST, while 36% have high levels of engagement, human-centeredness, and systems thinking. Thus, it would be important to recognize low HCST students at the outset and support their design activities from the very first phase in order to bring a humanized vision to systems thinking, followed by activities that involve visualizing systems using mapping tools. Moreover, instructors should offer support to understand the feedback behavior of those students who are either seeking or not seeking help. In addition, the study also shows the importance of the effect of cluster membership on ICT self-concept and design thinking. For effective inclusive and sustainable design, highly competent design thinkers are needed, who are highly engaged, digitally competent, and human-centered and have high systems thinking. Moreover, high HCST students in the design studio effectively utilized the digital twins as a key enabler for both Industry 5.0 and Society 5.0.
Our findings also suggest that both a sense of intrinsic motivation and state-of-the art cognitive development play important roles in how students experience their HCST during inclusive and sustainable design courses. Still, the role of risk propensity in HCST becomes less clear or is even undefined, pointing to the complexity and adaptability of HCST decision-making processes, which are not easily captured by simple metrics, like risk propensity. Risk propensity may still influence decisions, but in a way that is not straightforward or predictable, making it difficult to define its role precisely within the context of HCST in inclusive and sustainable architecture design education.
In conclusion, this study reveals that HCST plays a critical role in fostering sustainable and inclusive design practices among architecture students, particularly by enhancing digital competencies, engagement, and design thinking skills. Key findings indicate that students with higher HCST profiles not only demonstrate greater proficiency in technology-enhanced design but also possess stronger intrinsic motivation and empathy, critical for future-forward, human-centered design. However, these results may vary in different educational or cultural contexts. For instance, institutions with limited access to digital resources may find it challenging to implement the same level of HCST integration, potentially impacting students’ digital competency development. Additionally, cultural differences in design philosophy—such as collectivist versus individualist approaches—could affect the emphasis placed on user involvement and empathy, core elements of HCST.
The study also has limitations, including its cross-sectional design and reliance on self-reported data, which may not fully capture the evolving nature of HCST skills over time or their application in diverse settings. Future research could adopt a longitudinal approach to track changes in HCST development and investigate its impact on professional practice post-graduation. Comparative studies across various cultural and educational frameworks would also be valuable, exploring how different curriculum structures and cultural values influence students’ approach to human-centered and systems thinking. Finally, examining the role of extrinsic motivators, such as institutional support and industry partnerships, could reveal additional pathways to strengthen HCST within architectural education.

Supplementary Materials

The following supporting information can be downloaded at: https://www.mdpi.com/article/10.3390/su16229802/s1, Students’ HCST Survey.

Author Contributions

Conceptualization, S.A., M.J.-K. and A.Ż.; methodology, S.A.; validation, S.A., M.J.-K. and A.Ż.; formal analysis, S.A.; investigation, S.A., M.J.-K., A.Ż., A.G. and J.G.-M.; resources, S.A., M.J.-K., A.Ż., A.G. and J.G.-M.; data curation, S.A.; writing—original draft preparation, S.A.; writing—review and editing, S.A., M.J.-K., A.Ż., A.G. and J.G.-M.; visualization, S.A.; supervision, S.A. and M.J.-K.; project administration, S.A., M.J.-K., A.Ż., A.G. and J.G.-M.; funding acquisition, S.A. All authors have read and agreed to the published version of the manuscript.

Funding

The authors acknowledge the financial support of the Slovenian Research Agency under the research core funding Strategies for Education for Sustainable Development applying Innovative Student-Centered Educational Approaches (ID: P5-0451) and under the project Developing the Twenty-first-century Skills Needed for Sustainable Development and Quality Education in the Era of Rapid Technology-Enhanced Changes in the Economic, Social and Natural Environment (Grant no. J5-4573), also funded by the Slovenian Research Agency.

Institutional Review Board Statement

The study was conducted in accordance with the Declaration of Helsinki and with the ethical principles and integrity in research of all three universities involved in the study and the Polish National Board on Research Integrity ENRIO. The study was approved by all three universities’ corresponding bodies, namely on behalf of Cracow University of Technology by the vice-rector for research, by the Ethics Committee of Poznan University of Technology, and by the Department of Architecture of Kielce University of Technology. All ethical statements are available upon request from the corresponding author.

Informed Consent Statement

Informed consent was obtained from all subjects involved in the study.

Data Availability Statement

The data presented in this study are available on request from the author. The data are not publicly available due to privacy issues.

Conflicts of Interest

The authors declare no conflicts of interest. The funders had no role in the design of the study; in the collection, analyses, or interpretation of data; in the writing of the manuscript; or in the decision to publish the results.

Appendix A

Figure A1. Architecture design course in the Laboratory of Universal Design and Transformation of the Built Environment at the Department of Architectural and Urban Theory and Design (DAUTD) at Kielce University of Technology (KUT), Poland. Joanna Gil-Mastalerczyk’s personal archive.
Sustainability 16 09802 g0a1
Figure A2. Presentation of the second project task. Joanna Gil-Mastalerczyk’s personal archive.
Sustainability 16 09802 g0a2
Figure A3. Conceptual design of an urban interior and design of an object adapted to the needs of people with disabilities, by project author Maja Brodawka. Joanna Gil-Mastalerczyk’s personal archive.
Sustainability 16 09802 g0a3

References

  1. Barata, J.; Kayser, I. Industry 5.0—Past, Present, and Near Future. Proc. Comput. Sci. 2023, 219, 778–788. [Google Scholar] [CrossRef]
  2. Alves, J.; Lima, T.M.; Gaspar, P.D. Is Industry 5.0 a Human-Centred Approach? A Systematic Review. Processes 2023, 11, 193. [Google Scholar] [CrossRef]
  3. Adel, A. Future of industry 5.0 in society: Human-centric solutions, challenges and prospective research areas. J. Cloud Comput. 2022, 11, 40. [Google Scholar] [CrossRef] [PubMed]
  4. De Felice, F.; Petrillo, A. Digital Effects, Strategies, and Industry 5.0, 1st ed.; CRC Press: Boca Raton, FL, USA, 2024. [Google Scholar] [CrossRef]
  5. Zallio, M.; Clarkson, P.J. Inclusion, diversity, equity and accessibility in the built environment: A study of architectural design practice. Build. Environ. 2021, 206, 108352. [Google Scholar] [CrossRef]
  6. IDEO. Available online: https://www.ideou.com/products/human-centered-systems-thinking (accessed on 18 August 2024).
  7. Cabrera, D.; Cabrera, L. What Is Systems Thinking? In Learning, Design, and Technology; Spector, M., Lockee, B., Childress, M., Eds.; Springer: Cham, Switzerland, 2019. [Google Scholar] [CrossRef]
  8. Hynes, W.; Lees, M.; Müller, J. Systemic Thinking for Policy Making: The Potential of Systems Analysis for Addressing Global Policy Challenges in the 21st Century, New Approaches to Economic Challenges; OECD Publishing: Paris, France, 2020. [Google Scholar] [CrossRef]
  9. Boy, G.A. Human-centered design of complex systems: An experience-based approach. Des. Sci. 2017, 3, e8. [Google Scholar] [CrossRef]
  10. Grau, S.L.; Rockett, T. Creating Student-centred Experiences: Using Design Thinking to Create Student Engagement. J. Entrepreneurship 2022, 31, S135–S159. [Google Scholar] [CrossRef]
  11. Lindgaard, K.; Wesselius, H. Once More, with Feeling: Design Thinking and Embodied Cognition. She Ji J. Des. Econ. Innov. 2018, 3, 83–92. [Google Scholar] [CrossRef]
  12. Gero, J.S.; Milovanovic, J. A framework for studying design thinking through measuring designers’ minds, bodies and brains. Des. Sci. 2020, 6, e19. [Google Scholar] [CrossRef]
  13. Dehbozorgi, M.H.; Postell, J.; Ward, D.; Leardi, C.; Sullivan, B.; Rossi, M. Human in the loop: Revolutionizing industry 5.0 with design thinking and systems thinking. Proc. Des. Soc. 2024, 4, 245–254. [Google Scholar] [CrossRef]
  14. Sanders, E.A.; Goldstein, M.H.; Hess, J.L. Course experiences that promote and inhibit human-centered design. Int. J. Technol. Des. Educ. 2024, 34, 783–808. [Google Scholar] [CrossRef]
  15. Mayer, S.; Schwemmle, M. Teaching university students through technology-mediated experiential learning: Educators’ perspectives and roles. Comput. Educ. 2023, 207, 104923. [Google Scholar] [CrossRef]
  16. Dragičević, N.; Vladova, G.; Ullrich, A. Design thinking capabilities in the digital world: A bibliometric analysis of emerging trends. Front. Educ. 2023, 7, 1012478. [Google Scholar] [CrossRef]
  17. Mononen, L. Systems thinking and its contribution to understanding future designer thinking. Des. J. 2017, 20, S4529–S4538. [Google Scholar] [CrossRef]
  18. Spain, S. Systems Thinking applied to curriculum and pedagogy: A review of the literature. Curric. Perspect. 2019, 39, 135–145. [Google Scholar] [CrossRef]
  19. Williams, A.E. Human-Centric Functional Modeling and the Unification of Systems Thinking Approaches. J. Syst. Think. 2021, 8. [Google Scholar] [CrossRef]
  20. Barata, J.; Kayser, I. How will the digital twin shape the future of industry 5.0? Technovation 2024, 134, 103025. [Google Scholar] [CrossRef]
  21. Datey, A. Decolonising the design curriculum: Making “sustainability” accessible, understandable and practicable to second-year undergraduate architecture students. Archnet-IJAR 2023, 17, 496–517. [Google Scholar] [CrossRef]
  22. Links, M.; Martin, P.; Morgan, M. A Systems-Thinking and Person-Centred Approach to Healthcare Communication. Aust. J. Clin. Educ. 2023, 12, 115–129. [Google Scholar] [CrossRef]
  23. Shrier, L.A.; Burke, P.J.; Jonestrask, C.; Katz-Wise, S.L. Applying systems thinking and human-centered design to development of intervention implementation strategies: An example from adolescent health research. J. Public. Health Res. 2020, 9, 1746. [Google Scholar] [CrossRef]
  24. Melles, M.; Albayrak, A.; Goossens, R. Innovating health care: Key characteristics of human-centered design. Int. J. Qual. Health Care 2021, 33, 37–44. [Google Scholar] [CrossRef]
  25. Leary, M.; Cacchione, P.Z.; Demiris, G.; Carthon, J.M.B.; Bauermeister, J.A. An integrative review of human-centered design and design thinking for the creation of health interventions. Nurs. Forum. 2022, 57, 1137–1152. [Google Scholar] [CrossRef] [PubMed]
  26. Mormina, M.; Müller, B.; Caniglia, G.; Engebretsen, E.; Loeffler-Stastka, H.; Marcum, J.; Mercuri, M.; Paul, E.; Pfaff, H.; Russo, F.; et al. Where to after COVID-19? Systems thinking for a human-centred approach to pandemics. Hum. Soc. Scien. Commun. 2024, 11, 733. [Google Scholar] [CrossRef]
  27. Pohl, C.; Pearce, B.B.; Mader, M.; Senn, L.; Krütli, P. Integrating systems and design thinking in transdisciplinary case studies. GAIA-Ecol. Perspect. Sci. Soc. 2020, 29, 258–266. [Google Scholar] [CrossRef]
  28. Nagel, R.L.; Gipson, K.G.; Ogundipe, A. Integrating sustainable design and systems thinking throughout an engineering curriculum. In Decision Management: Concepts, Methodologies, Tools, and Applications; Information Resources Management Association, Ed.; IRMA: New York, NY, USA, 2017; Volume III, pp. 1607–1624. [Google Scholar]
  29. Crosby, A.; Fam, D.; Mellick Lopes, A. Transdisciplinarity and the “Living Lab Model”: Food waste management as a site for collaborative learning. In Transdisciplinary Theory, Practice and Education: The Art of Collaborative Research and Collective Learning; Fam, D., Neuhauser, L., Gibbs, P., Eds.; Springer: Cham, Switzerland; pp. 117–131. [CrossRef]
  30. Milovanović, A.; Kostić, M.; Zorić, A.; Đorđević, A.; Pešić, M.; Bugarski, J.; Todorović, D.; Sokolović, N.; Josifovski, A. Transferring COVID-19 Challenges into Learning Potentials: Online Workshops in Architectural Education. Sustainability 2020, 12, 7024. [Google Scholar] [CrossRef]
  31. Saleh, M.M.; Abdelkader, M.; Hosny, S.S. Architectural education challenges and opportunities in a post-pandemic digital age. Ain Shams Engin. J. 2023, 14, 102027. [Google Scholar] [CrossRef]
  32. Casakin, H.; Wodehouse, A. A Systematic Review of Design Creativity in the Architectural Design Studio. Buildings 2021, 11, 31. [Google Scholar] [CrossRef]
  33. Lanteigne, V.; Rider, T.; Stratton, P. Evolving Design Pedagogies: Broadening Universal Design for Social Justice. Enq. ARCC J. Arc. Res. 2022, 19, 8–23. [Google Scholar] [CrossRef]
  34. Zhu, B.; Zheng, Y.; Ding, M.; Dai, J.; Liu, G.; Miao, L. A pedagogical approach optimization toward sustainable architectural technology education applied by massive open online courses. Archnet-IJAR 2023, 17, 589–607. [Google Scholar] [CrossRef]
  35. Talley, E.K.; Hull, R.B. Systems thinking for systems leadership: Promoting competency development for graduate students in sustainability studies. Int. J. Sustain. High. Educ. 2023, 24, 1039–1057. [Google Scholar] [CrossRef]
  36. Martins, F.; Almeida, M.F.; Calili, R.; Oliveira, A. Design Thinking Applied to Smart Home Projects: A User-Centric and Sustainable Perspective. Sustainability 2020, 12, 10031. [Google Scholar] [CrossRef]
  37. Colás-Bravo, P.; Conde-Jiménez, J.; Reyes-de-Cózar, S. Sustainability and Digital Teaching Competence in Higher Education. Sustainability 2021, 13, 12354. [Google Scholar] [CrossRef]
  38. Green, C.; Molloy, O.; Duggan, J. An Empirical Study of the Impact of Systems Thinking and Simulation on Sustainability Education. Sustainability 2022, 14, 394. [Google Scholar] [CrossRef]
  39. Choi, H.-S.; Bruyns, G.; Cheng, T.; Zhang, W.; Sharma, S. Human cognition and emotions for human-centred design in vertical interior urban spaces. J. Urb. Des. 2024, 1–24. [Google Scholar] [CrossRef]
  40. Park, H.Y.; Licon, C.V.; Sleipness, O.R. Teaching Sustainability in Planning and Design Education: A Systematic Review of Pedagogical Approaches. Sustainability 2022, 14, 9485. [Google Scholar] [CrossRef]
  41. Avsec, S.; Jagiełło-Kowalczyk, M.; Żabicka, A.; Gawlak, A.; Gil-Mastalerczyk, J. Leveraging Systems Thinking, Engagement, and Digital Competencies to Enhance First-Year Architecture Students’ Achievement in Design-Based Learning. Sustainability 2023, 15, 15115. [Google Scholar] [CrossRef]
  42. Burton, L.O.; Salama, A.M. Sustainable Development Goals and the future of architectural education—Cultivating SDGs-centred architectural pedagogies. Archnet-IJAR Int. J. Arch. Res. 2023, 17, 421–442. [Google Scholar] [CrossRef]
  43. Arnold, R.D.; Wade, J.P. A Definition of Systems Thinking: A Systems Approach. Procedia Comput. Sci. 2015, 44, 669–678. [Google Scholar] [CrossRef]
  44. Arnold, R.; Wade, J.P. A Complete Set of Systems Thinking Skills. Insight 2017, 20, 9–17. [Google Scholar] [CrossRef]
  45. Davis, A.C.; Leppanen, W.; Mularczyk, K.P.; Bedard, T.; Stroink, M.L. Systems Thinkers Express an Elevated Capacity for the Allocentric Components of Cognitive and Affective Empathy. Syst. Res. Behav. Sci. 2018, 35, 216–229. [Google Scholar] [CrossRef]
  46. Avsec, S. Design Thinking to Envision More Sustainable Technology-Enhanced Teaching for Effective Knowledge Transfer. Sustainability 2023, 15, 1163. [Google Scholar] [CrossRef]
  47. Gonzales, M. Systems Thinking for Supporting Students with Special Needs and Disabilities; Springer Nature: Singapore, 2020. [Google Scholar] [CrossRef]
  48. Liang, S.; Fan, P.; Yang, G. To Take a Risk or Not? The Effect of Perceived Scarcity on Risky Choices. Behav. Sci. 2023, 13, 743. [Google Scholar] [CrossRef] [PubMed]
  49. Blokland, P.; Reniers, G. Safety Science, a Systems Thinking Perspective: From Events to Mental Models and Sustainable Safety. Sustainability 2020, 12, 5164. [Google Scholar] [CrossRef]
  50. Bosch, O.; Maani, K.; Smith, C. Systems thinking-Language of complexity for scientists and managers. In Improving the Triple Bottom Line Returns from Small-Scale Forestry; The University of Queensland: Brisbane, Australia, 2007; pp. 57–66. [Google Scholar]
  51. Cai, Y.; Yang, Y. The development and validation of the Scale of Design Thinking for Teaching (SDTT). Think. Ski. Creat. 2023, 48, 101255. [Google Scholar] [CrossRef]
  52. Delen, I.; Sen, S. Effect of design-based learning on achievement in K-12 education: A meta-analysis. J. Res. Sci. Teach. 2023, 60, 330–356. [Google Scholar] [CrossRef]
  53. Gruber, M.; De Leon, N.; George, G.; Thompson, P. From the editors: Managing by Design. Acad. Manag. J. 2015, 58, 1–7. [Google Scholar] [CrossRef]
  54. Mayer, S.; Schwemmle, M. The impact of design thinking and its underlying theoretical mechanisms: A review of the literature. Creat. Innov. Manag. 2024; Online First. [Google Scholar] [CrossRef]
  55. Li, S.C.; Zhu, J. Cognitive-motivational engagement in ICT mediates the effect of ICT use on academic achievements: Evidence from 52 countries. Comput. Educ. 2023, 204, 104871. [Google Scholar] [CrossRef]
  56. Söderholm, F.; Viljaranta, J.; Tuominen, H.; Lappalainen, K.; Holopainen, L. Student engagement profiles and the role of support in general upper secondary education. Learn. Indiv. Diff. 2023, 104, 102289. [Google Scholar] [CrossRef]
  57. Schummer, J.; MacLennan, B.; Taylor, N. Aesthetic Values in Technology and Engineering Design. In Handbook of the Philosophy of Science, Philosophy of Technology and Engineering Sciences; Meijers, A., Ed.; North Holland: Eindhoven, The Netherlands, 2009; pp. 1031–1068. [Google Scholar] [CrossRef]
  58. Diessner, R.; Solom, R.C.; Frost, N.K.; Parsons, L.; Davidson, J. Engagement with beauty: Appreciating natural, artistic, and moral beauty. J. Psychol. 2008, 142, 303–329. [Google Scholar] [CrossRef]
  59. Zou, W.; Purington Drake, A.; Masur, P.K.; Whitlock, J.; Bazarova, N.N. Examining learners’ engagement patterns and knowledge outcome in an experiential learning intervention for youth’s social media literacy. Comput. Educ. 2024, 216, 105046. [Google Scholar] [CrossRef]
  60. Gunness, A.; Matanda, M.J.; Rajaguru, R. Effect of student responsiveness to instructional innovativeness on student engagement in semi-synchronous online learning environments: The mediating role of personal technological innovativeness and perceived usefulness. Comput. Educ. 2023, 205, 104884. [Google Scholar] [CrossRef]
  61. Goldhammer, F.; Gniewosz, G.; Zylka, J. ICT Engagement in learning environments. In Assessing Contexts of Learning World-wide—Extended Context Assessment Framework and Documentation of Questionnaire Material; Kuger, S., Klieme, E., Jude, N., Kaplan, D., Eds.; Springer International Publishing: Heidelberg, Germany, 2017. [Google Scholar]
  62. Kunina-Habenicht, O.; Goldhammer, F. ICT Engagement: A new construct and its assessment in PISA 2015. Large-Scale Assess Educ. 2020, 8, 6. [Google Scholar] [CrossRef]
  63. Lee, S.-H. Transformation by Human-Centered System Design. Des. Manag. Rev. 2024, 35, 88–93. [Google Scholar] [CrossRef]
  64. Parker, S.K.; Bindl, U.K.; Strauss, K. Making things happen: A model of proactive motivation. J. Manag. 2010, 36, 827–856. [Google Scholar] [CrossRef]
  65. DeBusk-Lane, M.L.; Zumbrunn, S.; Bae, C.L.; Broda, M.D.; Bruning, R.; Sjogren, A.L. Variable- and person-centered approaches to examining construct-relevant multidimensionality in writing self-efficacy. Front. Psychol. 2023, 14, 1091894. [Google Scholar] [CrossRef] [PubMed]
  66. United Nations (UN). Transforming Our World: The 2030 Agenda for Sustainable Development; UN: New York, NY, USA, 2015. [Google Scholar]
  67. Faul, F.; Erdfelder, E.; Buchner, A.; Lang, A.G. Statistical power analyses using G*Power 3.1: Tests for correlation and regression analyses. Behav. Res. Methods 2009, 41, 1149–1160. [Google Scholar] [CrossRef]
  68. Qiu, W.; Joe, H. ClusterGeneration: Random Cluster Generation. R Package Version 1.3.7. Available online: https://cran.r-project.org/web/packages/clusterGeneration/clusterGeneration.pdf (accessed on 28 August 2024).
  69. Wu, M.-J.; Zhao, K.; Fils-Aime, F. Response rates of online surveys in published research: A meta-analysis. Comput. Hum. Behav. Rep. 2022, 7, 100206. [Google Scholar] [CrossRef]
  70. Naibert, N.; Barbera, J. Development and Evaluation of a Survey to Measure Student Engagement at the Activity Level in General Chemistry. J. Chem. Educ. 2022, 99, 1410–1419. [Google Scholar] [CrossRef]
  71. Tabachnick, B.G.; Fidell, L.S. Using Multivariate Statistics, 7th ed.; Pearson: Boston, MA, USA, 2019. [Google Scholar]
  72. Hair, J.F.; Black, W.C.; Babin, B.J.; Anderson, R.E. Multivariate Data Analysis, 8th ed.; Cengage: Hampshire, UK, 2019. [Google Scholar]
  73. Zwick, W.R.; Velicer, W.F. Comparison of five rules for determining the number of components to retain. Psych. Bull. 1986, 99, 432–442. [Google Scholar] [CrossRef]
  74. Hayes, A.F.; Coutts, J.J. Use Omega Rather than Cronbach’s Alpha for Estimating Reliability. But…. Commun. Methods Meas. 2020, 14, 1–24. [Google Scholar] [CrossRef]
  75. Carlson, K.D.; Herdman, A.O. Understanding the impact of convergent validity on research results. Organ. Res. Methods 2012, 15, 17–32. [Google Scholar] [CrossRef]
  76. Cheah, J.-H.; Sarstedt, M.; Ringle, C.M.; Ramayah, T.; Ting, H. Convergent validity assessment of formatively measured constructs in PLS-SEM: On using single-item versus multi-item measures in redundancy analyses. Int. J. Contemp. Hosp. Manag. 2018, 30, 3192–3210. [Google Scholar] [CrossRef]
  77. Pituch, K.A.; Stevens, J.P. Applied Multivariate Statistics for the Social Sciences; Routledge: New York, NY, USA, 2015. [Google Scholar]
  78. Henseler, J.; Ringle, C.M.; Sarstedt, M. A new criterion for assessing discriminant validity in variance-based structural equation modeling. J. Acad. Mark. Sci. 2015, 43, 115–135. [Google Scholar] [CrossRef]
  79. Fornell, C.G.; Larcker, D.F. Evaluating structural equation models with unobservable variables and measurement error. J. Mark. Res. 1981, 18, 39–50. [Google Scholar] [CrossRef]
  80. Rönkkö, M.; Cho, E. An updated guideline for assessing discriminant validity. Organ. Res. Methods 2022, 25, 6–14. [Google Scholar] [CrossRef]
  81. Carter, C.R. Using confirmatory factor analysis to manage discriminant validity issues in social pharmacy research. Int. J. Clin. Pharm. 2016, 38, 731–737. [Google Scholar] [CrossRef]
  82. Schauffel, N.; Schmidt, I.; Peiffer, H.; Ellwart, T. Self-concept related to information and communication technology: Scale development and validation. Comput. Hum. Behav. Rep. 2021, 4, 100149. [Google Scholar] [CrossRef]
  83. Moore, S.M.; Dolansky, M.A.; Singh, M.; Palmieri, P.; Alemi, F. The Systems Thinking Scale; Case Western Reserve University: Cleveland, OH, USA, 2010; Available online: https://case.edu/nursing/sites/case.edu.nursing/files/2018-04/STS_Manual.pdf (accessed on 28 July 2024).
  84. Cheung, G.W.; Cooper-Thomas, H.D.; Lau, R.S.; Wang, L.C. Reporting reliability, convergent and discriminant validity with structural equation modeling: A review and best-practice recommendations. Asia Pac. J. Manag. 2024, 41, 745–783. [Google Scholar] [CrossRef]
  85. Dosi, C.; Rosati, F.; Vignoli, M. Measuring design thinking mindset. In Design 2018, Proceedings of the 15th International Design Conference, Dubrovnik, Croatia, 21–24 May 2018; Marjanovíc, D., Štorga, M., Škec, S., Bojčetić, N., Pavković, N., Eds.; The Design Society: Dubrovnik, Croatia, 2018; pp. 1991–2002. Available online: https://www.designsociety.org/publication/40597/MEASURING+DESIGN+THINKING+MINDSET (accessed on 1 June 2024).
  86. Vignoli, M.; Dosi, C.; Balboni, B. Design thinking mindset: Scale development and validation. Stud. High. Educ. 2023, 48, 926–940. [Google Scholar] [CrossRef]
  87. Capobianco, B.M.; French, B.F.; Diefes-Dux, H.A. Engineering identity development among pre-adolescent learners. J. Eng. Educ. 2012, 101, 698–716. [Google Scholar] [CrossRef]
  88. Kavousi, S.; Miller, P.A.; Alexander, P.A. Modeling metacognition in design thinking and design making. Int. J. Technol. Des. Educ. 2020, 30, 709–735. [Google Scholar] [CrossRef]
  89. Dewett, T. Linking intrinsic motivation, risk taking, and employee creativity in an R&D environment. R D Manag. 2007, 37, 197–208. [Google Scholar] [CrossRef]
  90. Amabile, T.M. Creativity in Context; Westview Press: Boulder, CO, USA, 1996. [Google Scholar]
  91. Jung, S.; Hong, A.J. Exploring the combination of individual and organizational–environmental factors in the expression of radical and incremental creativity. Hum. Resour. Dev. Q. 2024; Advance Online Publication. [Google Scholar] [CrossRef]
  92. Zhang, D.C.; Highhouse, S.; Nye, C.D. Development and validation of the General Risk Propensity Scale (GRiPS). J. Beh. Decis. Mak. 2019, 32, 152–167. [Google Scholar] [CrossRef]
  93. Vallerand, R.J.; Pelletier, L.G.; Blais, M.R.; Briere, N.M.; Senecal, C.; Vallieres, E.F. The Academic Motivation Scale: A measure of intrinsic, extrinsic, and amotivation in education. Educ. Psych. Meas. 1992, 52, 1003–1017. [Google Scholar] [CrossRef]
  94. Hair, J.F.; Hult GT, M.; Ringle, C.M.; Sarstedt, M. A Primer on Partial Least Squares Structural Equation Modeling (PLS-SEM), 3rd ed.; Sage: Thousand Oakes, CA, USA, 2022. [Google Scholar]
  95. Gore, P. Cluster Analysis. In Handbook of Applied Multivariate Statistics and Mathematical Modelling; Tinsley, H., Brown, S., Eds.; Academic Press: Cambridge, MA, USA, 2000; pp. 297–321. [Google Scholar]
  96. Cohen, J.; Cohen, P.; West, S.G.; Aiken, L.S. Applied Multiple Regression/Correlation Analysis for the Behavioral Sciences, 3rd ed.; Routledge: New York, NY, USA, 2003; pp. 32–35. [Google Scholar]
  97. Benitez, J.; Henseler, J.; López, A.C.; Schuberth, F. How to perform and report an impactful analysis using partial least squares: Guidelines for confirmatory and explanatory IS research. Inf. Manag. 2020, 57, 103168. [Google Scholar] [CrossRef]
  98. Hair, J.; Alamer, A. Partial Least Squares Structural Equation Modelling (PLS-SEM) in Second Language and Education Research: Guidelines Using an Applied Example. Res. Methods Appl. Linguist. 2022, 1, 100027. [Google Scholar] [CrossRef]
  99. Shmueli, G.; Sarstedt, M.; Hair, J.F.; Cheah, J.H.; Ting, H.; Vaithilingam, S.; Ringle, C.M. Predictive Model Assessment in PLS-SEM: Guidelines for Using PLSpredict. Europ. J. Market. 2019, 53, 2322–2347. [Google Scholar] [CrossRef]
  100. Chin, W.; Cheah, J.-H.; Liu, Y.; Ting, H.; Lim, X.-J.; Cham, T.H. Demystifying the role of causal-predictive modeling using partial least squares structural equation modeling in information systems research. Ind. Manag. Data Syst. 2020, 120, 2161–2209. [Google Scholar] [CrossRef]
  101. Hair, J.F.; Risher, J.J.; Sarstedt, M.; Ringle, C.M. When to use and how to report the results of PLS-SEM. Europ. Bus. Rev. 2019, 31, 2–24. [Google Scholar] [CrossRef]
  102. Cohen, J. Statistical Power Analysis for the Behavioral Sciences, 2nd ed.; Routledge: New York, NY, USA, 2013. [Google Scholar]
  103. Gaskin, J.; Ogbeibu, S.; Lowry, P.B. Demystifying Prediction in Mediation Research and the Use of Specific Indirect Effects and Indirect Effect Sizes. In Partial Least Squares Path Modeling: Basic Concepts, Methodological Issues, and Applications, 2nd ed.; Latan, H., Hair, J.F., Noonan, R., Eds.; Springer: Cham, Switzerland, 2023. [Google Scholar]
  104. Sharma, P.N.; Liengaard, B.D.; Hair, J.F.; Sarstedt, M.; Ringle, C.M. Predictive Model Assessment and Selection in Composite-based Modeling Using PLS-SEM: Extensions and Guidelines for Using CVPAT. Europ. J. Market. 2023, 57, 1662–1677. [Google Scholar] [CrossRef]
  105. Coraggio, L.; Coretto, P. Selecting the number of clusters, clustering models, and algorithms: A unifying approach based on the quadratic discriminant score. J. Mult. Anal. 2023, 196, 105181. [Google Scholar] [CrossRef]
  106. Roski, M.; Sebastian, R.; Ewerth, R.; Hoppe, A.; Nehring, A. Learning analytics and the Universal Design for Learning (UDL): A clustering approach. Comput. Educ. 2024, 214, 105028. [Google Scholar] [CrossRef]
  107. Rossbroich, J.; Durieux, J.; Wilderjans, T.F. Model Selection Strategies for Determining the Optimal Number of Overlapping Clusters in Additive Overlapping Partitional Clustering. J. Classif. 2022, 39, 264–301. [Google Scholar] [CrossRef]
  108. Smith, T.J.; McKenna, C.M. A Comparison of Logistic Regression Pseudo R2 Indices. Mult. Lin. Regr. Viewp. 2013, 39, 17–26. [Google Scholar]
  109. Teece, D.; Peteraf, M.; Leih, S. Dynamic capabilities and organizational agility: Risk, uncertainty, and strategy in the innovation economy. Calif. Manag. Rev. 2016, 58, 13–35. [Google Scholar] [CrossRef]
  110. Habbal, F.; Kolmos, A.; Hadgraft, R.G.; Holgaard, J.E.; Reda, K. Reshaping Engineering Education. Addresing Complex Human Chanllenges; Springer Singapore: Singapore, 2024. [Google Scholar] [CrossRef]
  111. Peng, F.; Altieri, B.; Hutchinson, T.; Harris, A.J.; McLean, D. Design for Social Innovation: A Systemic Design Approach in Creative Higher Education toward Sustainability. Sustainability 2022, 14, 8075. [Google Scholar] [CrossRef]
  112. Marcos-Sánchez, R.; Ferrández, D.; Morón, C. Systems Thinking for Sustainability Education in Building and Business Administration and Management Degrees. Sustainability 2022, 14, 11812. [Google Scholar] [CrossRef]
  113. Kastelli, I.; Dimas, P.; Stamopoulos, D.; Tsakanikas, A. Linking Digital Capacity to Innovation Performance: The Mediating Role of Absorptive Capacity. J. Knowl. Econ. 2024, 15, 238–272. [Google Scholar] [CrossRef]
  114. de Vasconcellos, S.L.; da Silva Freitas, J.C.; Junges, F.M. Digital Capabilities: Bridging the Gap Between Creativity and Performance. In The Palgrave Handbook of Corporate Sustainability in the Digital Era; Park, S.H., Gonzalez-Perez, M.A., Floriani, D.E., Eds.; Palgrave Macmillan: Cham, Switzerland, 2021. [Google Scholar] [CrossRef]
  115. Mannila, L.C.Y.; Leinonen, T.; Bauters, M.; Veermans, M. Student and teacher co-agency when combining CT with arts and design in a cross-curricular project. Comput. Educ. Open 2023, 4, 100132. [Google Scholar] [CrossRef]
  116. Ibrahim, R.K.; Aldawsari, A.N. Relationship between digital capabilities and academic performance: The mediating effect of self-efficacy. BMC Nurs. 2023, 22, 434. [Google Scholar] [CrossRef]
  117. Garett, J.J. The Elements of User Experience: User Centered Design for the Web and Beyond; New Riders: Berkley, CA, USA, 2011. [Google Scholar]
  118. Dorst, K. The core of design thinking and its application. Des. Stud. 2011, 32, 521–532. [Google Scholar] [CrossRef]
  119. Vidergor, H.E. The effect of teachers’ self- innovativeness on accountability, distance learning self-efficacy, and teaching practices. Comput. Educ. 2023, 199, 104777. [Google Scholar] [CrossRef] [PubMed]
  120. De Backer, L.; Van Keer, H.; De Smedt, F.; Merchie, E.; Valcke, M. Identifying regulation profiles during computer-supported collaborative learning and examining their relation with students’ performance, motivation, and self-efficacy for learning. Comput. Educ. 2022, 179, 104421. [Google Scholar] [CrossRef]
  121. Thornton, B.; Peltier, G.; Perreault, G. Systems Thinking: A Skill to Improve Student Achievement. Clear. House J. Educ. Strat. Iss. Id. 2010, 77, 222–230. [Google Scholar] [CrossRef]
  122. Nicholson, N.; Soane, E.; Fenton-O’Creevy, M.; Willman, P. Personality and domain-specific risk taking. J. Risk Res. 2005, 8, 157–176. [Google Scholar] [CrossRef]
  123. Steenkamp, A.; Meyer, N.; Bevan-Dye, A.L. Self-esteem, need for achievement, risk-taking propensity and consequent entrepreneurial intentions. S. Afr. J. Entrep. Small Bus. Manag. 2024, 16, a753. [Google Scholar] [CrossRef]
  124. Hung, K.-T.; Tangpong, C. General risk propensity in multifaceted business decisions: Scale development. J. Manag. Iss. 2010, 22, 88–106. [Google Scholar] [CrossRef]
Figure 1. HCST context for inclusive and sustainable design.
Sustainability 16 09802 g001
Figure 2. PLS path model of key driver constructs.
Sustainability 16 09802 g002
Figure 3. Three-cluster solution for HCST.
Sustainability 16 09802 g003
Figure 4. HCST cluster membership of students according to the university of enrollment in sustainable and inclusive design.
Sustainability 16 09802 g004
Table 1. McDonald’s ω, composite reliability (CR), square root of average variance extracted (AVE) (in bold), and correlations among student engagement constructs (off-diagonal).
Latent ConstructωCRAVEE-BEHE-COGE-EMOE-SOCE-AESE-SOM
E-BEH0.850.880.690.83
E-COG0.840.860.680.520.82
E-EMO0.800.800.540.450.300.74
E-SOC0.770.880.580.040.110.170.77
E-AES0.750.760.660.410.270.280.100.82
E-SOM0.740.750.560.170.010.090.120.350.75
Table 2. Heterotrait–monotrait (HTMT) ratio of correlations and Fornell–Larcker criterion results (in parenthesis) for student engagement scale. AVE on the diagonal.
Latent ConstructE-BEHE-COGE-EMOE-SOCE-AESE-SOM
E-BEH0.69
E-COG0.60 (0.27)0.68
E-EMO0.54 (0.20)0.35 (0.09)0.54
E-SOC0.10 (0.01)0.14 (0.01)0.20 (0.03)0.58
E-AES0.52 (0.17)0.35 (0.07)0.40 (0.08)0.18 (0.01)0.66
E-SOM0.22 (0.03)0.10 (0.01)0.28 (0.01)0.17 (0.01)0.47 (0.12)0.56
Table 3. Reliability of McDonald’s ω, composite reliability (CR), square root of average variance extracted (AVE) (in bold), and correlations among student SC-ICT constructs (off-diagonal).
Latent ConstructωCRAVESC-GLSC-COSC-PSGCSC-SASC-SP
SC-GL0.920.940.770.88
SC-CO0.900.920.760.620.87
SC-PSGC0.940.940.710.660.840.84
SC-SA0.910.920.780.470.580.680.89
SC-SP0.910.920.800.650.510.560.600.90
Table 4. Heterotrait–monotrait (HTMT) ratio of correlations and Fornell–Larcker criterion results (in parentheses) for SC-ICT scale. AVE on the diagonal.
Latent ConstructSC-GLSC-COSC-PSGCSC-SASC-SP
SC-GL0.77
SC-CO0.67 (0.38)0.76
SC-PSGC0.70 (0.43)0.84 (0.64)0.71
SC-SA0.51 (0.22)0.64 (0.33)0.72 (0.46)0.78
SC-SP0.71 (0.42)0.56 (0.26)0.60 (0.31)0.64 (0.36)0.80
Table 5. Reliability of McDonald’s ω, CR, square root of AVE (in bold), and correlations among student STS constructs (off-diagonal).
Latent ConstructωCRAVESTF1STF2STF3
STF10.820.880.650.80
STF20.800.860.620.350.79
STF30.810.880.720.420.450.85
Table 6. HTMT and Fornell–Larcker criterion results (in parentheses) for STS scale. AVE on the diagonal.
Latent ConstructSTF1STF2STF3
STF10.65
STF20.43 (0.12)0.62
STF30.50 (0.17)0.54 (0.20)0.72
Table 7. Reliability of McDonald’s ω, CR, square root of AVE (in bold), and correlations among student design thinking (DT) constructs (off-diagonal).
Latent ConstructωCRAVEDT-COLDT-CREATDT-EMPDT-LODT-MDDT-RISK
DT-COL0.860.900.700.84
DT-CREAT0.900.910.580.480.76
DT-EMP0.890.920.750.460.560.86
DT-LO0.880.910.550.560.660.500.74
DT-MD0.810.870.640.460.550.420.610.80
DT-RISK0.820.880.650.130.310.210.340.210.81
Table 8. HTMT and Fornell–Larcker criterion results (in parentheses) for DT scale. AVE on the diagonal.
Latent ConstructDT-COLDT-CREATDT-EMPDT-LODT-MDDT-RISK
DT-COL0.70
DT-CREAT0.55 (0.23)0.58
DT-EMP0.52 (0.21)0.62 (0.31)0.75
DT-LO0.64 (0.31)0.74 (0.44)0.56 (0.25)0.55
DT-MD0.55 (0.21)0.64 (0.30)0.49 (0.17)0.70 (0.36)0.64
DT-RISK0.15 (0.02)0.36 (0.10)0.24 (0.04)0.41 (0.12)0.26 (0.05)0.65
Table 9. Reliability of McDonald’s ω, CR, square root of AVE (in bold), and correlations among student human-centeredness constructs (off-diagonal).
Latent ConstructωCRAVECOLDIVCRICREATEMPHVPROPTUI
COLDIV0.860.900.700.84
CRICREAT0.910.920.580.550.76
EMP0.890.920.750.460.570.87
HVPR0.870.900.610.520.710.660.78
OPT0.830.890.740.390.610.450.530.86
UI0.780.870.690.400.450.560.430.380.83
Table 10. HTMT and Fornell–Larcker criterion results (in parentheses) for STS scale. AVE on the diagonal.
Latent ConstructCOLDIVCRICREATEMPHVPROPTUI
COLDIV0.70
CRICREAT0.62 (0.30)0.57
EMP0.52 (0.21)0.64 (0.33)0.75
HVPR0.60 (0.27)0.79 (0.50)0.74 (0.43)0.61
OPT0.46 (0.15)0.69 (0.37)0.52 (0.20)0.62 (0.28)0.74
UI0.49 (0.16)0.53 (0.20)0.66 (0.31)0.51 (0.18)0.47 (0.14)0.69
Table 11. Reliability of McDonald’s ω, CR, square root of AVE (in bold), and correlations among student motivation and risk propensity constructs (off-diagonal).
Latent ConstructωCRAVEINTM-A1INTM-A2INTM-EINTM-KRP
INTM-A10.770.860.680.82
INTM-A20.830.890.740.490.86
INTM-E0.760.860.680.370.430.82
INTM-K0.870.900.610.520.610.580.78
RP0.820.880.650.170.360.180.320.80
Table 12. HTMT and Fornell–Larcker criterion results (in parentheses) for the STS scale. AVE on the diagonal.
Latent ConstructINTM-A1INTM-A2INTM-EINTM-KRP
INTM-A10.68
INTM-A20.60 (0.24)0.74
INTM-E0.46 (0.14)0.53 (0.18)0.68
INTM-K0.62 (0.27)0.72 (0.37)0.71 (0.33)0.61
RP0.21 (0.03)0.43 (0.13)0.22 (0.03)0.37 (0.10)0.65
Table 13. Architecture students’ self-reported average scores expressed with mean (M) and standard deviation (SD) across scales and subscales of students’ engagement in learning, ICT self-concept and systems and design thinking along with measures of skewness (S) and kurtosis (K); 95% confidence interval (CI) is reported in brackets.
Scale (Response Scale)SubscalesMSDSK95% CI
Engagement (1–6) 4.270.54−0.12−0.18[4.20, 4.35]
E-BEH4.880.91−0.65−0.21[4.76, 5.01]
E-COG4.850.76−0.58−0.24[4.75, 4.96]
E-EMO4.380.96−0.660.15[4.25, 4.51]
E-SOC3.840.93−0.01−0.42[3.71, 3.97]
E-AES4.080.840.05−0.32[3.97, 4.20]
E-SOM3.521.01−0.08−0.12[3.38, 3.66]
SC-ICT (1–6) 4.000.91−0.370.05[3.88, 4.13]
SC-GL4.021.18−0.35−0.40[3.85, 4.18]
SC-CO4.341.08−0.34−0.39[4.19, 4.49]
SC-PSGC4.161.01−0.39−0.08[4.02, 4.30]
SC-SA3.761.12−0.20−0.32[3.61, 3.92]
SC-SP3.581.11−0.05−0.20[3.42, 3.73]
Systems Thinking (0–5) 3.610.65−0.470.60[3.52, 3.69]
STF13.630.87−0.42−0.40[3.51, 3.75]
STF23.520.80−0.40−0.12[3.41, 3.63]
STF33.690.86−0.49−0.05[3.57, 3.81]
Design Thinking (1–6) 4.230.60−0.31−0.11[4.15, 4.32]
DT-COL4.780.92−0.42−0.66[4.66, 4.91]
DT-CREAT4.490.760.08−0.66[4.39, 4.60]
DT-EMP4.820.91−0.53−0.35[4.69, 4.94]
DT-LO4.750.78−0.40−0.38[4.64, 4.86]
DT-MD4.660.89−0.630.21[4.53, 4.78]
DT-RISK3.511.06−0.03−0.20[3.36, 3.65]
Table 14. Pearson correlations between main research dimensions.
ConstructSC-ICTEngagementSystems Thinking
Engagement0.28 **
Systems Thinking0.26 **0.45 **
Design Thinking0.36 **0.50 **0.41 **
** p < 0.01 (2-tailed).
Table 15. Significance analysis of direct and indirect effects in model. Only significant effects are shown (p < 0.05).
Direct Effectt-Valuep-ValueIndirect Effectt-Valuep-Value
Design Thinking → DPG0.1572.3730.018
Design Thinking → Engagement0.3995.6050.000
Design Thinking → SC-ICT 0.2963.7760.000
Engagement → DPG 0.1662.6280.009
GPA → DPG 0.3495.3660.000
GPA → Systems Thinking0.3816.4830.000
SC-ICT → Engagement0.1231.9740.049
Systems Thinking → DPG 0.2744.0480.000
Systems Thinking → Design Thinking 0.4647.2470.000
Systems Thinking → Engagement 0.1952.5960.009
Systems Thinking → SC-ICT 0.1762.1460.032
GPA → Systems Thinking → SC-ICT0.0671.9770.048
Systems Thinking → Design Thinking → DPG0.0732.2230.026
Systems Thinking → Design Thinking → Engagement 0.1854.5950.000
Systems Thinking → Design Thinking → SC-ICT 0.1383.2280.001
GPA → Systems Thinking → Design Thinking → SC-ICT 0.0532.6580.008
GPA → Systems Thinking → Design Thinking → Engagement 0.0713.6600.000
Systems Thinking → Design Thinking → Engagement →DPG 0.0312.0960.036
GPA → Systems Thinking → Design Thinking → DPG0.0282.0240.043
GPA → Systems Thinking → Design Thinking → Engagement → DPG0.0122.0340.042
Design Thinking → Engagement → DPG0.0672.2240.026
GPA → Systems Thinking → DPG 0.1043.7130.000
GPA → Systems Thinking → Design Thinking 0.1784.4730.000
GPA → Systems Thinking → Engagement0.0742.4130.016
Table 16. Architecture students’ self-reported average scores expressed as mean (M) and standard deviation (SD) across scales and subscales of human-centeredness along with measures of skewness (S) and kurtosis (K); 95% confidence interval (CI) is reported in brackets.
Scale (Response Scale)SubscalesMSDSK95% CI
COLDIV4.790.92−0.42−0.66[4.66, 4.91]
CRICREAT4.510.76−0.06−0.47[4.39, 4.60]
Human centeredness (1–6)EMP4.820.91−0.53−0.35[4.69, 4.94]
HVPR4.650.78−0.38−0.45[4.55, 4.77]
OPT4.540.90−0.22−0.54[4.42, 4.66]
UI4.230.91−0.11−0.55[4.11, 4.36]
Table 17. Pearson correlations for variables of HCST.
Measures12345678910111213
E-BEH1.00
E-COG0.50 **1.00
E-EMO0.44 **0.28 **1.00
E-AES0.50 **0.34 **0.31 **1.00
UI0.19 **0.23 **0.10 **0.38 **1.00
EMP0.30 **0.40 **0.14 *0.45 **0.55 **1.00
HVPR0.31 **0.37 **0.32 **0.50 **0.42 **0.66 **1.00
COLDIV0.29 **0.40 **0.22 **0.27 **0.41 **0.47 **0.52 **1.00
CRICREAT0.22 **0.37 **0.27 **0.48 **0.45 **0.58 **0.71 **0.55 **1.00
OPT0.12 *0.21 **0.19 *0.27 **0.38 **0.46 **0.53 **0.39 **0.60 **1.00
STF10.23 **0.23 **0.19 *0.17 *0.30 **0.22 **0.28 **0.31 **0.32 **0.21 **1.00
STF20.32 **0.37 **0.23 *0.17 *0.29 **0.23 **0.25 **0.36 **0.23 **0.18 **0.35 **1.00
STF30.27 **0.32 **0.24 **0.27 **0.34 **0.34 **0.36 **0.33 **0.29 **0.19 **0.42 **0.44 **1.00
** p < 0.01, * p < 0.05 (2-tailed).
Table 18. Silhouette score, AIC and BIC depending on the number of clusters. Metrics with the best results are in bold.
Number of ClustersSilhouette ScoreAICBIC
20.5531607.351807.83
30.4731547.501780.90
40.4621526.141873.25
50.4541523.481957.36
60.4191530.972051.63
Table 19. Tests of between-subject effects (df = 2).
VariableType III Sum of SquaresMean SquareF-
Statistics
p-ValuePartial
η2
SC-GL14.317.155.330.0050.050
SC-CO34.8217.4116.970.0000.142
SC-PSGC33.9416.9719.200.0000.158
SC-SA12.596.295.130.0070.048
SC-SP22.6711.339.730.0000.087
DT-COL77.2338.6178.840.0000.435
DT-CREAT56.0128.0086.280.0000.457
DT-EMP86.4443.22103.240.0000.502
DT-LO49.8324.9164.470.0000.386
DT-MD53.8426.9249.430.0000.325
DT-RISK12.306.145.610.0040.052
GPA2.061.037.670.0010.070
Table 20. Averages of architecture students’ self-reported scores expressed as mean (M) and standard deviation (SD) across scales and subscales of motivation, risk propensity, and GPA. Measures of skewness (S) and kurtosis (K) along with 95% confidence interval (CI) (in brackets).
VariablesSubscalesMSDSK95% CI
MotivationINTM-A14.600.93−0.29−0.66[4.47, 4.72]
INTM-A24.550.90−0.22−0.55[4.42, 4.66]
INTM-E4.710.92−0.680.22[4.58, 4.84]
INTM-K4.960.79−0.780.07[4.85, 5.06]
Risk propensityRP3.511.07−0.03−0.21[3.36, 3.65]
Prior knowledgeGPA4.270.37−0.39−0.15[4.21, 4.32]
Table 21. MLR predicting high HCST profile from intrinsic motivation, risk propensity, and GPA. Reference cluster is 1; 95% CI for eβ in brackets (df = 1).
Cluster NumberPredictorβStd. ErrorWaldp-Valueeβ95% CI for eβ
2INTM-A1−1.040.358.510.0040.35[0.17, 0.71]
INTM-A2−0.880.414.410.0360.41[0.18, 0.94]
INTM-E−1.300.3612.820.0000.27[0.13, 0.54]
INTM-K−1.800.5211.900.0010.16[0.06, 0.45]
RP−0.100.280.130.7100.90[0.52, 1.56]
GPA−1.720.794.760.0290.17[0.04, 0.83]
3INTM-A1−0.670.266.410.0110.50[0.30, 0.85]
INTM-A2−0.430.282.340.1260.64[0.36, 1.13]
INTM-E−0.570.284.120.0420.56[0.32, 0.98]
INTM-K−1.170.418.140.0040.30[0.13, 0.69]
RP−0.230.191.510.2180.78[0.54, 1.15]
GPA−1.870.5810.240.0010.15[0.05, 0.48]
Table 22. A summary table highlighting the significant differences in HCST profiles, covering the constructs of ICT self-concept, design thinking ability, GPA, intrinsic motivation, and risk propensity.
ConstructVariableHCST Profile Comparisonp-
Value
Effect Size η2/eβNotes
ICT self-conceptSC-GL, SC-CO, SC-PSGC, SC-SA, SC-SPHigh HCST > low and average HCSTAll p < 0.05Small to medium (0.048–0.158)High HCST students report higher collaboration, communication, and problem-solving abilities using ICT.
Differences in data literacy and safety/security use are more pronounced for high HCST.
Design thinking abilityDT-COL, DT-CREAT, DT-EMP, DT-LO, DT-MD, DT-RISKHigh HCST > low and average HCST (except DT-RISK)All p < 0.05 (except DT-RISK)Medium to large (0.052–0.502)High HCST profiles reflect higher design thinking skills; risk-taking is similar between high and average HCST.
GPAGPAHigh HCST > low and average HCSTp < 0.01Small (0.070)High HCST students achieve a higher GPA than low and average students, with little difference between low and average.
Intrinsic motivationINTM-A1, INTM-A2, INTM-E, INTM-KHigh HCST > low HCSTp < 0.05eβ: 0.16–0.56High intrinsic motivation across all subscales is a predictor for a high HCST profile.
Risk propensityRPNo significant difference across profilesp > 0.05eβ: 0.78–0.90Risk propensity is not a strong predictor of a high HCST profile.
Disclaimer/Publisher’s Note: The statements, opinions and data contained in all publications are solely those of the individual author(s) and contributor(s) and not of MDPI and/or the editor(s). MDPI and/or the editor(s) disclaim responsibility for any injury to people or property resulting from any ideas, methods, instructions or products referred to in the content.

