Article

Seasonality and Predictability of Hydrometeorological and Water Chemistry Indicators in Three Coastal Forested Watersheds

1
Department of Sanitary Engineering and Water Management, University of Agriculture in Krakow, Mickiewicza 21, 31-120 Krakow, Poland
2
USDA Forest Service, Center for Forest Watershed Research, 3734 Highway 402, Cordesville, SC 29434, USA
3
Department of Geology and Environmental Geosciences, College of Charleston, 66 George Street, Charleston, SC 29424, USA
*
Author to whom correspondence should be addressed.
Sustainability 2024, 16(22), 9756; https://doi.org/10.3390/su16229756
Submission received: 23 September 2024 / Revised: 29 October 2024 / Accepted: 30 October 2024 / Published: 8 November 2024
(This article belongs to the Section Sustainable Water Management)

Abstract

:
Forests are recognized for sustaining good water chemistry within landscapes. This study focuses on the water chemistry parameters and their hydrological predictability and seasonality (as a component of predictability) in watersheds of varying scales, with and without human (forest management) activities on them, using Colwell indicators for data collected during 2011–2019. The research was conducted in three forested watersheds located at the US Forest Service Santee Experimental Forest in South Carolina USA. The analysis revealed statistically significant (α = 0.05) differences between seasons for stream flow, water table elevation (WTE), and all water chemistry indicators in the examined watersheds for the post-Hurricane Joaquin period (2015–2019), compared to the 2011–2014 period. WTE and flow were identified as having the greatest influence on nitrogen concentrations. During extreme precipitations events, such as hurricanes or tropical storms, increases in WTE and flow led to a decrease in the concentrations of total dissolved nitrogen (TDN), NH4-N, and NO3-N+NO2-N, likely due to dilution. Colwell indicators demonstrated higher predictability (P) for most hydrologic and water chemistry indicators in the 2011–2014 period compared to 2015–2019, indicating an increase in the seasonality component compared to constancy (C), with a larger decrease in C/P for 2015–2019 compared to 2011–2014. The analysis further highlighted the influence of extreme hydrometeorological events on the changing predictability of hydrology and water chemistry indicators in forested streams. The results demonstrate the influence of hurricanes on hydrological behavior in forested watersheds and, thus, the seasonality and predictability of water chemistry variables within and emanating out of the watershed, potentially influencing the downstream ecosystem. The findings of this study can inform forest watershed management in response to natural or anthropogenic disturbances.

1. Introduction

Ineffective management practices in water resources can cause increased risks of both water scarcity and quality for whole ecosystem. Climate and land use change additionally increases negative effects on water resources [1,2,3,4]. Forests play a significant role in water chemistry, particularly clean water quality, and provide important ecosystem services [5]. Forest ecosystems, due to their micro-organisms, soil biogeochemical processes, soil characteristics, root systems, and canopy cover, have been the main contributors of good water chemistry. An increase in forest cover in watersheds generally significantly decreases total nitrogen (TN), total phosphorus (TP), and suspended sediment (SS) concentrations and can also protect water chemistry and water supply in watersheds [6,7].
Global multisite studies have shown that silvicultural management can influence hydrology and water chemistry. Forest management activities may have a negative impact on water chemistry parameters, depending on the site preparation, intensity and extent of tree removal, climatic conditions, and watershed characteristics [7,8,9,10,11]. Based on a study performed in the Pacific Northwest, Deval et al. [12] showed that nitrate + nitrite and orthophosphate increased in streams after clearcutting and that concentrations were lower in downstream watersheds due to dilution and nutrient assimilation effects.
As reported by Shepard [13], the greatest impact on water quantity and quality in a managed forest system is observed during harvesting and site preparation. Amatya et al. [14] and Grace and Carter [15] showed that harvesting reduces evapotranspiration (ET) and increases runoff, consequently leading to increased nutrient and sediment loads. Harvested forest can also lead to an increased intensity of soil loss after intense precipitation events [16]. Other management practices, like controlled drainage [17,18] and fertilization, can also influence water chemistry, mainly nitrate concentration [19]. Muwamba et al. [20] reported that in areas where cellulosic, biofuel-based switchgrass (Panicum vergatim) was intercropped between pine beds, the following processes influencing the quality of drainage outflow were observed: (1) the transformation of nitrogen components, (2) NH4-N and phosphate transformation, which influence the sorption process, and (3) transporting total suspended sediment (TSS). Hughes and Quinn [21], based on a study performed on a steep headwater catchment within the Waikato region, New Zealand, reported that stand-planting and stand-thinning operations were the cause of increasing nitrate-N and total nitrogen (TN) concentrations in water, suggesting that NO3-N uptake by growing trees is an important process. In continuously covered forested areas, Palvinainen et al. [22] showed decreased nutrient concentrations as well as CO2 emissions from inland waters compared to the areas with conventional clearcutting.
Leppä at al. [23] reported that water table elevation in a partially harvested forest was shallower compared to that in a clearcut forest. The authors concluded that partial harvesting may lead to decreased nutrient leaching due to changing redox reactions, as compared to clearcutting operations; whereas, the oxidation and mineralization of deep peat layers can be smaller than in uncut forest because of higher water table elevation. On the other hand, a study performed in the Bavarian Forest National Park [24] showed that forest disturbances led to a temporal increase in nitrate concentration in stream water, but salvage logging did not have a strong impact on nitrate and dissolved organic carbon (DOC) concentrations.
Land use conversion from forest to agriculture can also have negative influence on water chemistry and the depletion of soil organic carbon [25,26]. The results of 10 years of study at a lowland raised bog that was afforested with conifers followed by clearcutting showed an increase in phosphorus soon after clearcutting, nitrate concentrations, mainly in the summer after clearcutting, and phosphorus concentrations returning to the baseline level 3–5 years after clearcutting [7]. Erdoğan et al. [27] reported that a decrease of 18% forest cover as a result of harvesting can substantially affect physical water chemistry parameters, like pH, color, turbidity, electrical conductivity (EC), suspended sediment concentration (SSC), and water and air temperatures and, hence, has an adverse impact on aquatic life. Muwamba et al. [10] reported increased nutrients when converting a pine plantation (Pinus taeda) forest to cellulosic biofuel-based switchgrass (Panicum verbatim) on a coastal site in North Carolina.
Forest ecosystems are generally resilient with a strong potential for their hydrology and water chemistry to return to pretreatment levels [28,29,30]. Based on a long-term experiment in a forest located in Oregon, Safeeq et al. [31] indicated that sediment and bed load increased significantly after a harvest, but annual suspended sediment yields returned to pretreatment levels in the first two decades following treatment. Also, natural disasters, like windfall or hurricanes, that cause substantial damage to forest canopy [32,33] can also strongly influence water quantity and quality. Based on a study performed in the Western Tatras in the Polish Carpathians, Kosmowska et al. [34] reported that deforestation after windfall caused changes in the chemical composition of water, with an observed increase in NO3 concentrations. Forest management practices also impact seasonal in-stream water chemistry and transport dynamics. Erdozain et al. [35] showed a cumulative effect of forest management on downstream water chemistry, with a greater observed outflow of sediments and DOC and warmer temperatures. Their results also showed that a greater overall intensity of forestry operations does not necessarily result in greater environmental impacts, when and if more sustainable practices, like partial as opposed to clearcut harvest, are followed. Best management practices (BMPs) with partial harvesting can mitigate the negative impact of human activities in forests [36]. The levels of observed impacts may also depend upon the seasonality of flow draining the watersheds.
A full understanding of the seasonality of water chemistry is important for monitoring water pollution and to introduce strategies to prevent water chemistry degradation. Duan et al. [37] used a combined seasonal Mann–Kendall test and timeseries decomposition to detect trends and the seasonality of water chemistry parameters, like pH, dissolved oxygen, and ammonia nitrogen, in the Yangtze River. Analysis described by Xu et al. [38] in the Dan River showed that the seasonal variability of water levels in rivers plays a significant role in water chemistry in the different seasons, and the contributions of land use to water chemistry gradually increased from spring to winter. The presented studies show that the surface water chemistry of watersheds is influenced by the seasonality of the hydrological cycle process, and this knowledge is very important to understand all processes determining water and pollution balance in a watershed.
Based on the above studies, it was shown that forest management practices can significantly influence water chemistry. However, thus far, there is a limited understanding of the seasonality of hydrology and stream water chemistry on both managed and unmanaged forest lands. Understanding seasonality helps design management strategies for sustainable and resilient water resources. Seasonality analysis of water chemistry indicators so far has been analyzed for large catchments using trends analysis, like the seasonal Mann–Kendall test [37], simple correlations [39], analysis of variance (ANOVA), and a multivariate analysis of variance (MANOVA) [40]. In ecohydrological analysis, Colwell’s indicators, like predictability (P) and its components, constancy (C) and seasonality (M), are used to detect the stability of hydrometeorology timeseries [3,41]. However, so far, the indicators have not been used in water chemistry analysis, including in forested watersheds. The values of C and M parameters taken together, as a compound predictability, show variability or stability in the analyses of timeseries data [42]. For example, in forestry practices, knowledge about constancy and contingency (seasonality) can be useful in the monitoring and management of water chemistry and quantity to help assess the effects on changes in forest ecosystem health.
Considering the significant impact of seasonality on the chemistry of water draining forest watersheds, the aim of the study was to analyze the seasonality of hydrometeorological and quality parameters. The analysis covered characteristics, such as precipitation, streamflow, groundwater table elevation (WTE), potential evapotranspiration (PET), and water chemistry (nutrients, dissolved organic carbon (DOC), conductivity, temperature, and dissolved oxygen), using nine years of data. The study was conducted for three forest watersheds of different sizes, observing both human activity and the absence of such activity. The seasonality of the abovementioned indicators was analyzed using the Colwell index. Since these indicators had not been previously used in the examined aspect, this represents a novelty for the conducted research. Additionally, the impact of extreme meteorological events, such as hurricanes and tropical storms that occurred during the study period, on the seasonality of hydrology and water chemistry in the three research watersheds was assessed. The research hypothesis is as follows: the seasonality and predictability of hydrology and water chemistry parameters in forested streams is determined by extreme meteorologic events, like hurricanes and tropical storms or droughts.

2. Study Area

The study was conducted in three forested watersheds located within the Santee Experimental Forest and the Francis Marion National Forest in South Carolina, USA. These watersheds, WS80, WS77, and WS78, represent a range of hydrological and land management conditions. Figure 1 presents the location of the investigated watersheds.

2.1. Watershed Characteristics

The study watershed WS80, located within the Santee Experimental Forest (SEF) (33.15° N, 79.8° W) (Figure 1), is representative of the humid, subtropical coastal forest throughout much of the Southeastern US. The low-gradient (<3% slope), 160 ha watershed is covered with a pine/mixed hardwood forest. This watershed, undisturbed by management activities since 1936, was established in 1968 as a control in the paired system with WS77 (below) as the treatment (Figure 1) [28]. Soils are moderately to poorly drained with low permeability and high available water capacity [43]. Approximately 60%, on average, of the event runoff is contributed by shallow surface or runoff/rainwater, with the rest by subsurface flow [44]. A detailed site description can be found elsewhere [28,43,44].
The watershed WS77, a 155 ha headwater watershed in the Santee Experimental Forest, was established in 1963 as a treatment in a paired system (Figure 1) with the objective of studying the hydrologic and water chemistry effects of prescribed burning on the poorly drained coastal plain soils [28]. This low-gradient watershed has an average slope of <2%. Soils in WS77 are mainly of a Wahee–Craven soil association, which are somewhat poorly to moderately drained sandy loam to clayey soils with seasonally high water tables [45]. Land use is predominantly forest comprising of loblolly pine (Pinus taeda L.), longleaf pine (Pinus palustris), and some bottomland hardwoods along the stream riparian bank [14,28]. The watershed underwent periodic prescribed burning during the study period. Common soils in the area are somewhat poorly to very poorly drained Aquic Alfisols and Ultisols of clayey and fine sediments, which typically contain argillic horizons at 1.5 to 2.0 m depth (Figure 1) and are influenced by seasonally high WT [45]. These topographic and soil characteristics indicate a high surface water detention capacity and slow surface water drainage. The watersheds were heavily affected by Hurricane Hugo in 1989 that damaged at least 80% of the forest canopy [46].
This study watershed WS78, draining 52.4 km2 area through a 3rd-order stream, is located at 33°08′ N latitude and 79°47′ W longitude within the Francis Marion Nation National Forest (Figure 1). The WS78 watershed is similar to other low-gradient forest watersheds in the south Atlantic coastal plain where rapid urban development is taking place [47]. The topographic elevation of the watershed varies from 3.6 m at the outlet to 14 m above mean sea level (a.m.s.l.) [48]. Land use within the watershed is comprised of 88% pine forest (mostly regenerated loblolly (Pinus taeda L.) and long leaf pine (Pinus palustris)), 10% wetlands and water, and 2% agricultural lands, roads, and open areas [49]. Detailed descriptions of forest stand types and management are provided by Amatya et al. [47] and Morrison [50]. The current forests on the watershed are a mixture of remnant large trees, natural regeneration, and about 1000 ha of planted pine [47]. The forests are managed using prescribed fire and thinning for efforts to reduce fuel hazards for minimizing the risks of wildfire as well as restoring wildlife habitat, particularly, red-cockaded woodpeckers (Picoides borealis), an endangered species, and longleaf pine in the watershed after Hurricane Hugo. The soils in the watershed are mostly poorly drained soils of Wahee (clayey, mixed, thermic Aeric Ochraquults) and Lenoir (clayey, mixed, thermic Aeric Paleaquults) series [45].

2.2. Hydrological and Water Chemistry Data

Precipitation in the watersheds WS77 and WS80 was monitored from 2011 to 2019 at the Met5 and Met25 stations, respectively, using automatic rain gauges backed by an adjacent manual gauge within each of the watersheds (Figure 1). The study period was primarily chosen because the forest stands at the study site impacted by Hurricane Hugo in 1989 [46] were assumed to be fully recovered by 2011 (22 years after the hurricane impact. This assumption was made based on Jayakaran et al. [32] who reported the start of the recovery of forest stands on nearby paired watersheds by 2004. In addition, the period included some extreme events, induced by summer hurricanes and tropical storms, providing a basis for the seasonal analysis of timeseries of hydrology and water chemistry data. Continuously measured micrometeorologic parameters, including air temperature, relative humidity, wind speed and direction, vapor pressure, and solar and net radiation, using a Campbell Scientific weather station on a tower above forest canopy in the WS80 watershed were used to estimate the Penman–Monteith (P-M) forest PET that was assumed to be the same for both the WS77 and WS80 watersheds. Similarly, a complete Campbell Scientific weather station in the WS78 watershed measured precipitation and weather variables, except for net radiation, that were used to estimate the P-M PET.
Streamflow rates (stream discharge) at the WS77 and WS80 watershed outlets were integrated to obtain daily flows normalized to mm per day by dividing by the watershed area. Discharge was calculated based on stage–discharge relationships of compound V-notch weirs using continuously monitored stream stage upstream of the weir at each gauging station. Daily flow data for the WS78 were obtained from the USGS gauging site instrumented with a real-time stream gauge sensor and a rain gauge (http://waterdata.usgs.gov/sc/nwis/uv?site_no=02172035, (accessed on 15 October 2024)), which was recently discontinued (Figure 1).
Hourly water table measurements continuously recorded in wells of about 3 m depth located in WS77 (Well J), WS78 (Wells on Rains, Lenoir, Goldsboro, and Lynchburg soils), and WS80 (Well H) were averaged to obtain daily values. Details of the hydrometeorological measurements and data processing for the paired watersheds (WS77 and WS80) as well as the large WS78 watershed are reported elsewhere [47,51,52].
Grab samples for water chemistry were collected at the stream gauging outlet of each watershed weekly or more frequently, depending upon the storm size, and analyzed for N (NH4-N, NO3-N, and total N) and total dissolved phosphorus TDP (in the form of phosphate). The sample analysis also included for stream water parameters, like temperature, pH, specific conductance, and dissolved oxygen (DO) concentrations. Water samples at the watershed outlets were collected using an automated ISCO 3700 sampler programmed with an algorithm to take samples on a flow-proportional basis. Dissolved inorganic nitrogen (DIN) was calculated as a sum of NH4-N and NO3-N, and DON was calculated as total N minus DIN. The details of water chemistry measurements and analyses are provided elsewhere [30,48,53].

3. Methods

3.1. Preliminary Data Analysis

As part of the preliminary data analysis of hydrometeorological and water quality data, descriptive statistics were calculated including minimum, mean, median, maximum, 10th and 90th percentiles, standard deviation, coefficient of variation, skewness, and kurtosis. These measures helped define the range of observations, central tendencies, potential extreme values, and data stability. The calculated descriptive statistics facilitated a more comprehensive analysis of hydrometeorological and water quality data, which is crucial for understanding their variability influenced by various factors.

3.2. The Impact of Hydrometeorological Extremes and Human Activities on Hydrology and Water Quality

The Mann–Whitney U-test was used to detect the effects of extreme hydrometeorological events and human activities on hydrology and water chemistry. The U-test is a nonparametric test to compare two independent groups [54], which, in this case, are two periods of 2011–2014 (for the pre-Hurricane Joaquin) and 2015–2019 (for the post-Hurricane Joaquin). Two research hypotheses were tested: H0: the 2011–2014 and 2015–2019 data are taken from the same population, and HA: the 2011–2014 and 2015–2019 data are taken from different populations. The U-statistic is described as:
U = n 1 n 2 + n 1 ( n 1 + 1 ) 2 R 1 n 1 n 2 n 1 n 2 + n 1 ( n 1 + 1 ) 2 R 1 n 1 n 2
where:
  • R1—the sum of ranks of elements from the first sample.
  • n1, n2—the sizes (or counts) of the first and second sample, respectively.
The test statistic is considered significant when the calculated value of the Mann–Whitney U-test exceeds the critical value for the assumed significance level of α = 0.05.
Also, the average values of each of the hydrological and water chemistry indicators were compared between the two periods 2011–2014 and 2015–2019 and also compared between seasons (dormant November–March and growing April–October) using the MANOVA method.

3.3. The Colwell Indicators

Colwell indicators [42] were calculated for daily data of flow, precipitation, air temperature, water table elevation (WTE), potential evapotranspiration (PET), total dissolved nitrogen (TDN), total dissolved phosphorus (TDP), ammonium (NH4-N), nitrate + nitrite (NO3-N+NO2-N), dissolved organic carbon (DOC), dissolved oxygen (DO), and total dissolved phosphorus (TDP) for the whole 2011–2019 period and separately for both the 2011–2014 and 2015–2019 periods. The two separate periods were considered to examine the influence, if any, of Hurricane Joaquin on water chemistry indicators. The hurricane, which occurred on 3–4 October 2015, induced extreme precipitation. The Colwell indicators are expressed by predictability (P), constancy (C), and contingency or seasonality (M). Predictability is a measure of stability of occurrence of the analyzed events. When P exceeds 50%, the regularity of occurrence of the event is above average; when it is less than 50%, the regularity of the event is below average. The measure of seasonality of the studied events is given as the index M. When it represents at least 50% of predictability, seasonality is regular; when the M is below 50%, seasonality is irregular [42]. The values of P, C, and M vary in the interval (0,1). Constancy C takes on the maximum value (C = 1) if the analyzed variable has the same value for all the studied periods. The index of contingency M takes on the maximum value (M = 1) when the value of the variable is different in successive time steps, but the occurrence of the given values is predictable. Colwell’s indices are determined based on frequency matrices of the studied event, where columns describe the studied periods of its occurrence and rows show states of the event. The values of states are most often described by means of class intervals whose number is selected intuitively. The Colwell indicators were calculated based on equations described by [41].

4. Results and Discussion

4.1. Comparison of Data from the 2011–2014 and 2015–2019 Periods

4.1.1. Hydrologic Variables

The exploratory statistics of analyzed parameters for WS80, WS77, and WS78 are presented in Table A1, Table A2 and Table A3 for the two separate periods, 2011–2014 and 2015–2019 (2015–2018 for WS78), in order to examine the impact of Hurricane Joaquin, if any, on hydrological processes. It is evident from the statistics for the watersheds that the post-2014 period means of the hydrological parameters, flow and precipitation, were the highest, and WTE the lowest compared to the 2011–2014 period. Large differences were observed for flow in each watershed, with their average values almost three times higher, and WTE almost two to three times shallower in the 2015–2019 period compared to 2011–2014 in WS80 (Table A1). In the 2011–2014 period, shallower mean WTEs were observed on Rains and Lenoir and were deeper on the Wahee and Goldsboro series compared to the 2015–2019 period (Table A3). A maximum WTE, exceeding 13 cm above ground level, was observed in Rains soil after high rainfall (event 23 September–9 October 2015) (Table A3). After the year 2014 (2015–2019), much shallower WTEs were observed compared to the 2011–2014 period. Maximum differences in the mean WTEs were found for Rains soil (271%) followed by Goldsboro (125%). After the heavy rainfall event of 23 September–9 October 2015, maximum WTEs of 40.7 cm and 32.6 cm above ground level were observed for Lenoir and Rains soils, respectively. In case of WS78 (Table A3), a higher average flow and deeper WTEs, except for Rains and Lenoir soils, were observed compared to WS77 and WS80 (Table A1 and Table A2). Higher outflow in WS78 can be attributed to the harvesting and thinning effects in parts of forest area in WS78 with or adjacent to these wells on this watershed (see Appendix A Table A1) [47], as these treatments can reduce evapotranspiration, increasing WTE and recession flow characteristics [55]. On all the watersheds, higher variabilities, expressed by the standard deviation and coefficient of variation, were observed in flow, WTE, and precipitation in 2015–2019 than the earlier 2011–2014 period. In case of precipitation, the difference in average values between the two periods is smallest, with the second period yielding 26% higher compared to the first period, for all the watersheds. The range of annual precipitation in 2011–2019 varied from 934 to 2171 mm, from 977 to 2146 mm, and from 1040 to 2243 mm in WS80, WS77, and WS78, respectively. The average annual precipitation for the period 2011–2019 was equal to 1476, 1497, and 1533 mm for WS80, WS77, and WS78, respectively, all of which were higher than the long-term average precipitation of 1370 mm reported by [56] for the 1946–2008 period. The average annual precipitation of 1533 mm on W78 in the 2011–2019 period was higher than 1470 mm, as reported by Amatya et al. [47] for the 2005–2021 period. However, the range of variability of precipitation in 2011–2019 on the three analyzed watersheds was similar to those reported by Dai at al. [56] and Amatya at al. [47]. In the case of the PET, similar relationships, like precipitation, were observed. The annual PET of 1172 mm in WS80 in the 2011–2019 period was slightly (~4%) higher than the value reported by Dai et al. [56]. The higher annual precipitation and lower PET for the period 2011–2019 compared to 2005–2021 in WS78 caused the higher annual flow (426 mm) to equal 426 mm compared to 362 mm in the later period, reported by Amatya et al. [47].
Similarity between PET from the two compared periods may be explained by a small difference in temperature (average temperature in the 2015–2019 period was about 5.5% higher than in 2011–2014), solar radiation, and forest cover, because the PET is the most robust climatic predictor of forest biomass [57]. As all the study watersheds, except the control (WS80), go through only a minimal treatment for restoration practices, they were all assumed to be in a good growth condition and fully recovered since the impacts of Hurricane Hugo in 1989 [28,47]. Since the index P/PET of 1.05 and 1.45 for both periods exceeds unity, excess water was assumed to be available for streamflow and groundwater recharge, supporting aquatic ecosystems. Ojima et al. [58] showed that the P/PET index of Southeastern US forests is higher than unity, consistent with Amatya et al. [59], indicating that these systems were rather energy-limited. Ojima et al. [58] also reported that areas where P/PET is higher than unity may be less vulnerable to lower P and higher PET, causing drier conditions, but in some cases, they may be more vulnerable to flooding, if a higher P is associated with more extreme rainfall [60]. In the case of the study watersheds, higher precipitation in the 2015–2019 period caused an increase in the P/PET ratio, which was mainly caused by extreme precipitation events, like the one on 3–4 October 2015 during hurricane Joaquin (https://weather.com/news/news/south-carolina-historic-flood-rainfall-record-extreme, accessed on 27 April 2023, South Carolina Department of Natural Resources 2022).

4.1.2. Water Chemistry Indicators

High variability in all analyzed water chemistry indicators was observed on each watershed between the two periods, with higher differences for some indicators between the periods in WS80. The smallest variations in chemical indicators observed in WS78 (Table A3) were likely attributed to its much larger size compared to WS80 and WS77 (Table A1 and Table A2), buffering the variability of concentrations. The highest decrease in average concentration in the later period was observed for NO3-N+NO2-N, with more than 65%, 47%, and 46% decreases for WS80, WS77, and WS78, respectively. The smallest reduction of almost 8% between the two periods was observed for conductivity. An increase in the concentrations of TDP and NH4-N in the range of 36% and 26%, respectively, was observed in WS80 during the second period. On the other hand, all water chemistry parameters in WS77 were reduced during the 2015–2019 period compared to 2011–2014. In the 2015–2019 period, higher reductions of 47% and 32% in average values were observed in WS77 for NO3-N+NO2-N and conductivity, respectively. The smallest difference of 11% between the two periods was observed for DOC on watershed WS78, which yielded an increase in DO concentration of 28% in the 2015–2019 period compared to 2011–2014 (Table A3). For the rest of the chemical indicators, concentrations decreased from the first to the second period differences.

4.1.3. Statistical Evaluations and Responses of Water Chemistry on Rainfall Events

Differences in analyzed parameters, based on statistical significance tests for both periods are presented in Table 1, with very similar results for all watersheds. Among hydrological parameters, differences in only flow and WTE between the two periods were found to be statistically significant with p = 0.00. Despite a lack of statistically significant difference in precipitation, a more than 20% increase in precipitation was observed for the period after 2014, resulting in an increase in both the P/PET ratio as well as WTE in 2015–2019; although, PET was stable as stated above in both the periods. The conductivity in WS80 was found to be not statistically different (p = 0.24) between both periods in contrast with WS77, in which the difference was statistically significant (p = 0.000). Conductivity is a measure of water’s capability to pass electrical flow. This ability is directly related to the concentration of ions in the water and its value can be determined by soil properties, mainly soil salinity, clay content, cation exchange capacity (CEC), clay mineralogy, soil pore size and distribution, and soil moisture content observed in soil layers [61]. The difference between conductivity in WS80 and WS77 watersheds can be caused by dissolved ions. For example, the average pH in WS80 in 2011–2019 was 5.77 compared to 5.09 in WS77. Conductivity is related to pH such that the lower the pH value, the higher the conductivity parameter. This relationship is correct for pH values less than 7. For example, Aini et al. [62] reported a significant negative correlation between conductivity and soil pH on an oil plantation site.
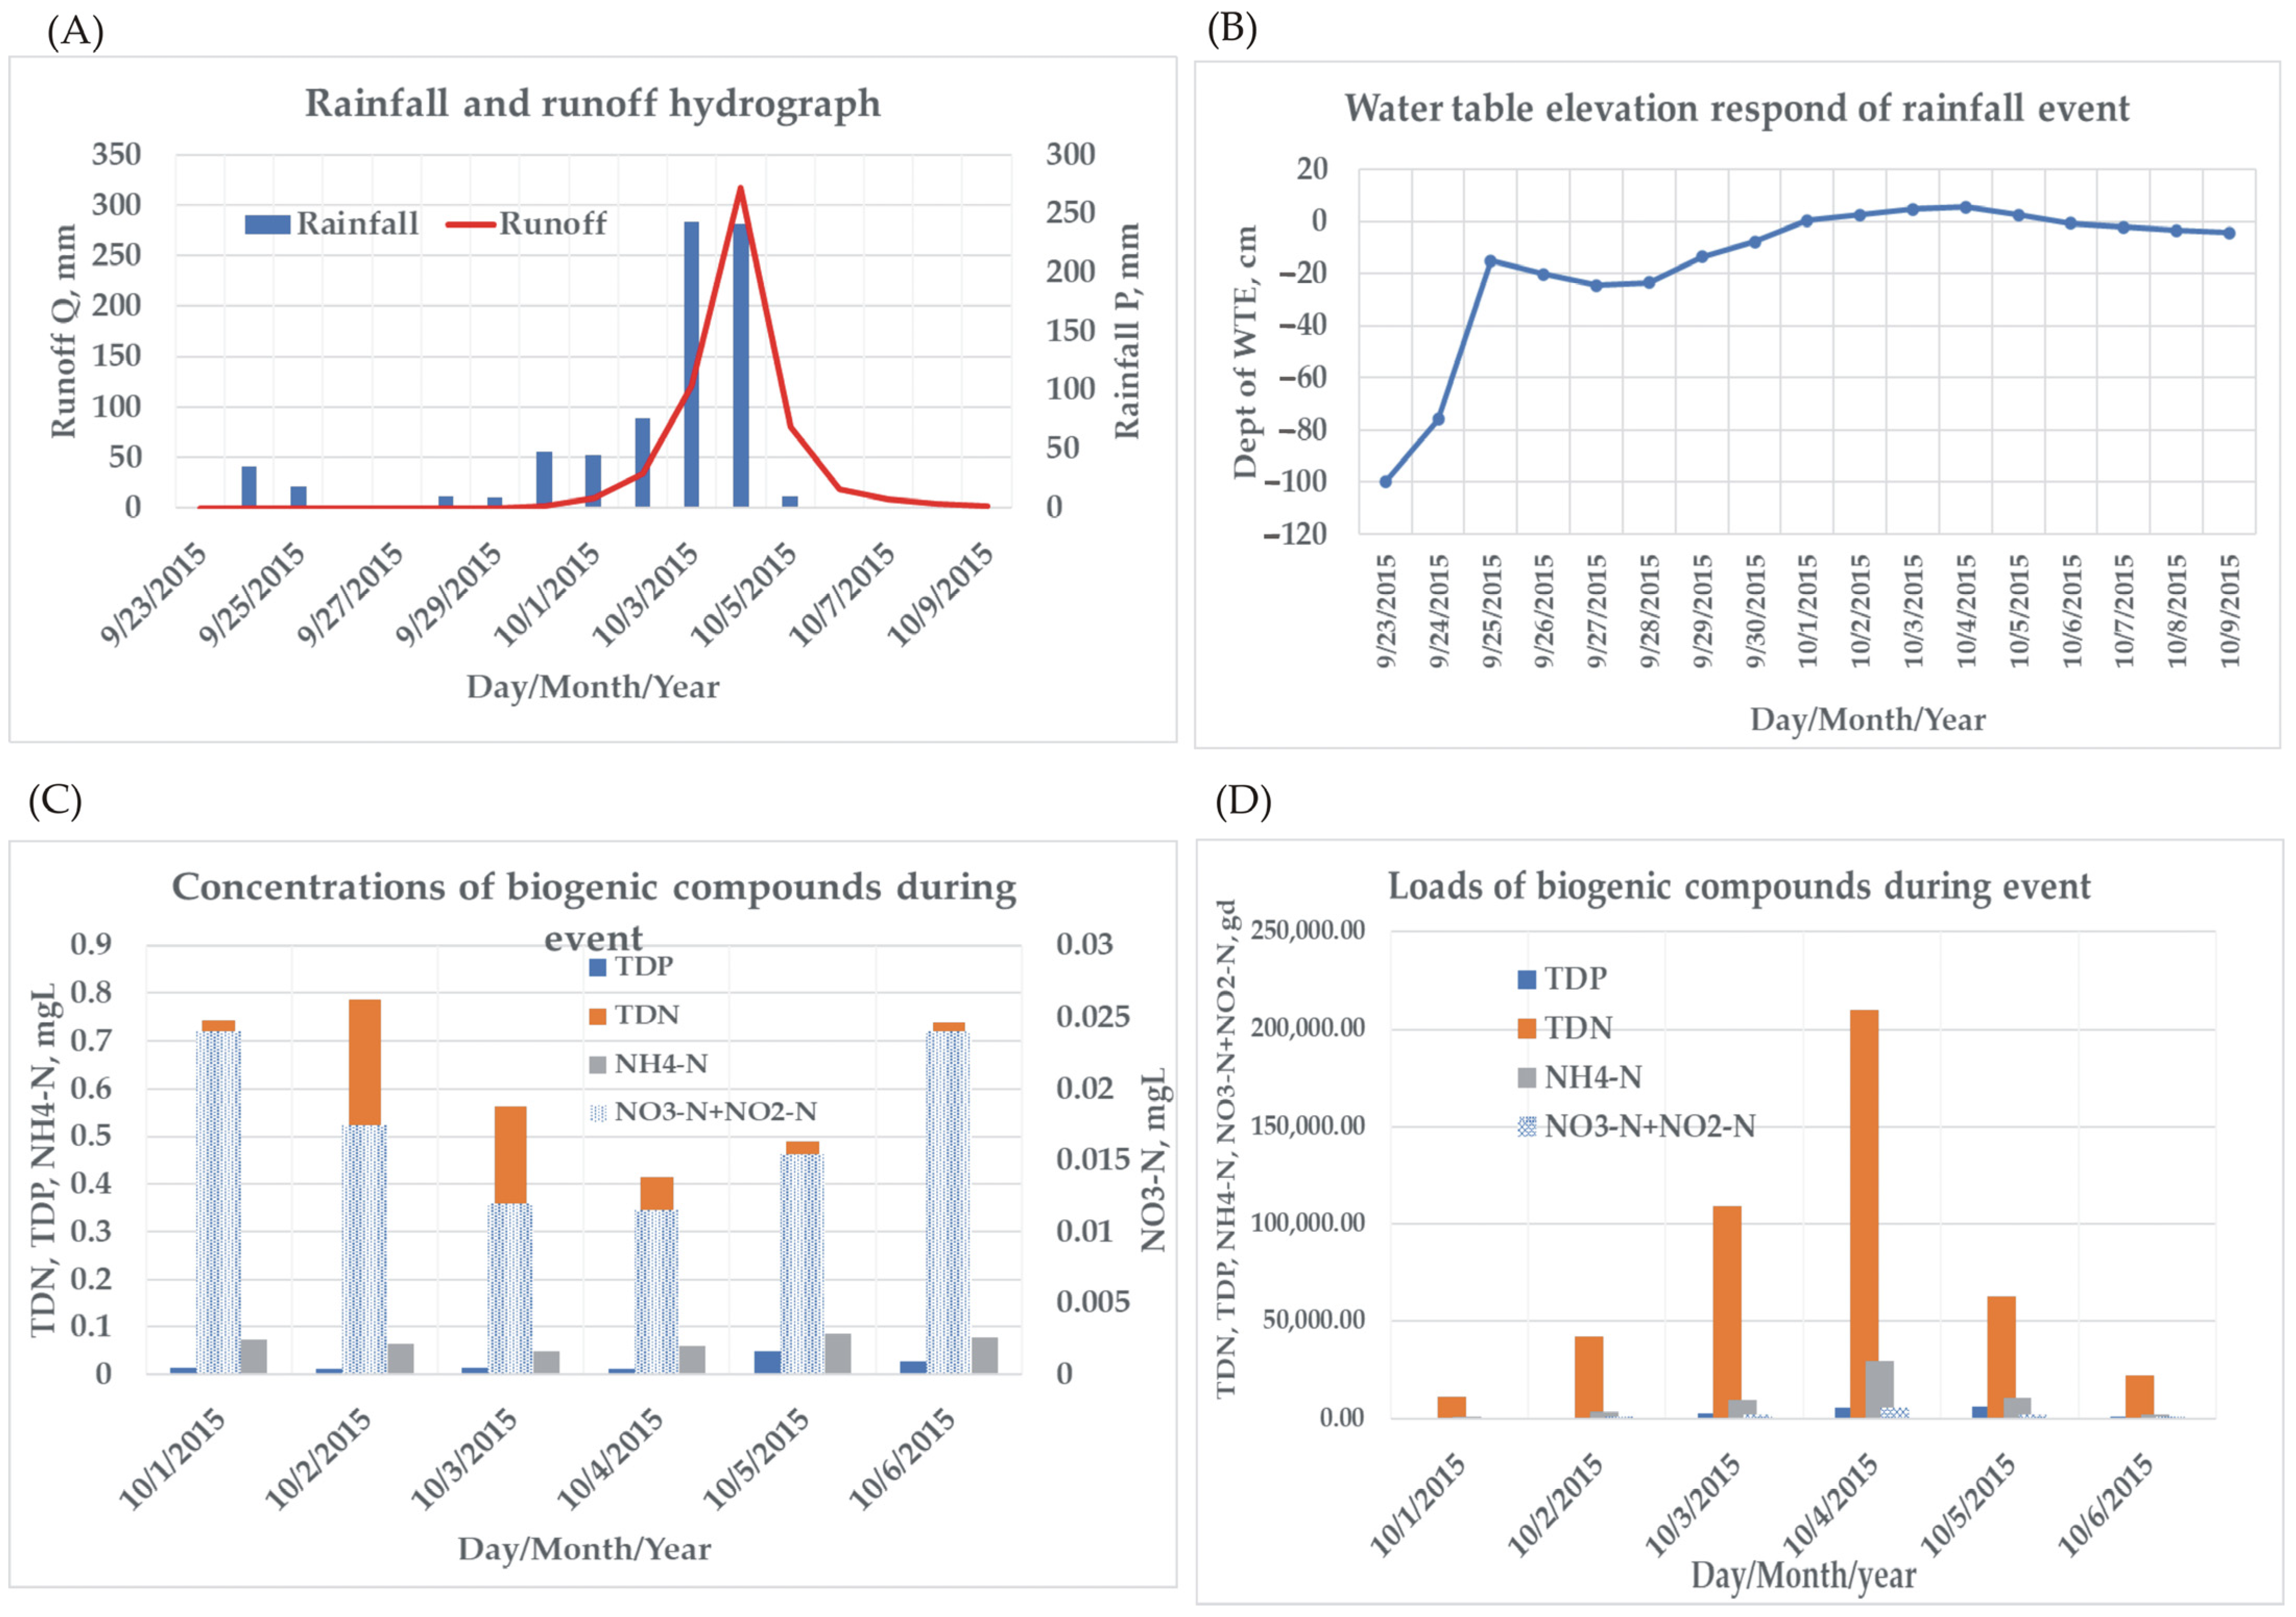
Higher flows and WTE in 2015–2019 compared to 2011–2014 promoted a higher dynamic outflow of nutrients and DOC. A statistically significant (α = 0.05) difference for almost all chemical indicators was observed. Li et al. [2] noted that excess runoff on high WTE conditions, promoting shallow flow path, can accelerate the mobilization of particulates and carbon- and nitrogen-containing solutes, such as DOC and nitrate from topsoil. This is particularly noticeable in agricultural areas, where large hydrological events, such as storms and rain-on-snow, flush out nutrients in topsoils, making water chemistry especially vulnerable to shifting hydroclimate patterns. On the other hand, Li et al. [2] reported that rainfall intensity had only a small influence on nutrient concentrations in runoff, with a decrease in nutrient loss on flat watersheds because of the increase in infiltration. Also, the authors noted that the soil texture, porosity, and water content influenced both the soil water transport and the transformation of nutrients in the soil through oxidation and reduction processes. It is true that extreme flow and WTE, especially in flat areas, depend on precipitation intensity and duration, as is shown in Figure 2 for an extreme precipitation event that lasted from the last day of September to the beginning of October 2015 in WS80 and in Figure 3 in WS78. This was also shown by Amatya et al. [60] for WS80 and another adjacent WS79 watershed. During this event, the WTE increased from 29 September 2015 with increased precipitation. The WTE peaked on 4 October 2015, with a ponding equivalent to 5.4 cm above ground level. The observed maximum WTE lagged one day to a maximum precipitation of 241.4 mm and rate peak flow of 316.6 mm that occurred on 4 October 2015. It is evident that maximum flow depends on precipitation, soil saturation, and an increase in the WTE, resulting in filled soil storage capacity, reduced water infiltration, and the potential occurrence of overland flow. During this extreme event, different temporal distributions of TDN, THP, NH4-N, and NO3-N+NO2-N compounds were observed. This is consistent with Li et al. [2] who reported that extreme wet conditions connect rivers to uplands that are often disconnected under nonflooding conditions, leading to disproportionally large pulses of “stored” legacy solutes and nutrients entering rivers. In the case of the TDN and NO3-N+NO2-N, their concentrations decreased due to dilution, as the WTE and flow increased. After the flow and WTE decreased, concentrations of both forms of nitrogen increased again. Regarding NH4-N, at the beginning of this event, a slight decrease in its concentration was observed until the peak flow, with an increase afterwards. Similar behavior was observed for the TDN, with an increased concentration after peak flow and WTE. From a practical management point of view, knowledge about the export of biogenic compound outflow to stream during storm events is very important. For example, nutrient load dynamics during an observed event are presented in Figure 2. For all analyzed biogenic compounds, strong relationships between the runoff and loading were observed, as expected, with the maximum loads for all of the parameters occurring at the same time, like the maximum flow. Nutrient loads, which are quantified as a product of nutrient concentration and stream discharge, typically increase with discharge regardless of concentration–discharge relationships, because discharge often rises by orders of magnitude as the system transitions from dry to wet conditions, far exceeding the typical within-an-order change in solute concentrations [2]. In period after the peak flow, the nutrient loads indicated decreasing trends. It was evident that flow determines the loading of transported nutrients during storm events [26,63]. It suggests that nitrogen, particularly the particulate form (e.g., TKN), in streams are observed mainly from surface/overland runoff. The results were confirmed in a study by Bhat et al. [64], who reported 73%, on average, of the observed total nitrogen load at the forested watershed outlet was contributed by the surface runoff during storm events. These authors suggested that the surface runoff during the storm events washed off the nitrogen from the forest floor and transported it to the stream. Distributed loads of nitrogen suggest the effects of “first flush”, especially for TDN and NH4-N, which can be linked to a dominant soluble form of these compounds. However, NO3-N and NO2-N did not yield such strong relationships with flow.
These data indicate that the flush mechanisms of nutrients due to an event soon after a dry period [17] can be distinguished between the particulate and dissolved matters or rapid hydrological response of a watershed to rainfall events, particularly in a small headwater catchment, like WS80. Based on a study performed on an agricultural watershed, Jiang et al. [65] showed that the concentrations of particulate forms of nutrients derived from soil erosion were related to surface runoff. However, in the case of the NO3-N, this soluble form of the N likely originates from the near-surface soil layer associated with the rising shallow groundwater table and is mainly flushed with subsurface runoff or drainage [17,66]. Possibly similar mechanisms have occurred for these low-gradient WS80 and WS77 watersheds on high water table soils [14,30,53].
In case of watershed WS78, which is larger than WS77 and WS80 (Figure 3), approximately a one-day lag can be observed between a maximum precipitation of 271.4 mm occurring on 4 October 2015 and a maximum daily flow of 256.8 mm on 5 October 2015. Amatya et al. [47], however, found a higher correlation of peak flow rate with 48 h than the 24 h precipitation in this watershed. Similar to WS80, maximum peak flow occurrence on this watershed also coincides with the WTE elevation. However, a similar response of WTE rising to the surface was observed for all series of soils [67], except for the Rains and Lenoir, in which WTE rose above ground with maximum ponding depths of 31.9 cm and 40.7 cm, respectively. Despite the lowest WTE at the beginning of the storm event on 4 October 2015, the groundwater table on Wahee soil also rose above the soil layer, achieving a ponding depth of 15.4 cm. The lowest peak WTE during this event was observed for the well-drained Goldsboro soil series with a ponding depth of just 1.6 cm above ground. Results show that the wells at the Wahee and Lenoir series, as poorly drained soils, had the shallower WTEs, potentially due to their lower infiltration rates compared to the Goldsboro and Lynchburg series (https://soilseries.sc.egov.usda.gov/OSD_Docs/L/LENOIR.html, accessed on 1 May 2023).
Due to its much larger drainage area than the WS80 and WS77 watersheds, the WS78 watershed yielded the highest concentration time, exceeding 24 h [47], resulting in the lagged response of the watershed to rainfall events. Accordingly, peak flow rate on Turkey Creek (WS78) was dampened with a slightly lower value compared to smaller watersheds. This is consistent with Fu et al. [68], who reported that the peak flow value depends on the size of catchments, main channel length of the watershed, the mean slope gradient of the watershed, and land cover. Moreover, higher organic content and extensive, relatively deep root systems create highly macroporous soils, low bulk density, and high saturated hydraulic conductivity and infiltration rates. As a consequence, subsurface flow pathways dominate in forested watersheds compared to agricultural and grassland areas. These factors also influence the dynamic transport of nutrients [69].
However, in case of the chemical indicators, although their data during the peak flow event were lacking unfortunately, it is evident from the plots in Figure 3 that concentrations of TDN and NH4-N are decreasing and that of NO3-N+NO2-N and TDP are increasing with increasing flow. The dynamics of nutrient indicators were similar to that in WS80, except for the NO3-N+NO2-N, concentrations of which decreased during peak flow. Generally, slightly lower concentrations of all chemical indicators observed in the WS78 watershed compared to WS80 were attributed to the larger drainage area of the watershed, with higher flows potentially diluting the concentrations of analyzed indicators. Similar to WS80, nitrogen loads in the WS78 watershed also increased with increasing flow.

4.1.4. Seasonality Variation in Hydrologic and Water Chemistry Indicators

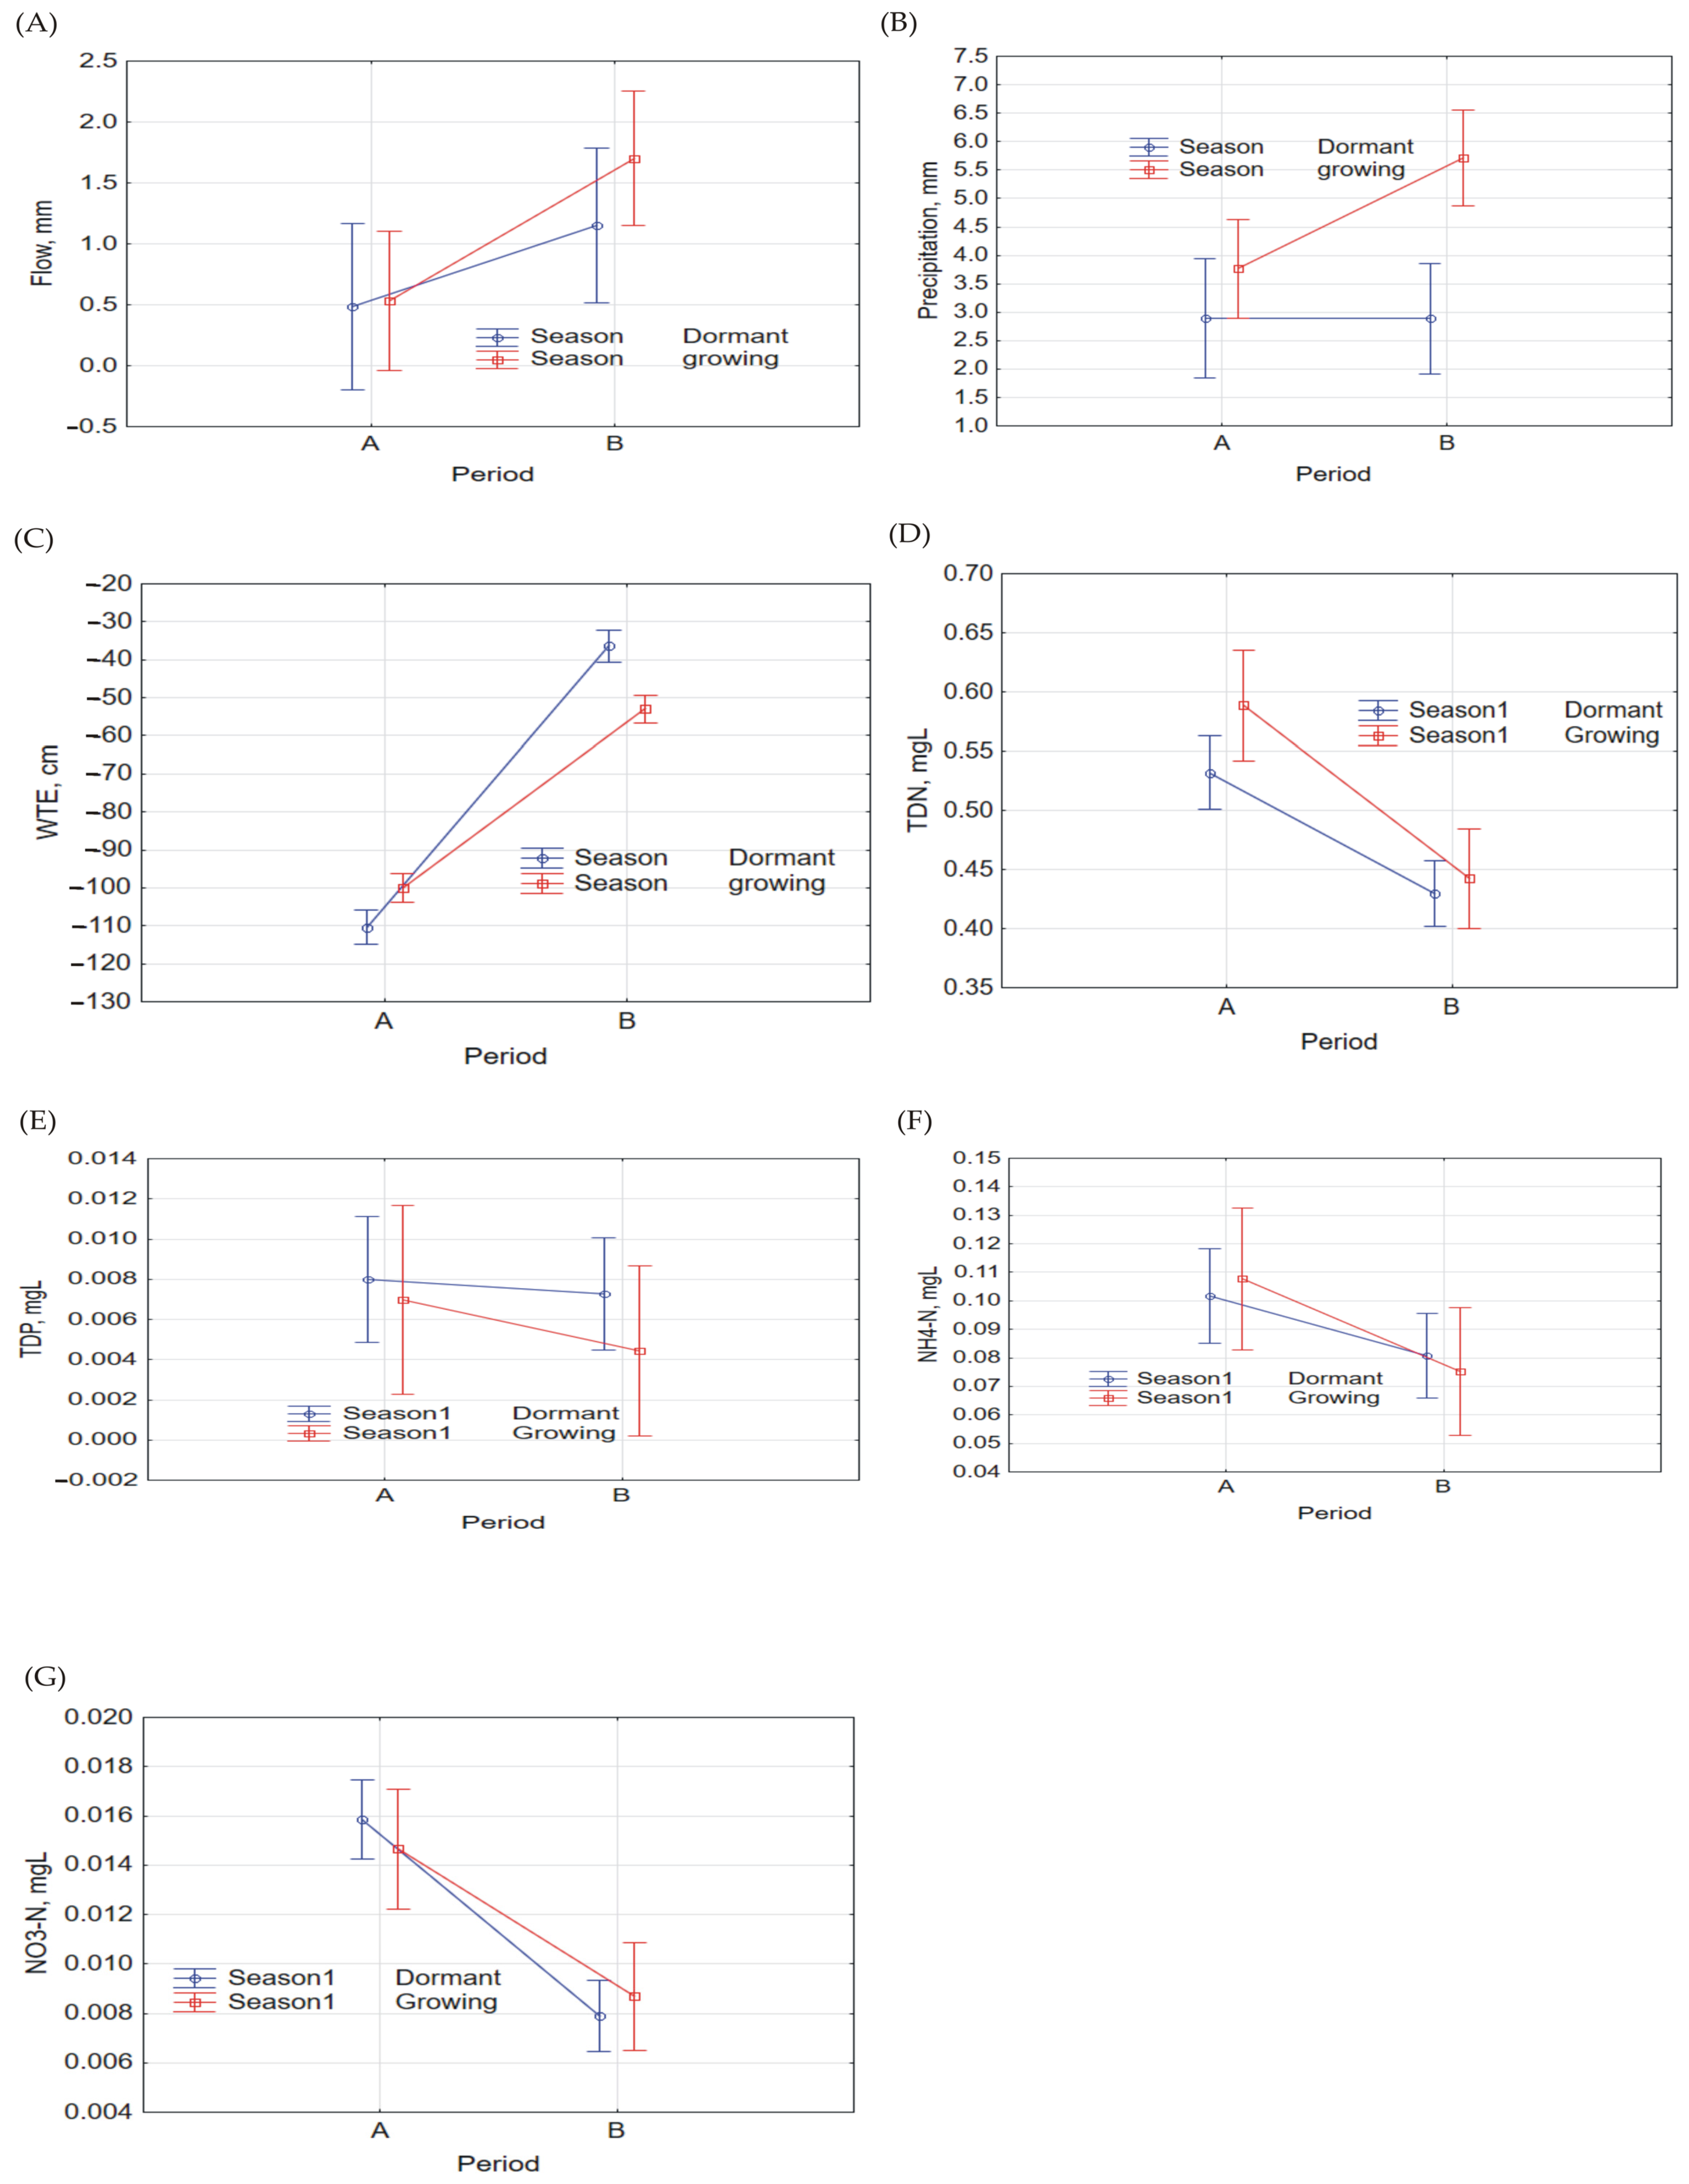
Plots in Figure 4 show seasonal variations in hydrological and nutrient indicators for WS80. A strong relationship for flow is evident only between periods, but not for seasons. As described above, flow was also substantially higher during the 2015–2019 period with higher precipitation compared to the 2011–2014 period. Differences in flow between the dormant and growing seasons are negligible (p = 0.648), despite a significant difference in observed precipitation between the two seasons (p = 0.000). An increase in precipitation during the growing season did not necessarily increase the flow due to lower WTE caused by higher PET (Figure 4A–D). The WTE elevation seems to be influenced by the PET (Figure 4C,D). The lower dormant season PET (e.g., evaporative demand) along with the lower canopy leaf area compared to the growing season (statistically significant difference, p = 0.00) likely reduced the interception loss of precipitation, resulting in a higher WTE than in the growing season (statistically significant, p = 0.000). Harder et al. [43] reported that daily outflows in the WS80 were sensitive to rainfall event sizes and to the antecedent WTE. In addition, the authors concluded that a large flow corresponded to large rainfall events with water table positions already close to the surface, and most of the large surface runoff events potentially occurred under saturated soil conditions.
Nutrients also indicated variability in their concentrations between periods as well as seasons (Figure 4). For example, the average TDN concentration was lower in the 2015–2019 period compared to 2011–2014 for both the dormant and growing seasons. The growing season average TDN concentration in 2011–2014 was slightly higher than in the dormant season (not statistically significant though, p = 0.453), but in 2015–2019, the average value between the two seasons was the same. Lower TDN concentrations in both seasons in the 2015–2019 period can be attributed to higher flows causing the dilution of this parameter. Differences, but not significant ones, in TDP concentrations were observed for both seasons (p = 0.076) and periods (p = 0.138). In the 2011–2014 period, TDP was slightly higher in the dormant season compared to that of the growing season. This is likely due to the reduced assimilation of phosphorus by vegetation and plants during the dormant season, resulting in its increased outflow concentration. In the 2015–2019 period, large differences between TDP concentrations in dormant and growing seasons were visible (Figure 4). TDP could possibly have been exported via shallow overland saturated outflow in the 2015–2019 period with observed higher precipitations and flows. The NH4-N concentration increased in both seasons, with a stronger increasing trend during the growing season. Changes in NH4-N were nonsignificant between the seasons (p = 0.390) but significant between periods (p = 0.009). NH4-N is mineralized nitrogen and can be flushed during high flows and/or first flows after a dry period [17], However, in case of the NO3-N+NO2-N, a statistically significant negative trend (p = 0.000) was observed between analyzed periods, with a higher slope during the dormant season. For example, in the 2011–2014 period, the average NO3-N+NO2-N concentration was lower in the growing season compared to that of the dormant season; although, the average concentration was almost the same, with no significant difference (p = 0.144) for both seasons in the 2015–2019 period. The lower concentration of NO3-N+NO2-N in the 2015–2019 period could likely be explained by dilution during large precipitation events resulting in high flows and shallow WTE. For example, Tian et al. [66] reported that precipitation and WTE significantly regulated temporal annual nitrate concentrations at a loblolly pine plantation site in the Atlantic Lower Coastal Plain of North Carolina, United States. Seasonal variations in hydrological and nutrient indicators in WS77 are shown in Figure 5.
The flow, precipitation, WTE, TDN, and NO3-N observed in WS77 yielded relationships similar to those for the WS80 for periods as well as seasons (Figure 4 and Figure 5). Flow and WTE in WS77 yielded higher differences in their averages between the seasons during the 2015–2019 period compared to 2011–2014. However, differences between seasons for flow were insignificant (p = 0.299) but significant between periods (0.001). The response of WTE was also similar, with an insignificant difference between seasons (p = 0.131) and significant between periods (p = 0.000). Similarly, TDN differences between seasons were insignificant (p = 0.068) and significant between periods (p = 0.000). TDP in WS77 showed a slightly decreasing concentration in 2015–2019 compared to the 2011–2014 period. In addition, lower, but not significant (p = 0.333), TDP concentrations were observed during the growing season in both periods, likely due to higher plant uptake of phosphorus from the soil and vegetation compared to the dormant season with reduced vegetation biomass. Higher TDP concentrations were observed in the outflow only after heavy storms. The tendency of the NH4-N response in WS77 was opposite to that observed in WS80. For example, a decreased concentration trend of NH4-N in WS77 was observed in the second period with an insignificant difference between seasons (p = 0.982). A decreasing trend of nutrients in WS77 was likely caused by dilution during high outflow after heavy precipitation and partly due to prescribed burning that might have removed most of the understory vegetation potentially reducing N uptake.
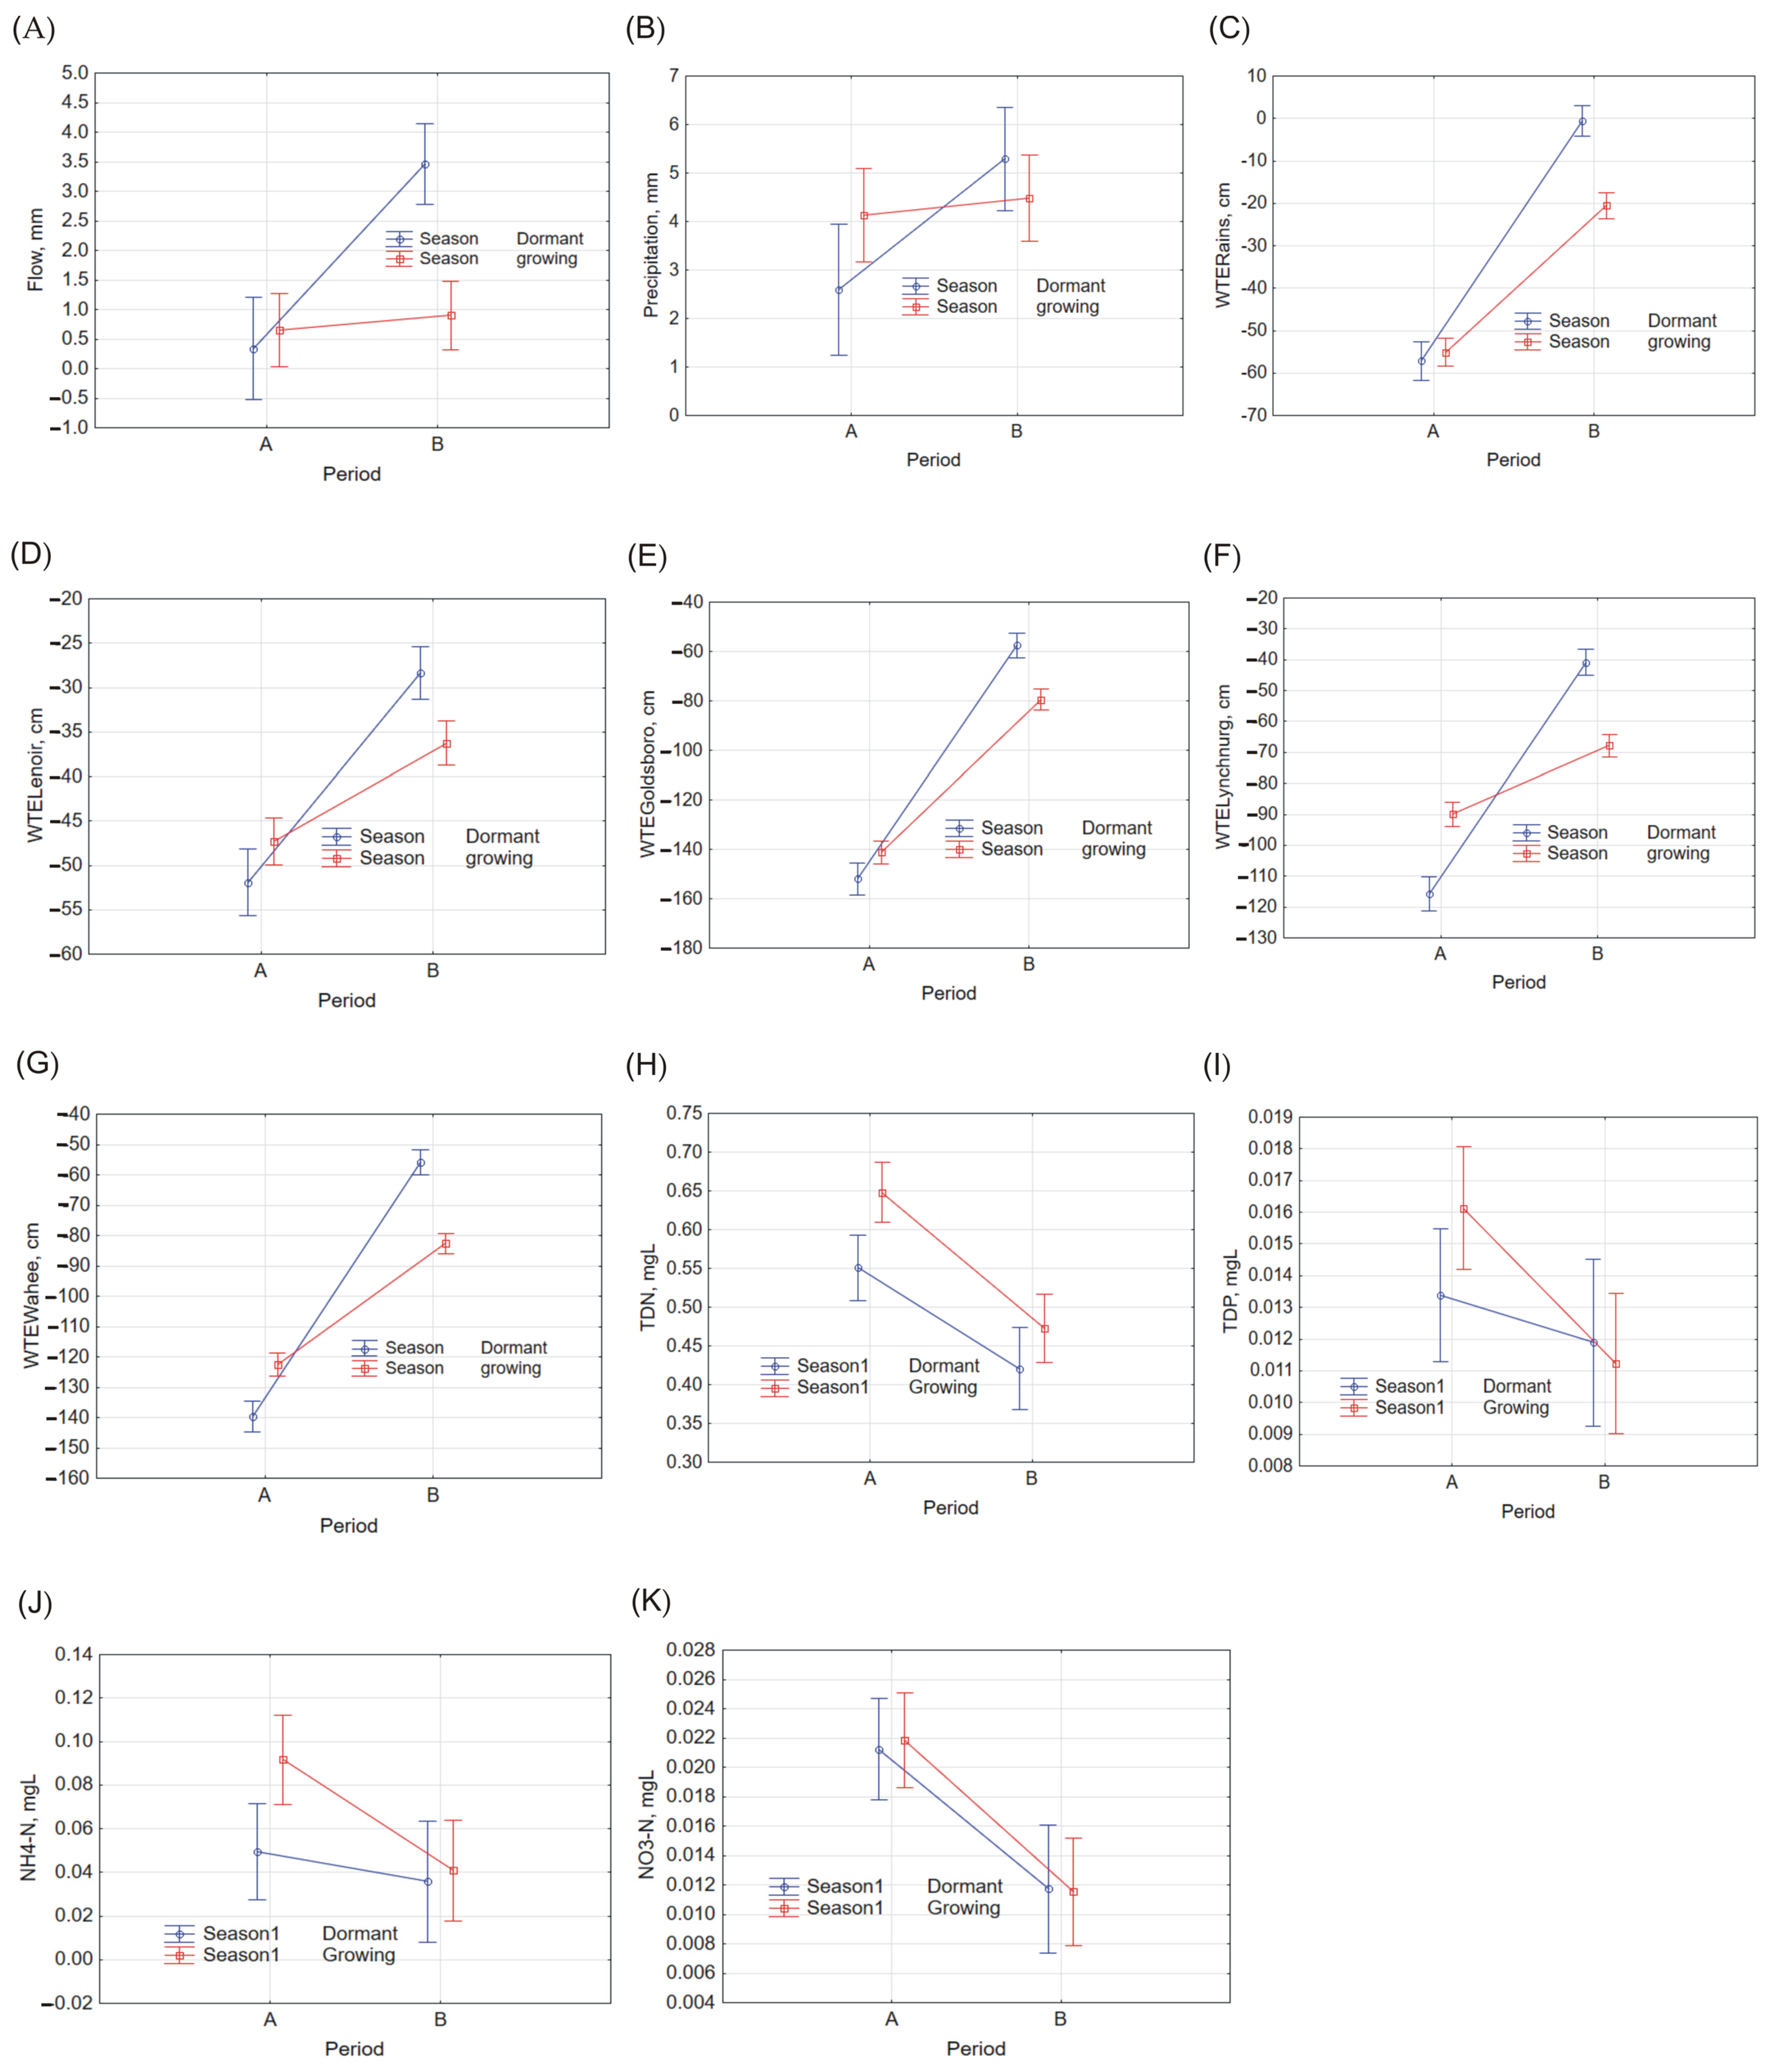
Seasonal variations in average values of hydrological and nutrient indicators in the WS78 watershed are presented in Figure 6. Results for flow indicator in Figure 6 show no substantial difference between dormant and growing seasons of the 2011–2014 period. However, a much larger difference between seasons is observed in 2015–2019 when dormant season flow was more than twice that of the growing season; although, the difference between the growing seasons in both periods is negligible. On the other hand, differences in flow between seasons for analyzed periods are significant (p = 0.001). These results are completely different compared to those observed in the small WS80 and WS77 watersheds. It can be likely explained by precipitation, where, similar to flow, differences between growing seasons for both periods were negligible, but significantly (p = 0.03) different precipitation means were observed in the dormant season, with the higher precipitation in the 2nd 2015–2019 period. Similarly, the higher WTE is also a factor that influences higher flow in the dormant season. For all analyzed soil series, higher WTE is evident in the dormant season of 2015–2019 and higher WTE in the growing season of 2011–2014 (Figure 6). It is attributed to higher precipitation in the growing season of 2011–2014 and the opposite relationship with the higher precipitation during the dormant season of 2015–2019. Significantly higher WTEs were observed for all four soil series (Rains, p = 0.031; Lenoir, p = 0.03; Lynchburg, p = 0.000; Wahee, p = 0.000) for both seasons in the 2015–2019 period than in the 2011–2014 period. Similar results in the WTE are observed for both periods for all series. In the Lynchburg series, the difference in WTE between the 2011–2014 and 2015–2019 periods for the growing season was smaller. An insignificant (p = 0.149) difference in WTE between the seasons was found only for the Goldsboro series. Generally, a tendency in the seasonality of the WTE in WS78 was quite similar to that observed in WS80 and WS77.
Regarding nutrient indicators, TDN concentration was relatively higher in 2011–2014 compared to the 2015–2019 period for both seasons, but with higher growing season concentrations than in the dormant season. Differences between seasons were statistically significant (p = 0.001). These relationships were similar to the rest of the watersheds (WS77 and WS80) (Figure 4 and Figure 5, plots for TDN). Similar to TDN, TDP concentrations resulted in a much higher difference between seasons in the 2011–2014 period than in 2015–2019. An opposite tendency was observed in the 2015–2019 period. Differences between seasons for TDP concentrations were not statistically significant (p = 0.424). This may likely be attributed to some silvicultural operations, like the thinning of some parts of the forest, which influences the transportation of phosphorus and its bioavailability in soils and water [70]. However, the relationships and tendencies observed for NH4-N and NO3-N+NO2-N concentrations were similar to those of TDN observed in WS80 and WS77. In case of the NH4-N and NO3-N, differences between seasons were significant with p = 0.049 and p = 0.000, respectively.

4.2. Predictability of Hydrology and Water Chemistry

4.2.1. Hydrological Indicators for Period 2011–2019

Computed values of Colwell indicators for predictability, P, are presented in Table 2, Table 3 and Table 4 for all three study watersheds. The indicators were calculated based on daily data for the whole period 2011–2019 as well as individually for the 2011–2014 and 2015–2019 periods. For the whole period, predictability for the flow was slightly above average, equal to 0.56 and 0.53 for WS80 and WS77, respectively (Table 4). However, a lowest average predictability of 0.45 was calculated for the WS78 watershed (Table 4). The fact that the computed contribution constancy, C, in predictability C/P was equal to 0.60 and 0.59 for WS80 and WS77, respectively, shows a similar hydrological regime in both watersheds. The lowest C/P of 0.50 was in WS78. Despite its lowest predictability, P, the results show quite a similar stability of flow in WS78 (Figure A3).
The seasonality component of predictability, P, plays an important role in the flow regime of WS78. Since the calculated C/P = 0.50 for this watershed, it shows that seasonality, M, explains 50% of predictability, which is a higher contribution compared to WS80 and WS77, where seasonality, M, explains 40 and 41% predictability, respectively. Radecki et al. [41] reported that seasonality plays a lesser role in total predictability in smaller watersheds compared to that on the larger watersheds. Moderately drained soils, such as Goldsboro and Lynchburg, in WS78 watershed, can enhance higher soil water storage during the growing season, and thus, the seasonality component in total predictability can likely increase. For example, Iliopoulu et al. [71] reported that storage mechanisms, groundwater-dominated basins, and slower catchment response times observed in larger watersheds amplify their seasonality. Higher flows were generally determined mainly by extreme precipitation events, and a lack of or low flow due to days without precipitation (Figure A1, Figure A2 and Figure A3). For all watersheds, similar P, C, and M values were calculated for the precipitation. In the case of flow, the same value of p = 0.53 was obtained for WS80 and WS77, but a slightly lower value (0.45) was found for WS78. The fact that the computed predictability for WTE is the lowest for all watersheds (Table 2, Table 3 and Table 4) suggests a more random behavior of the WTE variability. Interestingly, a much higher effect for constancy than seasonality was observed in the total predictability of the WTE for the WS77 and WS78 watersheds (Table 3 and Table 4). A smaller predictability, P, of WTE (0.40 for WS80, 0.45 for WS77, and 0.38–0.52 for WS78), compared to other hydrologic variables, can cause the higher variability of WTE in particular days of each year on all analyzed watersheds (Figure A1, Figure A2 and Figure A3). Notably, both the WS77 and WS78 watersheds often undergo similar silvicultural treatments, like prescribed burning and thinning, both of which may temporarily affect WTE through ET/water uptake.

4.2.2. Water Chemistry for Period 2011–2019

Regarding nutrient indicators observed during the 2011–2019 period, the highest predictability of 0.73, 0.69, and 0.74 for TDN was found for WS80, WS77, and WS78, respectively (Table 2, Table 3 and Table 4). In the total predictability of the TDN for each watershed, constancy, C, played a higher dominant role, with C/P at about 90%, indicating that seasonality had only a marginal effect in the TDN regime; in other words, TDN concentration might have yielded similar variabilities in each year. The predictability of NH4-N and NO3-N+NO2-N was lower compared to the TDN, yielding a range of 0.36–0.53 for all watersheds. A slightly higher predictability for NH4-N and NO3-N+NO2-N values was obtained for WS77. Again, constancy dominated in the total predictability, with C/P at about 59% or higher for both of these indicators as well. A predictability of approximately 0.50 within the above range was also obtained for the TDP in the WS80 and WS77 watersheds for the whole period. In addition, similar to other chemical indicators, constancy played a more dominant role in the total predictability of the TDP than the seasonality. In the case of the WS78 watershed, the total predictability of the TDP was also the highest, equaling 0.68. Similar values of Colwell’s indicators (P, C, and M) showed that the predictability of nutrient concentrations in both the WS77 and WS80 watersheds was determined by the same processes. Like in the WS77 and WS80 watersheds, in the WS78 watershed, except for the TDP, similar hydrologic processes, like shallow subsurface runoff generation, in most cases, based on water table position determined by a balance of rainfall and ET Appendix A [47,52], determined the predictability of the chemical indicators. The larger size of watersheds, periodical forest thinning, and prescribed burning, which potentially reduces ET and increases WTE, giving rise to shallow surface runoff during large storm events, may play a role in the higher predictability of the TDP. This result is supported by studies by the authors of [30,53], who reported that nutrient variability depends on the size of watershed, land use, and vegetation type.
DOC, similar to other parameters, yielded the same structure of predictability. As stated above, constancy played a dominant role, with C/P > 89% compared to seasonality in all study watersheds. The total predictability of DOC in WS80 was higher (0.75) than in WS77 (0.67), which was the same as in the WS78 watershed with similar silvicultural treatments, as stated above. The lower predictability value of DOC in WS77 could likely depend on the variability of WTE. A large value of C/P of 0.96 for the DOC was observed in the WS78 watershed. In the WS77 and WS78 watersheds, especially for the Lenoir series, a slightly shallower WTE compared to WS80 can reduce decomposition and the formation of recalcitrant DOC. Also, DOC and nutrients in watercourses can decrease due to partial harvesting, similar to the DOC biodegradability phenomenon [22].
Temperature also had similar predictability in all study watersheds, with constancy dominating the total predictability. However, temperature had a higher predictability than PET (Table 2, Table 3 and Table 4) for all watersheds. Similarly, a similarity was found for conductivity and dissolved oxygen between both watersheds, with constancy playing a dominant role.

4.2.3. Hydrological Indicators for Individual Periods of 2011–2014 and 2015–2019

The examination of Colwell indicators for each of the individual 2011–2014 and 2015–2019 periods indicates negligible differences in the case of the precipitation and PET. Constancy still played a dominant role (for most hydrological and chemical indicators with C/P ≥ 0.50) but was not as high as for the whole period (Table 2, Table 3 and Table 4). However, seasonality seems to play a more important role. For example, an increasing role of seasonality in total predictability, expressed as higher M values or a smaller C/P ratio, was observed for flow and WTE Rains in the WS78 watershed. Higher changes in predictability between both periods were also observed for the flow and WTE indicators for the WS78 watershed, with lower predictability in 2015–2019 compared to the 2011–2014 period. In addition, an increased seasonality in total predictability for flow was observed for WS78 (Figure A3). A lower predictability of flow in the 2015–2019 period can likely be caused by a high variability of flow. A decrease in the predictability of flow was observed in WS80 in 2015–2019. As shown in Figure A3, changes in WTE were more irregular after the year 2014, likely due to the higher variability of precipitation. In addition, shallower WTE soon after 2014 was likely caused by frequent wet events due to Hurricane Joaquin in 2015 and other large storms in 2016 to 2019 (Figure A1, Figure A2 and Figure A3).

4.2.4. Water Chemistry Indicators for Individual Periods of 2011–2014 and 2015–2019

The predictability of stream water chemistry in three analyzed watersheds was similar for both periods for most indicators, except NH4-N, DOC, NO3-N+NO2-N, and temperature. A large decrease in predictability was observed for NO3-N+NO2-N for all watersheds and NH4-N for WS78. Long periods with very low NO3-N+NO2-N concentrations were observed in the 2015–2019 period, perhaps due to its dilution caused by substantially shallower WTE and higher flows in this period, as shown above. Shallow subsurface flow driven by a shallow water table position plays an important role in the transportation of nitrate + nitrite to stream, and during higher flows, their concentration is lower compared to low-flow periods [2,17]. Griffiths et al. [72] reported that shallow subsurface flow paths can play a significant role, contributing to nitrified N transportation to stream on low-relief coastal plain watersheds of the southeastern United States. In addition, increased seasonality in total predictability for all indicators was observed in the 2015–2019 period in WS77 and WS80. The opposite behavior was observed in WS78 (Table 2, Table 3 and Table 4).

4.2.5. Limitations of the Study

In this study, the main factor influencing hydrological processes and water chemistry in the later study period on the coastal forested watersheds was Hurricane Joaquin, which occurred on 3–4 October 2015, yielding > 300 mm rain in 48 h that inundated much of the lowlands with extreme discharge. It is commonly known that the El Niño Southern Oscillation (ENSO) can affect runoff variability and sediment transport, as reported by Thi et al. [73] in the Lower Mekong. Furthermore, Park et al. (2024) noted that the winter Atlantic Niño exerts a significant and greater effect on ENSO compared to the summer Atlantic Niño. In the present study, the effect of ENSO on hydrology and water chemistry variability was not included. The factor that influenced the seasonality and predictability of hydrological indicators and water chemistry was extreme outflow produced by intense and prolonged precipitation, as the indirect effects of Hurricane Joaquin stayed just off the Atlantic coast near the study site. Amatya et al. [28] assumed that the extreme outflow that occurred in two study watersheds (WS77 and WS80) was an outlier in their paired calibration relationships. With its inclusion, the paired flow relationship had higher R2 but was biased due that single extreme outflow. This hurricane, which did not have tropical origins—a rare occurrence for a major hurricane—only indirectly contributed to these hazardous conditions. Contributing to the coastal flooding was a strong pressure gradient off the New England coast behind a frontal boundary, producing a long fetch of northeasterly gales directed at the mid-Atlantic coast at the start of the month, while tides were already running higher than normal [74].
Another limitation of the study is that only in situ data were used to analyze the seasonality and predictability of hydrological and water chemistry indicators. Satellite-based hydrometeorologic observations could have supplemented in situ observations and provided deeper insights into water balance and the seasonality of the analyzed variables, including other environmental factors, such as soil moisture and vegetation parameters, like leaf area index and their seasonality [75]. One other possible limitation is that forests on these watersheds were substantially damaged by the winds of Hurricane Hugo in 1989 and were reported as fully recovered by 2004 [32]. However, Joaquin’s impacts were more on flooding than the forest damage.
To analyze the relationships between meteorological, hydrological, and water chemistry factors, more in-depth multidimensional statistical analyses, such as principal component analysis (PCA), could be used [20,76]. Unfortunately, in this case, PCA was not possible due to missing data, particularly water chemistry, during extreme hydrological events.

5. Summary and Conclusions

In this paper, statistical analyses of hydrological and stream water chemistry indicators were conducted for three coastal forested watersheds located at US Forest Service Santee Experimental Forest in South Carolina, U.S.A. The analyses were performed for all indicators (flow, precipitation, potential evapotranspiration (PET), water table elevation (WTE), nutrients, dissolved oxygen, temperature, and conductivity) for each of the three watersheds using data for the 2011–2019 period as a whole and individually for the two periods of 2011–2014 before Hurricane Joaquin (October 2015) and after for 2015–2019. Additionally, hydrological and water chemistry indicators were compared for dormant (November–March) and growing (April–October) seasons between and within each of the periods. Analysis showed statistically significant differences between the seasons for flow, WTE, and all water chemistry indicators in all the analyzed watersheds, except for temperature. The differences were observed particularly in the 2015–2019 period (post-Hurricane Joaquin) compared to the 2011–2014 period. WTE and flow had the highest influences on water concentrations of nitrogen constituents. As expected, only the concentration of total dissolved phosphorus (TDP), a soluble part of phosphorus, slightly increased during storm events. Accordingly, it can be concluded that the export of phosphorus to streams in this area can mainly be attributed to shallow overland surface runoff during excessive rainfall events, likely caused by saturation excess runoff (water table flooding) due to the shallow water table position. Regarding the difference between dormant and growing seasons, the highest differences were found in all watersheds for total dissolved nitrogen (TDN) and TDP, as water chemistry indicators, and WTE, PET, and precipitation, as hydrological indicators.
Colwell’s indicators showed a higher predictability for almost all hydrologic and water chemistry indicators in the 2011–2014 period compared to 2015–2019. Seasonality for most of the water chemistry indicators increased in WS80 (control watershed) and WS77 in the second period, despite the dominance of constancy (a measure that describes the tendency of a variable to remain unchanged for a given period of time) in their predictability but decreased in WS78 in the second period. The high contribution of constancy in total predictability shows similar variability in the daily values for indicators in each of the years. The results also showed that similar hydrological processes on these low-gradient watersheds, which generally have a shallow water table position (poorly drained soils), determined the predictability of the water chemistry concentrations in all watersheds. The predictability of hydrological indicators in WS78 was lower compared to WS80 and WS77, but seasonality was similar. The results of the analyses confirmed the first hypothesis: extreme hydrometeorologic events, like hurricanes, can influence the seasonality and predictability of hydrology and water chemistry indicators in forested streams.
In conclusion, Colwell’s indicators, as a universal approach, are simple tools compared to other more advanced statistical methods. They are useful for detecting similarities or differences in the behaviors of hydrometeorological timeseries and water chemistry indicators in paired watersheds. Knowledge about the behavior of these processes, assessed using these indicators, can help detect disparities in the seasonality and predictability of observed hydrochemical timeseries on watersheds caused by climate conditions or human activities. Additionally, they help analyze the influence of different mitigation techniques on the seasonality of timeseries. One limitation of using this method is the requirement for at least 10 years of timeseries data without gaps.
Further studies should be focused on the influence of harvesting, thinning, and hazardous fuel treatments on the seasonality of hydrology and chemical indicators after 2019, where partial harvesting and thinning were performed in WS77 for the purpose of restoring longleaf pine (Pinus palustris) forests.
The results and analyses presented in this paper demonstrate the influence of extreme precipitation events, like hurricanes, on the hydrological behavior in forested watersheds and, thus, the transportation of nutrients within and emanating out of the watershed. In addition, these results can help assess changes in the seasonal hydroperiod and biogeochemical processes in tidally mediated downstream riparian forests, which are the estuary headwaters in this region. This study can assist with the sustainable management and planning of water resources in low-gradient headwater watersheds in forested landscapes, such as the introduction of forest species more suitable to the protection and conservation of water resources (e.g., restoration of long leaf pine (Pinus palustris)). However, multisite studies on similar forest landscapes may be warranted to understand these complex seasonal ecosystem processes and their predictabilities in the face of climate change and sea level rise.

Author Contributions

Conceptualization, A.W.; methodology, A.W. and D.M.A.; software, A.W.; validation, D.M.A. and V.V.; formal analysis, A.W. and D.M.; investigation, A.W., D.M.A. and T.C.; resources, A.W., D.M.A., C.T. and V.V.; data curation, D.M.A., V.V. and C.T.; writing—original draft preparation, A.W., D.M., D.M.A. and T.C.; writing—review and editing, V.V. and C.T.; visualization, T.C. and A.W.; supervision, C.T.; project administration, A.W. All authors have read and agreed to the published version of the manuscript.

Funding

This research received no external funding.

Institutional Review Board Statement

Not applicable.

Informed Consent Statement

Not applicable.

Data Availability Statement

The raw data supporting the conclusions of this article will be made available by the authors on request.

Acknowledgments

This study was supported by an internship visit of principal author Andrzej Wałęga and author Dariusz Mlynski, hosted by USDA Forest Service Southern Research Station Santee Experimental Forest and a travel fund to both the authors by the Agricultural University in Krakow for April–June 2023. We are thankful to the College of Charleston and United States Geological Survey for the WS78 (WS78) streamflow data, which were collected under agreement with the Southern Research Station, USDA Forest Service. We also would like to thank Charles A Harrison, and Julie Arnold, both at Santee Experimental Forest Field Office, for providing hydrometeorological/water chemistry data and a site map, respectively. The opinions presented in this article are those of the authors and should not be construed to represent any official USDA or US Government determination or policy.

Conflicts of Interest

The authors declare no conflicts of interest.

Appendix A

Table A1. Basic exploratory statistics of daily hydrological and water chemistry indicators for WS80 watershed.
IndicatorHydrological Indicators for the Period 2011–2014
Number of ObservationsAverageMedianMinimumMaximumPerc 10%Perc 90%Std. DeviationCoeff of Variation %Skewnes, -Kurtozis, -
Flow, mm14610.30.00.026.50.00.51.5473.29.4113.2
Precipitation, mm14613.40.00.0141.30.011.39.5282.85.445.9
WTE, cm1461−156.5−179.4−282.91.5−279.4−11.4113.7−72.70.1−1.8
PET, mm14613.22.7−0.112.40.96.22.063.10.6−0.3
For the period 2015–2019
Flow, mm18261.270.060.00316.580.001.689.73768.4424.06692.94
Precipitation, mm18264.580.000.00242.630.0013.4615.21331.798.1496.37
WTE, cm1785−46.31−30.70−238.305.40−115.00−4.2046.30−99.97−1.461.84
PET, mm18263.192.80−0.0210.130.866.122.0062.730.46−0.78
Water chemistry indicators for the period 2011–2014
Temperature, C9716.7217.764.6727.728.0524.866.6339.67−0.14−1.37
DOC, mg/L23029.8729.1612.6057.6424.1035.935.5018.420.943.85
Conductivity, ms/cm960.110.110.040.250.060.170.0437.660.600.61
DO, mg/L963.603.060.788.951.356.822.0456.810.69−0.66
TDN, mg/L2870.830.760.332.020.601.170.2429.131.573.10
TDP, mg/L2880.030.020.010.520.010.050.03119.0710.30142.16
NH4-N, mg/L2850.050.020.000.410.010.140.07144.542.697.86
NO3-N, mg/L2870.030.020.000.750.000.070.07204.687.5669.61
For the period 2015–2019
Temperature, C5517.8817.976.0927.908.6925.006.4035.82−0.32−1.22
DOC, mg/L36122.9422.300.9747.1114.8031.917.0330.640.550.48
Conductivity, ms/cm550.100.100.040.170.050.150.0332.410.17−0.54
DO, mg/L552.942.270.168.010.786.282.0670.310.990.17
TDN, mg/L3610.590.550.041.650.380.850.2034.731.433.81
TDP, mg/L3620.040.010.003.300.010.020.27681.4010.78117.34
NH4-N, mg/L3620.060.040.000.830.000.140.09153.174.5829.34
NO3-N, mg/L3370.010.010.000.160.000.030.02127.354.7033.38
Table A2. Basic exploratory statistics of daily hydrological and water chemistry indicators for WS77 watershed.
IndicatorHydrological Indicators for the Period 2011–2014
No of ObservationsAverageMedianMinimumMaximumPerc 10%Perc 90%St DeviationCoeff of Variation %Skewnes, -Kurtozis, -
Flow, mm14610.510.000.0038.330.000.882.24437.508.5594.29
Precipitation, mm14613.400.000.00137.100.0010.969.64283.435.3342.84
WTE, cm1461−104.28−93.00−286.10−0.60−204.60−18.4074.56−71.50−0.57−0.59
For the period 2015–2019
Flow, mm18261.530.070.00316.500.002.0910.99719.3120.64512.85
Precipitation, mm18264.650.000.00253.630.0013.7515.53333.598.2498.18
WTE, cm1785−45.87−38.10−157.205.10−95.95−9.8032.13−70.05−0.76−0.15
Water chemistry indicators for the period 2011–2014
Temperature, °C9715.6817.144.2326.067.0823.986.5942.06−0.11−1.41
DOC, mg/L23017.8517.138.7247.7012.1624.135.3429.901.555.22
Conductivity, ms/cm960.060.060.030.140.050.090.0232.421.272.97
DO, mg/L963.743.170.749.261.266.932.1457.260.61−0.57
TDN, mg/L2870.550.490.001.710.360.770.2239.381.996.10
TDP, mg/L2880.010.010.000.280.000.010.02225.5314.29224.10
NH4-N, mg/L2850.100.080.011.110.040.190.0989.065.8655.00
NO3-N, mg/L2870.020.010.000.220.010.030.02102.367.6388.03
For the period 2015–2019
Temperature, °C5516.5717.115.5627.467.0824.466.6940.36−0.15−1.37
DOC, mg/L36115.4514.926.2734.929.4822.485.0632.720.710.53
Conductivity, ms/cm550.040.040.030.070.030.050.0119.421.152.35
DO, mg/L552.862.410.756.701.165.481.6858.600.78−0.46
TDN, mg/L3610.430.410.174.030.260.600.2354.199.98150.66
TDP, mg/L3620.010.000.000.410.000.010.03403.1812.67177.96
NH4-N, mg/L3620.080.060.012.520.030.120.14173.5815.93286.15
NO3-N, mg/L3370.010.010.000.070.000.020.0180.024.4034.47
Table A3. Basic exploratory statistics of daily hydrological and water chemistry indicators for WS78 (WS78) watershed.
IndicatorHydrological Indicators for the Period 2011–2014
No of ObservationsAverageMedianMinimumMaximumPerc 10%Perc 90%St DeviationCoeff of Variation %Skewnes, -Kurtozis, -
Flow, mm14610.450.010.0011.020.001.371.25279.834.5124.61
Precipitation, mm14613.510.000.0086.010.0012.349.48269.853.9918.91
WTERains1396−69.21−58.40−204.8013.60−173.724.0067.09−96.94−0.45−1.18
WTELenoir1461−57.71−52.00−197.8010.10−126.12−2.5048.53−84.09−0.57−0.62
WTEGoldsboro1461−158.58−207.90−244.14−7.20−236.42−36.8082.36−51.940.52−1.49
WTELynchnurg1461−113.44−116.40−234.600.50−215.10−7.6072.69−64.080.00−1.20
WTEWahee1236−126.44−126.05−235.00−10.50−213.50−33.9066.77−52.810.05−1.35
For the period 2015–2019
Flow, mm18261.740.230.00256.830.003.2110.76617.2218.56390.41
Precipitation, mm18264.740.000.00271.400.0012.8816.19341.297.9791.10
WTERains1776−18.64−1.47−157.2032.62−75.7811.4236.87−197.82−1.431.33
WTELenoir1589−32.91−24.09−137.6640.70−81.62−0.9032.41−98.48−1.050.44
WTEGoldsboro1589−70.30−57.42−217.671.60−137.67−28.0645.13−64.21−1.200.95
WTELynchnurg1584−56.73−47.90−205.895.70−127.22−6.4147.37−83.50−0.84−0.07
WTEWahee1587−71.51−64.80−188.0015.40−127.60−26.2040.17−56.18−0.63−0.34
Water chemistry indicators for the period 2011–2014
DOC, mg/L2270.600.540.182.230.410.830.2642.973.5217.05
Conductivity, ms/cm2280.010.010.000.120.010.020.0185.344.1224.43
DO, mg/L2270.070.030.001.190.010.150.14201.185.9040.80
TDN, mg/L2170.020.020.000.130.010.050.0295.672.326.93
TDP, mg/L9917.2918.734.3727.728.0825.266.6838.60−0.24−1.34
NH4-N, mg/L19919.4018.906.6131.2413.4725.394.8024.770.05−0.57
NO3-N, mg/L980.080.080.020.180.030.110.0341.980.901.59
DOC, mg/L974.974.940.8811.171.529.422.7956.240.43−0.78
For the period 2015–2018
DOC, mg/L1600.450.440.260.830.290.620.1226.850.770.45
Conductivity, ms/cm1600.010.010.000.040.010.020.0158.762.035.58
DO, mg/L1600.040.030.000.240.010.090.04106.662.557.60
TDN, mg/L1530.010.010.000.070.000.030.01103.592.175.61
TDP, mg/L7217.1717.844.6426.517.4125.406.5037.88−0.25−1.20
NH4-N, mg/L16016.6716.389.3529.5311.7921.984.0024.010.52−0.08
NO3-N, mg/L720.050.040.030.100.030.070.0234.681.752.93
DOC, mg/L716.385.841.4812.094.0310.082.5640.070.42−0.01
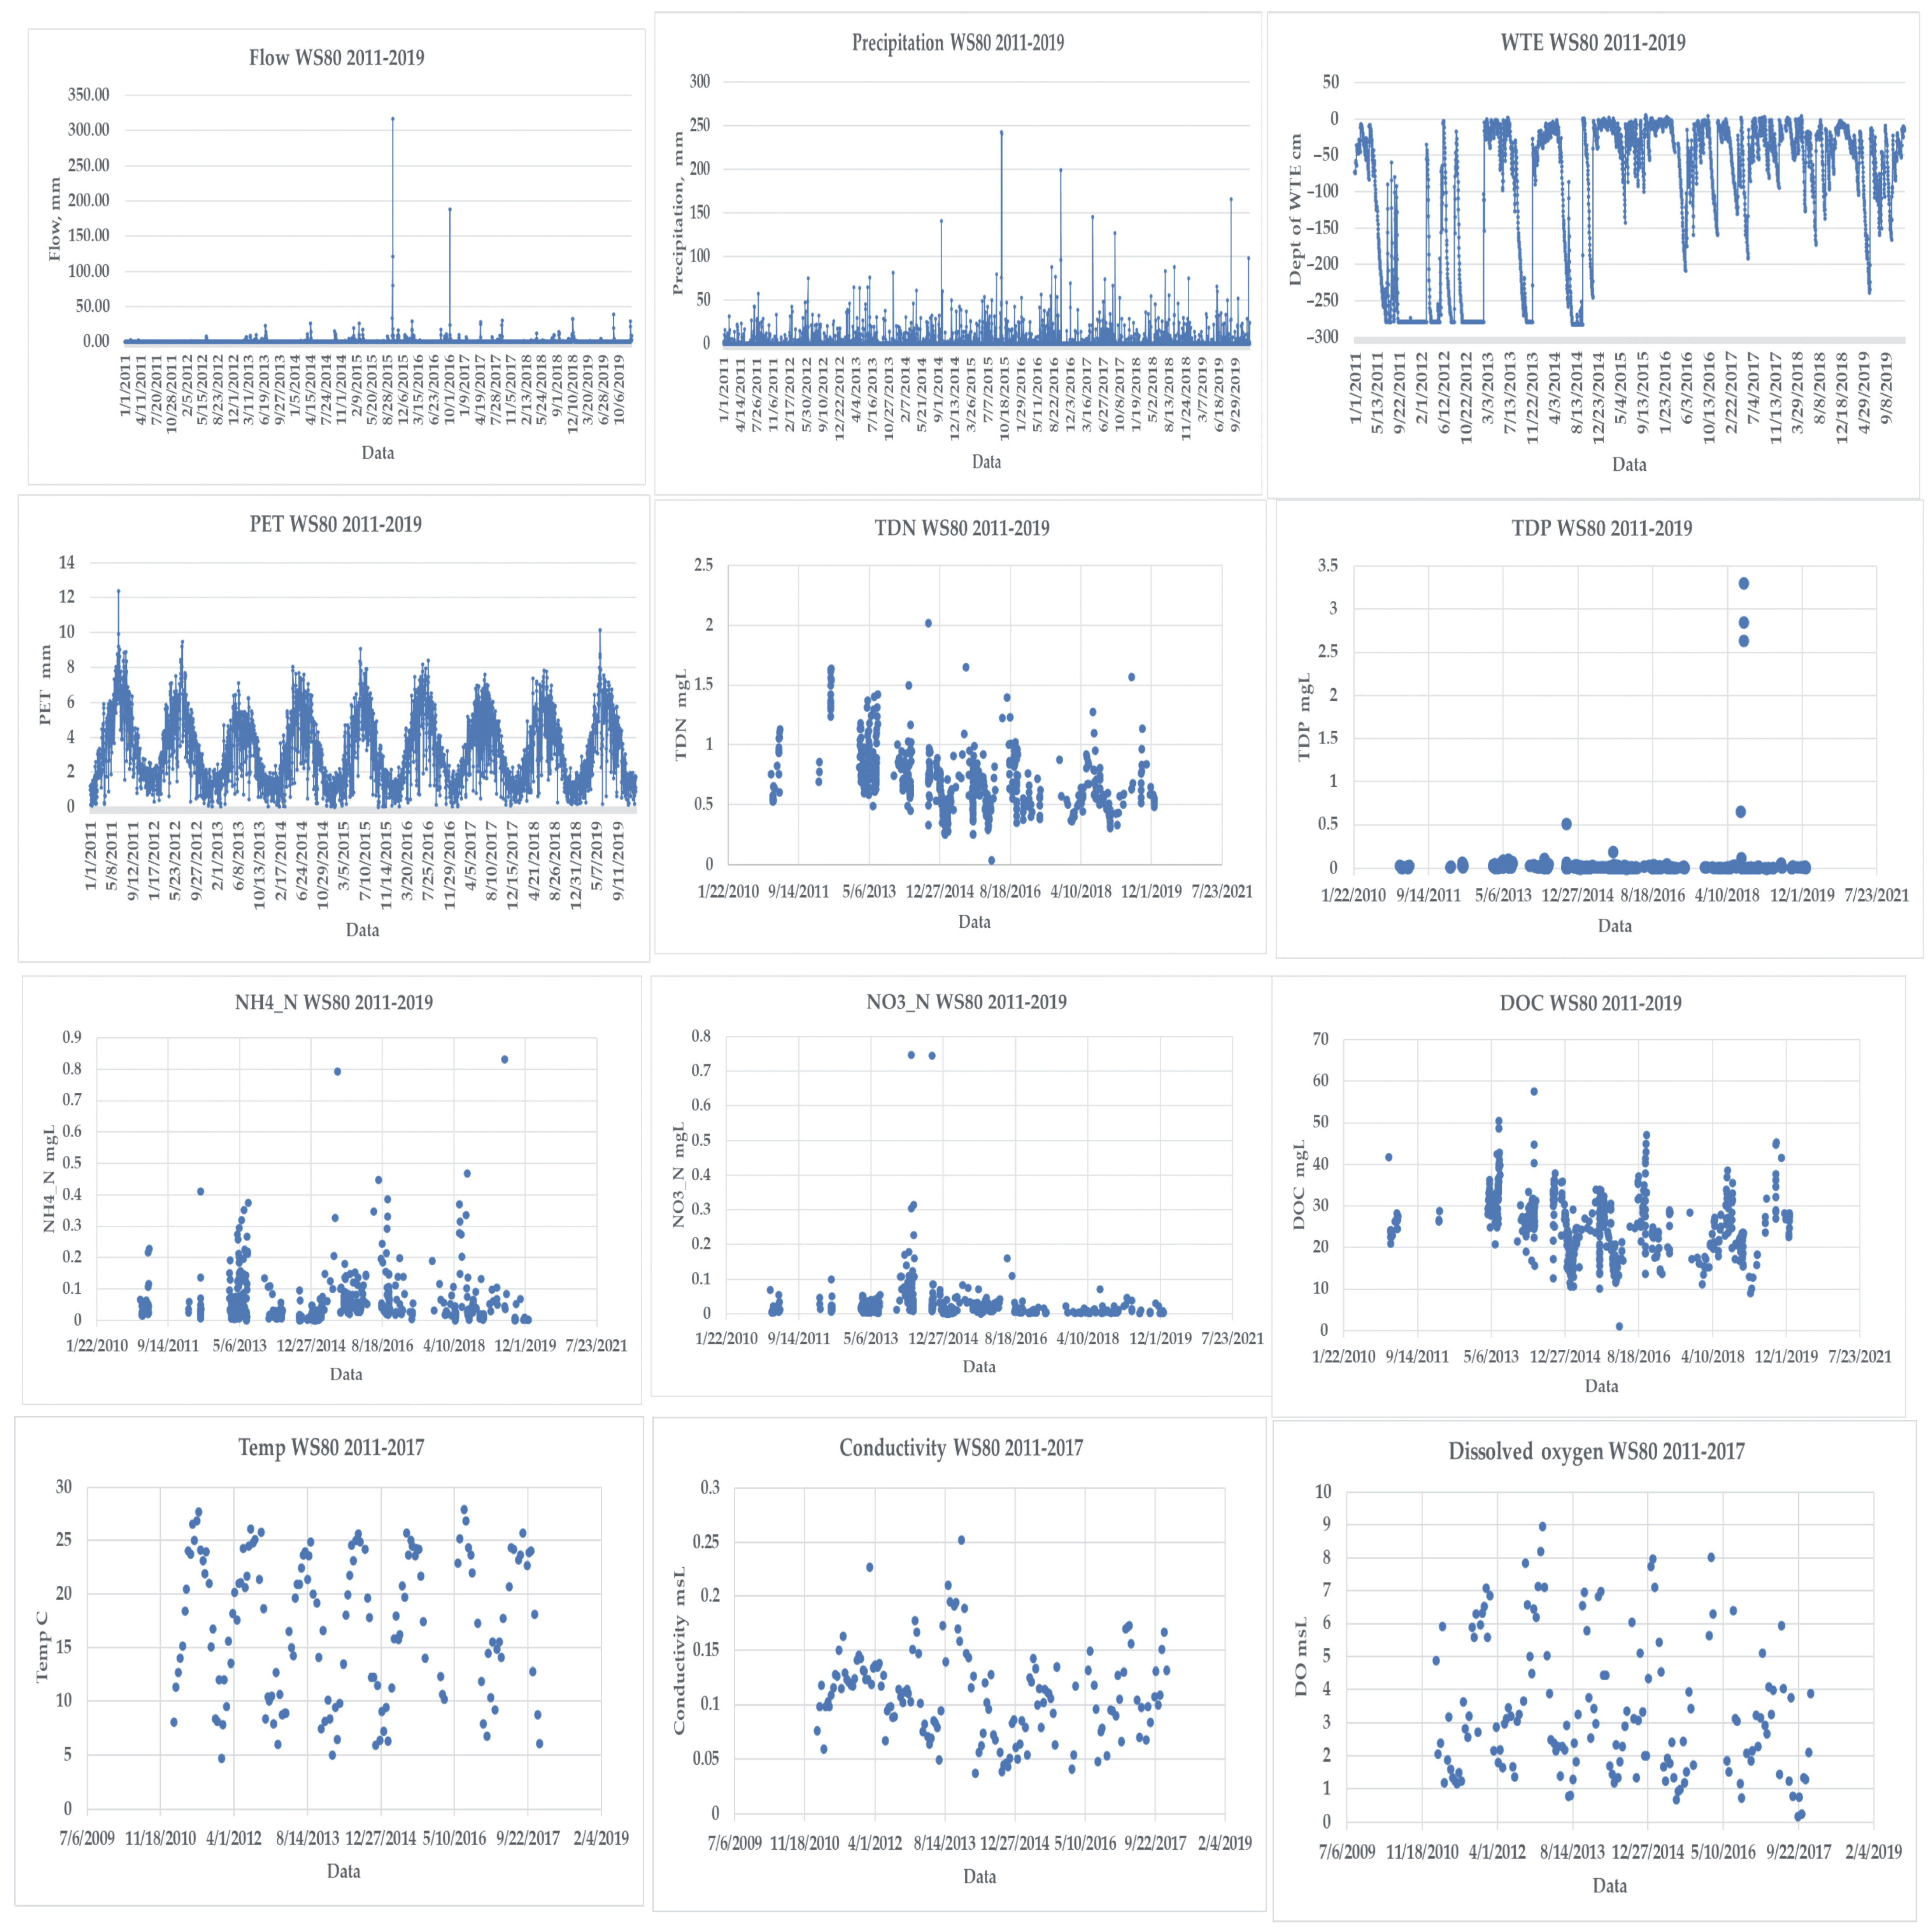
Figure A1. Daily values of hydrologic and water chemistry indicators in WS80 (control watershed) during the 2011–2019 period.
Sustainability 16 09756 g0a1
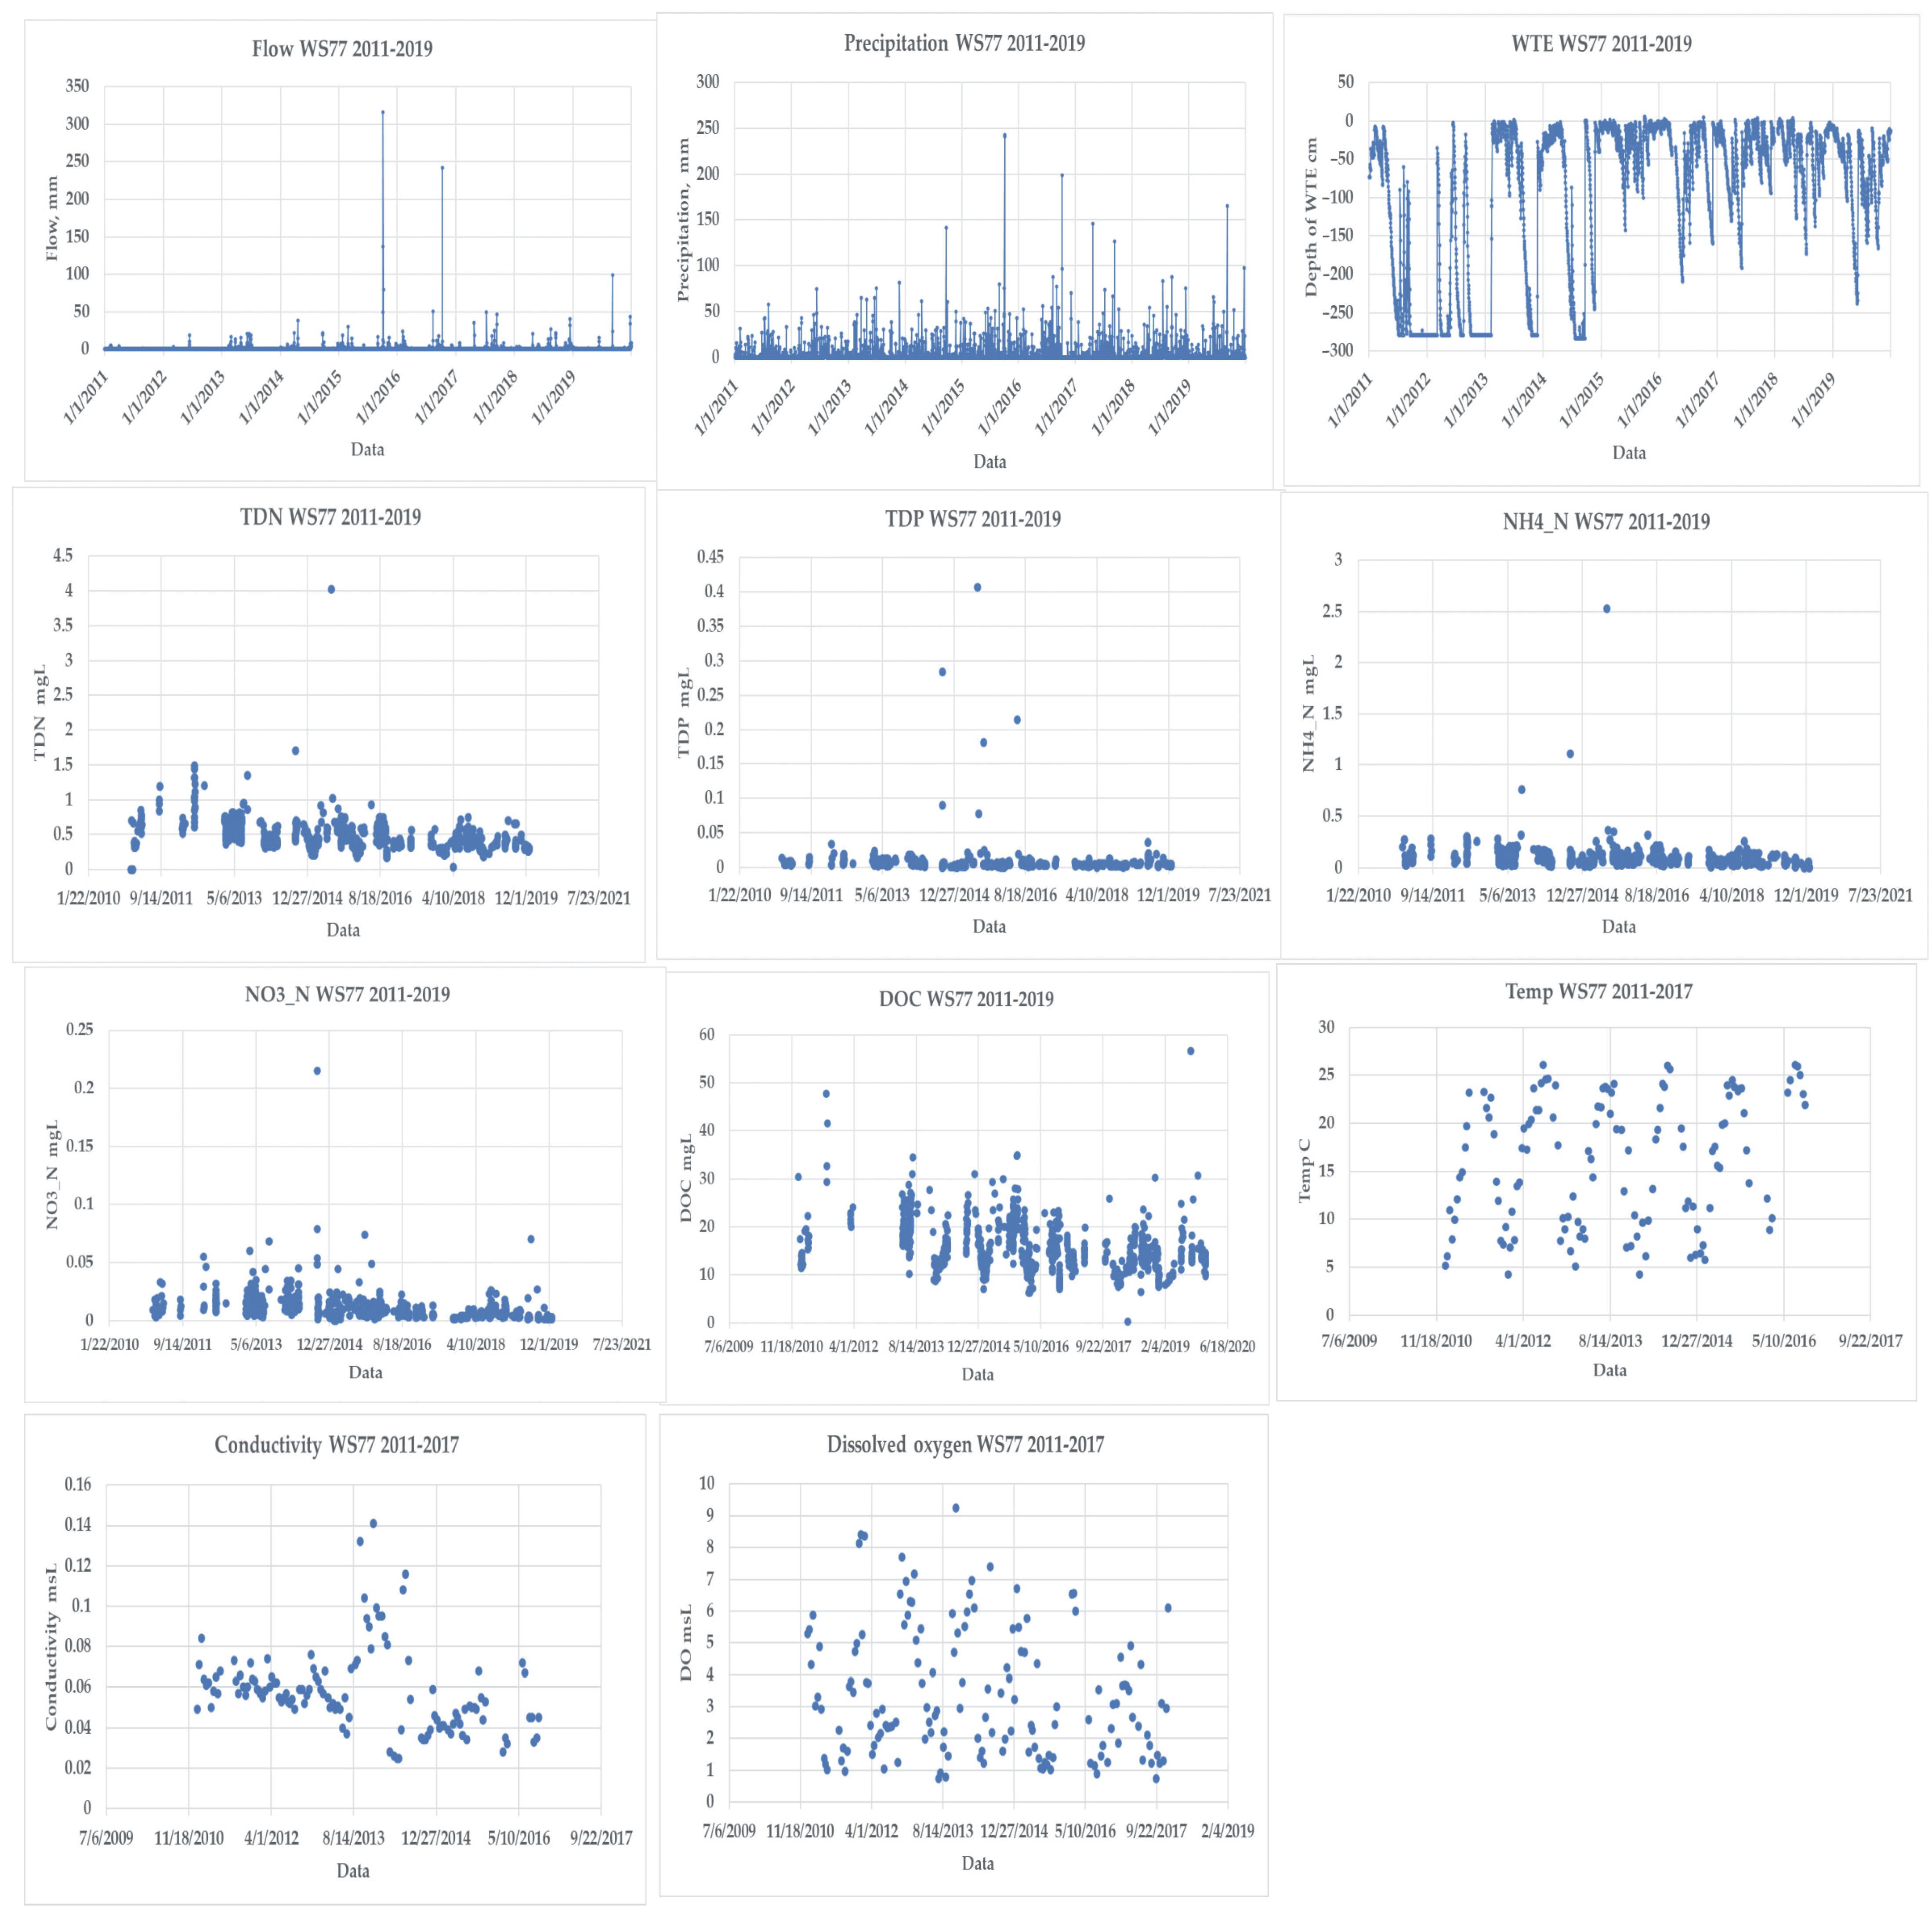
Figure A2. Daily values of hydrologic and water chemistry indicators in WS77 (treatment watershed) during the 2011–2019 period.
Sustainability 16 09756 g0a2
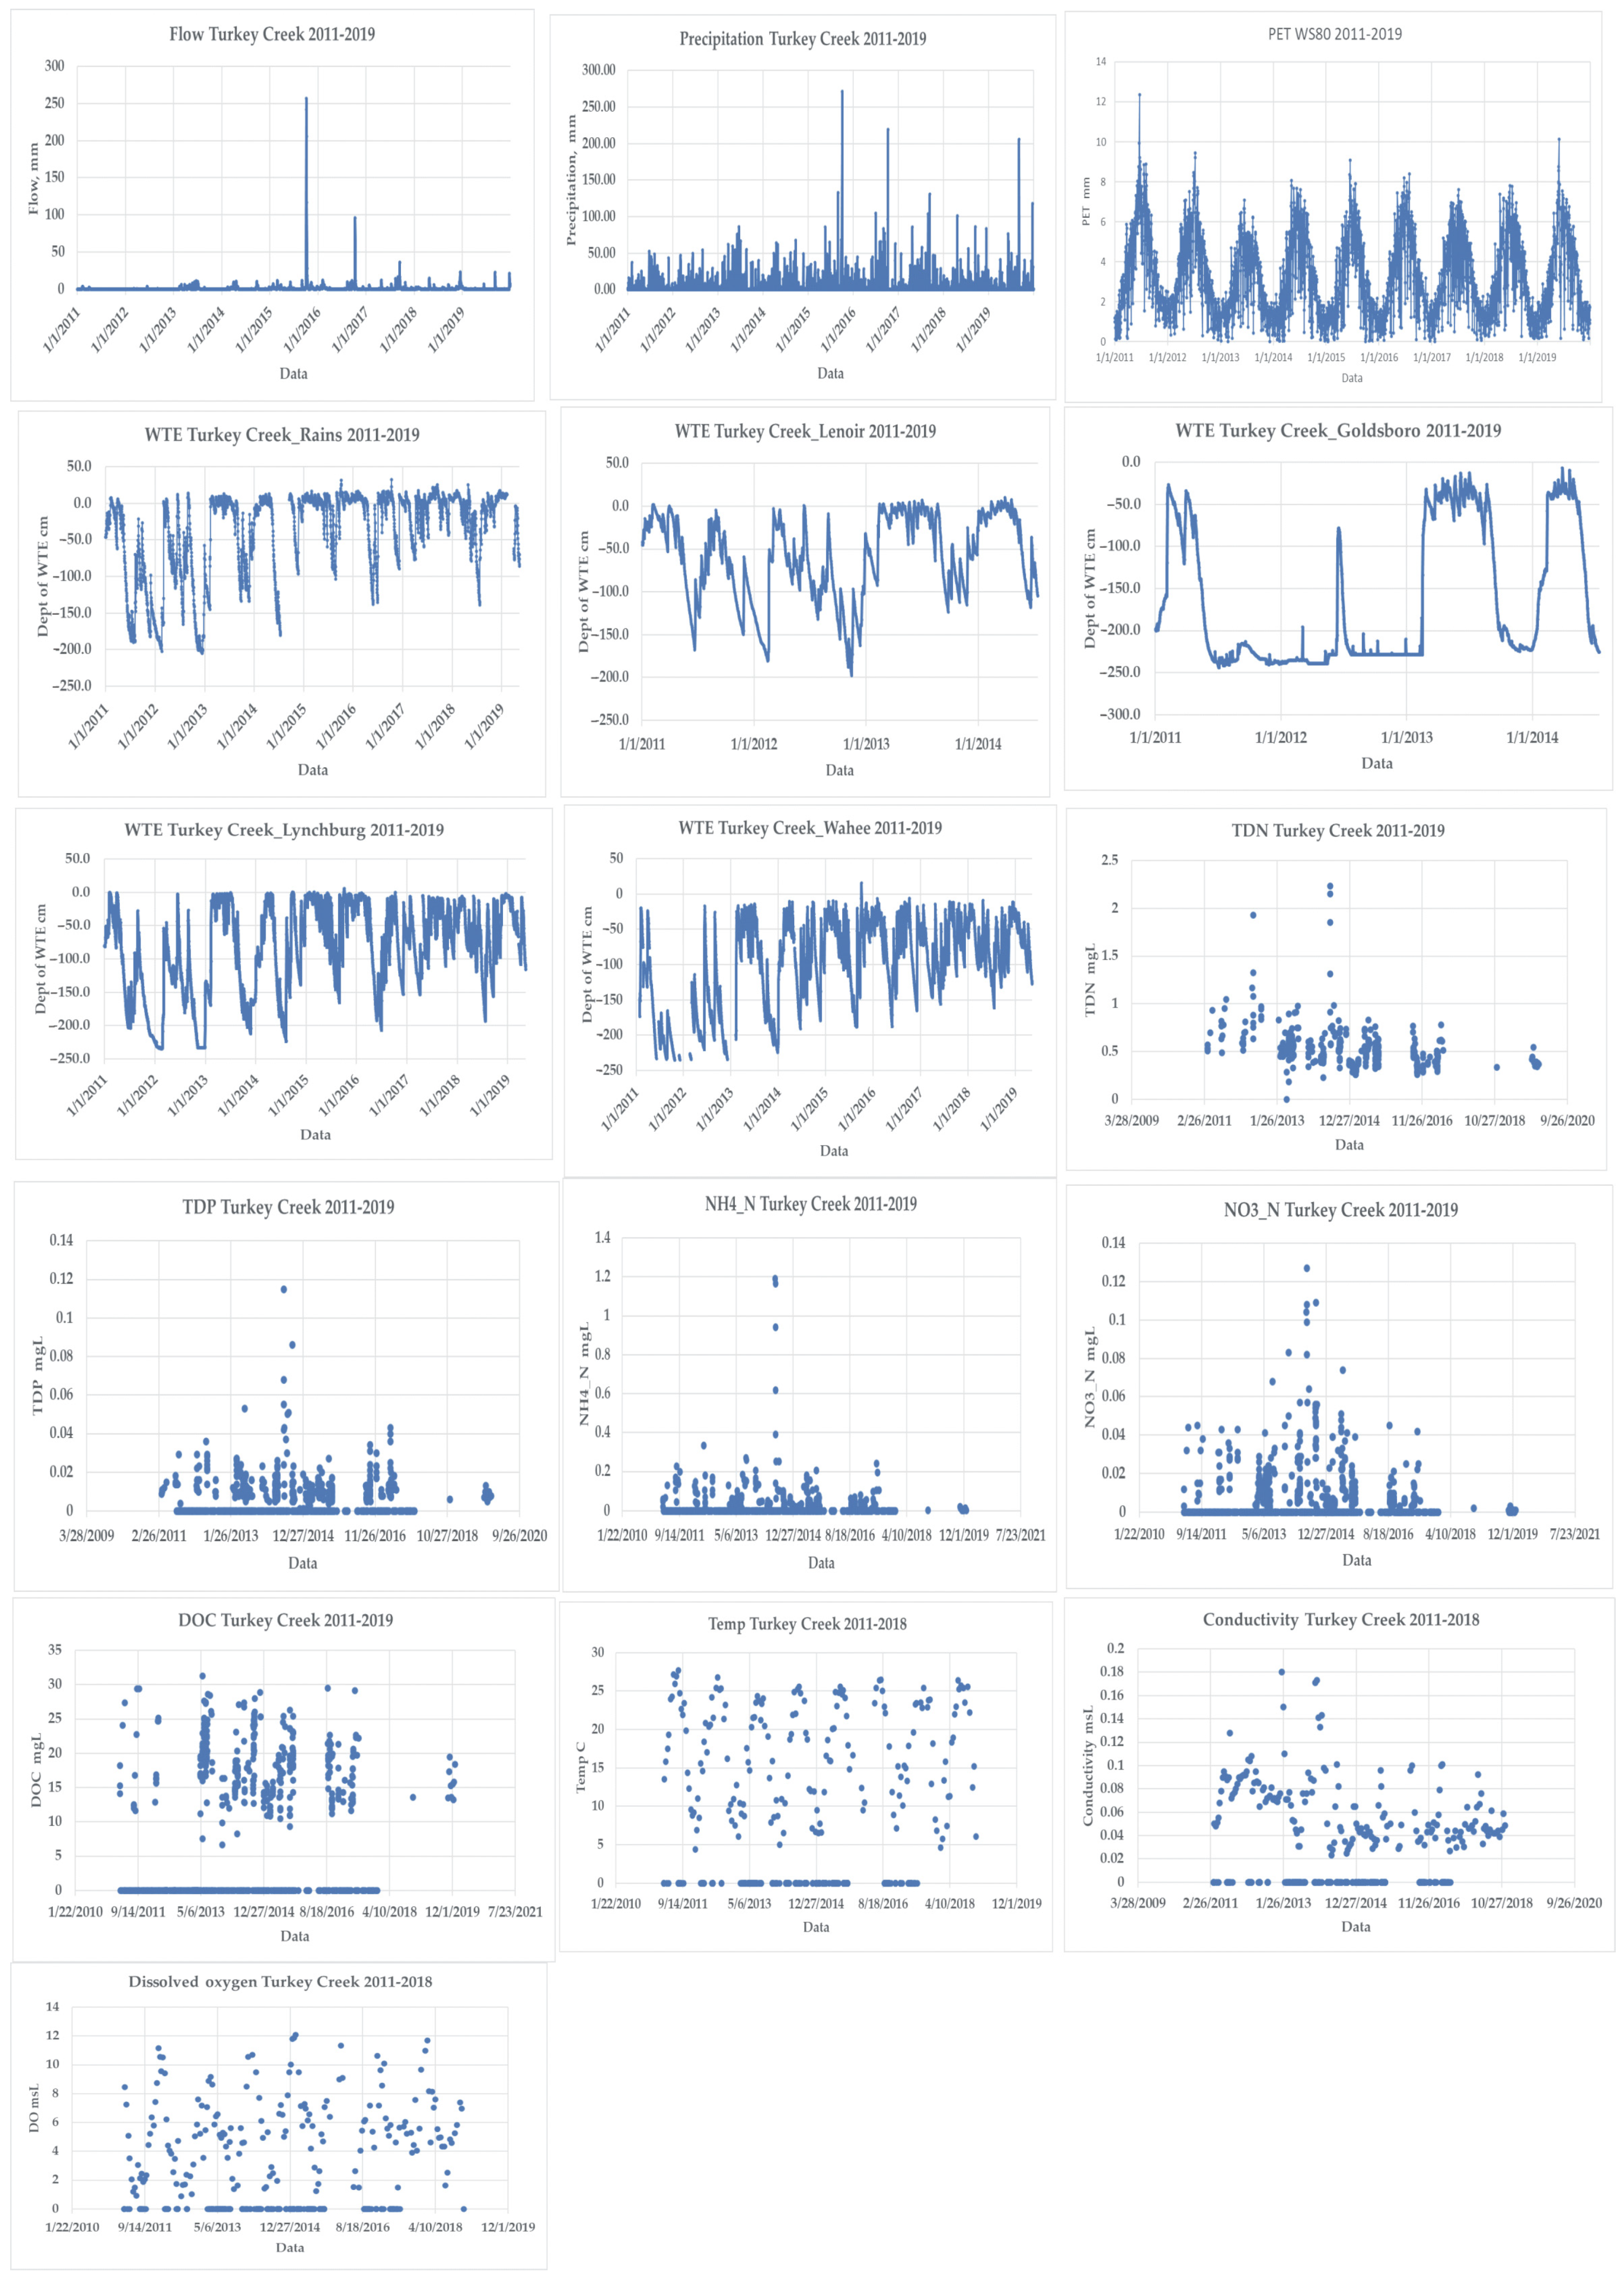
Figure A3. Daily values of hydrologic and water chemistry indicators in WS78 (Turkey Creek) during the 2011–2019 period.
Sustainability 16 09756 g0a3

References

  1. LaFontaine, J.H.; Hay, L.E.; Viger, R.J.; Regan, R.S.; Markstrom, S.L. Effects of climate and land cover on hydrology in the southeastern U.S.: Potential impacts on watershed planning. J. Am. Water Resour. Assoc 2015, 51, 1235–1261. [Google Scholar] [CrossRef]
  2. Li, Y.; Wang, C.; Tang, H. Research advances in nutrient runoff on sloping land in watersheds. Aqua. Ecos. Health Manag. 2006, 9, 27–32. [Google Scholar] [CrossRef]
  3. Wojkowski, J.; Wałęga, A.; Radecki-Pawlik, A.; Młyński, D.; Lepeška, T. The influence of land cover changes on landscape hydric potential and river flows: Upper Vistula, Western Carpathians. CATENA 2022, 210, 105878. [Google Scholar] [CrossRef]
  4. Wojkowski, J.; Wałęga, A.; Młyński, D.; Radecki-Pawlik, A.; Lepeška, T.; Piniewski, M.; Kundzewicz, Z.W. Are we losing water storage capacity mostly due to climate change—Analysis of the landscape hydric potential in selected catchments in East-Central Europe. Ecol. Ind. 2023, 154, 110913. [Google Scholar] [CrossRef]
  5. National Research Council. Hydrologic Effects of a Changing Forest Landscape; The National Academies Press: Washington, DC, USA, 2008. [Google Scholar] [CrossRef]
  6. Caldwell, P.V.; Martin, K.L.; Vose, J.M.; Baker, J.S.; Warziniack, T.W.; Costanza, J.K.; Frey, G.E.; Nehra, A.; Mihiar, C.M. Forested watersheds provide the highest water chemistry among all land cover types, but the benefit of this ecosystem service depends on landscape context. Sci. Total Environ. 2023, 882, 163550. [Google Scholar] [CrossRef]
  7. Shah, N.W.; Nisbet, T.R. The effects of forest clearance for peatland restoration on water chemistry. Sci. Total Environ. 2019, 693, 133617. [Google Scholar] [CrossRef]
  8. Grace, J.M., III. Forest Operations and Water chemistry in the South. Forest Operations and Water chemistry in the South. Trans. ASAE 2005, 48, 871–880. [Google Scholar] [CrossRef]
  9. Muwamba, A.; Amatya, D.M.; Ssegane, H.; Chescheir, G.M.; Appelboom, T.; Tollner, E.W.; Nettles, J.E.; Youssef, M.A.; Birgand, F.; Skaggs, R.W.; et al. Effects of Site Preparation for Pine Forest/Switchgrass Intercropping on Water chemistry. J. Environ. Qual. 2015, 44, 1263–1272. [Google Scholar] [CrossRef]
  10. Muwamba, A.; Amatya, D.M.; Chescheir, G.M.; Nettles, J.E.; Appelboom, T.; Ssegane, H.; Tollner, E.W.; Youssef, M.A.; Birgand, F.; Skaggs, R.W.; et al. Water chemistry Effects of Switchgrass-Pine Forested Watershed in Coastal North Carolina. Trans. ASABE 2017, 60, 1607–1620. [Google Scholar] [CrossRef]
  11. Picchio, R.; Jourgholami, M.; Zenner, E.K. Effects of Forest Harvesting on Water and Sediment Yields: A Review Toward Better Mitigation and Rehabilitation Strategies. Curr. Forestry Rep. 2021, 7, 214–229. [Google Scholar] [CrossRef]
  12. Deval, C.; Brooks, E.S.; Gravelle, J.A.; Link, T.E.; Dobre, M.; Elliot, W.J. Long-term response in nutrient load from commercial forest management operations in a mountainous watershed. For. Ecol. Manag. 2021, 494, 119312. [Google Scholar] [CrossRef]
  13. Shepard, J.P. Effects of forest management on surface water chemistry in wetland forests. Wetlands 1994, 14, 18–26. [Google Scholar] [CrossRef]
  14. Amatya, D.M.; Skaggs, R.W.; Blanton, C.D.; Gilliam, J.W. Hydrologic and water chemistry effects of harvesting and regeneration of a drained pine forest. In Hydrology and Management of Forested Wetlands, Proceedings of the International Conference, New Bern, NC, USA, 8–12 April 2006; American Society of Agricultural and Biological Engineers: St. Joseph, MI, USA, 2006; pp. 538–551. [Google Scholar]
  15. Grace, J.M., III; Carter, E.A. Sediment and runoff losses following harvesting/site prep operations on a Piedmont soil in Alabama. In 2001 ASAE Annual Meeting; American Society of Agricultural and Biological Engineers: St. Joseph, MI, USA, 2001; p. 018002. [Google Scholar]
  16. Grace, J.M., III. Soil erosion following forest operations in the Southern Piedmont of central Alabama. J. Soil. Wat. Cons. 2004, 59, 160–166. [Google Scholar]
  17. Amatya, D.M.; Gilliam, J.W.; Skaggs, R.W.; Lebo, M.E.; Campbell, R.G. Effects of controlled drainage on forest water chemistry. J. Environ. Qual. 1998, 27, 923–935. [Google Scholar] [CrossRef]
  18. Haahti, K.; Warsta, L.; Kokkonen, T.; Younis, B.A.; Koivusalo, H. Distributed hydrological modeling with channel network flow of a forestry drained peatland site. Water Resour. Res. 2016, 52, 246–263. [Google Scholar] [CrossRef]
  19. Cacho, J.F.; Youssef, M.A.; Shi, W.; Chescheir, G.M.; Skaggs, R.W.; Tian, S.; Leggett, Z.H.; Sucre, E.B.; Nettles, J.E.; Arellano, C. Impacts of forest-based bioenergy feed stock production on soil nitrogen cycling. Forest Ecol. Manag. 2018, 419–420, 227–239. [Google Scholar] [CrossRef]
  20. Muwamba, A.; Amatya, D.M.; Ssegane, H.; Chescheir, G.M.; Appelboom, T.; Nettles, J.E.; Tollner, E.W.; Youssef, M.A.; Wałęga, A.; Birgand, F. Response of Nutrients and Sediment to Hydrologic Variables in Switchgrass Intercropped Pine Forest Ecosystems on Poorly Drained. Soil Water Air Soil Pollut. 2020, 231, 458. [Google Scholar] [CrossRef]
  21. Hughes, A.O.; Quinn, J.M. The effect of forestry management activities on stream water chemistry within a headwater plantation Pinus radiata forest. For. Ecol. Manag. 2019, 439, 41–54. [Google Scholar] [CrossRef]
  22. Palviainen, M.; Peltomaa, E.; Laurén, A.; Kinnunen, N.; Ojala, A.; Berninger, F.; Zhu, X.; Pumpanen, J. Water chemistry and the biodegradability of dissolved organic carbon in drained boreal peatland under different forest harvesting intensities. Sci. Total Environ. 2022, 806, 150919. [Google Scholar] [CrossRef]
  23. Leppä, K.; Korkiakoski, M.; Nieminen, M.; Laiho, R.; Hotanen, J.P.; Kieloaho, A.J.; Korpela, L.; Laurila, T.; Lohila, A.; Minkkinen, K.; et al. Vegetation controls of water and energy balance of a drained peatland forest: Responses to alternative harvesting practices. Agr. For. Manag. 2020, 295, 108198. [Google Scholar] [CrossRef]
  24. Georgiev, K.B.; Beudert, B.; Bässler, C.; Feldhaar, H.; Heibl Ch Karasch, P.; Müller, J.; Perlík, M.; Weiss, I.; Thorn, S. Forest disturbance and salvage logging have neutral long-term effects on drinking water chemistry but alter biodiversity. For. Ecol. Manag. 2021, 495, 119354. [Google Scholar] [CrossRef]
  25. Adiyah, F.; Michéli, E.; Csorba, A.; Weldmichael, T.G.; Gyuricza, C.; Ocansey, C.M.; Dawoe, E.; Owusu, S.; Fuchs, M. Effects of landuse change and topography on the quantity and distribution of soil organic carbon stocks on Acrisol catenas in tropical small-scale shade cocoa systems of the Ashanti region of Ghana. CATENA 2022, 216, 106366. [Google Scholar] [CrossRef]
  26. Shelby, J.D.; Chescheir, G.M.; Skaggs, R.W.; Amatya, D.M. Hydrologic And Water-Quality Response of Forested and Agricultural Lands During The 1999 Extreme Weather Conditions in Eastern North Carolina. Am. Soc. Agric. Eng 2005, 48, 2179–2188. [Google Scholar] [CrossRef]
  27. Erdoğan, B.U.; Gökbulak, F.; Serengil, Y.; Yurtseven, I.; Özçelik, M.S. Changes in selected physical water chemistry characteristics after thinning in a forested watershed. Catena 2018, 166, 220–228. [Google Scholar] [CrossRef]
  28. Amatya, D.M.; Herbert, S.; Trettin, C.C.; Hamidi, M.D. Evaluation of Paired Watershed Runoff Relationships since Recovery from a Major Hurricane on a Coastal Forest—A Basis for Examining Effects of Pinus palustris Restoration on Water Yield. Water 2021, 13, 3121. [Google Scholar] [CrossRef]
  29. Oda, T.; Green, M.B.; Urakawa, R.; Scanlon, T.M.; Sebestyen, S.D.; McGuire, K.J.; Katsuyama, M.; Fukuzawa, F.; Adams, M.B.; Ohte, N. Stream runoff and nitrate recovery times after forest disturbance in the USA and Japan. Water Resour. Res. 2018, 54, 6042–6054. [Google Scholar] [CrossRef]
  30. Trettin, C.C.; Amatya, D.M.; Muwamba, A.; Glover, J.; Wenerick, R. Ecoregion 8.5.3 Southern Coastal Plain: Santee Experimental Forest, South Carolina. In Biological Responses to Stream Nutrients: A Synthesis of Science From Experimental Forests and Ranges; Ryan, D., Ed.; General Technical Report, PNW-GTR-981; US Department of Agriculture, Forest Service: Washington, DC, USA, 2022; Chapter 14. [Google Scholar]
  31. Safeeq, M.; Grant, G.E.; Lewis, S.L.; Hayes, S.K. Disentangling effects of forest harvest on long-term hydrologic and sediment dynamics, western Cascades, Oregon. J. Hydrol. 2020, 580, 124259. [Google Scholar] [CrossRef]
  32. Jayakaran, A.D.; Williams, T.M.; Ssegane, H.; Amatya, D.M.; Song, B.; Trettin, C.C. Hurricane Impacts on a Pair of Coastal Forested Watersheds: Implications of Selective Hurricane Damage to Forest Structure and Streamflow Dynamics. Hydrol. Earth Syst. Sci. 2014, 18, 1151–1164. [Google Scholar] [CrossRef]
  33. Worley, E.; Liu, N.; Sun, G.; Norman, S.P.; Christie, W.M.; Gavazzi, M.; Boggs, J.; McNulty, S.G. Impacts of Hurricane Michael on Watershed Hydrology: A Case Study in the Southeastern United States. Forests 2022, 13, 904. [Google Scholar] [CrossRef]
  34. Kosmowska, A.; Żelazny, M.; Małek, S.; Stańczyk, T. Impact of deforestation on water chemistry in the western Tatras and Beskid Śląski range in the Polish Carpathians. Acta Sci. Pol. Form. Circumiectus 2018, 17, 89–99. [Google Scholar] [CrossRef]
  35. Erdozain, M.; Kidd, K.A.; Emilson, E.J.S.; Capell, S.S.; Kreutzweiser, D.P.; Gray, M.A. Forest management impacts on stream integrity at varying intensities and spatial scales: Do abiotic effects accumulate spatially? Sci. Total Environ. 2021, 753, 141968. [Google Scholar] [CrossRef]
  36. Jones, B.E.; Krupa, M.; Tate, K.W. Aquatic ecosystem response to timber harvesting for the purpose of restoring aspen. PLoS ONE 2013, 8, e84561. [Google Scholar] [CrossRef] [PubMed]
  37. Duan, W.; He, B.; Chen, Y.; Zou, S.; Wang, Y.; Nover, D.; Chen, W.; Yang, G. Identification of long-term trends and seasonality in high-frequency water chemistry data from the Yangtze River basin, China. PLoS ONE 2018, 13, e0188889. [Google Scholar] [CrossRef] [PubMed]
  38. Xu, G.; Li, P.; Lu, K.; Tantai, Z.; Zhang, J.; Ren, Z.; Wang, X.; Yu, K.; Shi, P.; Cheng, Y. Seasonal changes in water chemistry and its main influencing factors in the Dan River basin. CATENA 2019, 173, 131–140. [Google Scholar] [CrossRef]
  39. Xu, W.; Duan, L.; Wen, X.; Li, H.; Li, D.; Zhang, Y.; Zhang, H. Effects of Seasonal Variation on Water chemistry Parameters and Eutrophication in Lake Yangzong. Water 2022, 14, 2732. [Google Scholar] [CrossRef]
  40. Costa, C.R.; Costa, M.F.; Dantas, D.V.; Barletta, M. Interannual and Seasonal Variations in Estuarine Water chemistry. Front. Marine Sci. 2018, 5, 301. [Google Scholar] [CrossRef]
  41. Radecki-Pawlik, A.; Wałęga, A.; Młyński, D.; Młocek, W.; Kokoszka, R.; Tokarczyk, T.; Szalińska, W. Seasonality of mean flows as a potential tool for the assessment of ecological processes: Mountain rivers, Polish Carpathians. Sci. Total Environ. 2020, 716, 136988. [Google Scholar] [CrossRef]
  42. Colwell, R.K. Predictability, Constancy, and Contingency of Periodic Phenomena. Ecology 1974, 55, 1148–1153. [Google Scholar] [CrossRef]
  43. Harder, S.V.; Amatya, D.M.; Callahan, T.J.; Trettin, C.C.; Hakkila, J. Hydrology and water budget for a first-order forested Atlantic Coastal Plain watershed, South Carolina. J. Am. Water Resour. Assoc. 2007, 43, 563–575. [Google Scholar] [CrossRef]
  44. Epps, T.; Hitchcock, D.; Jayakaran, A.D.; Loflin, D.; Williams, T.M.; Amatya, D.M. Characterization of storm flow dynamics of headwater streams in the South Carolina lower Coastal Plain. J. Am. Water Resour. Assoc. 2013, 49, 76–89. [Google Scholar] [CrossRef]
  45. SCS. Soil Survey of Berkeley County, South Carolina; USDA Soil Conservation Service: Washington, DC, USA, 1980.
  46. Hook, D.D.; Buford, M.A.; Williams, T.M. Impact of Hurricane Hugo on the South Carolina Coastal Plain forest. J. Coastal Res. 1991, 8, 291–300. [Google Scholar]
  47. Amatya, D.M.; Callahan, T.J.; Mukherjee, S.; Harrison, C.A.; Trettin, C.C.; Wałęga, A.; Młyński, D.; Emmett, K.D. Hydrometeorological Trends in a Low-Gradient Forested Watershed on the Southeastern Atlantic Coastal Plain in the USA. Hydrology 2024, 11, 31. [Google Scholar] [CrossRef]
  48. Amatya, D.M.; Callahan, T.J.; Hansen, W.F.; Trettin, C.C.; Radecki-Pawlik, A.; Meire, P. Turkey Creek—A Case Study of Ecohydrology and Integrated Watershed Management in the Low-Gradient Atlantic Coastal Plain, U.S.A. J. Water Resour. Protect. 2015, 7, 792–814. [Google Scholar] [CrossRef]
  49. Haley, E.B. Field Measurements and Hydrologic Modeling of the Turkey Creek Watershed, South Carolina. Master’s Thesis, College of Charleston, Charleston, SC, USA, 2007; 168p. [Google Scholar]
  50. Morrison, A.E. Storm Event Analysis at Varying Watershed Scales: Turkey Creek, Santee Experimental Forest. Master’s Thesis, College of Charleston, Charleston, SC, USA, 2016; p. 334. [Google Scholar]
  51. Amatya, D.M.; Harrison, C.A. Grass and forest potential evapotranspiration comparison using 5 methods in the Atlantic Coastal Plain. J. Hydrol. Engin. 2016, 21, 05016007. [Google Scholar] [CrossRef]
  52. Amatya, D.M.; Trettin, C.C.; Harrison, C.A.; Arnold, J.A. Long-term hydro-meteorology and water chemistry data from low-gradient catchments of varying scales on the Santee experimental Forest, South Carolina. Hydrol. Proc. 2022, 36, e14549. [Google Scholar] [CrossRef]
  53. Muwamba, A.; Amatya, D.M.; Trettin, C.C.; Glover, J.B. Comparing Nutrient Export From First, Second, And Third Order Watersheds In The South Carolina Atlantic Coastal Plain. In Headwaters to Estuaries: Advances in Watershed Science and Management, Proceedings of the Fifth Interagency Conference on Research in the Watersheds, North Charleston, SC, USA, 2–5 March 2015; Stringer, C.E., Krauss, K.W., Latimer, J.S., Eds.; U.S. Department of Agriculture Forest Service: Asheville, NC, USA, 2016. [Google Scholar]
  54. King, A.P.; Eckersley, R.J. Chapter 6—Inferential Statistics III: Nonparametric Hypothesis Testing. In Statistics for Biomedical Engineers and Scientists; King, A.P., Eckersley, R.J., Eds.; Academic Press: Cambridge, MA, USA, 2019; pp. 119–145. [Google Scholar] [CrossRef]
  55. Dung, B.X.; Gomi, T.; Miyata, S.; Sidle, R.C. Peak flow responses and recession flow characteristics after thinning of Japanese cypress forest in a headwater catchment. Hyd. Res. Let. 2012, 6, 35–40. [Google Scholar] [CrossRef]
  56. Dai, Z.; Trettin, C.C.; Amatya, D.M. Effects of Climate Variability on Forest Hydrology and Carbon Sequestration on the Santee Experimental Forest in Coastal South Carolina; Gen. Tech. Rep. SRS-GTR-172; USDA-Forest Service, Southern Research Station: Asheville, NC, USA, 2013; 32p. [CrossRef]
  57. Dyola, N.; Sigdel, S.R.; Liang, E.; Babst, F.; Camarero, J.J.; Aryal, S.; Chettri, N.; Gao, S.; Lu, X.; Sun, J.; et al. Species richness is a strong driver of forest biomass along broad bioclimatic gradients in the Himalayas. Ecosphere 2022, 13, e4107. [Google Scholar] [CrossRef]
  58. Ojima, D.S.; Iverson, L.R.; Sohngen, B.L.; Vose, J.M.; Woodall, C.W.; Domke, G.M.; Peterson, D.L.; Littell, L.S.; Matthews, S.N.; Anantha, M.; et al. Risk Assessment. In Climate Change and United States Forests. Advances in Global Change Research; Peterson, D., Vose, J., Patel-Weynand, T., Eds.; Springer: Dordrecht, The Netherlands, 2014; p. 57. [Google Scholar] [CrossRef]
  59. Amatya, D.M.; Dai, Z.; Tian, S.; Sun, G. Long-term PET and ET of two Different Forests on the Atlantic Coastal Plain. ET Special Collection. Trans. ASABE 2016, 59, 647–660. [Google Scholar] [CrossRef]
  60. Amatya, D.M.; Harrison, C.A.; Trettin, C.C. Hydro-meteorologic Assessment of October 2015 Extreme Precipitation Event on Santee Experimental Forest Watersheds. J. South Carol. Water Resour. 2016, 3, 19–30. [Google Scholar] [CrossRef]
  61. Sudduth, K.A.; Kitchen, N.R.; Wiebold, W.J.; Batchelor, W.D.; Bollero, G.A.; Bullock, D.G.; Clay, D.E.; Palm, H.L.; Pierce, F.J.; Schuler, R.T.; et al. Relating apparent electrical conductivity to soil properties across the north-central USA. Comp. Elect. Agric. 2005, 46, 263–283. [Google Scholar] [CrossRef]
  62. Aini, I.N.; Ezrin, M.H.; Aimrun, W. Relationship between Soil Apparent Electrical Conductivity and pH Value of Jawa Series in Oil Palm Plantation. Agr. Agr. Sci. Proc. 2014, 2, 199–206. [Google Scholar] [CrossRef]
  63. Beltran, B.; Amatya, D.M.; Youssef, M.A.; Jones, M.; Skaggs, R.W.; Callahan, T.J.; Nettles, J.E. Impacts of Fertilization Additions on Water chemistry of a Drained Pine Plantation in North Carolina: A Worst Case Scenario. J. Environ. Qual. 2010, 39, 293–303. [Google Scholar] [CrossRef] [PubMed]
  64. Bhat, S.; Hatfield, K.; Jacobs, J.M.; Lowrance, R.; Williams, R. Surface runoff contribution of nitrogen during storm events in a forested watershed. Biogeochemistry 2007, 85, 253–262. [Google Scholar] [CrossRef]
  65. Jiang, R.; Woli, K.P.; Kuramochi, K.; Hayakawa, A.; Shimizu, M.; Hatano, R. Hydrological process controls on nitrogen export during storm events in an agricultural watershed. Soil Sci. Plant Nutr. 2010, 56, 72–85. [Google Scholar] [CrossRef]
  66. Tian, S.; Youssef, M.A.; Skaggs, R.W.; Amatya, D.M.; Chescheir, G.M. Temporal variations and controlling components of nitrogen export from an artificially drained coastal forest. Environ. Sci. Technol. 2012, 46, 9956–9963. [Google Scholar] [CrossRef] [PubMed]
  67. Amatya, D.M.; Chescheir, G.M.; Williams, T.M.; Skaggs, R.W.; Tian, S. Long-Term Water Table Dynamics of Forested Wetlands: Drivers and their Effects on Wetland Hydrology in The Southeastern Atlantic Coastal Plain. Wetlands 2020, 40, 65–79. [Google Scholar] [CrossRef]
  68. Fu, S.; Yang, Y.; Liu, B.; Liu, H.; Liu, J.; Liu, L.; Li, P. Peak flow rate response to vegetation and terraces under extreme rainstorms. Agr. Ecosyst. Environ. 2020, 288, 106714. [Google Scholar] [CrossRef]
  69. Neary, D.G.; Ice, G.G.; Jackson, C.R. Linkages between forest soils and water quality and quantity. Forest Ecol. Manag. 2009, 258, 2269–2281. [Google Scholar] [CrossRef]
  70. Tian, H.; Cheng, X.; Han, H.; Jing, H.; Liu, X.; Li, Z. Seasonal Variations and Thinning Effects on Soil Phosphorus Fractions in Larix principis-rupprechtii Mayr Plantations. Forests 2019, 10, 172. [Google Scholar] [CrossRef]
  71. Iliopoulou, T.; Aguilar, C.; Arheimer, B.; Bermudez, M.; Bezak, N.; Ficchi0, A.; Koutsoyiannis, D.; Parajka, J.; Polo, M.J.; Thirel, G.; et al. A large sample analysis of European rivers on seasonal river flow correlation and its physical drivers. Hydrol. Earth Syst. Sci. 2019, 23, 73–91. [Google Scholar] [CrossRef]
  72. Griffiths, N.A.; Jackson, C.R.; McDonnell, J.J.; Klaus, J.; Du, E.H.; Bitew, M.M. Dual nitrate isotopes clarify the role of biological processing and hydrologic flow paths on nitrogen cycling in subtropical low-gradient watersheds. J. Geophys. Res. 2016, 121, 422–437. [Google Scholar] [CrossRef]
  73. Thi Ha, D.; Ouillon, S.; Van Vinh, G. Water and Suspended Sediment Budgets in the Lower Mekong from High-Frequency Measurements (2009–2016). Water 2018, 10, 846. [Google Scholar] [CrossRef]
  74. Berg, R. Hurricane Joaquin (AL112015), 28 September–7 October 2015, National Hurricane Center Tropical Cyclone Report. 2016. Available online: https://www.nhc.noaa.gov/data/tcr/AL112015_Joaquin.pdf (accessed on 15 October 2024).
  75. Fok, H.S.; Chen, Y.; Ma, Z.; Ferreira, V.G.; Tenzer, R. Geographically-weighted water balance approach for satellite-hydrologic runoff estimation in Mekong Basin under ENSO. Int. J. Appl. Earth Obs. Geoinf. 2023, 118, 103234. [Google Scholar] [CrossRef]
  76. He, Q.; Chun, K.P.; Sum Fok, H.; Chen, Q.; Dieppois, B.; Massei, N. Water storage redistribution over East China, between 2003 and 2015, driven by intra- and inter-annual climate variability. J. Hydrol. 2020, 583, 124475. [Google Scholar] [CrossRef]
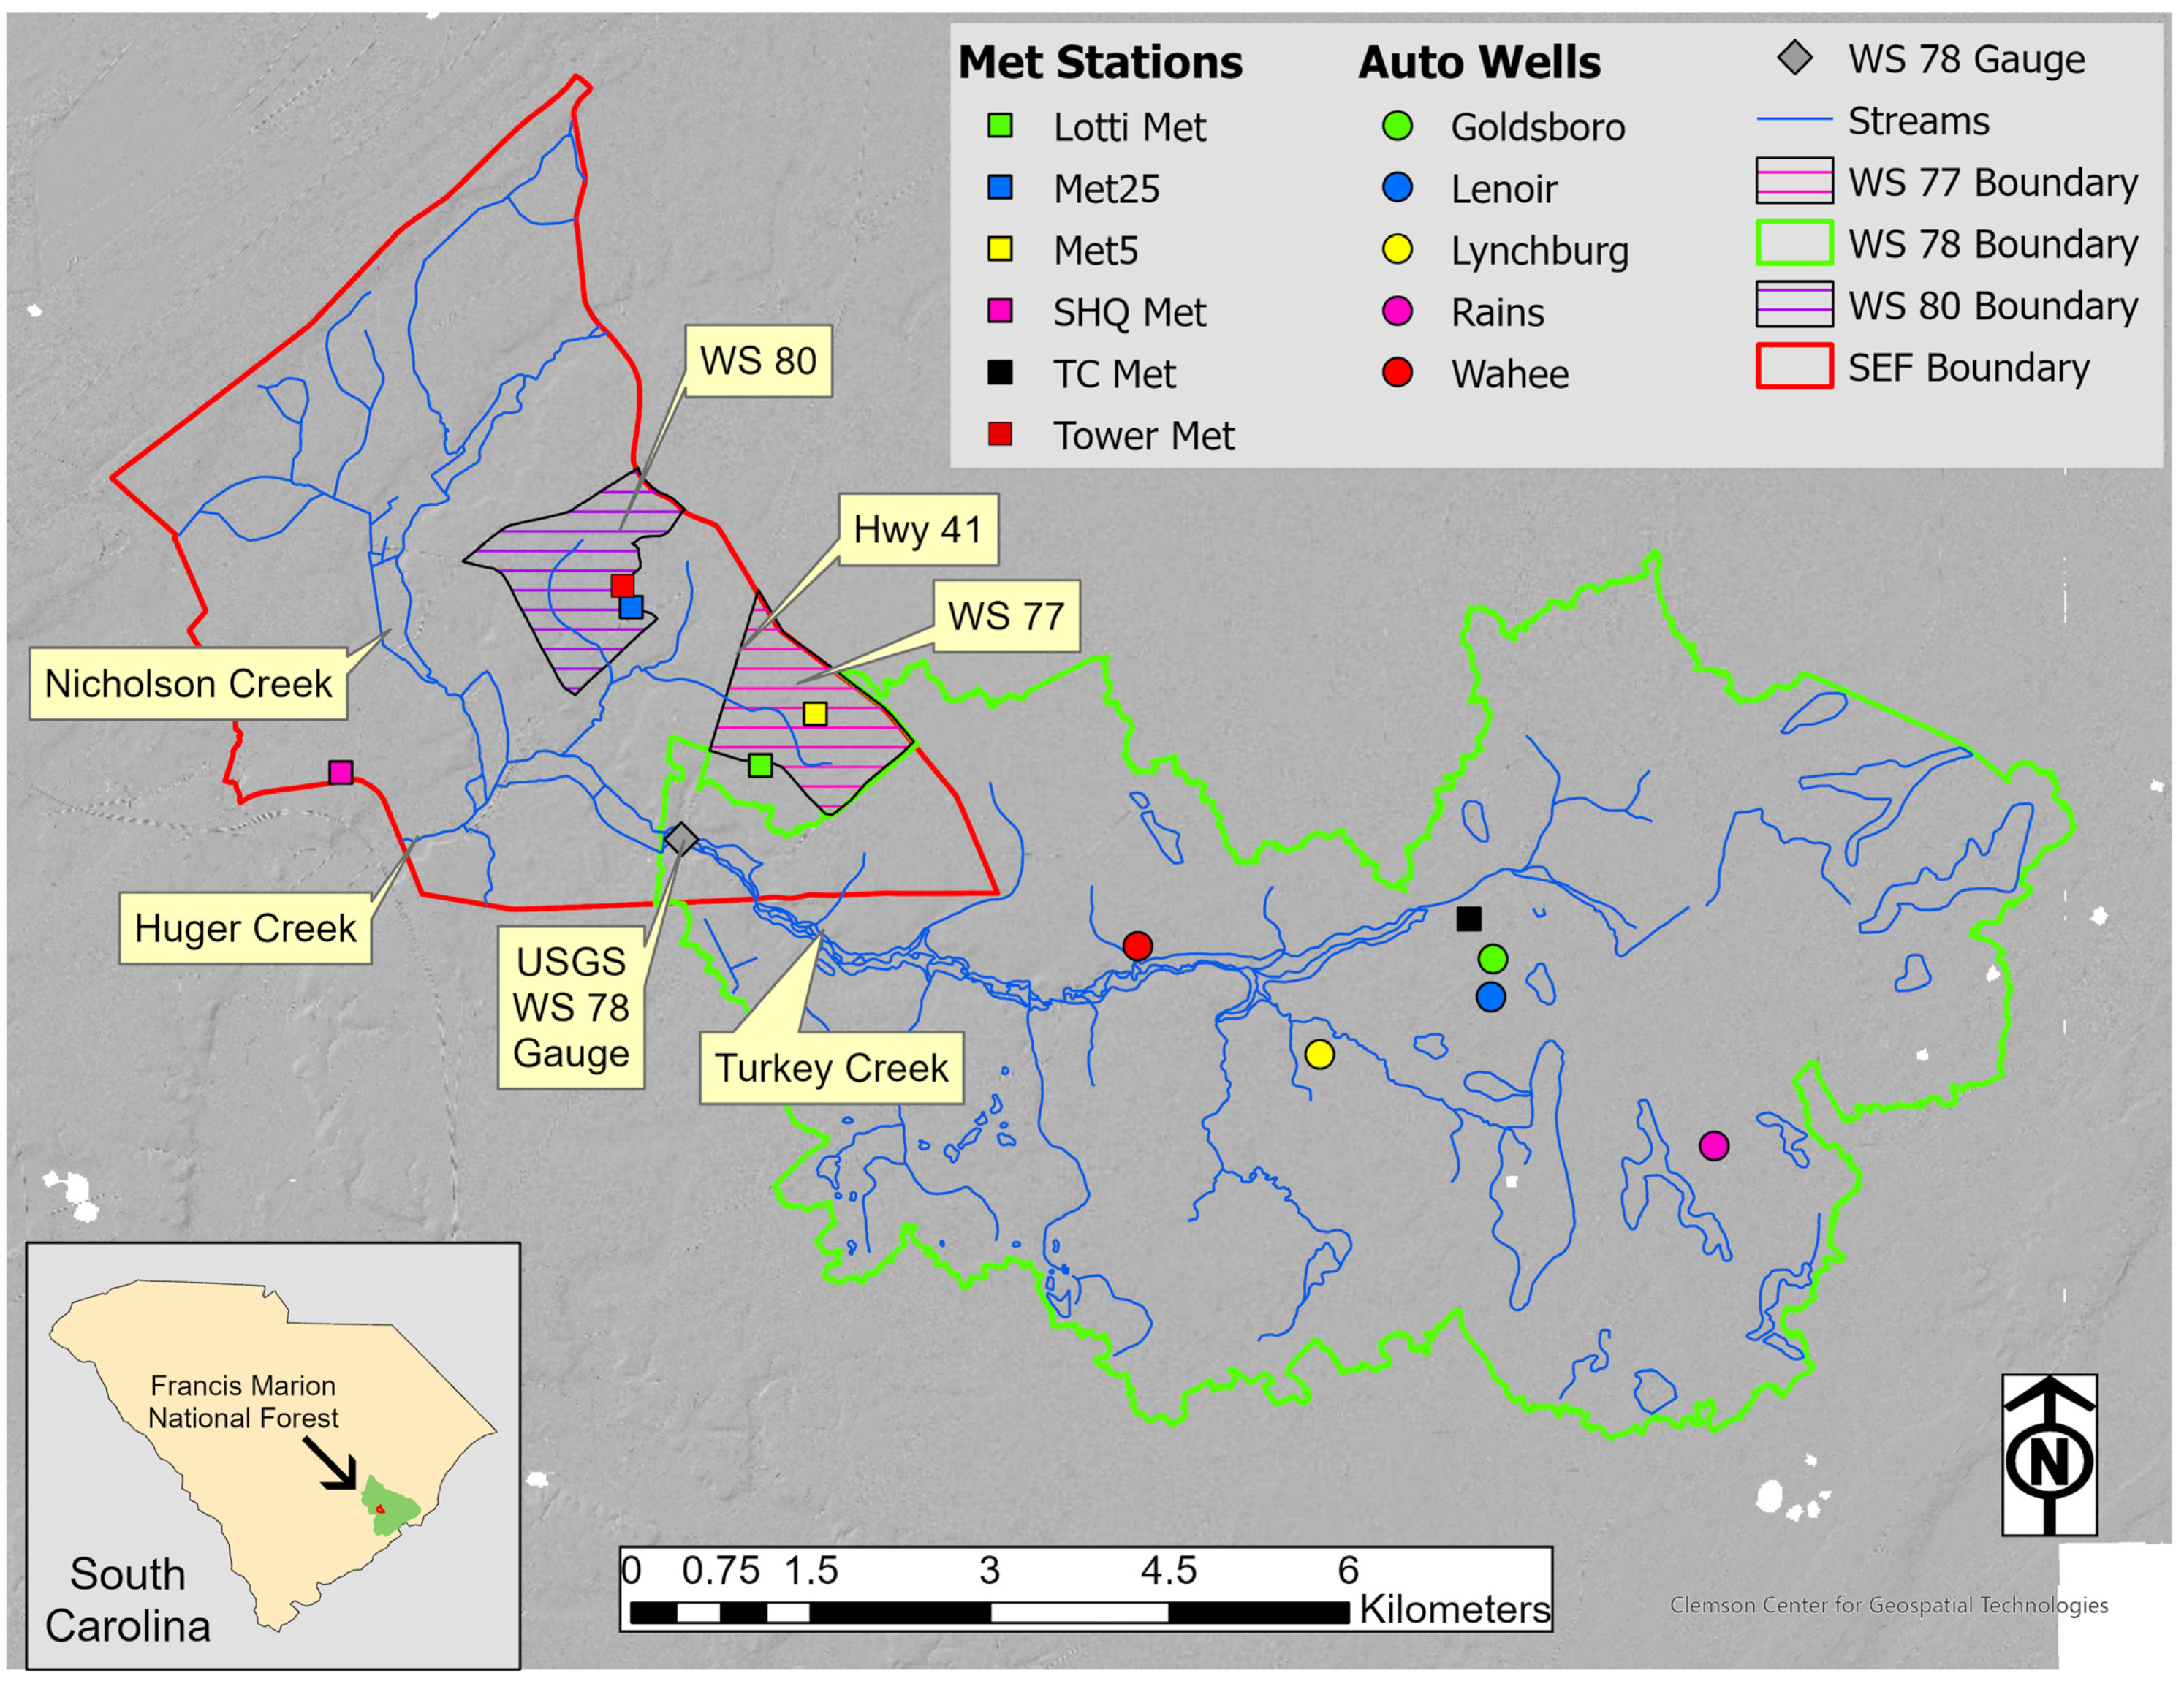
Figure 1. Location map of study watersheds WS77 (treatment) and WS80 (control) in the paired system and WS78 watershed, all within Francis Marion National Forest in coastal South Carolina.
Sustainability 16 09756 g001
Figure 2. Response of (A) flow to precipitation, (B) water table elevation (WTE), (C) concentrations of TDN, TDP, NO3-N+NO2-N, and NH4-N, and (D) loads of biogenic compounds for the WS80 during event 23 September–9 October 2015.
Sustainability 16 09756 g002
Figure 3. Response of (A) flow to precipitation, (B) water table elevation (WTE), (C) concentrations of TDN, TDP, NO3-N+NO2-N, and NH4-N, and (D) loads of biogenic compounds for the WS78 during event 23 September–9 October 2015.
Sustainability 16 09756 g003
Figure 4. Relationships between observed average daily hydrological indicators: (A) flow, (B) precipitation, (C) WTE, and (D) PET and water chemistry indicators: (E) TDN, (F) TDP, (G) NH4-N, and (H) NO3-N by seasons for two periods in WS80: Period A—2011–2014, Period B—2015–2019, vertical lines represent standard deviations.
Sustainability 16 09756 g004
Figure 5. Relationships between observed average seasonal hydrological indicators: (A) flow, (B) precipitation, and (C) WTE and water chemistry indicators: (D) TDN, (E) TDP, (F) NH4-N, and (G) NO3-N by periods in WS77: Period A—2011–2014, Period B—2015–2019, vertical lines represent standard deviations.
Sustainability 16 09756 g005
Figure 6. Relationships between observed average seasonal hydrological indicators (A) flow, (B) precipitation, (C) WTE in Rain series, (D) WTE in Lenoir series, (E) WTE in Goldsboro series, (F) WTE in Lynchburg, and (G) WTE in Wahee series and water chemistry indicators: (H) TDN, (I) TDP, (J) NH4-N, and (K) NO3-N by periods in WS78: Period A—2011–2014, Period B—2015–2019, vertical lines represent standard deviations.
Sustainability 16 09756 g006
Table 1. Results of the Mann–Whitney U-test for significant difference in analyzed parameters between the 2011–2014 and 2015–2019 periods *.
IndicatorWS80WS77WS78
Statistics U Mann–Whitney
Zp ValueZp ValueZp Value
Flow−20.650.00−17.040.00−21.560.00
Precipitation−1.480.14−1.390.17−1.380.17
WTE−26.070.00−22.220.00NULLNULL
WTERainsNULLNULLNULLNULL−23.760.00
WTELenoirNULLNULLNULLNULL−13.500.00
WTEGoldsboroNULLNULLNULLNULL−27.390.00
WTELynchnurgNULLNULLNULLNULL−21.020.00
WTEWaheeNULLNULLNULLNULL−21.400.00
PET0.650.520.650.520.650.52
TDN13.850.008.520.008.380.00
TDP13.740.009.710.002.730.01
NH4-N−3.100.006.280.001.860.06
NO3-N9.670.0011.140.006.540.00
Temperature−1.040.30−0.850.400.090.93
DOC11.960.005.490.005.480.00
Conductivity1.170.247.580.006.090.00
DO2.160.032.420.02−3.240.00
* Values with statistically significant differences for α = 0.05 are shown in red color font. Z—statistic Mann–Whitney U-test, pv—p value (when pv < α then difference is statistically significant), NULL—not applicable.
Table 2. Values of Colwell indicators for WS80 watershed.
Parameter2011–20192011–20142015–2019
PC/PCMPC/PCMPC/PCM
Flow0.560.600.340.220.770.620.480.290.590.420.250.34
Precipitation0.600.680.410.190.710.590.420.290.680.590.400.28
WTE0.400.530.210.190.660.590.390.270.540.410.220.32
PET0.660.580.380.280.730.530.390.340.730.520.380.35
TDN0.730.910.660.070.800.900.720.080.820.820.670.15
TDP0.550.770.420.130.710.820.580.130.700.650.460.25
NH4-N0.460.590.270.190.590.490.290.300.560.500.280.28
NO3-N+NO2-N0.430.660.280.150.690.580.400.290.520.530.280.24
DOC0.750.920.690.060.770.970.750.020.860.780.670.19
Temperature0.790.750.590.200.860.700.600.260.770.750.580.19
Conductivity0.680.940.640.040.720.910.660.060.740.880.650.09
Dissolved oxygen0.630.730.460.170.750.700.530.230.750.570.430.32
Table 3. Values of Colwell indicators for WS77 watershed.
Parameter2011–20192011–20142015–2019
PC/PCMPC/PCMPC/PCM
Flow0.530.590.310.220.730.550.400.330.590.440.260.33
Precipitation0.600.680.410.190.720.590.420.300.680.590.400.28
WTE0.450.660.300.150.610.530.320.290.600.590.350.25
TDN0.690.870.600.090.820.840.690.130.770.790.610.16
TDP0.500.700.350.150.620.690.430.190.640.560.360.28
NH4-N0.530.760.400.130.660.750.500.170.640.630.400.24
NO3-N+NO2-N0.440.750.330.110.640.770.490.150.560.680.380.18
DOC0.670.890.600.070.780.860.670.110.800.770.620.18
Temperature0.870.700.610.260.880.700.620.260.890.690.610.28
Conductivity0.700.940.660.040.730.890.650.080.810.890.720.09
Dissolved oxygen0.710.710.500.210.750.680.510.240.780.630.490.29
Table 4. Values of Colwell indicators for WS78 watershed.
Parameter2011–20192011–20142015–2018
PC/PCMPC/PCMPC/PCM
Flow0.450.500.230.230.690.470.320.370.520.330.170.35
Precipitation0.620.690.430.190.730.620.450.280.690.610.420.27
WTERains0.380.480.180.200.380.480.180.200.580.360.210.37
WTELenoir0.410.550.230.180.570.420.240.330.490.440.220.27
WTEGoldsboro0.520.770.400.120.710.760.540.170.630.730.460.17
WTELynchnurg0.440.620.270.170.640.530.340.300.550.550.300.25
WTEWahee0.500.710.360.150.640.560.360.280.670.730.490.18
TDN0.740.940.700.040.770.870.670.100.770.960.740.03
TDP0.680.860.580.100.720.690.500.220.720.890.640.08
NH4-N0.390.610.240.150.650.580.380.270.500.560.280.22
NO3-N+NO2-N0.360.650.230.130.620.610.380.240.460.570.260.20
DOC0.750.960.720.030.820.860.710.110.740.980.730.01
Temperature0.880.700.620.260.920.710.650.270.890.680.610.28
Conductivity0.660.910.600.060.670.850.570.100.820.910.750.07
Dissolved oxygen0.710.740.530.180.770.650.500.270.820.730.600.22
Disclaimer/Publisher’s Note: The statements, opinions and data contained in all publications are solely those of the individual author(s) and contributor(s) and not of MDPI and/or the editor(s). MDPI and/or the editor(s) disclaim responsibility for any injury to people or property resulting from any ideas, methods, instructions or products referred to in the content.