1. Introduction
Global warming has become a significant threat to human survival, with reducing carbon emissions receiving heightened global attention [
1]. Countries and international organizations such as China, Switzerland, and the United States have implemented various emission reduction measures to address climate change. China actively advocates for low-carbon development, adheres to emission reduction commitments, and has implemented the “dual carbon” strategy which aims to cap carbon emissions by 2030 and achieve carbon neutrality by 2060 [
2]. Switzerland actively supports the development of renewable energy and has established a target for 2035 to increase the share of hydropower, solar energy, and wind energy within its energy mix. Canada established carbon trading systems in 2012 and 2018, respectively, while the U.S. introduced carbon pricing and carbon tax policies [
3]. Furthermore, the European Commission’s “European Green Deal” includes increased funding, enhanced research on emission reduction technologies, and encouragement for private sector investment in green technology development. The International Sustainability Standards Council mandates companies to disclose carbon emissions across their supply chains, encouraging reductions [
4]. As principal emitters, enterprises have the responsibility to reduce emissions through the development and application of low-carbon technologies, which also provide policy incentives for emission reductions [
5].
As consumer environmental awareness grows, there is a shift towards greener lifestyles, with studies confirming the existence of consumer preferences for low-carbon products [
6] and their increasing prominence [
7,
8,
9]. This suggests that companies can expand market share through emission reduction technology development. Economic globalization has led to interconnected business operations and diverse supply chains. Due to technological barriers from production specialization, downstream manufacturers often source core components from upstream suppliers for assembly and sale, prevalent in complex tech products like smartphones and computers. For instance, a laptop might have core processors from AMD and Intel, and advanced LCD screens from Samsung and BOE. In such models, emission reduction research in supply chain nodes shows a diffusion effect, with upstream suppliers also engaging in emission reduction efforts to meet growing low-carbon demand. To enhance the emission reduction level of the end products, some manufacturers, such as Huawei and BYD, include emission reduction clauses in their contracts, requiring suppliers to invest in emission reduction technologies or face the termination of cooperation.
A vertical supply chain refers to a structured network in which different enterprises operate at various stages of production or distribution within the same industry. In contrast, a horizontal supply chain involves collaboration among enterprises at the same stage of production or distribution, which typically compete within the same market. Given that technological exchanges between upstream and downstream firms in product integration can lead to spillover effects, there is potential for emission reduction technology spillovers between suppliers and manufacturers. Bloom et al. [
10] studied technological spillovers and knowledge transfer between similar businesses, noting that spillover directions are not fixed and can occur horizontally among competitors or vertically along the supply chain. Current research indicates that technological spillovers between upstream and downstream firms benefit both firm and supply chain profits [
11]. Unlike production technology, emission reduction technology does not directly enhance individual product profitability but influences firm and supply chain profits through increased market demand. Additionally, different industries face varying difficulties in emission reduction technology development, leading to different R&D costs per unit of emission reduction [
12]. Like decision impact factors, different decision-making models often yield differing outcomes for firms and supply chain profits. Game theory, considering rational strategic behavior in conflict or cooperation scenarios, provides a robust modeling foundation for supply chain management issues [
13,
14].
However, previous research has not explored the impact of emission reduction technology spillovers on vertical supply chain R&D decisions under consumer low-carbon preferences or the interactions between emission reduction technology spillovers, consumer low-carbon preferences, and R&D costs. This paper examines the spillover effects of emission reduction technology within vertical supply chains under low-carbon preferences, focusing on their impact on emission reduction decisions. This research addresses the following questions:
- (1)
How do emission reduction technology spillovers affect supply chain decisions, profits, and emission reduction levels considering consumer low-carbon preferences?
- (2)
What decision-making model should a vertical supply chain with emission reduction spillovers choose to achieve optimal supply chain profit and emission reduction levels?
- (3)
What measures can the government take to assist and promote corporate emission reduction R&D?
To address these questions, a vertical supply chain model consisting of a supplier providing core components and a manufacturer is established. In this structure, emission reduction technology spillovers occur through technical exchanges between suppliers and manufacturers, and such spillovers are bidirectional. This phenomenon exists in both decentralized and centralized models, as seen in HP’s waste collection and greenhouse gas data programs and Apple’s environmental performance standards for suppliers. To investigate the effects of vertical spillovers and decision-making models, four scenarios are considered: centralized and decentralized decisions with and without emission reduction spillovers, simulated using the Stackelberg model.
Compared to existing research, this study has several innovations:
- (1)
It incorporates emission reduction spillover effects in vertical supply chains under the context of consumer low-carbon preferences, examining their impact on supply chain emission reduction investment and pricing decisions;
- (2)
It is found that centralized decision-making is more beneficial for firms’ carbon reduction levels and profits compared to decentralized decision-making. Additionally, increased emission reduction spillover rates, heightened consumer low-carbon preferences, and reduced emission reduction cost coefficients under centralized decision-making create a synergistic effect, improving emission reduction efficiency.
The remainder of this paper is structured as follows:
Section 2 reviews the relevant literature on consumer low-carbon preferences and spillover effects;
Section 3 presents the problem description and model assumptions;
Section 4 derives and compares equilibrium solutions across the four scenarios;
Section 5 offers further discussion through numerical analysis; finally,
Section 6 summarizes our findings and provides managerial insights. All evidence is included in the
Appendix A to enhance the clarity of the paper.
2. Literature Review
This section primarily reviews the literature relevant to this study. The pertinent literature can be categorized into two main aspects: (1) Consumer Preferences for Low Carbon, (2) Supply Chain Emission Reduction Decision, (3) Spillovers of Emission Reduction.
2.1. Supply Chain Emission Reduction Decision
In recent years, both academic and industry researchers have increasingly focused on low-carbon operations within supply chains, recognizing that operational decisions play a critical role in enhancing the greening and sustainability of these systems [
15]. Such operational decisions encompass pricing, production, inventory management, and emission reduction strategies, with the latter particularly vital for improving both economic and environmental performance. Acknowledging the significant influence of government policies on corporate decision-making, numerous studies have explored various policy frameworks. For example, Jauhari et al. [
16] developed a supply chain model to identify optimal investments in emission reduction technology for manufacturers operating under a carbon tax policy.
Collaborative emission reduction strategies among stakeholders, including suppliers, manufacturers, retailers, and governments, have proven effective in significantly improving supply chain efficiency. Zhang et al. [
17] examined the distinctions between centralized and decentralized decision-making, highlighting the impact of consumer low-carbon awareness on order quantities and channel coordination. Gao et al. [
18] addressed the challenges associated with cooperative emission reduction decisions among supply chain members.
Moreover, researchers have applied their findings to specific scenarios to further understand these dynamics. For instance, Yan et al. [
19] proposed a joint reduction model between manufacturers and online retailers regarding low-carbon promotions and emission reduction technologies, revealing that this collaborative approach enhances the overall supply chain performance.
However, the effects of different collaborative approaches on supply chain performance can vary significantly. Yang et al. [
20] observed that horizontal cooperation within the market may harm retailer profits and consumer welfare, while vertical collaboration typically results in greater carbon emission reductions. This body of research highlights the multifaceted nature of low-carbon strategies in supply chains and emphasizes the need for a comprehensive understanding of how these dynamics interact with consumer preferences, government policies, and collaborative efforts among stakeholders. Such insights are essential for effectively integrating emission reduction technologies and achieving sustainable supply chain outcomes.
2.2. Supply Chain Decision with Consumer Low-Carbon Preferences
Under the conditions of consumer low-carbon preferences, the interplay between horizontal and vertical enterprise interactions within the supply chain significantly influences emission reduction decisions. Du et al. [
21] developed a two-level supply chain game model comprising suppliers and manufacturers, analyzing how consumer preferences affect carbon reduction efforts and overall profits. Their findings indicate that centralized decision-making leads to higher levels of emission reduction compared to decentralized approaches. Cheng et al. [
22] applied VI theory to derive non-cooperative game equilibrium solutions for various enterprises, revealing that increased consumer environmental awareness positively influences the operation of supply chain networks. Further research by Peng et al. [
23] examined production, pricing, and carbon reduction strategies in both decentralized and centralized supply chains, introducing an RSS contract that effectively coordinates the supply chain under low-carbon preferences. Wang et al. [
24] demonstrated that the effectiveness of cost-sharing contracts is contingent on power dynamics within the supply chain: higher low-carbon preferences in a retailer-dominated scenario can enhance overall profits, while lower preferences in an equal-power setting can still yield Pareto improvements. Sun et al. [
6] analyzed the effects of the time lag associated with emission reduction technologies and consumer low-carbon preferences on carbon emission transfer and reduction among supply chain participants. They found that consumer preferences positively impact the supply chain, provided the lag time for emission reduction technologies remains within a certain range. Ji et al. [
15] established a dual-channel supply chain decision model under carbon quotas and carbon trading, indicating that high consumer low-carbon preferences increase the likelihood of supply chain members accepting such policies. Fan et al. [
25] developed two game models to explore the influence of retailer altruistic preferences, consumer low-carbon preferences, and decision parameters on the complex nonlinear dynamics of these models.
This body of research underscores the critical role that consumer low-carbon preferences play in shaping the strategies and outcomes of supply chain emission reduction initiatives, paving the way for further exploration of these dynamics in the context of technological spillovers and R&D investments.
2.3. Supply Chain Decision Considering Emission Reduction Spillovers
Under the conditions of technological spillover, both vertical and horizontal enterprises may free ride on emission reduction technologies, which can prevent investing firms from fully capturing the benefits of their innovations [
26]. Ouchida et al. [
27] examined whether competing firms would cooperate in emission reduction efforts under a carbon tax, finding that cooperation can lead to enhanced emission reduction efforts, particularly when horizontal spillovers are significant. Liu et al. [
28] explored the effects of time lags and vertical spillovers on supply chain decisions and environmental policies. Additionally, Jiang et al. [
29] analyzed the impact of technological spillovers and carbon transfer increments on carbon quota allocation, aiming to maximize social welfare through the design of cost-sharing contracts that facilitate coordination in decentralized supply chain decisions. Li et al. [
30] determined that both forward and backward equity holding strategies effectively promote carbon reduction, positively influencing pricing, carbon reduction efforts, and overall profits via technological spillovers. Hsieh et al. [
31] concluded from their study of dual-channel models that spillover effects typically result in a shift in demand from platform-based channels to direct channels. While research on low-carbon consumer demand and emission reduction spillovers has primarily focused on horizontal spillovers—those occurring among competing firms [
32]—vertical emission reduction spillovers have mostly been examined in the context of carbon policies rather than market scale effects. In practical terms, supplier investments in emission reduction can enhance product-level emission reductions, while manufacturer investments are more effective in meeting consumer low-carbon demands. These effects can simultaneously aggregate at the product level [
33] and create positive externalities [
34].
This paper develops a two-tier supply chain game model that consists of a single supplier and a single manufacturer, set against the backdrop of consumer low-carbon preferences. The model optimizes emission reduction levels under two scenarios: one with vertical spillover effects and one without, considering both decentralized and centralized supply chain decisions. This study analyzes and compares the interactions between upstream and downstream firms concerning emission reduction decisions, the influence of consumer low-carbon preferences on these decisions, and the impact of emission reduction spillover rates on decision-making. Ultimately, this research aims to elucidate the mechanisms underlying carbon reduction technology spillovers.
3. Model Assumptions and Notation
Consider a two-tier low-carbon supply chain consisting of a single supplier and a single manufacturer, where the supplier is in a dominant position, and the research and development of carbon reduction technologies exhibit spillover effects. Consumers possess low-carbon preference characteristics. The following assumptions are made:
(1) Both the supplier and the manufacturer engage in the research and development of emission reduction technologies. The supplier’s level of emission reduction technology development is denoted as
, while the manufacturer’s level of emission reduction technology development is also
. The spillover coefficient for the manufacturer is
, and the spillover coefficient for the supplier is
. In the presence of mutual spillover effects, the effective emission reduction level for the supplier is
, and the effective emission reduction level for the manufacturer is
. The similarity in spillover coefficients between upstream and downstream firms does not affect the key results and conclusions. It is assumed that
and
. The symbolic references are shown in
Table 1.
(2) If both firms and the government impose strict protections on emission reduction R&D technologies, making it difficult for these technologies to spill over between upstream and downstream entities within the supply chain, market demand
is influenced by the potential market demand size 1, the firm’s own price
, the consumer’s low-carbon preference coefficient
, the supplier’s emission reduction level
, and the manufacturer’s emission reduction level
. In this scenario, market demand is given by
[
15]. Conversely, if the government and firms either do not provide any protection or only offer partial protection for the results, leading to mutual spillover of emission reduction R&D technologies between upstream and downstream entities with a spillover coefficient of
, then market demand is given by
.
(3) The cost of emission reduction R&D exhibits a quadratic relationship with the level of emission reduction. The R&D cost coefficient for the supplier is
and for the manufacturer, it is
. Thus, the emission reduction costs for the supplier and the manufacturer are denoted as
and
[
19], respectively. The similarity in R&D cost coefficients for upstream and downstream firms does not affect the key results and conclusions. It is assumed that
.
(4) The marginal production cost for the supplier is . The supplier provides components to the manufacturer at a wholesale price and sells them to low-carbon preference consumers at a retail price . For simplicity, it is assumed that the cost incurred by the manufacturer for processing the components is zero.
(5) To ensure that the equilibrium solution is meaningful, the emission reduction cost coefficient , indicating that firms must incur sufficiently high costs for emission reduction, thereby restricting their emission reduction efforts. To guarantee market demand, . To ensure profitability for producers under non-competitive market conditions, . Given that consumers have low-carbon preferences, .
4. Optimization of Emission Reduction Decisions When Considering Vertical Spillover Effects
Without vertical spillover effects, the firm fully protects its own emission reduction R&D technologies, preventing any spillover of emission reduction technologies between upstream and downstream entities within the supply chain. With vertical spillover effects, firms either provide no protection or only partial protection for their results, the emission reduction R&D technologies in the supply chain spill over between the supplier and the manufacturer. So, four scenarios are considered: centralized and decentralized decisions with and without emission reduction spillovers.
4.1. Centralized Decision-Making Scenario Without Considering Vertical Spillover Effects
Under centralized decision-making, the supplier and the manufacturer fully align their operations and jointly make decisions to maximize the overall benefits of the supply chain.
Supply chain profit is derived by subtracting the production costs of components and the research and development costs for emission reduction technologies incurred by both manufacturers and suppliers from the revenue generated by product sales. The profit function for the supply chain is:
4.2. Decentralized Decision-Making Scenario Without Considering Vertical Spillover Effects
Under decentralized decision-making, the supplier and the manufacturer make independent decisions aimed at maximizing their individual interests. The supplier first determines the emission reduction level and the wholesale price of the components, while the manufacturer subsequently decides on the emission reduction level and the retail price .
The supplier’s profit is calculated by subtracting production costs and research and development costs for emission reduction technologies from the revenue generated by the sale of components. Meanwhile, the manufacturer’s profit is determined by subtracting procurement costs of components and research and development costs for emission reduction technologies from the revenue generated by product sales. The profit functions for the supplier and the manufacturer are as follows:
4.3. Centralized Decision-Making Scenario with Considering Vertical Spillover Effects
When firms either provide no protection or only partial protection for their results, the emission reduction R&D technologies in the supply chain spill over between the supplier and the manufacturer. This scenario is examined under both centralized and decentralized decision-making conditions.
Under centralized decision-making, considering vertical spillovers in emission reduction, the supply chain jointly decides on the emission reduction level and retail price to maximize the overall supply chain benefits. The supply chain profit function is:
4.4. Decentralized Decision-Making Scenario with Considering Vertical Spillover Effects
Under decentralized decision-making with vertical spillovers in emission reduction, the supplier and manufacturer each make independent decisions aimed at maximizing their own interests. The supplier first determines the emission reduction level
and the wholesale price
, while the manufacturer subsequently decides on the emission reduction level
and the retail price
. The profit functions for the supplier and manufacturer are:
Lemma 1. The emission reduction levels, equilibrium prices, equilibrium profits for the supplier and manufacturer, as well as the supply chain profit under four scenarios are shown in Table 2. 5. Analysis of Emission Reduction Decisions When Considering Vertical Spillover Effects
To clarify the mathematical relationships between emission reduction levels, prices, profit and consumer preference coefficients, emission reduction cost coefficients, vertical spillover coefficients under four scenarios, we performed partial derivatives of the emission reduction levels and prices with respect to the decision variables and profit. This analysis led to the formulation of Proposition 1 to 4, with detailed results presented in
Table 3.
This study posits that low-carbon preferences influence the choice of decision-making mode. However, Liu and Zhu [
28] incorporated consumer low-carbon preferences as an exogenous variable to compare the performance of centralized and decentralized decision-making models within supply chains. To clarify the mathematical relationships among centralized supply chain profit, emissions reduction levels, prices, consumer preference coefficients, and emissions reduction cost coefficients, we performed partial derivatives of the emissions reduction levels and prices with respect to the decision variables and profit. This analysis led to the formulation of Proposition 1:
- (1)
As consumer low-carbon preferences increase, product prices also rise, and both the emission reduction levels and profits of the manufacturer and supplier increase. This occurs because higher consumer low-carbon preferences encourage the supplier and manufacturer to invest more in emission reduction R&D to expand the market, thereby increasing emission reduction levels and product prices in line with the heightened low-carbon focus. Centralized decision-making significantly reduces decision-making inefficiencies, and consumer low-carbon preferences provide an incentive for increased R&D investments in emission reduction. When consumer low-carbon preferences are high, supply chain decision-makers should increase investment in emission reduction technologies to meet consumer demand and enhance supply chain profits;
- (2)
A high emission reduction cost coefficient negatively impacts both the emission reduction levels and product prices within the supply chain. Specifically, such a coefficient diminishes the motivation and enthusiasm for investing in emission reduction technologies, resulting in lower emission reduction outcomes, a partial loss of low-carbon consumers, decreased product prices, and ultimately reduced supply chain profits. In situations where the emission reduction cost coefficient is high, a centralized supply chain may opt to lower its emission reduction levels to alleviate cost pressures. Conversely, when the emission reduction cost coefficient is lower, a centralized supply chain is likely to increase investments in emission reduction R&D, thereby enhancing overall supply chain benefits.
To provide a clear depiction of how consumer low-carbon preferences and emission reduction costs affect environmental performance and profit under decentralized decision-making without spillovers, we conducted a sensitivity analysis on this aspect as well, leading to Proposition 2:
- (1)
As consumer low-carbon preferences increase, the wholesale price, retail price, emission reduction levels of both the supplier and manufacturer, and the profits of both the supplier and manufacturer, as well as the total supply chain profit, all rise. This indicates that even with marginal effects present under decentralized decision-making, consumer low-carbon preferences can enhance the supply chain’s emission reduction levels to meet low-carbon market demands, reduce efficiency losses, and increase profit margins;
- (2)
An increase in the emission reduction cost coefficient will lower prices, supply chain profits, and emission reduction levels. This reflects that whether under centralized or decentralized decision-making, a higher emission reduction cost coefficient diminishes the supply chain’s enthusiasm for emission reduction, making it challenging to meet consumer low-carbon demands, and consequently reducing profits. In response to a higher emission reduction cost coefficient, manufacturers and suppliers may adjust by lowering retail and wholesale prices to achieve equilibrium.
Jiang et al. [
29] elucidate how centralized decision-making models manage technology spillovers through unified coordination and resource allocation, highlighting the advantages of centralized systems in managing emission technology spillovers. In contrast, our study differentiates supplier and manufacturer profits, prices, and emission levels with respect to different vertical spillover rates, low-carbon preference coefficients, and emission reduction cost coefficients under centralized decision-making. We investigate the impact mechanism of centralized decision-making on profits and decision variables when consumer low-carbon preferences are considered, leading to Proposition 3:
- (1)
As the vertical spillover rate increases, the retail price of the product decreases, while the emission reduction levels of both the supplier and manufacturer, as well as the supply chain profit, increase. A higher vertical spillover rate enhances the degree of sharing of emission reduction R&D technologies between the supplier and manufacturer, thereby improving the efficiency of R&D in emission reduction technologies, increasing the emission reduction levels, and boosting the supply chain profit;
- (2)
The consumer low-carbon preference coefficient positively influences the retail price, the emission reduction levels of both the supplier and manufacturer, and the supply chain profit. Under vertical spillover in emission reduction, a higher consumer low-carbon preference effectively enhances the enthusiasm of supply chain members for emission reduction R&D, leading to increased investment in emission reduction technologies, higher retail prices, and greater supply chain profits;
- (3)
With vertical spillover in emission reduction, an increase in the emission reduction cost coefficient will raise product prices, decrease the emission reduction enthusiasm of supply chain members, and reduce the supply chain profit.
Proposition 3 indicates that, from the perspectives of supply chain profit and emission reduction levels, when faced with the challenges of complex emission reduction technology R&D, both upstream and downstream entities within the supply chain should enhance technological exchange and the sharing of research results, increase the rate of emission reduction spillover, and mitigate the negative impacts of high R&D costs. This approach will facilitate profit growth while simultaneously meeting consumer low-carbon demands.
To clearly illustrate how consumer low-carbon preferences, emission reduction spillovers, and emission reduction costs affect environmental performance and profits under decentralized decision-making, we differentiate between the profits of suppliers, manufacturers, and the overall supply chain, correlating these with the decision variables. This analysis leads to Proposition 4:
- (1)
An increase in the vertical spillover rate will enhance the enthusiasm for emission reduction R&D within the supply chain, raise the retail price of emission reduction products, increase the wholesale price of components, and boost the profits of supply chain members. This reflects that the exchange and sharing of emission reduction R&D technologies between upstream and downstream entities benefit the growth of firm profits and promote emission reduction within the supply chain;
- (2)
Similar to the scenario without spillovers, an increase in consumer low-carbon preferences promotes the emission reduction R&D levels of both the supplier and manufacturer, leading to higher wholesale and retail prices. An increase in the emission reduction cost coefficient will weaken the emission reduction enthusiasm of supply chain members, decrease product prices, and supplier profits. Unlike the no-spillover scenario, the manufacturer’s profit will continue to increase with the rise in the emission reduction cost coefficient.
Proposition 4 indicates that, from the perspective of reducing carbon emissions, both higher consumer low-carbon preferences and increased vertical spillover levels in emission reduction technology can effectively enhance the emission reduction levels within the supply chain. Governments should collaborate with businesses to promote low-carbon initiatives and encourage consumer low-carbon consumption. Additionally, efficient communication and the sharing of emission reduction R&D technologies and results between upstream and downstream entities in the supply chain can improve the efficiency of emission reduction efforts.
We compared the levels of emission reduction under scenarios with and without spillover effects, revealing the mathematical relationships between the difference of the two, the emission reduction spillover rate, the consumer low-carbon preference coefficient, and the emissions reduction cost coefficient. For detailed results, see Proposition 5.
- (1)
, , , ;
- (1)
, , , , , .
Proposition 5 reveals the mathematical relationships between the emission reduction levels of suppliers and manufacturers under centralized and decentralized decision-making, considering the presence or absence of vertical spillover effects. It examines how these levels and their differences relate to the vertical spillover rate, consumer low-carbon preference coefficient, and emission reduction cost coefficient:
- (1)
Regardless of whether decision-making is centralized or decentralized, the emission reduction levels of suppliers and manufacturers are higher under vertical spillover effects compared to scenarios without vertical spillovers. This indicates that supply chains with vertical spillovers in emission reduction have a distinct advantage in achieving low-carbon reductions compared to those without;
- (2)
Whether decision-making is centralized or decentralized, the difference in emission reduction levels between vertical and non-vertical spillover scenarios increases with higher vertical spillover rates and higher consumer low-carbon preferences, while it decreases with higher emission reduction cost coefficients. This suggests that supply chains with higher vertical spillover rates, higher consumer low-carbon preferences, and lower emission reduction cost coefficients facilitate more effective communication and sharing of emission reduction R&D technologies among suppliers and manufacturers, leading to more efficient emission reduction levels.
6. Numerical Analysis
The numerical analysis is used to examine the impact of consumer low-carbon preference coefficients, vertical spillover rates, and emission reduction cost coefficients on the emission reduction levels and profits within the supply chain in depth. The parameters are set to meet the model’s conditions without loss of generality, with , , , assumed.
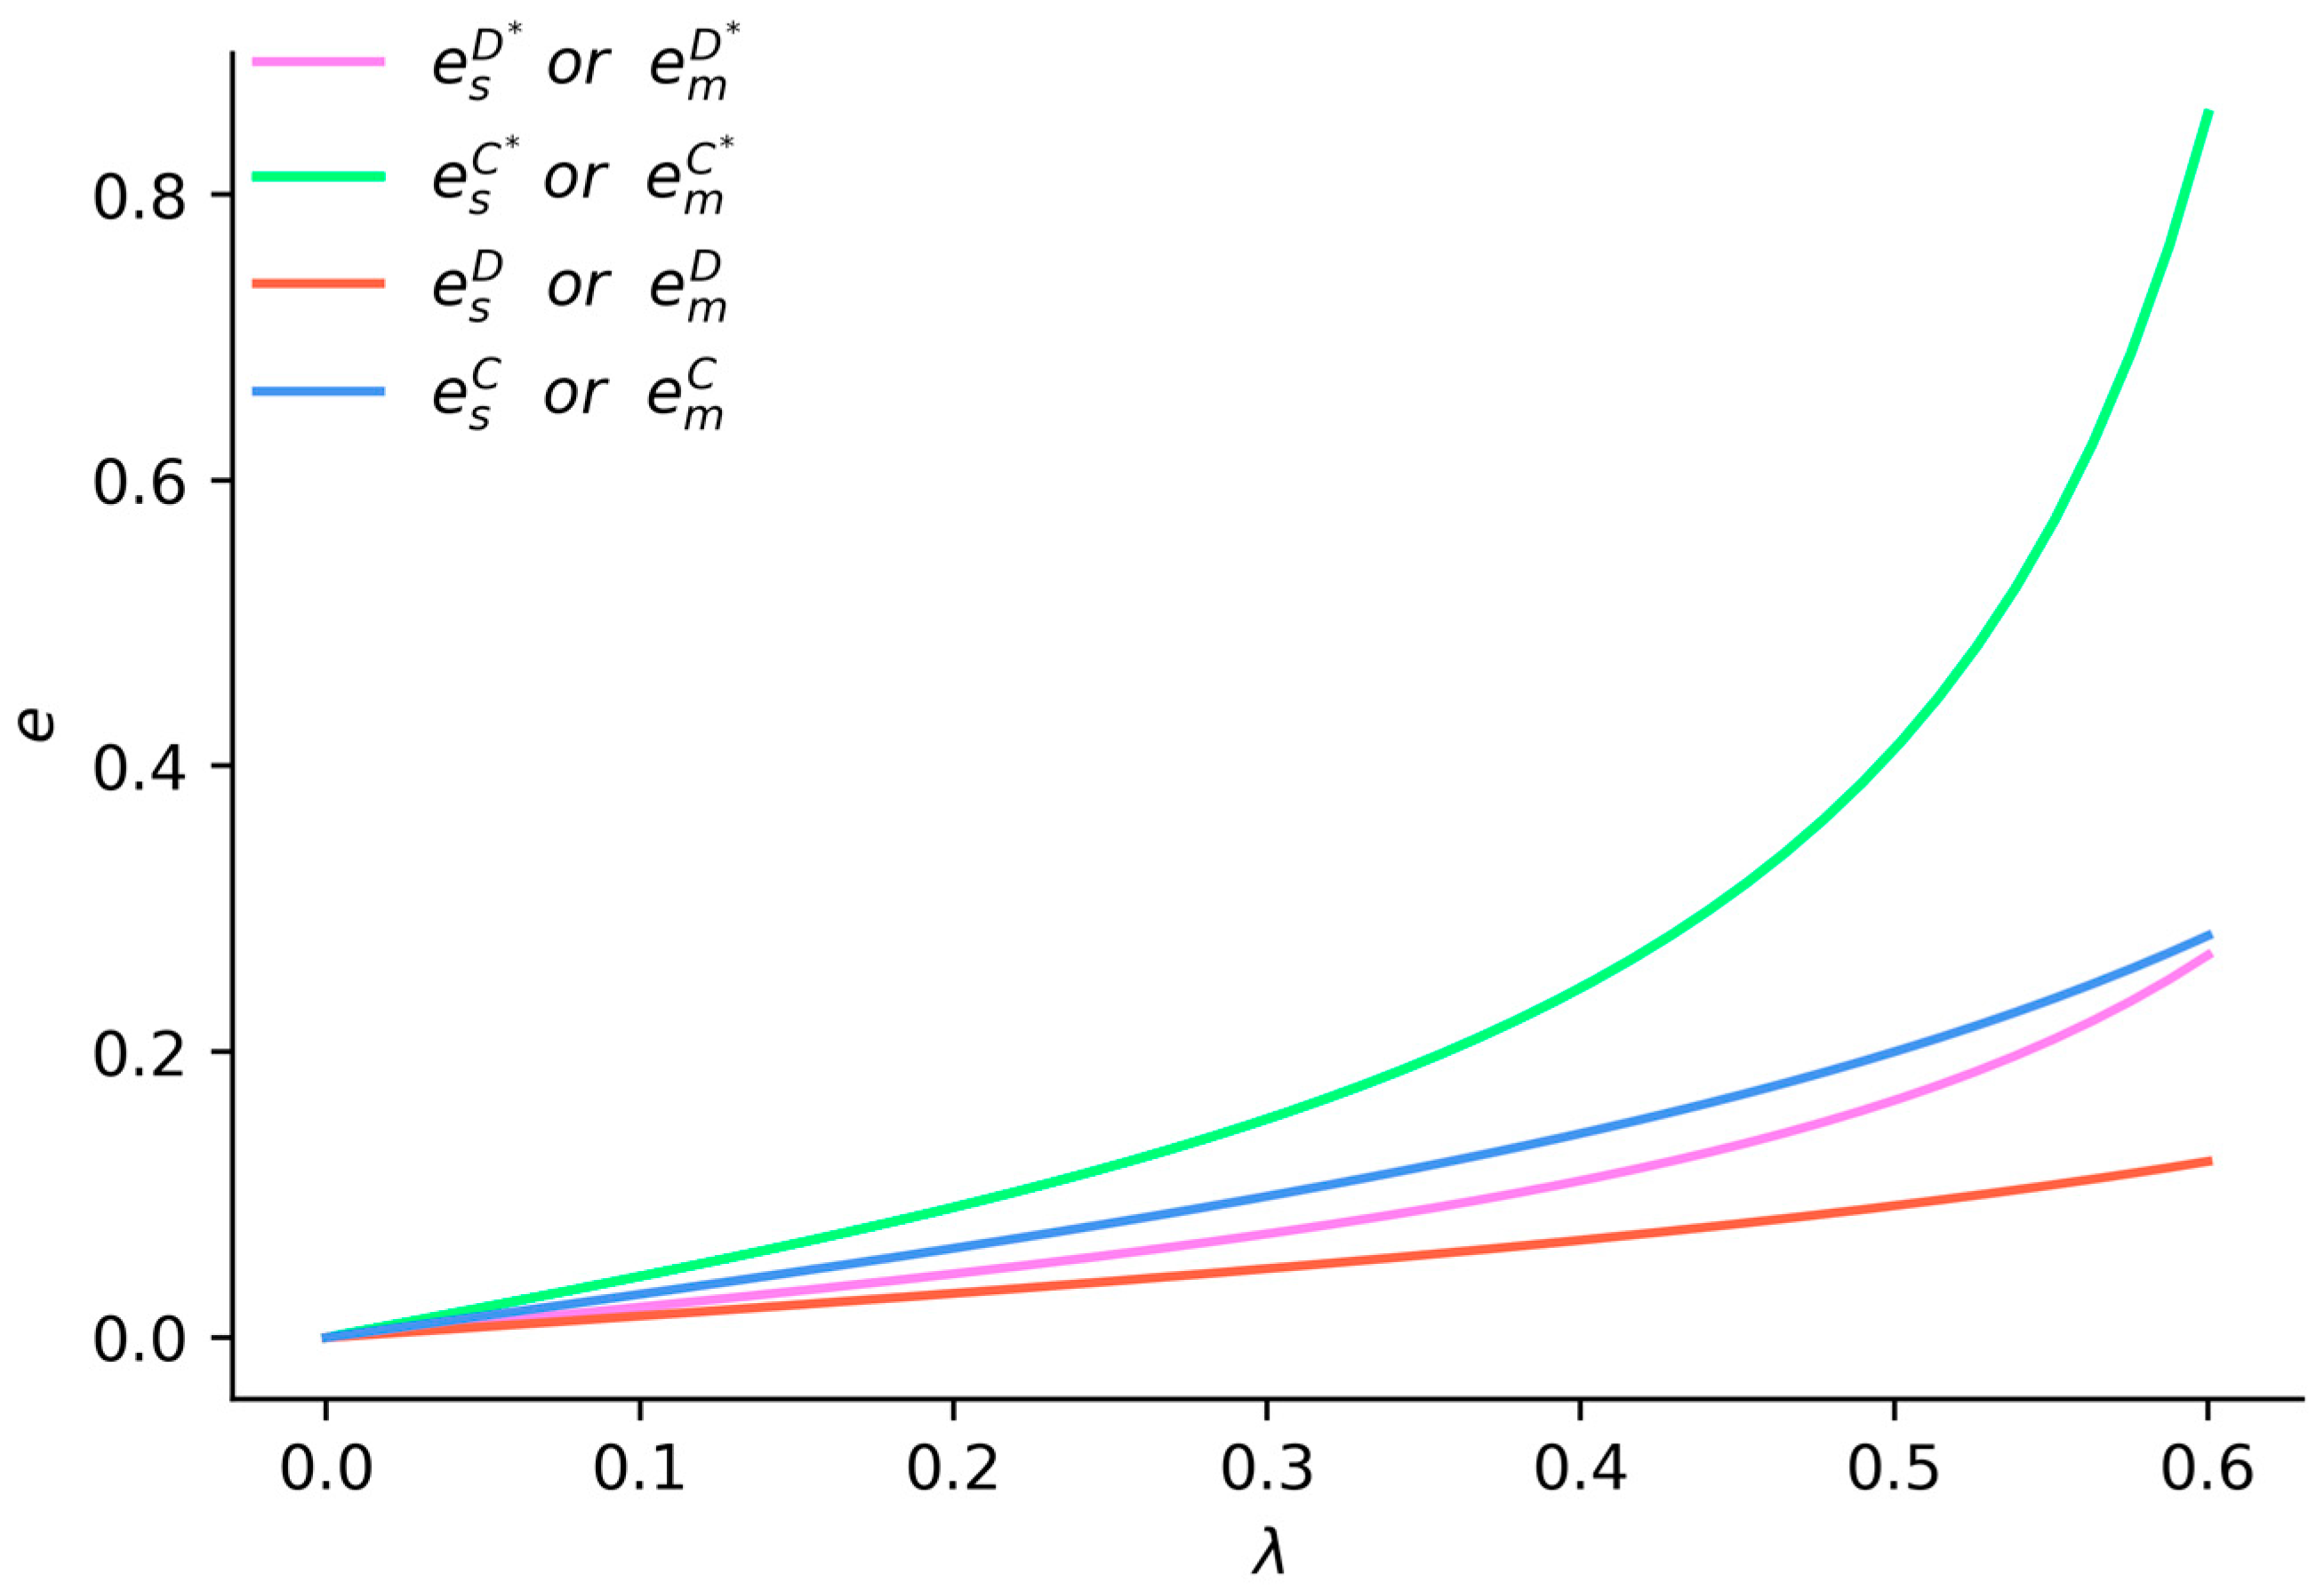
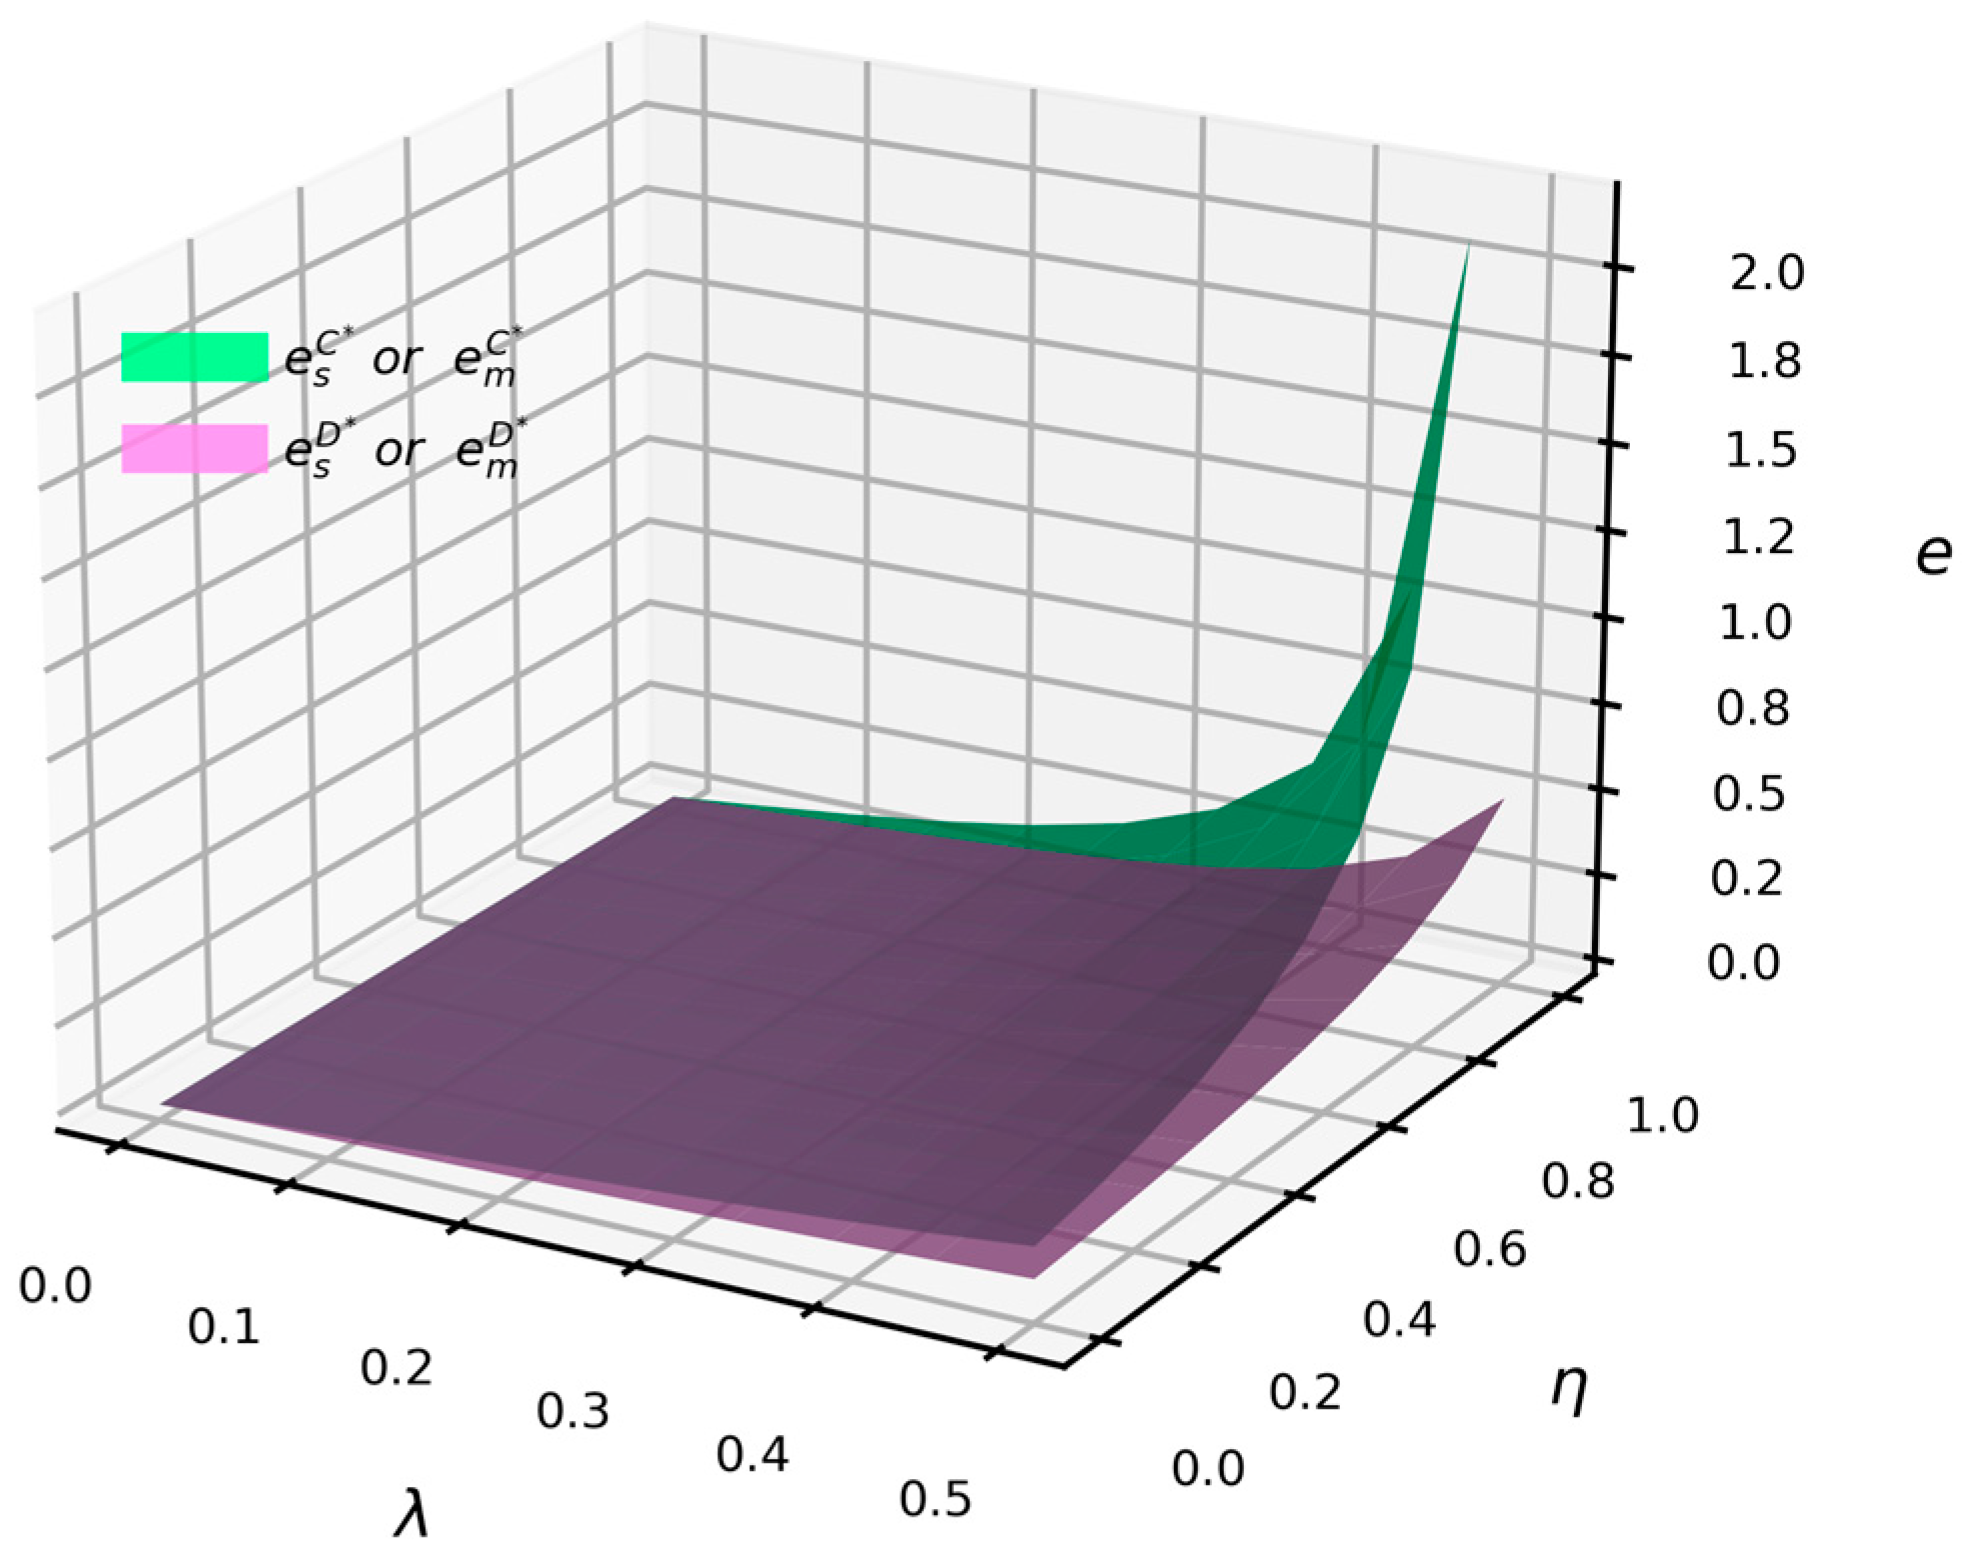
Figure 1 illustrates that when
, the emission reduction levels of both suppliers and manufacturers increase with rising consumer low-carbon preferences under both centralized and decentralized decision-making. Under centralized decision-making, the emission reduction levels of suppliers and manufacturers are higher compared to decentralized decision-making. Furthermore, under vertical spillovers in emission reduction, the emission reduction levels of suppliers and manufacturers exceed those in scenarios without vertical spillovers, and this disparity widens with an increase in consumer low-carbon preferences. This indicates that the emission reduction levels of upstream and downstream entities in the supply chain are influenced not only by whether the upstream and downstream entities are engaged in cooperative or competitive decision-making but also by the presence of vertical spillovers in emission reduction. Enhancing the enthusiasm for emission reduction in the supply chain can be achieved through cooperative decision-making and the sharing of R&D outcomes to promote vertical spillovers.
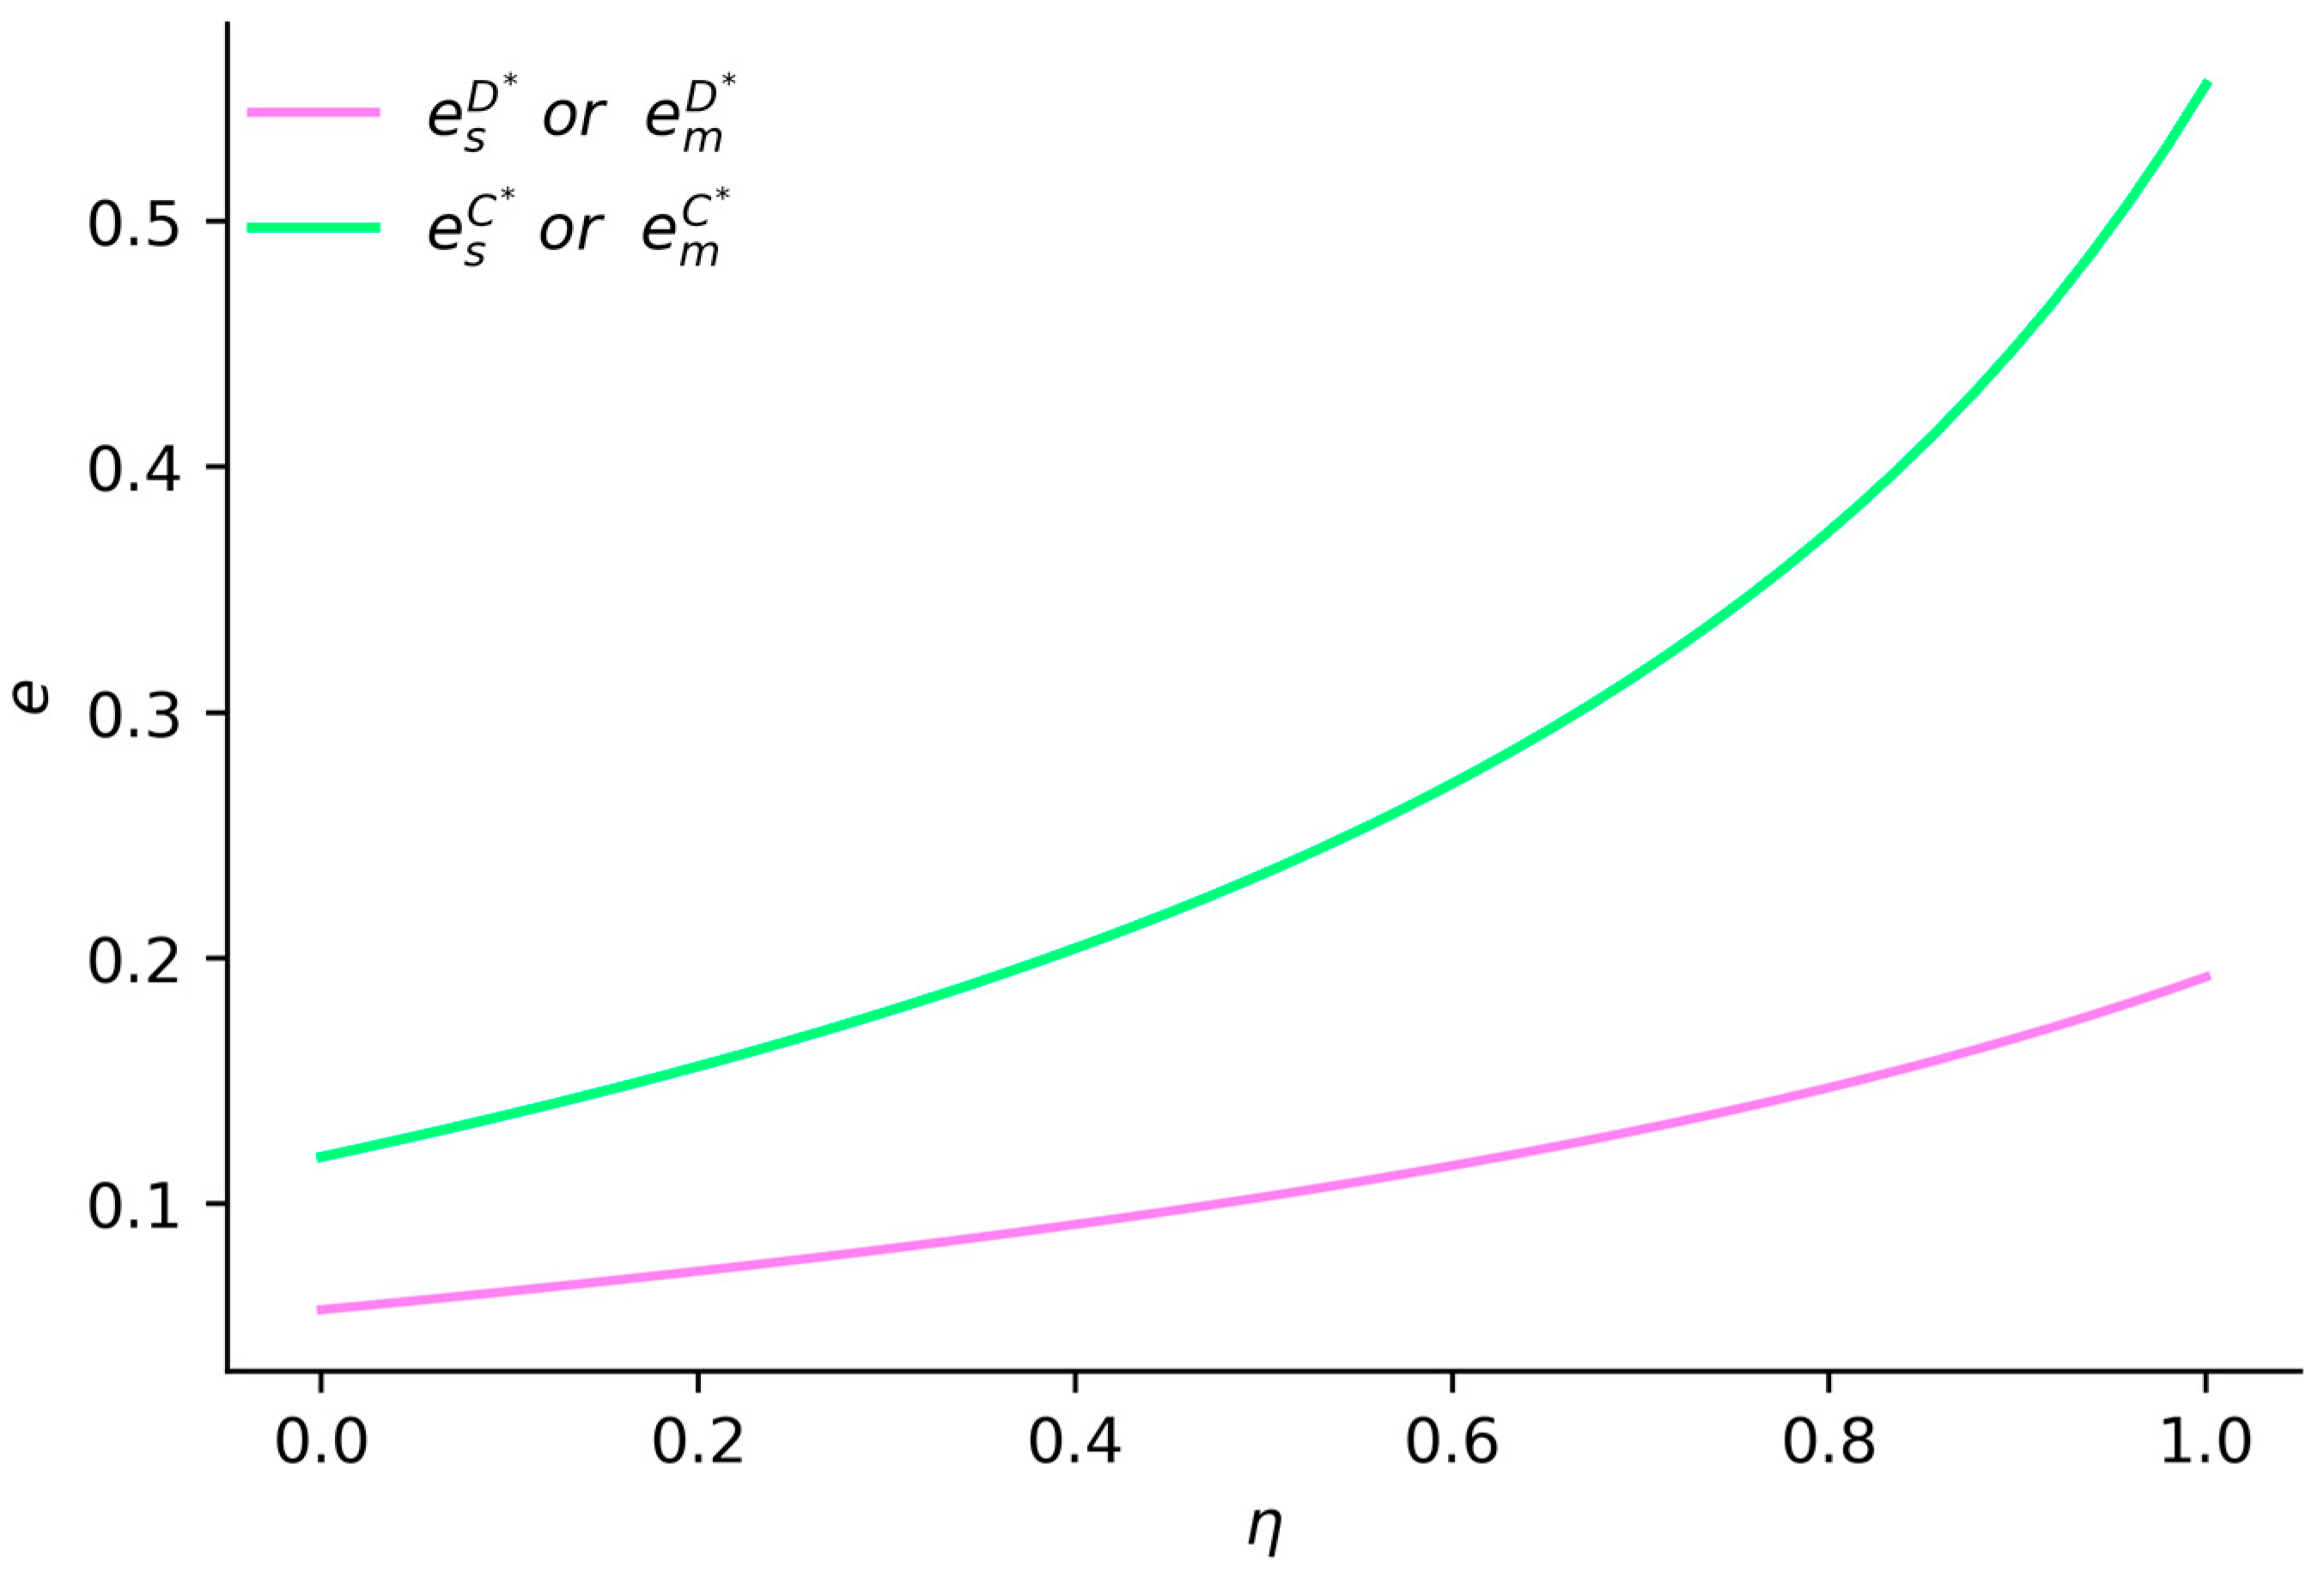
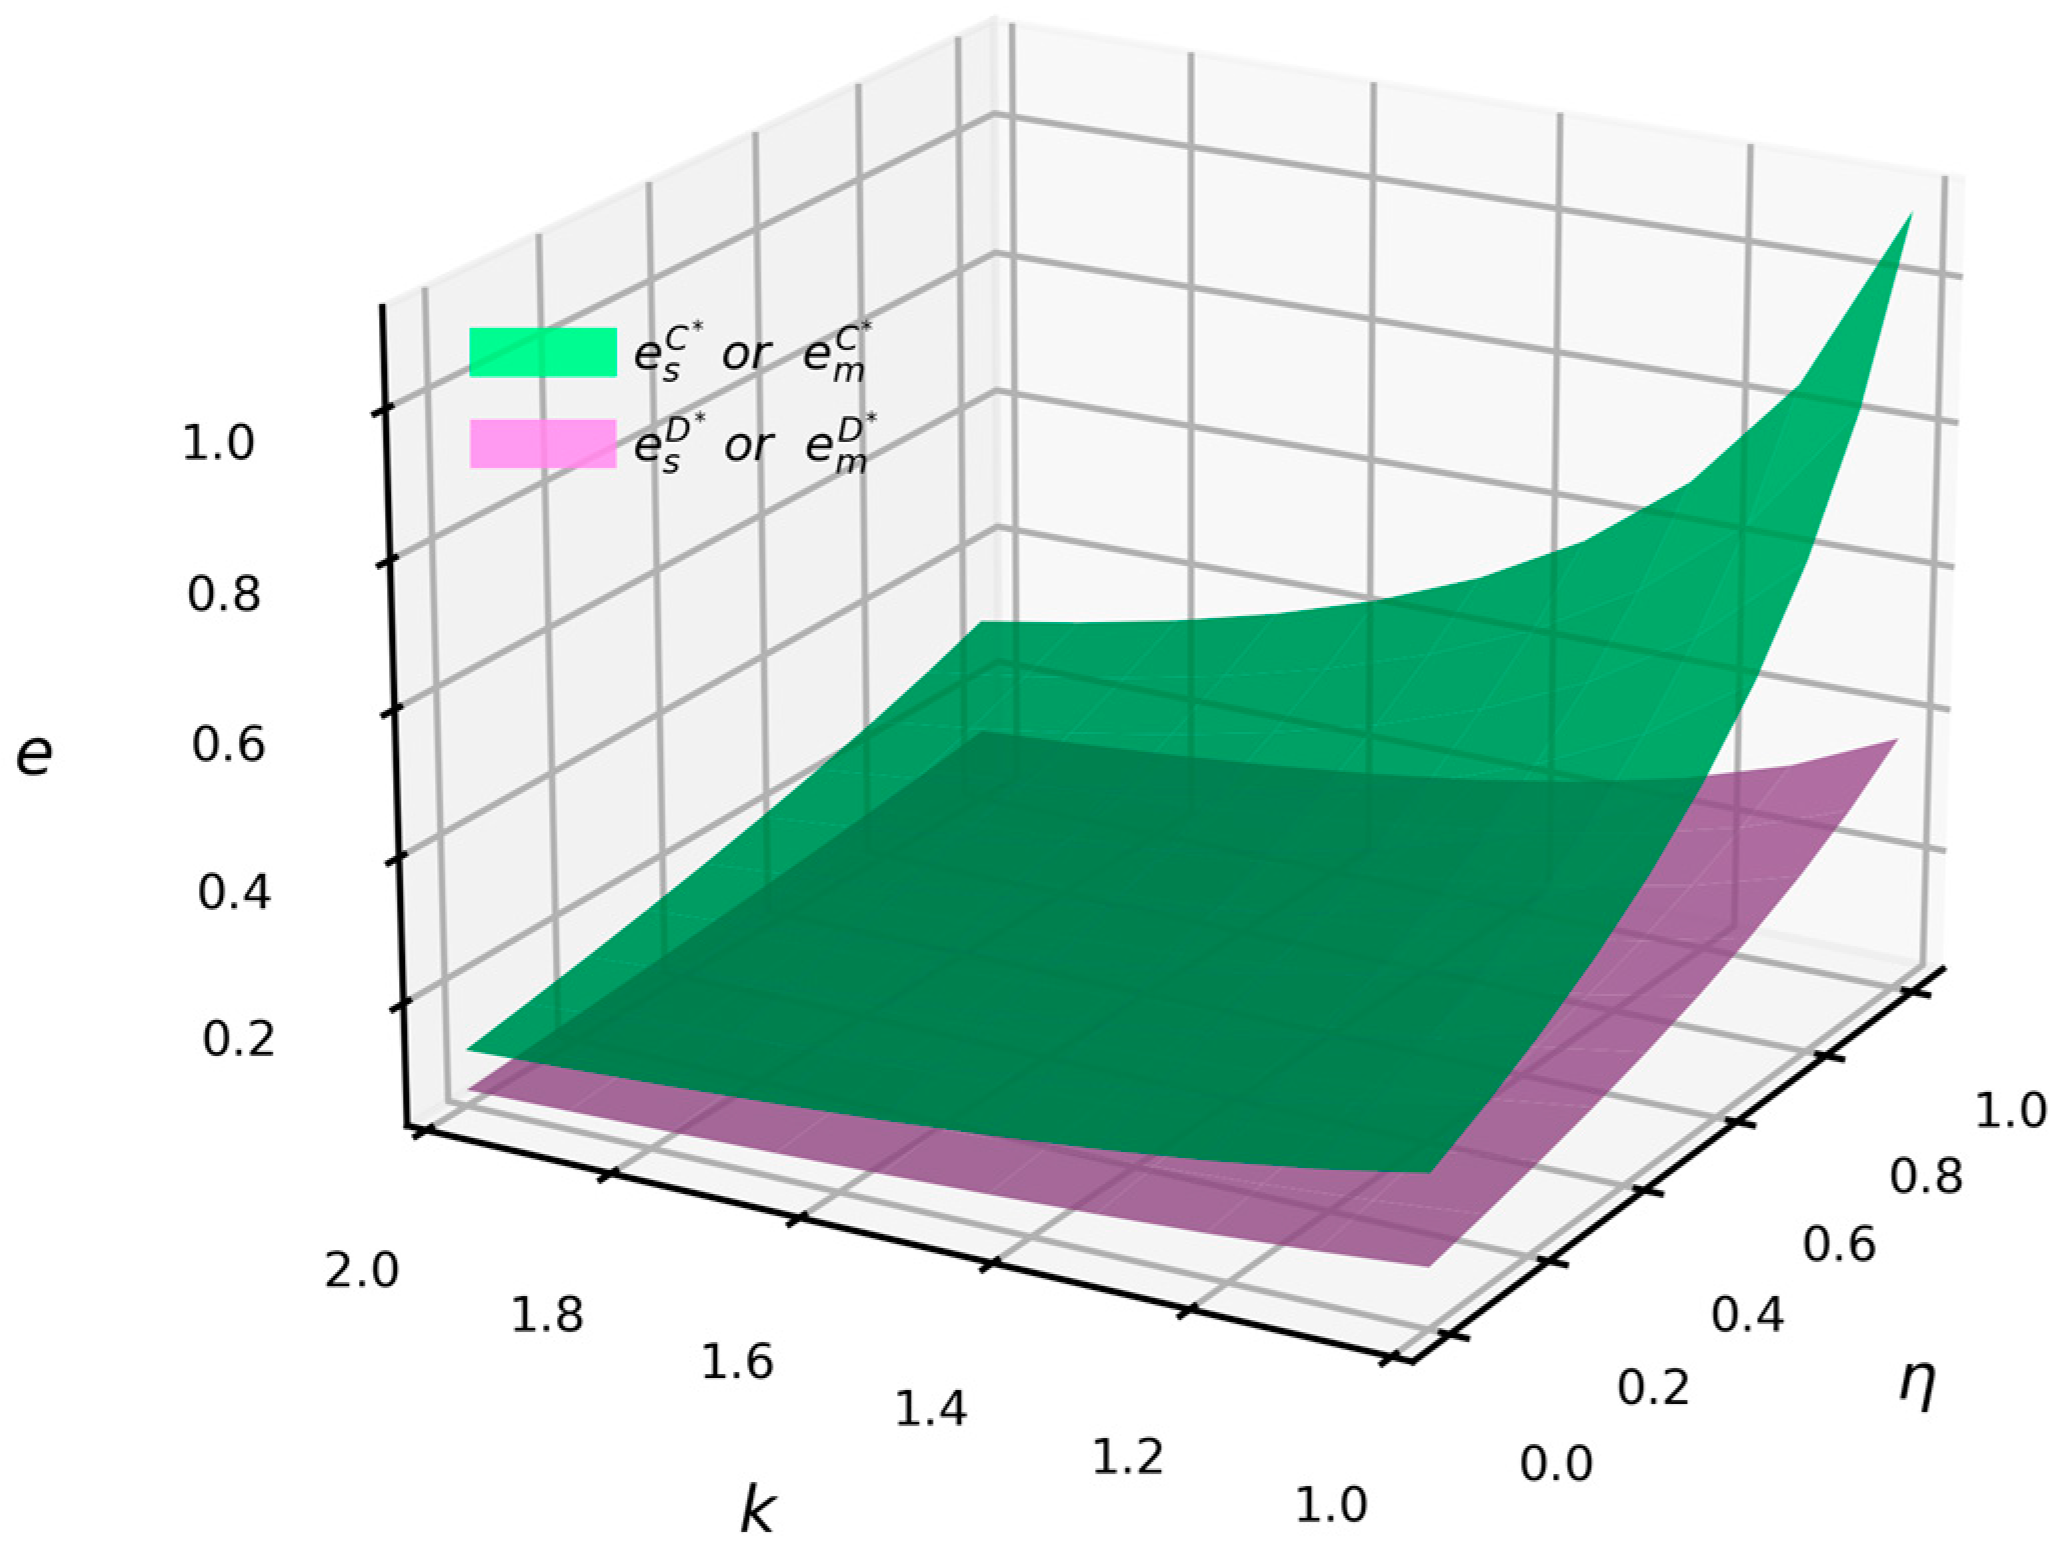
Figure 2 illustrates that when
, both the emission reduction levels of suppliers and manufacturers under decentralized decision-making, as well as the supply chain profit under centralized decision-making, increase with a higher vertical spillover rate. The emission reduction levels of suppliers and manufacturers under centralized decision-making are higher compared to those under decentralized decision-making, and the disparity between them grows with an increase in the vertical spillover rate. This indicates that centralized decision-making is more effective than decentralized decision-making in enhancing the enthusiasm of both manufacturers and suppliers for emission reduction.
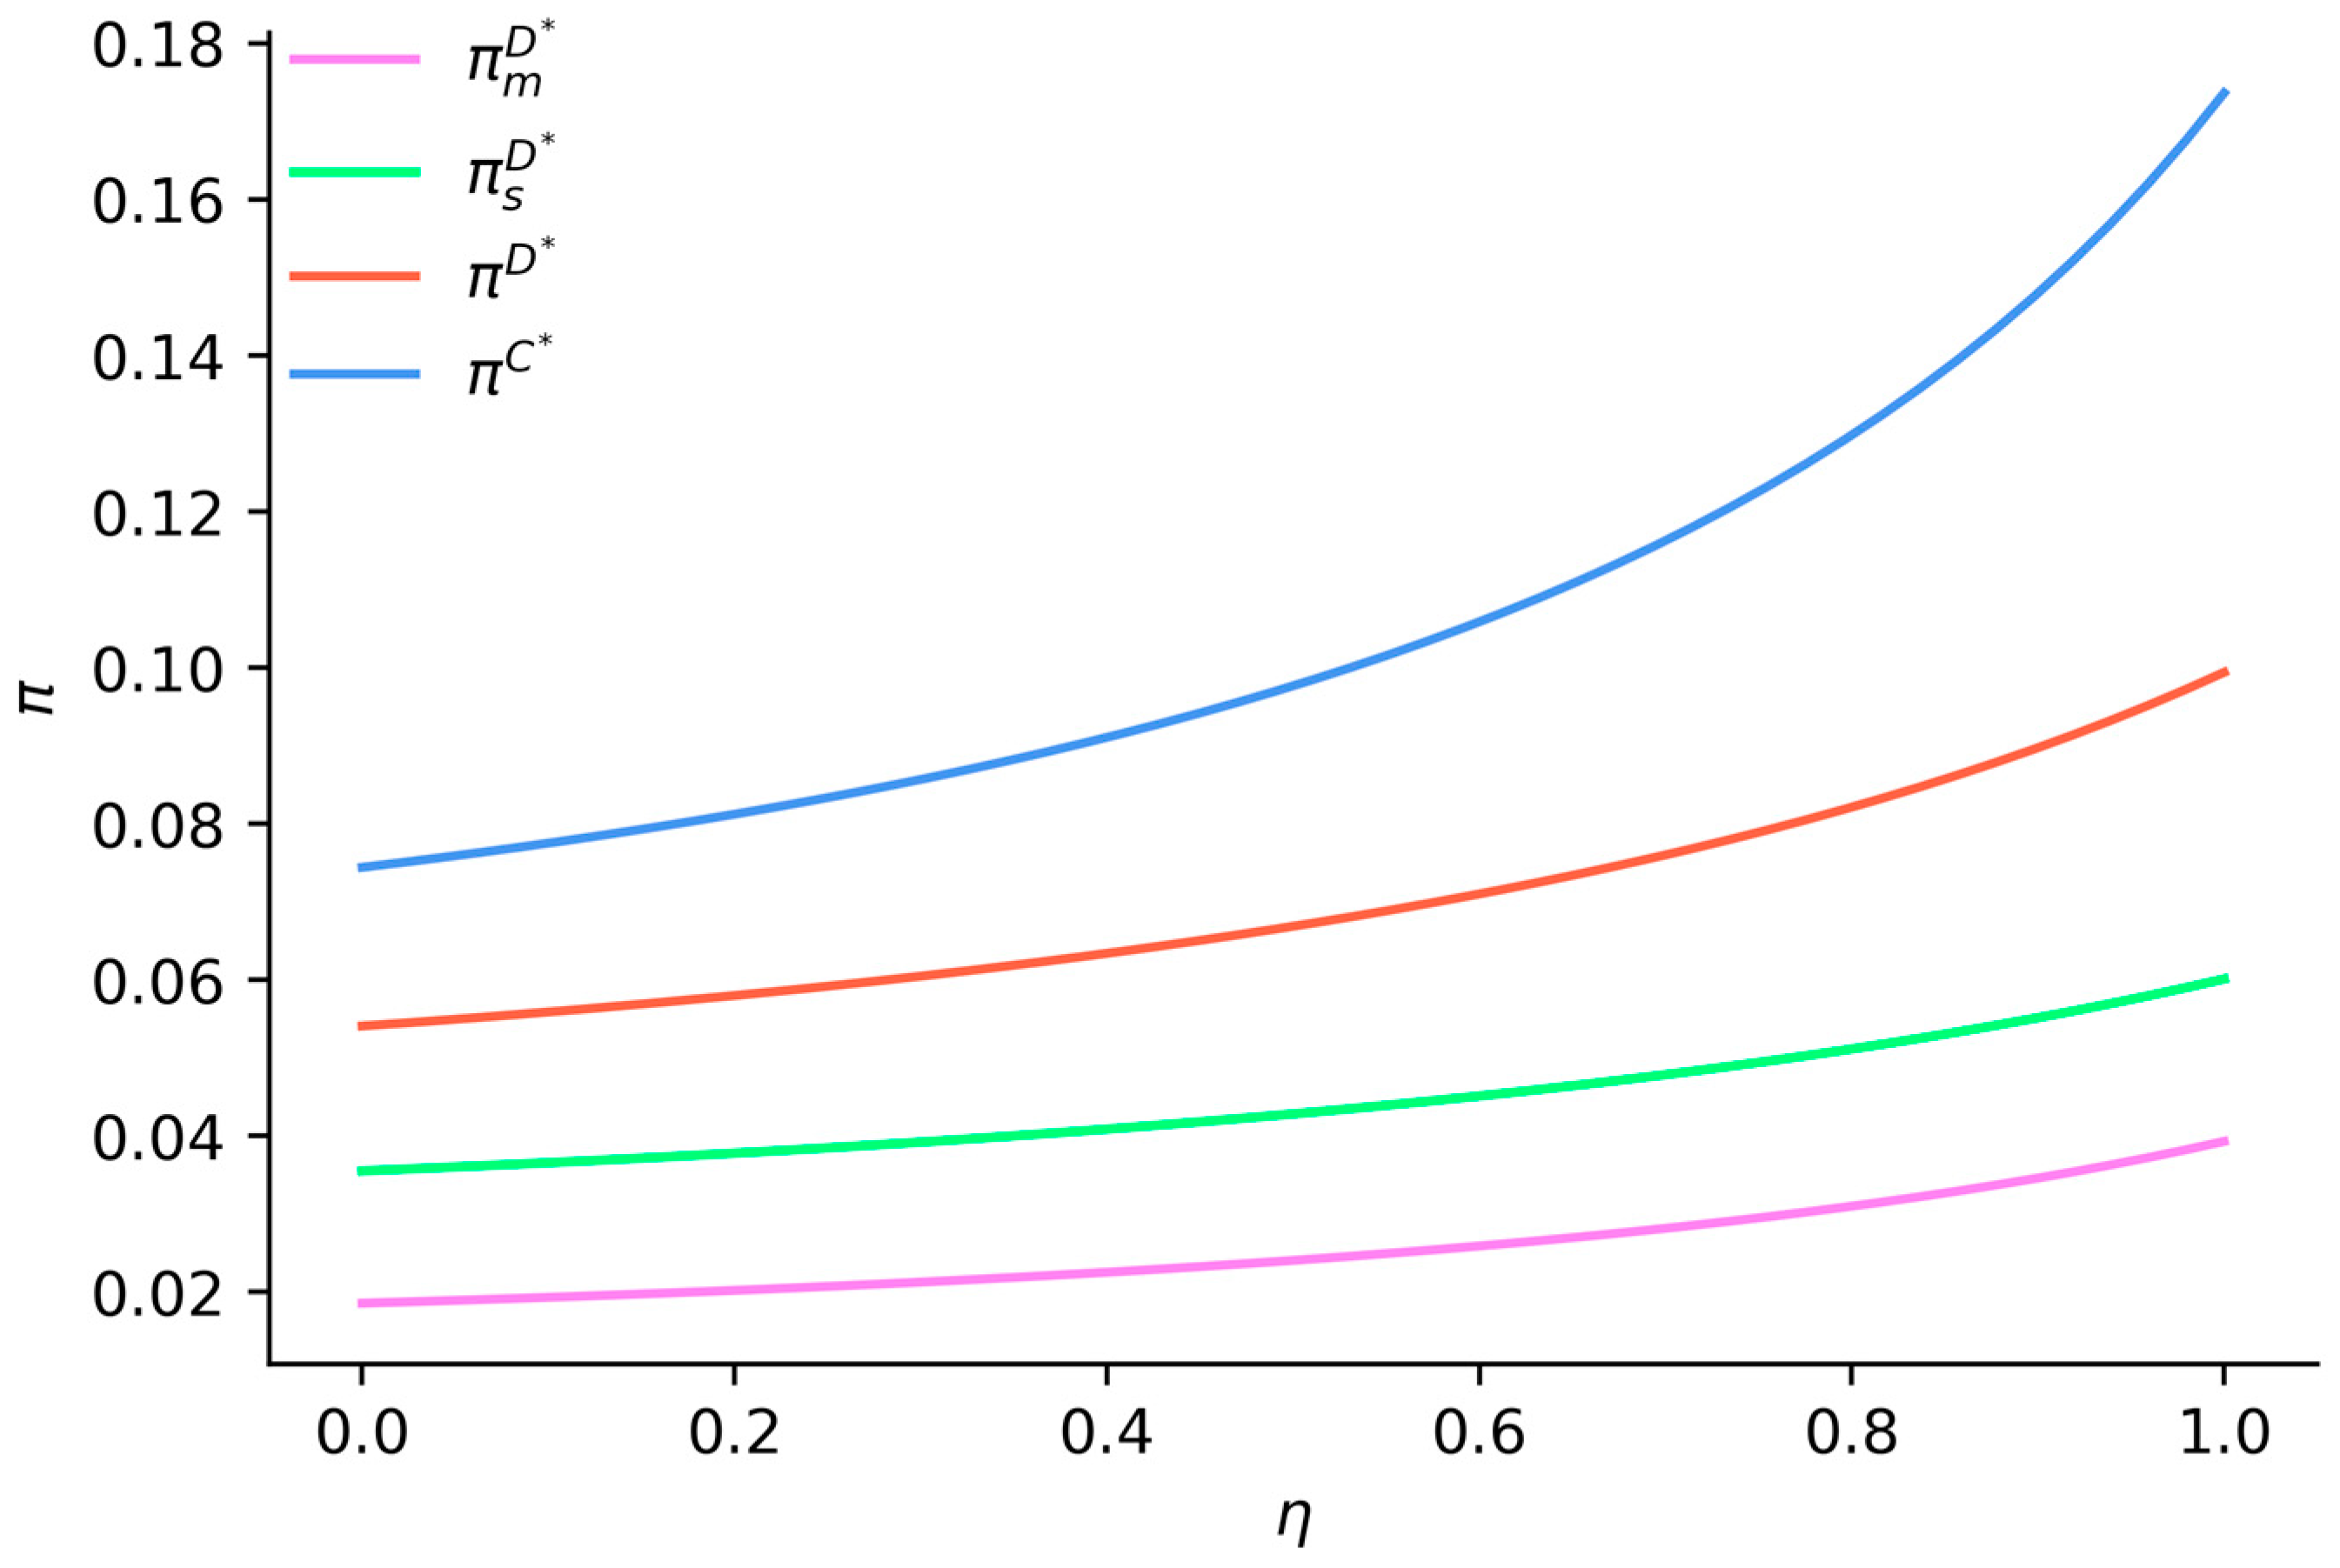
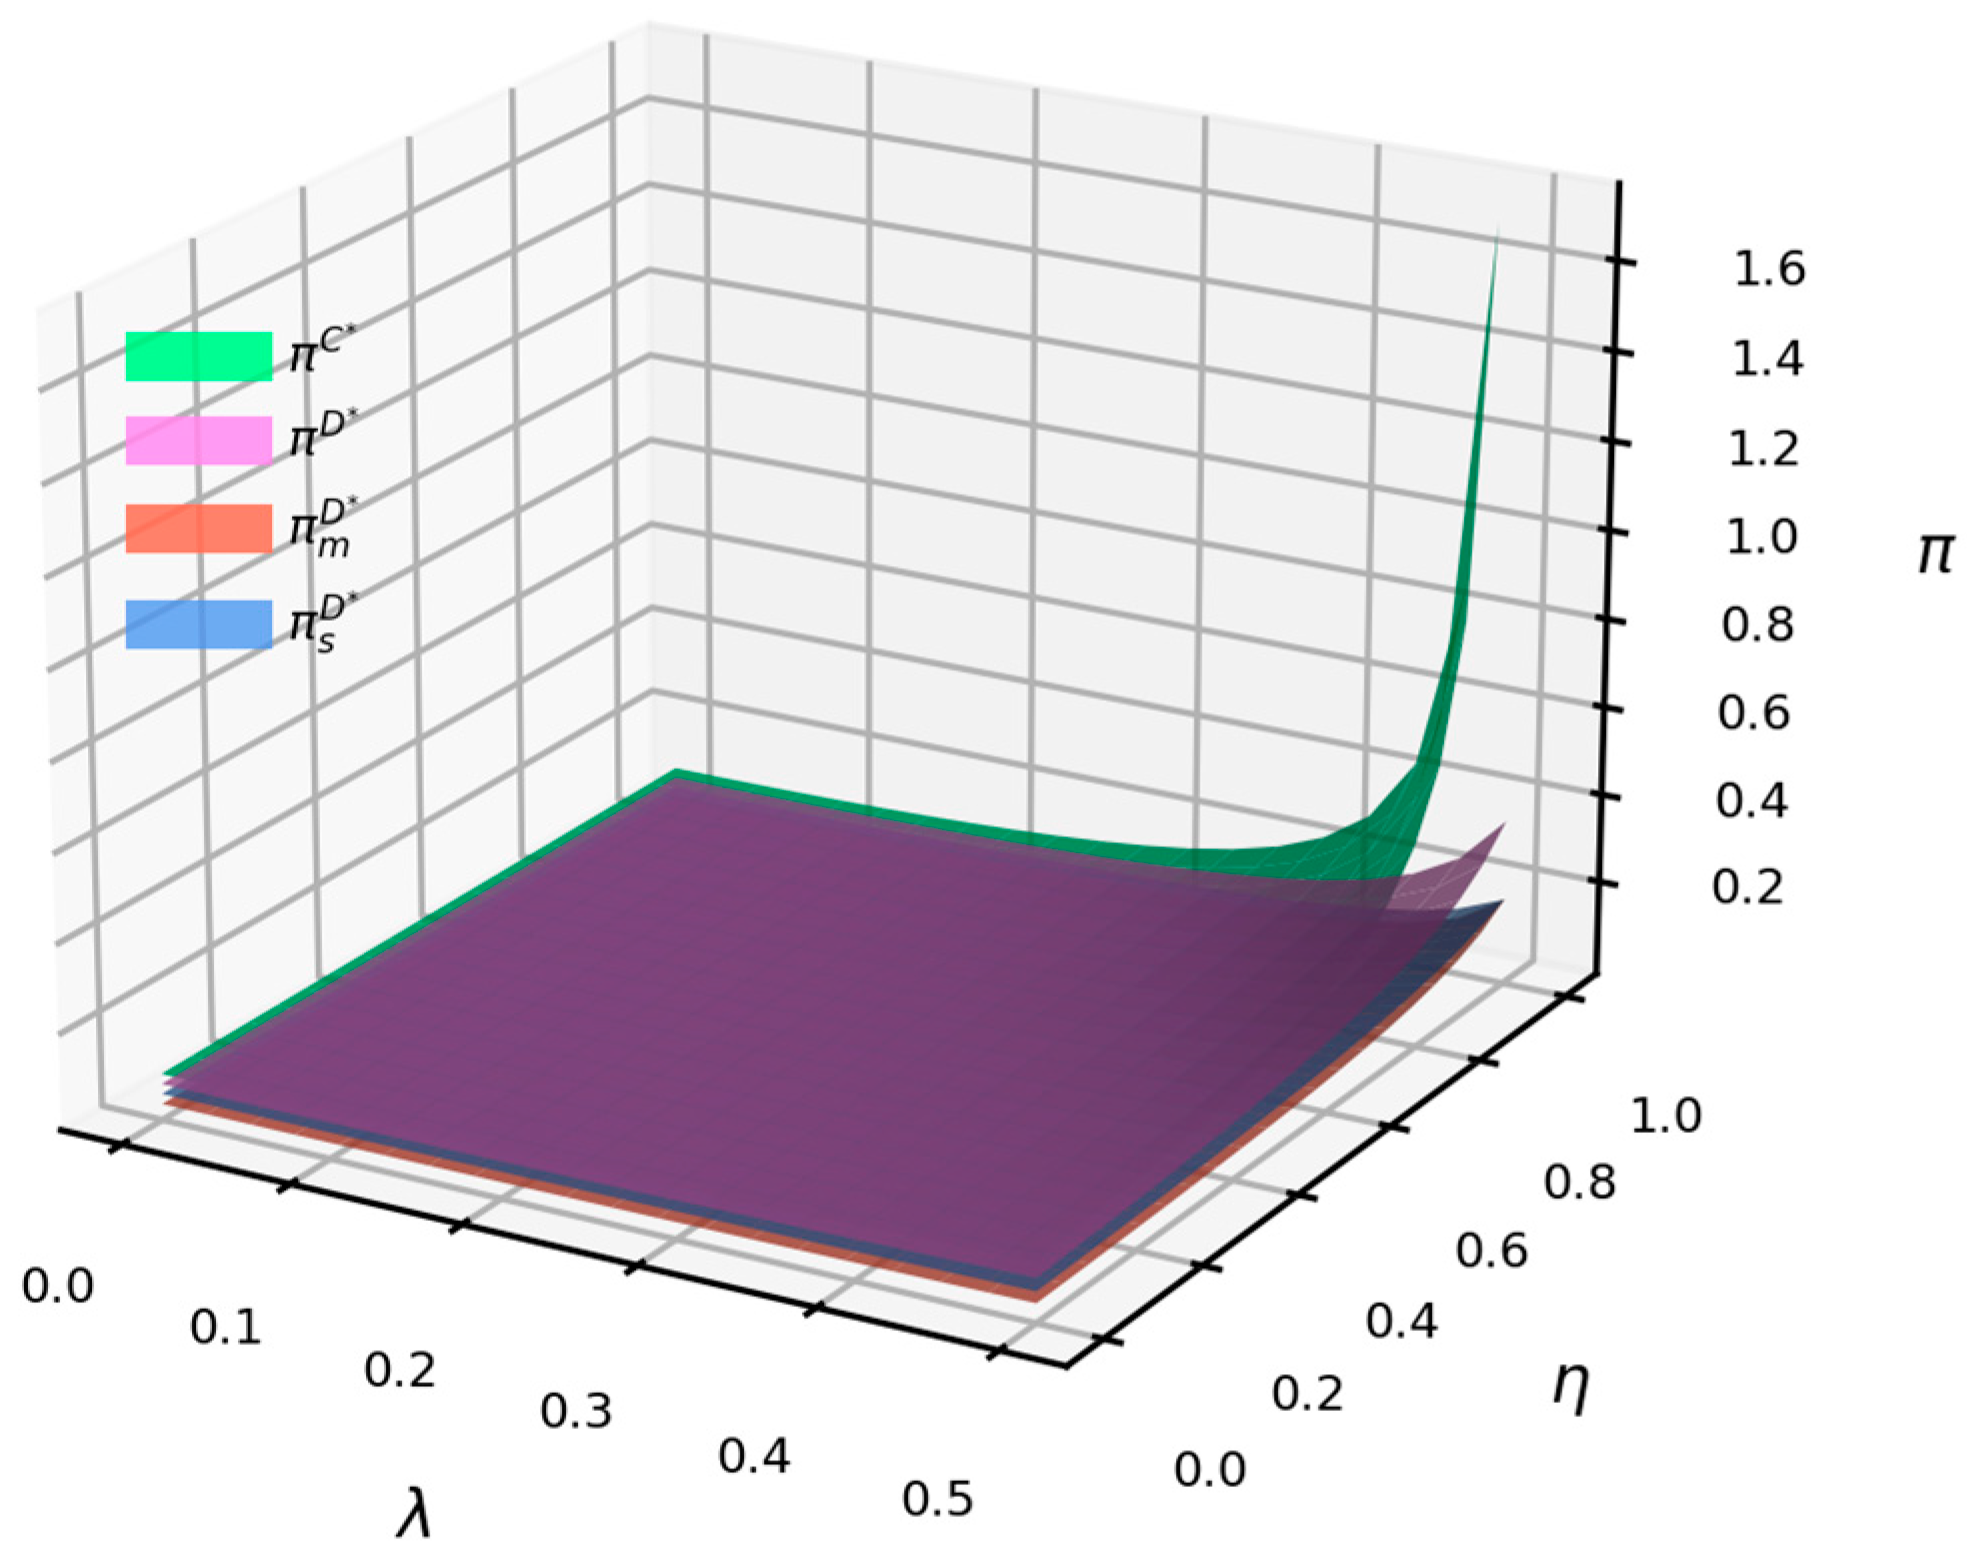
Figure 3 indicates that when
, the profits of suppliers, manufacturers, and the supply chain, as well as the supply chain profit under centralized decision-making, all increase with a higher vertical spillover rate. Due to the first-mover advantage in decision-making, the supplier’s profit under decentralized decision-making is higher than that of the manufacturer, and this disparity grows with an increasing vertical spillover rate. The supply chain profit under centralized decision-making exceeds that under decentralized decision-making, and this advantage can be further enhanced by increasing the exchange and sharing of emission reduction R&D technologies.
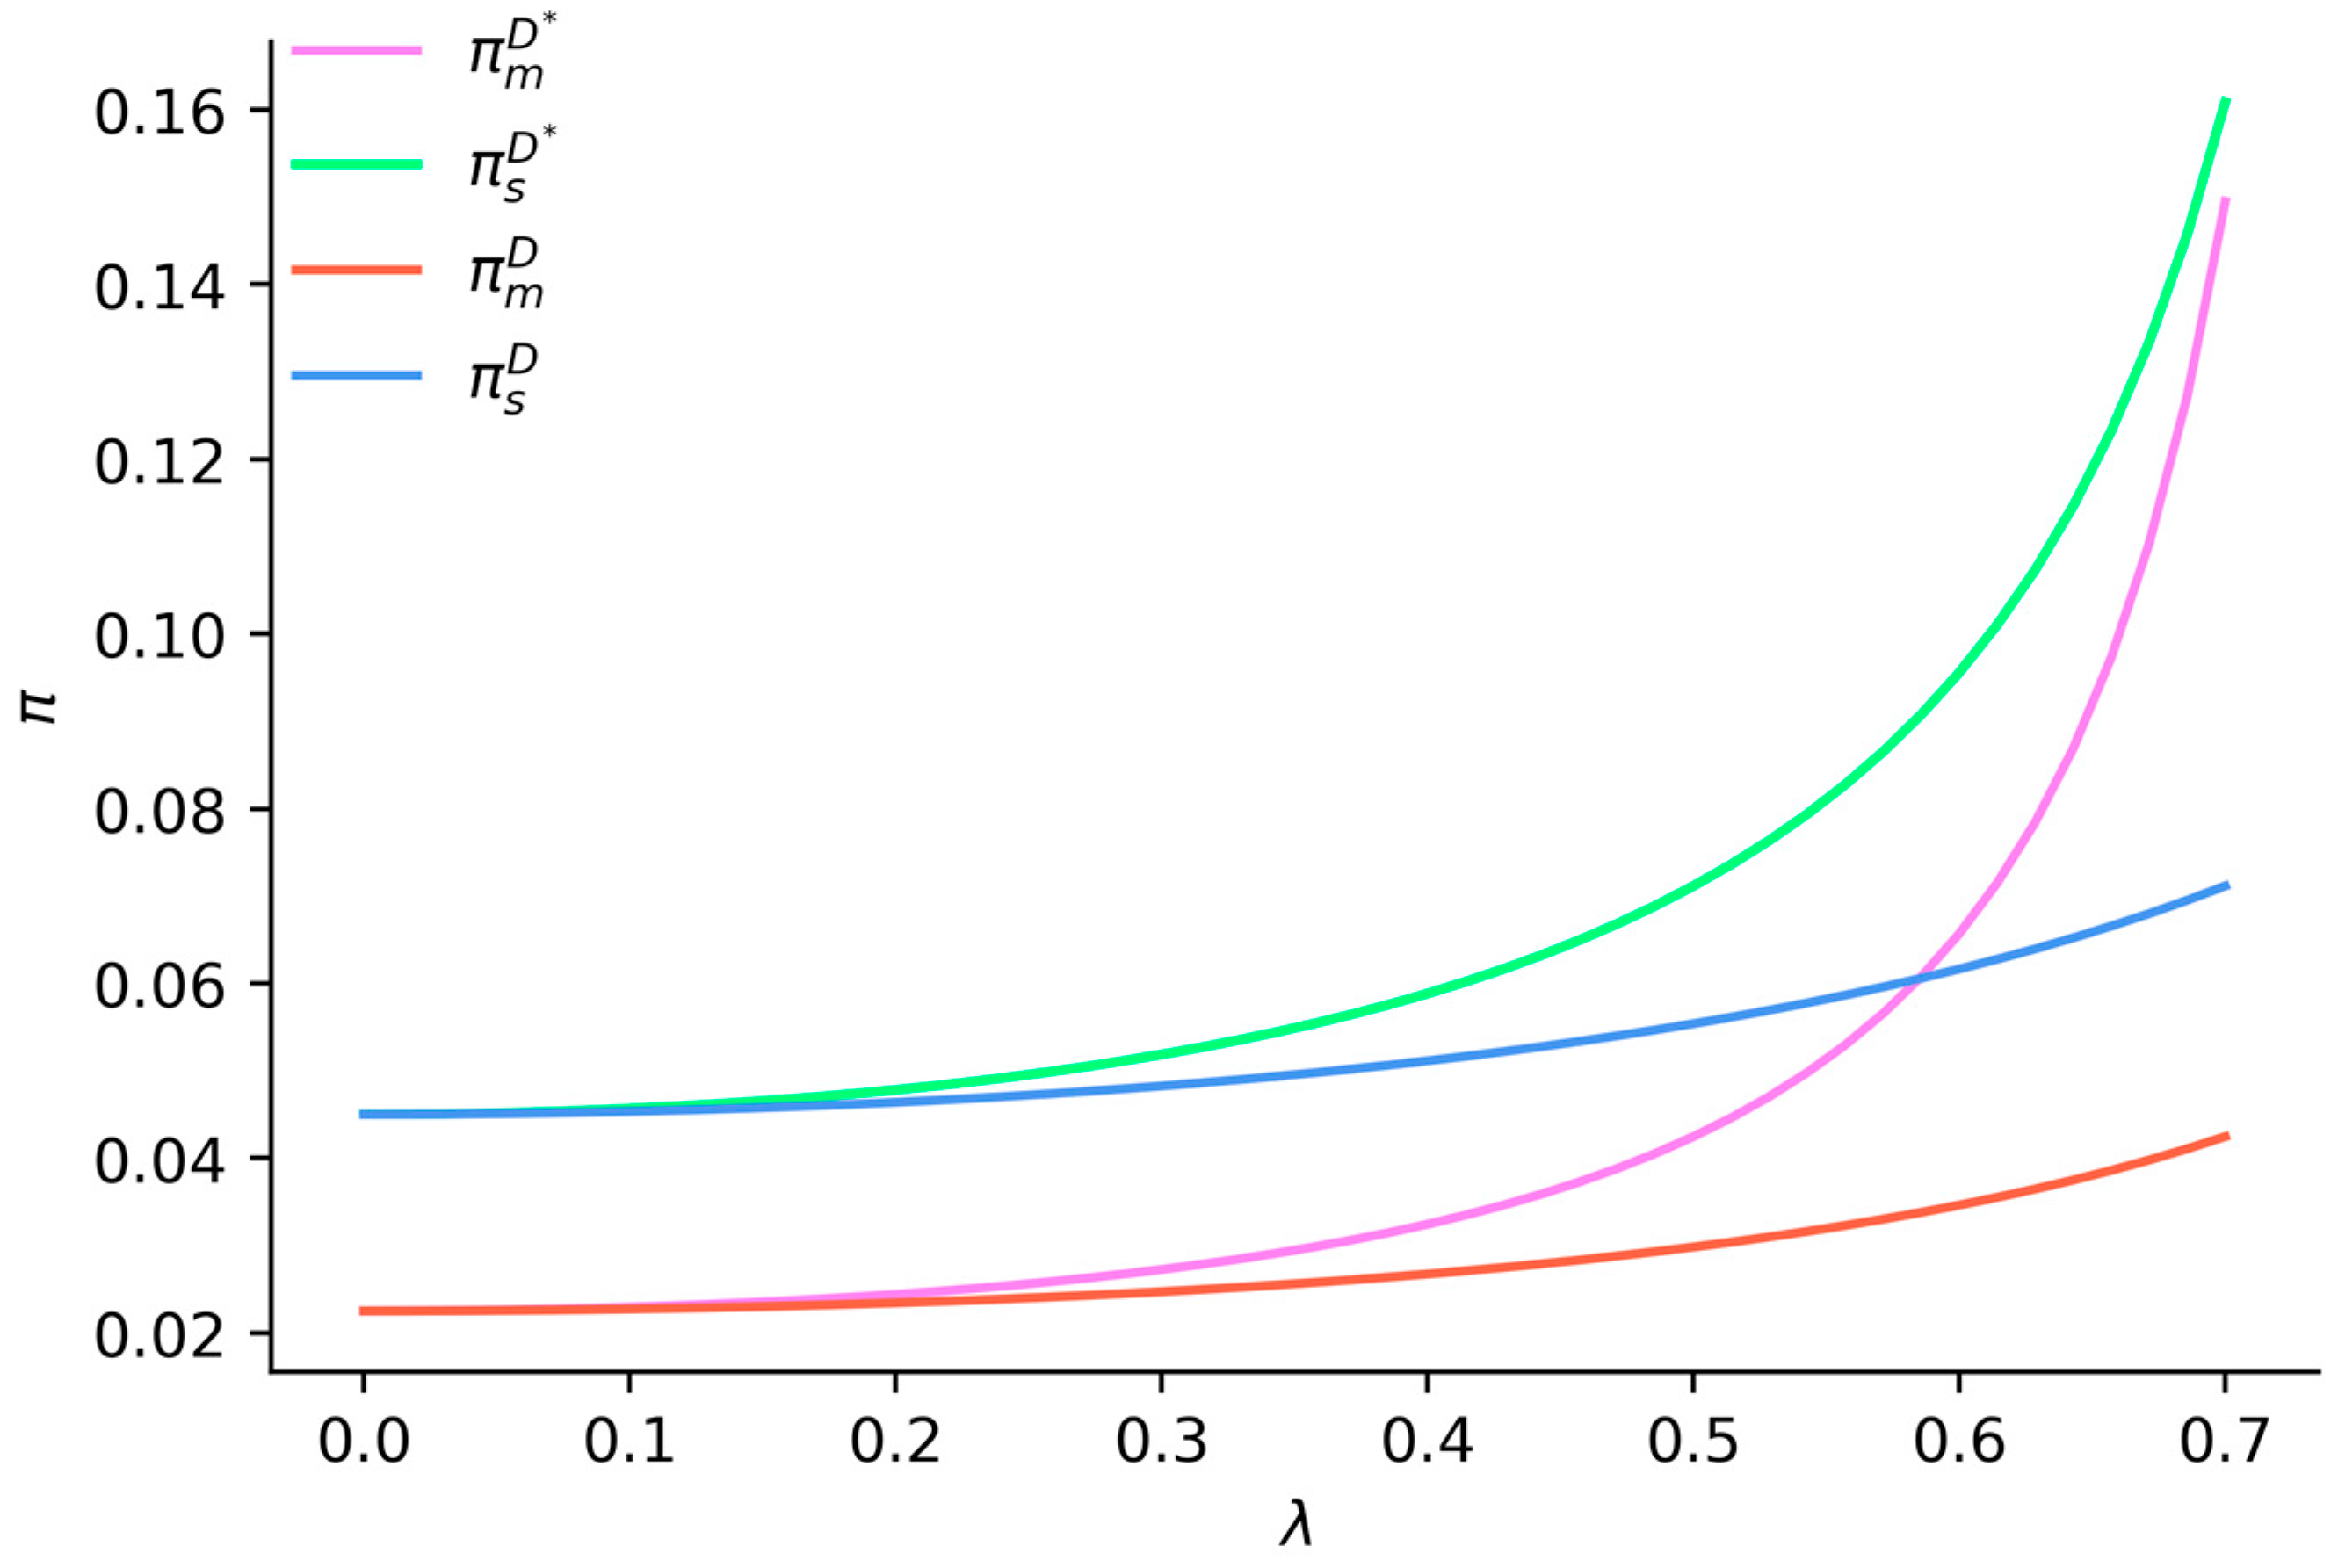
Figure 4 indicates that when
, the profits of both suppliers and manufacturers increase with the rise in the consumer low-carbon preference coefficient. Under emission reduction vertical spillovers, the profits of suppliers and manufacturers are higher compared to scenarios without such spillovers, and the disparity between them widens as the low-carbon preference coefficient increases. Specifically, under emission reduction vertical spillovers, supplier profits exceed manufacturer profits, and this gap narrows as the low-carbon preference coefficient increases. In contrast, without emission reduction vertical spillovers, supplier profits are higher than manufacturer profits, and this profit gap widens with an increase in the low-carbon preference coefficient. This suggests that emission reduction vertical spillovers can enhance the profits of both suppliers and manufacturers, and the potential for profit improvement increases as consumer low-carbon preferences rise.
Figure 5 illustrates that when
, the supply chain profit under both centralized and decentralized decision-making increases with the growth of the consumer low-carbon preference coefficient. Regardless of the presence of emission reduction vertical spillovers, the supply chain profit under centralized decision-making exceeds that under decentralized decision-making, with the profit gap widening as the consumer low-carbon preference coefficient increases. Under emission reduction vertical spillovers, the overall supply chain profit for both centralized and decentralized decision-making is higher compared to the corresponding profits in scenarios without such spillovers, and this disparity enlarges with an increase in the consumer low-carbon preference coefficient. This suggests that the synergistic effect of emission reduction vertical spillovers and increasing consumer low-carbon preferences can enhance supply chain profits more effectively than the effect of low-carbon preferences alone.
Figure 6 shows that when
and
, the emission reduction levels of suppliers and manufacturers under centralized decision-making are consistently higher than those under decentralized decision-making. Moreover, as consumer low-carbon preferences and vertical spillover rates increase, the disparity in emission reduction levels between centralized and decentralized decision-making widens. Both an increase in vertical spillover rates and higher consumer low-carbon preferences positively impact the emission reduction levels of suppliers and manufacturers, with more pronounced effects observed under high levels of low-carbon preferences and vertical spillovers.
Figure 7 indicates that when
and
, the emission reduction levels of suppliers and manufacturers under centralized decision-making are higher compared to those under decentralized decision-making. Regardless of the level of the emission reduction cost coefficient, both centralized and decentralized decision-making lead to increased emission reduction levels with higher vertical spillover rates. The negative impact of the emission reduction cost coefficient on the emission reduction levels of suppliers and manufacturers is outweighed by the positive effect of a higher vertical spillover rate compared to a lower one.
Figure 8 illustrates that when
and
, both supplier, manufacturer, and supply chain profits exhibit an upward trend with increases in consumer low-carbon preference or vertical spillover. Among these, manufacturer profits are lower than supplier profits, and the profit gap narrows with an increase in the vertical spillover rate. Under centralized decision-making, the supply chain profit consistently exceeds that of decentralized decision-making, with the profit differential increasing as consumer preference or vertical spillover rate rises. The growth in supplier, manufacturer, and supply chain profits accelerates with higher vertical spillover rates and greater low-carbon preference coefficients. This indicates a synergistic effect between vertical spillover rate and low-carbon preference coefficient: enhancing consumer low-carbon preference while promoting vertical spillover significantly boosts supply chain profits.
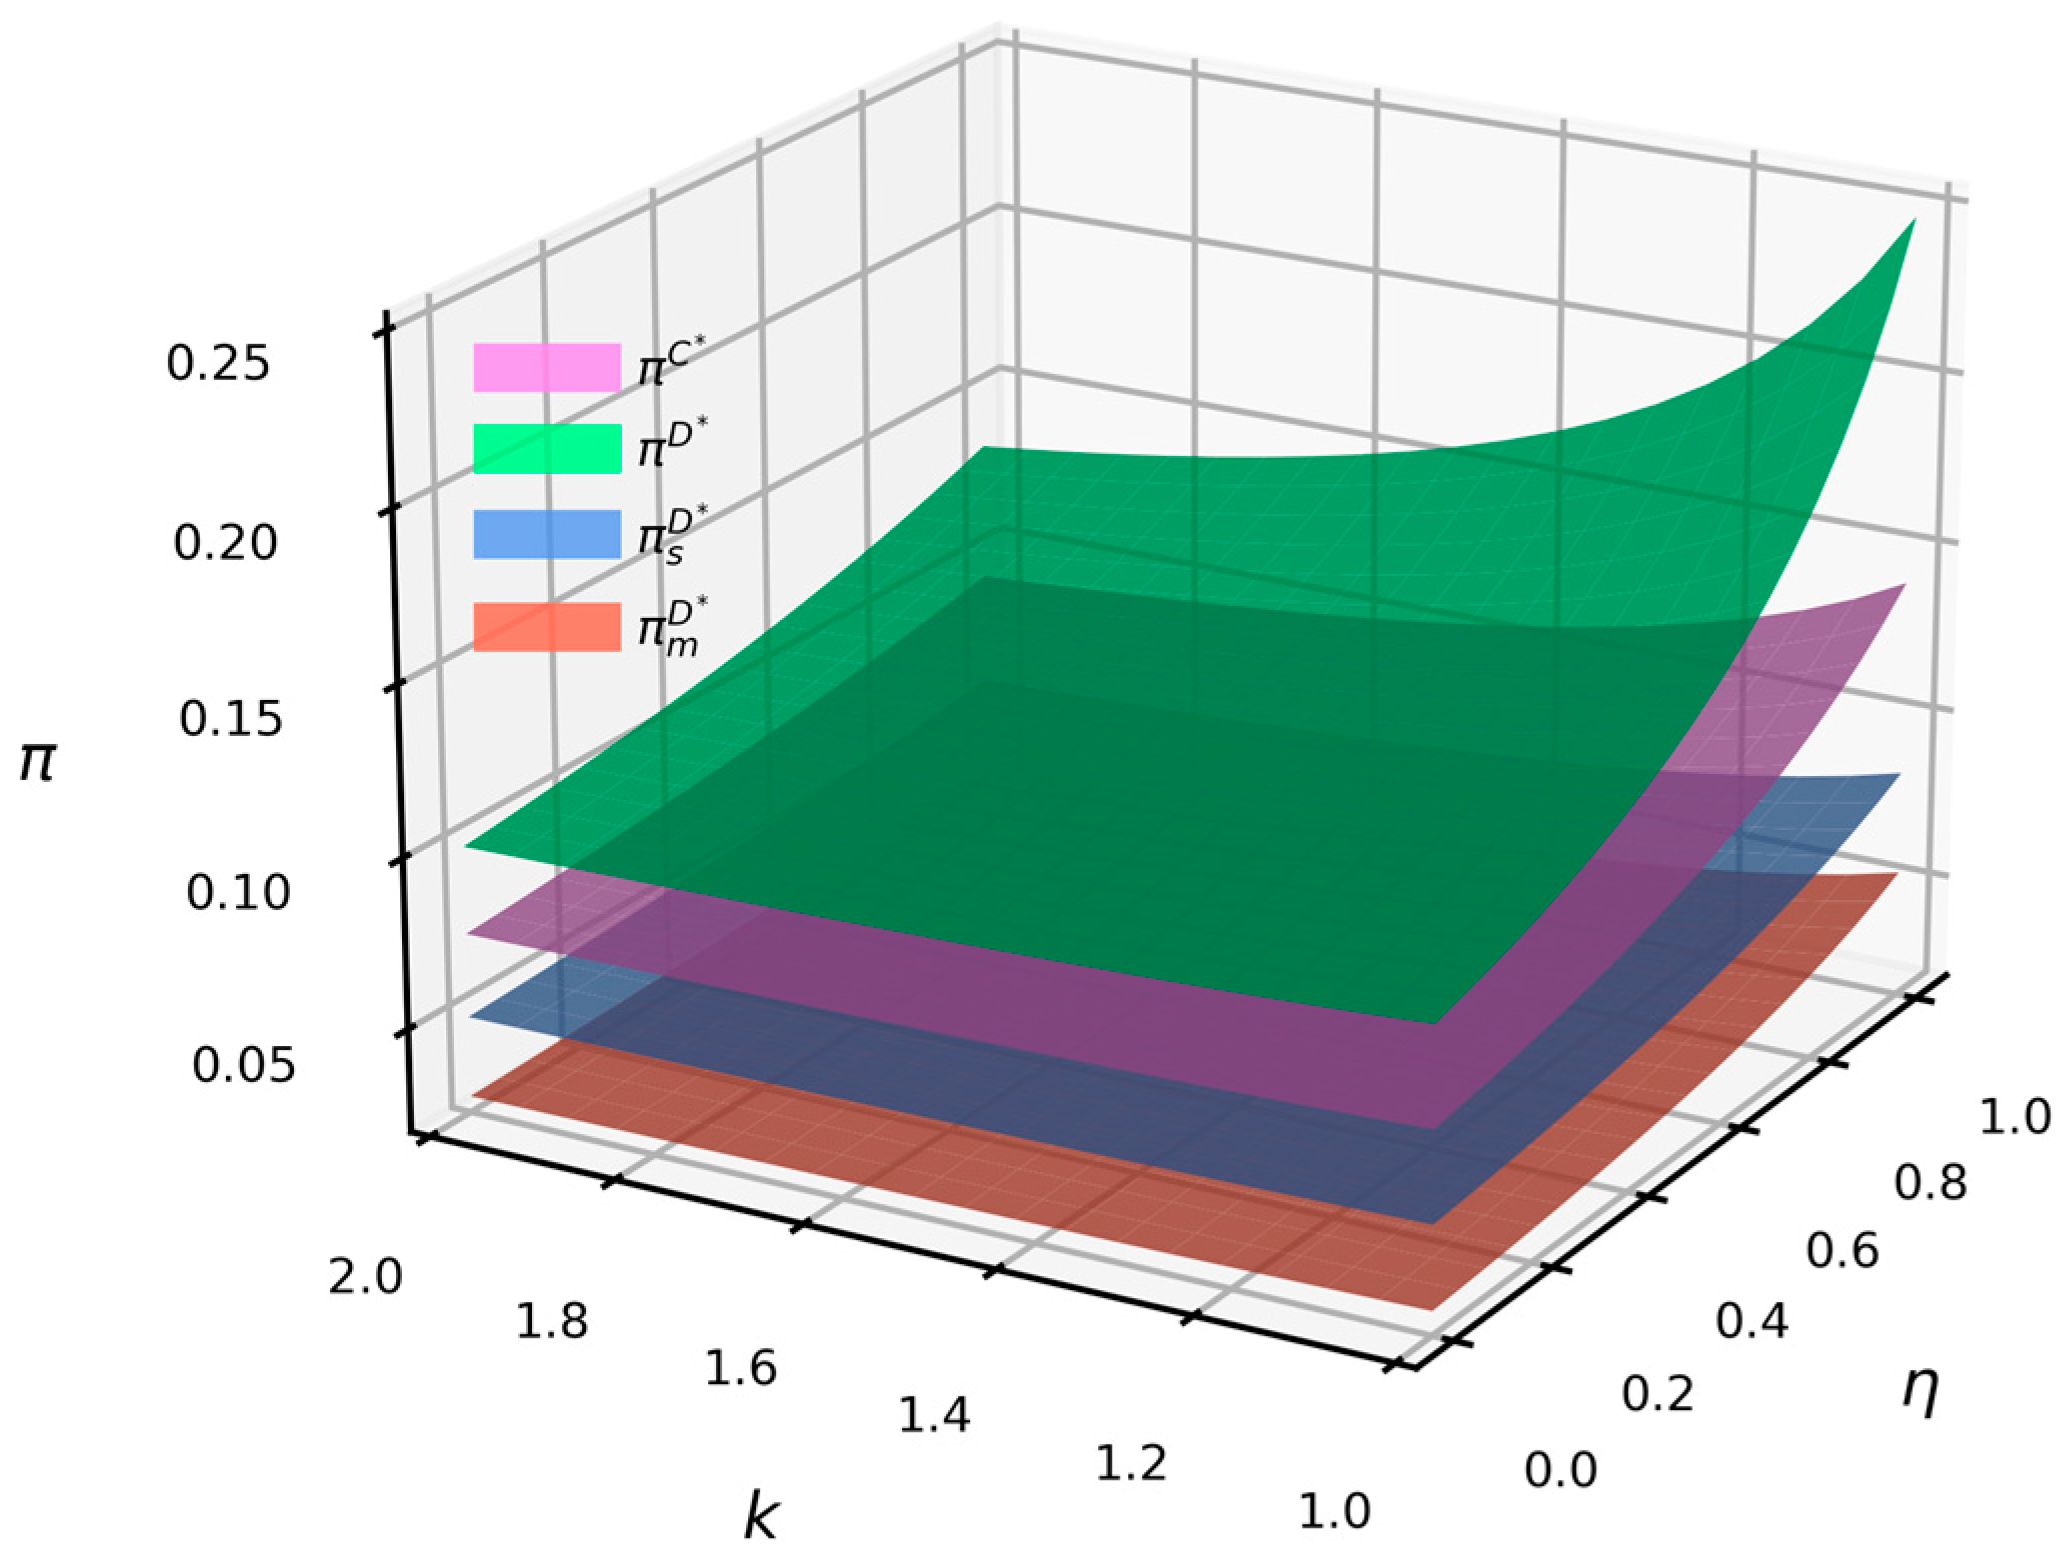
Figure 9 shows that, when
and
, under conditions of emission reduction vertical spillover, the profits of manufacturers, suppliers, and the supply chain all increase as the emission reduction cost coefficient decreases. An increase in the emission reduction vertical spillover rate enhances the profits of manufacturers, suppliers, and the supply chain, though the rate of increase diminishes with a rising emission reduction cost coefficient. Under vertical spillover conditions, the profits from centralized decision-making are consistently higher than those from decentralized decision-making. However, these profits decrease more rapidly in response to reductions in the vertical spillover rate and increases in the emission reduction cost coefficient compared to decentralized decision-making. This indicates that in industries where emission reduction technology is challenging, the benefits of increasing vertical spillover rates are relatively smaller.
7. Conclusions
This paper investigates the impact of vertical spillovers in emission reductions and consumer low-carbon preferences on decision-making within centralized and decentralized supply chains. This study highlights the positive vertical spillover effects of emission reduction technology development between suppliers and manufacturers in the supply chain, and how consumer low-carbon preferences affect market demand. The analysis compares the effects of vertical spillover rates, low-carbon consumer preferences, and emission reduction cost coefficients on supply chain emission reduction levels and profits. The findings are as follows:
First, an increase in consumer low-carbon preferences enhances the emission reduction levels, profits, wholesale prices, and retail prices for suppliers and manufacturers. This indicates that heightened consumer awareness of low-carbon products encourages consumers to pay higher prices, thereby stimulating firms’ enthusiasm for emission reductions.
Secondly, centralized decision-making consistently yields higher profits than decentralized decision-making, with the profit differential decreasing as consumer low-carbon preferences rise.
On one hand, an increase in vertical spillover rates improves emission reduction levels and profits for both centralized and decentralized decision-making, with a greater increase observed under centralized decision-making. As vertical spillover rates rise, retail prices decrease under centralized decision-making, whereas they increase under decentralized decision-making, and wholesale prices decline.
On the other hand, when vertical spillovers in emission reductions are present, increases in consumer low-carbon preferences have a more significant effect on enhancing emission reduction levels and profits for suppliers and manufacturers. The profit gap between suppliers and manufacturers narrows with increasing consumer low-carbon preferences. In the absence of vertical spillovers, the profit gap remains relatively stable.
Furthermore, an increase in the emission reduction cost coefficient decreases emission reduction levels and profits for suppliers and manufacturers. Under centralized decision-making, the decline in supply chain profit is more pronounced compared to decentralized decision-making.
Finally, in centralized decision-making, increases in vertical spillover rates, consumer low-carbon preferences, and reductions in emission reduction cost coefficients create synergistic effects, leading to larger increases in emission reduction levels and profits than the sum of individual effects. This synergy is particularly significant when consumer low-carbon preferences are high, or the emission reduction cost coefficient is low.
8. Managerial Implications
Impact of Consumer Low-Carbon Preferences and Vertical Spillover Effects: Both consumer low-carbon preferences and vertical spillover effects positively influence supply chain development. Governments and enterprises should collaborate extensively on low-carbon promotion and education to enhance low-carbon awareness and consumer consciousness. Supply chain participants should not only focus on innovating their own emissions reduction technologies but also strengthen the exchange and sharing of emissions reduction research and outcomes. This approach maximizes the benefits of vertical spillovers and complements consumer low-carbon preferences.
Government Policy Recommendations: Governments should implement differentiated vertical industrial policies to address supply chains under different models and improve emissions reduction levels. In cases where emissions reduction is more challenging, centralized decision-making is more effective. The government should establish minimum emissions reduction levels to guide supply chain participants in collaborative efforts, thereby improving profits in centralized supply chains and encouraging a shift towards centralized decision-making models. Conversely, for supply chains where emission reduction is less difficult, the government should promote technology exchange and outcome sharing among upstream and downstream firms to enhance emission reduction levels and decision-making efficiency.
The paper focuses on emission reduction decisions within supply chains under vertical spillovers and consumer low-carbon preferences. Future research could explore additional dimensions such as mixed spillovers, competitive supply chains, closed-loop supply chains, government subsidies for emissions reduction, and the lag effect of emissions reduction technology spillovers. Secondly, it is essential to consider parameter differentiation under varying environments, such as the cost coefficients for emission reduction that differ among enterprises with distinct profit levels, and the varying spillover rates in different contexts. Moreover, addressing how to coordinate the profit distribution within the supply chain under vertical spillover conditions presents diverse avenues for further research.


