Article

Determinants of Microfinance Demand (Evidence from Chiredzi Smallholder Resettled Sugarcane Farmers in Zimbabwe)

Small-Scale Agribusiness and Rural Non-Farm Enterprise Research Niche, Department Business Management and Economics, Faculty of Economic and Financial Sciences, Walter Sisulu University, Private Bag X1, Mthatha 5117, South Africa
Sustainability 2024, 16(22), 9752; https://doi.org/10.3390/su16229752
Submission received: 24 August 2024 / Revised: 28 October 2024 / Accepted: 29 October 2024 / Published: 8 November 2024

Abstract

:
Despite the MFI insurgency, agricultural financing remains critically low, even though microcredit is widely accepted as both a substitute and compliment to formal credit. Zimbabwe is an agro-based economy and very little is known about the determinants of microcredit demand and microcredit size in smallholder resettled sugarcane farmers. Research is concentrated in short-term agriculture activities. Thus, this study aims to fill the unattended gap in lagged returns agriculture activities such as sugarcane production which takes at least a year to mature, hence, the greater need for agriculture financing alternatives such as microfinance. The study examined the determinants of both microcredit demand and loan size (magnitude of microcredit participation) by smallholder resettled A2 sugarcane farmers in Chiredzi. Primary data from 370 smallholder resettled sugarcane farmers (214 borrower participants and 156 non-borrower participants) were used. Probit and Tobit regression models were used for data analysis in STATA. Operational costs, interest rate, grace period, and land size significantly affect both the demand for microcredit and microcredit size, while education, household farming assets, extension services, and payback period significantly affect microfinance demand, and risk attitude/perception additionally determine microcredit size. Special microfinance schemes best suitable for the agriculture sector and crop/plant-specific agriculture financing schemes, currency, and macroeconomic stability are the major policy recommendations.

1. Introduction and Background

Credit is the capacity to obtain a loan in exchange for a commitment to pay back at a future agreed date and under agreed terms [1]. In addition, [2] defined credit accessibility as the level of complexity involved when obtaining credit for augmenting business efficacy. Critically analyzing the rationale between credit and credit accessibility [1,3], whether formal or informal credit (from mainstream, microfinance institutions, or any informal credit arrangements), can only be judiciously and sustainably performed for production smoothening rather than consumption smoothening purposes. Borrowing for consumption smoothening is what generally results in non-performing loans resulting in default and debt crises with respect to the borrowers, and bankruptcy and unsustainable losses on the part of lenders. Microfinance amongst other sustainable development financing mechanisms has gained considerable attention in the sustainable development discourse around global and inclusive growth and development [4]. Microfinance provides hope to rural, marginalized, and smallholder farming households [5]. It also spurs inclusive economic growth despite enduring poverty and restricted access to traditional financial services. Microfinance has garnered significant attention in the attainment of sustainable development goals (SDGs).
Microfinance is a form of financial inclusion that provides access to credit and other financial services to low-income individuals and groups excluded from the formal banking sector [6]. The main features that distinguish microfinance from other formal financial products are the smallness of loans advanced and the traditional absence of collateral, together with the simplicity of operations. The market structure under which microfinance institutions (MFIs) operate is also more competitive than the formal banking market structure. Therefore, this is among the reasons that triggered the researcher to look at the determinants of microfinance (microcredit) participation in smallholder resettled sugarcane farmers in Zimbabwe (Chiredzi).
The microfinance sector is fast becoming an integral part of both the global and the national macroeconomic landscape [7]. Through the provision of access to finance (microloans, savings accounts, insurance, and payment systems) to marginalized individuals and small businesses traditionally with no to restricted access to formal banking services, microfinance can therefore significantly contribute to inclusive economic growth on both the national and global scales. However, despite the significant increase in MFIs in Zimbabwe, the global economy experienced a deceleration in 2022 due to the COVID-19 pandemic [8]. Zimbabwe, like many other developing countries, was affected, and the COVID-19 period worsened cases of non-performing loans due to lockdowns which resulted in many MFIs failing to recover, with some becoming bankrupt, while others are yet to reach their pre-COVID-19 levels. The recovery trajectory was halted due to the implementation of tight monetary policies by the Reserve Bank of Zimbabwe like many other central banks around the world in trying to curb inflation [7], caused by the lack of production during the COVID-19 lockdowns that significantly disrupted both the national and global supply chains. Agriculture sectors of developing economies are anchored and mainly developed through borrowing, and it increases a farmer’s purchasing power, thereby enhancing better and higher-yielding varieties and inputs through technological advancements [9]. Microfinance is a well-developed sector that provides various financial products and services to marginalized smallholder farmers [10,11,12]. The Zimbabwean microfinance sector is dominated by MFIs, NGOs, credit unions, and the formal financial institutions sector (FIRST Bank Corporation, Commercial Bank of Zimbabwe, Zimbabwe Bank (ZB), Agribank, and CABS).
In the Zimbabwean context, microfinance can be viewed as a critical approach towards poverty reduction, domestic productivity growth, and promotion of inclusive growth as envisaged in the National Development Strategies 1 and 2, and the long-term plan of Vision 2030 for the government. Given this context, there have been significant strides towards the attainment of the SDGs. Microfinance has also gained significance in the economy due to the dominance of the informal sector of Zimbabwe which does not have access to mainstream financial system poverty and promoting economic growth in Zimbabwe.
The agriculture finance gap in Zimbabwe is highlighted in the Zimbabwe Economic Policy Analysis and Research Unit, ref. [13], and is still in existence and worsened by the uncertain macroeconomic environment, the introduction of bond notes as a currency, and the exchange rate misalignment between the bond notes (local currency) and the United States dollar, and is further widened by the recent introduction of the Zimbabwe Gold-backed currency code named ZiG currency. The exchange rate between the local currency and the United States dollar makes it difficult for financial institutions to lend in local currency due to exchange rate misalignment (overvalued local currency from the bond notes to the ZiG). After the Fast Track Land Reform Programme, the agriculture financing gap was widened due to the land allocation to less capitalized households that required significant amounts of finance for them to be fully equipped and empowered to be productive. Access to finance by the smallholder resettled farmers was, however, made complex after the Fast Track Land Reform Programme (FTLRP), due to the lack of property rights complicating the much-needed collateral security by the mainstream financial institutions. Hence, the promotion of microfinance institutions was necessary even though they needed collateral security but could use various forms of assets as it. Efforts by the Zimbabwe government have been more biased towards the commercial farmers with the formal Agribank, which was mainly tailored to fill the agriculture finance gap because it is out of reach for the smallholder farmers, and worse still for the smallholder farmers resettled with no property rights over the allocated land. In addition to the bias towards the large-scale commercial farmers, the government through the Reserve Bank of Zimbabwe introduced productivity facility loans which were only accessible to large-scale commercial farmers leaving the needy smallholder resettled farmers out. Therefore, in line with this study, since Zimbabwe’s FTLRP, the agriculture sector financing gap continued to widen despite the general increase in financial institutions (both mainstream and microfinance institutions).
The majority of rural smallholder resettled farmers in Zimbabwe have low income and savings capacities, thereby complicating their ability to adopt modern technologies. Microfinance and credit in general can be viewed as an enzyme for the adoption of productivity-enhancement strategies such as modern farm technologies and high-yielding varieties (HYV), that is, digitization and mechanization, together with value addition [14,15]. The need to increase productivity triggers the need to participate in microfinance; hence, the demand for microfinance can be viewed as derived demand. Smallholder farming in many developing countries faces a plethora of challenges emanating from the shortage of reproducible capital, low level of capital input, and inadequate supply of other agricultural inputs. This then renders microfinance to be one of the most fundamental ingredients of sustainable agricultural production. Enhanced accessibility to microfinance from both formal and informal institutions can help overcome agricultural stagnation and improve rural farmers’ productivity in many developing and agro-based economies [16,17].
However, the promotion of microfinance has been challenged due to resulting in negative implications on the side of the borrowers who, instead of being uplifted, often result in being worse off. Some microcredit tends to be diverted into other unproductive uses [18], and some is unproductively utilized in the purchase of consumer goods [19]. On the other side, in microfinance, due to the institutionalist motive, the repayment schedule is usually tight to the extent that it ends up impoverishing the poor through having to find means to meet the tight repayment schedules that result in debt burdening the micro-borrowers [20]. This often results in micro-borrowers being trapped in debts that further cripple productive utilization of microcredit and this often contributes significantly to the rising cases of non-performing loans. Stringent repayment schedules result in micro-borrowers being entangled in debt recycling (borrowing to repay other debts). This, instead of pulling/pushing the poor and marginalized out of poverty, often results in making the borrowers worse off [20]. Microfinance may result in positive outcomes at the household level, but the macro returns are negative [14]. According to [21,22], microfinance does not really translate into agriculture productivity growth and concluded that microloans are not suitable for agriculture investments since the repayment of the loan starts as soon as the loans are disbursed.
These farmers lack the financial wherewithal to graduate their agricultural practices from subsistence to commercial, with the aim of increasing household incomes [23]. The only source of finance they can have unrestricted access to is microfinance if they are to digitalize, mechanize, and graduate from subsistence to medium–large-scale commercial farmers. Credit sources have increased [9], even in Zimbabwe (both institutional and non-institutional credit), but one of the research problems is that the productivity and growth of small-scale farmers from subsistence to commercial farming units is yet to be realized [24]. Despite the potential of credit to transform smallholder farmers [17], farmers have restricted access to formal financial institutions due to bureaucracy and complex application procedures and administration [3], such processing charges and short payback periods sometimes characterized by no grace periods, which makes it very difficult for households in smallholder farming to access loans, for both general access and the magnitude of access (ability to get the full amounts applied for).
Following the financial sector developments in Zimbabwe (growing exchange rate uncertainties and high interest rates), the introduction of the local currency saw a gradual shift from the local currency-denominated loans to the USD-denominated loans and ultimately resulted in the Reserve Bank of Zimbabwe authorizing MFIs to offer foreign currency denominated loans [7]. Despite the authorization of USD-denominated loans, the exchange rate remained under pressure as the local currency continuously depreciated [7] and this worsened exchange rate uncertainty, which complicated the operations of MFIs in Zimbabwe. However, in the face of all the challenges (rapid depreciation of the local currency, price instability, geopolitical events, and sluggish economic growth), the Zimbabwe Association of Microfinance Institutions (ZAMFI) [24] revealed that the overall performance of the microfinance sector exhibited a resilient and financially sustainable sector in the face of various economic headwinds.
In Zimbabwe, sugarcane production is among the agribusiness sub-sectors that require additional financing mainly due to the sector being both labor- and capital-intensive. Given the land resettlement exercises in Zimbabwe since independence (1980), sugarcane farming today is unarguably one of the most attractive and lucrative agribusiness investment options in the agricultural industry in Zimbabwe. This is evidenced by the scramble for land in the Southeast Lowveld part of the country. The sugarcane agricultural sub-sector is intensively resource-driven, hence luring the farmers to demand financial assistance to which microfinance can be the next best alternative, especially for the smallholder farmers who are generally considered unbankable by the mainstream financial sector. Microfinance demand was also augmented by the Fast Track Land Reform exercise which was inconsiderate of the resource endowments of the smallholder resettled farmers. The FTLRP was not completely supported from a factor endowment perspective to its beneficiaries. Given that background, many resettled farmers struggle to self-sustain their sugarcane production smoothening and general operations from season to season, leading some into significant and destabilizing debts. Land redistribution received considerable attention in Zimbabwe, but very little attention was given to complimentary financial and input support, especially to the sugarcane farmers who are considered less bankable in the agriculture sector due to the waiting period associated with plantation agriculture, especially in a country characterized with uncertain exchange rate policies marred by an excessive depreciation local currency in a multicurrency regime. Unlike other crops directly connected to food security, such as maize production, which receives considerable government support such as the presidential input support schemes, smallholder sugarcane production is generally neglected. With reference to the study area on microfinance and sugarcane production, previous studies concentrated on the characterization of the smallholder holder resettled sugarcane farmers and their perceptions towards microfinance [25] and the technical efficiency impact of microfinance on smallholder resettled sugarcane farmers [25]. Hence, no study touched on the determinants of microfinance demand by the smallholder resettled sugarcane farmers. Also given the currency dynamics in Zimbabwe, the study made use of 2023/2024 data rather than the historical 2017/2018 data used in the previous studies. The 2017/2018 monetary data were denominated in the then Zimbabwean dollar currency which was in parity with the United States dollar in 2018, while the 2023/2024 monetary data were denominated in the Real Time Gross Settlement (RTGS) currency which was then proceeded by the Zimbabwe Gold (ZiG)-backed local currency. It becomes therefore imperative to explore the determinants of microfinance demand together with the determinants of the magnitude of participation within the context of smallholder resettled sugarcane farmers. The researcher is motivated by the fact that smallholder resettled sugarcane farmers in Chiredzi, particularly the A2 Fast Track Land Reform Program beneficiaries of Hippo Valley, Mkwasine, and Triangle sections, are generally faced with the problem of finance to smoothen their production and operations to expand. To the researcher’s knowledge, no study has examined the determinants of microfinance participation (determinants of microfinance demand), together with the magnitude of participation (determinants of loan size), and evaluated if the determinants of demand are the same as the determinants of loan size.
The study aimed to examine the determinants of microfinance (microcredit) demand by the smallholder resettled sugarcane farmers in Zimbabwe together with the determinants of loan size. The study is therefore guided by questions such as, do household characteristics (household size, gender, experience, education, off-farm income, personal savings, marital status, etc.) and institutional characteristics (payback period, interest rate, distance, grace period, administration procedures, etc.) among others affect the smallholder resettled sugarcane farmers’ demand for microcredit and microcredit size? Lastly, the other research question to be answered is whether the determinants of the decision to borrow also affect the amount to be borrowed.
To the best knowledge of the researcher, many studies [5,16,26,27,28] have concentrated on rural households in general and other short-season crops (maize, rice, and tobacco) to be specific, while this study is concentrating on the determinants of demand for microcredit on small-scale resettled sugarcane farmers, which poses a unique scenario given the duration of the agriculture seasons concerned, including the sugarcane agriculture season that normally takes 12 (ratoon) to 14 months (new plant). This study is a one of a kind to focus on sugarcane farming microfinance demand determinants. With some studies looking at variables like interest rates, collateral security, and general household characteristics (age, extension services, farming experience, land size), this study adds some variables—such as the impact of off-farm income, operating expenses (for sugarcane production is capital intensive), and the frequency of borrowing from MFIs—to examine whether the smallholder sugarcane farmers are graduating to be self-sustained or if they are in need of financial assistance season after season, which also goes a long way of informing policy on how to make the farmers graduate from the seasonal dependence syndrome. The study goes further to estimate marginal effects in order to understand the magnitude of the effect of the demographic, socioeconomic, and institutional determinants on the Probit model rather than just knowing the direction of impact as in previous studies like [15]. With the results from this study, MFIs will know how to design their lending mechanisms to various sectors of the economy since the determinants of microfinance demand in the manufacturing sector tend to vary from the determinants of demand for the agricultural sector and also given the variations in income/revenue streams. The government will also be able to craft sustainable ways of promoting inclusive growth and development as the financial sector of Zimbabwe is controlled by the Ministry of Finance and largely the central bank. Hence, they will be able to adjust and model their financial inclusion strategies and feed into the sustainable growth objectives/goals. However, the study may be limited by the fact that it is a micro-economic/micro-econometric analysis anchored mainly on data obtained in a cross-sectional survey from smallholder resettled sugarcane farming households in the Southeast Lowveld of Zimbabwe, specifically the Chiredzi area smallholder. This study only focused on the 2023/2024 sugarcane growing season data. Hence, the study relied on the farmers’ ability to recall past information in cases where the farmers may not have been keeping farm records/diaries to answer the questions accurately. This becomes a limitation of depending on mental accounting data.

2. Literature Review

2.1. Theoretical Literature Review

The concept of microfinance is “marked by a major debate between two leading views on how to fill the ‘absurd gap’ in microfinance” [29], that is, the financial systems approach (institutionalist approach) and the poverty lending approach (welfarist approach). The two theoretical views posit that microfinance services should always be directed towards the marginalized poor people. The poverty lending approach focuses on reducing poverty through credit and other microfinance services provided by institutions that are funded by donors and the government [29].

2.1.1. Institutionalist Approach

This is sometimes called the institutionalist paradigm. The institutionalist approach focuses on creating financial institutions to serve clients who either are not served or are underserved by the formal financial system [29]. Emphasis lies on achieving financial self-sufficiency. In this case, breadth of outreach (meaning the number of clients) takes precedence over depth of outreach assuming positive client impacts. The center of attention is the institution which is primarily gauged by the institution’s progress toward achieving financial self-sufficiency. The institutions are mainly driven by the profit motive and their primary objective is usually financial deepening. Microfinance can then be dominated by large-scale, profit-seeking financial institutions that provide financial services to large numbers of the marginalized. This therefore means working at a disadvantage because the end results may be the plunging/trapping of the marginalized poor into the ‘debtors’ prison’ or debt traps. In this theory, institutional sustainability is key to the successful provision of microfinance services, and financial self-sufficiency is also viewed as a necessary condition for institutional sustainability. This theory has been considered relevant to the study mainly because the study area is dominated by the institutions that best suit the financial systems approach given their main concern/objective of institutional sustainability, meaning the profit motive overrides the social motive.

2.1.2. Welfarist Approach

This is sometimes called the poverty lending approach. Welfarists, on the other hand, emphasize the depth of outreach rather than the breadth of outreach. Welfarist views explicitly focus on improving the well-being of participants (social motive). The most prominent examples of welfarist institutions are the Grameen Bank in Bangladesh and some similar institutions across the globe. From a common perspective in the Zimbabwean context, the majority of non-governmental organizations (NGOs) like Christian Care, Catholic Relief Services, World Vision, and Care International within the Zimbabwean context have been involved in various microfinance initiatives in a drive to promote standards of living improvements. Welfarists often argue that microfinance institutions can be sustainable without achieving financial self-sufficiency. Donations are generally considered to serve as a form of equity, and the donors (NGOs) are viewed as social investors who realize social/welfare/intrinsic returns as compared to private investors.

2.2. Empirical Literature Review

Various empirical studies in this subject area have been conducted [1,2,16,27,28,30,31,32,33,34] in various countries. Some of the reviewed and summarized empirical studies include, though are not limited to, Mamuye [34] which ascertained the determinants of smallholder farmer participation in formal credit together with the challenges formal financial institutions found in lending to agricultural especially smallholders using descriptive statistics and a binary logit model. A number of instances of livestock-owned group lending and distance from lending institutions were found to negatively influence farming households’ participation in formal credit. Dang et al. [27] examined the determinants of access to formal and informal credit in the agriculture sector of Vietnam, through utilizing a multinomial logit (MNL) regression model and the random forest (RF) technique. From the results, literacy, income, collateral, farm size, income, application procedure, and risk perceptions were the critical determinants of the decision to borrow.
Asante-Adoo et al. [26] analyzed the determinants of farmers’ participation in microcredit programs in Ghana using a Probit regression model and Heckman’s sample selection model to identify the determinants of the probability of credit rationed in the microcredit programs. Findings revealed that improved access to savings and agricultural loans determines participation, while the fear of default risk results in non-participation. Farmers’ group membership and formal education positively influenced the probability of credit program participation. Dube et al. [28] investigated the determinants of smallholder tobacco farmers’ access to formal credit utilization and found that farmers’ risk attitude, extension services, and land ownership positively and significantly influenced the probability of access to credit. Chandio et al. [9] examined the impact of socioeconomic characteristics of smallholder farmers on credit demand in Pakistan using descriptive statistics, correlation, and OLS regression. Education, land size, access to road networks, farmers’ experience, and extension contacts positively influence loan demand.
Also, Fecke et al. [30] studied the determinants of agriculture loan demand in Germany, from an ordinary least squares (OLS) regression, and the findings revealed that farmer perceptions, grace period, and interest rate significantly impact loan demand. The study concluded that the interest rate had a negative impact, grace periods a positive impact, and farmers’ perceptions a positive impact). The results and conclusions from the different empirical literature are mixed, hence triggering the rationale to explore the determinants of both participation and loan size using Probit and Tobit models in the first and the second stages, respectively. Some variables that affect micro-borrowing in one study were found to be insignificant in another, hence prompting the need to assess the same in smallholder resettled sugarcane farmers, which is a prolonged agricultural activity compared to the less than 90 days’ agriculture activities that have been vastly covered empirically. Despite various micro-lending models according to the Grameen Bank, this study focused on the individual lending model.

3. Research Methodology

3.1. Data, Survey, and Sampling

An analysis of agricultural farm determinants of microfinance demand on a micro-level scale required household farm-level survey data collected using a detailed questionnaire. The study has a cross-sectional quasi-experimental design (comparing microfinance beneficiaries and non-beneficiaries) that seeks to assess the determinants of microcredit demand (factors influencing the decision to borrow and those influencing the amount borrowed). The study concentrated on the farmers who benefited from the FTLRP exercise, and only those who share common socio-economic characteristics. A multi-stage sampling technique was employed. Firstly, there was the stratification of the Chiredzi resettlement area into three resettlement schemes, namely Mkwasine, Hippo Valley, and Triangle, followed by the purposive selection of microfinance participants (micro-borrowers) using the baseline survey data from the microfinance service providers in the area. Farmers in each stratum who were randomly selected and interviewed using a structured and researcher-administered questionnaire in 2018 (for a study on the impact of microfinance and productivity and technical efficiency of smallholder sugarcane farmers) were then targeted digitally to collect 2024 data using KoboCollect. More than 350 farmers who participated in 2018 (with the 2017/2018 sugarcane growing season) survey responded positively [17,25] and a few replacements were sought through snow-bowling and also with the help of MFI databases for the recent borrowing activities for the 2023/2024 sugarcane growing season. Given that, this was more of a follow-up survey on the same households, despite having some additional variables to the previous questionnaire such as the borrowing frequency as determinants of both the decision to borrow and the amount borrowed.
Farmers from the three resettlement areas (Mkwasine, Hippo Valley, and Triangle) constitute the sample of 370 smallholder resettled farmers. Questions in the questionnaire sought to collect demographic, financial, and institutional data. Variables of interest included age, education, marital status, gender, interest rates, grace periods, the value of collateral, application and processing charges, off-farm incomes, micro-savings, payback period, microfinance-related risks, farming experience, land size, off-farm income, frequency of borrowing operation costs, membership to smallholder resettled farmers, household farming assets, and extension visits. All the information was gathered from the smallholder resettled sugarcane farmers from the three selected resettlement areas primarily specializing in sugarcane production. Purposive sampling of microfinance beneficiaries from Agribank and Getbucks microcredit beneficiaries’ baseline information was used. The micro-borrowers group was made up of 214 farmers, whereas 156 farmers constituted the non-borrowers group constituting a sample of 370 farmers.

3.2. Analytical Framework

Microfinance demand was first considered as the probability that a farmer answers yes to the question, “Did you participate in microcredit within the past sugarcane growing season?” Now in determining the determinants of microfinance demand, this was done in two different ways using two different approaches since the determinants have been considered in two different ways; hence, two different econometric models were used. Probit and Tobit models were used. A binary Probit model was used in line with Mpuga [15] and Sebatta et al. [35]. A Tobit model was secondly used for the determinants of the magnitude of participation measured as the determinants of loan size and hence the dependant variable was then a continuous variable (amount borrowed) as in Sebatta et al. [35]. The maximum likelihood estimation (MLE) technique was also chosen over the ordinary least squares (OLS) regression technique to pave the way for post-estimations such as estimating the marginal effects to allow direct interpretation of the coefficient [2].
The study, therefore, adopted and modified the Probit model used in Sebatta et al. [35] in determining the demand for microfinance where variables like operational costs (sum of labor, seed, haulage, irrigation, fertilizer, and chemicals) costs were added to capture the special nature of sugarcane production (both labor and capital intensive) as potential determinants of the probability of smallholder farmers to participate in microfinance and as an additional and critical determinant of loan size among others. The estimated function therefore took the following form:
K t = f ( A G E t , E D U t , S E X t , M T S t , H H S t , D I S t , O P C t , H F A t , I N T t , R P P t , R I S t , L N O t , A P C t , P R C t , A P T t , G R P t , O F Y t , S A V t , E X T t , F R E Q t , M F A t )
where K t = is a dependent dummy variable that takes the values of either 1, when the farmer is a participant, or 0, when the farmer is a non-participant. Hence, the probability of the two possible outcomes is dependent on a vector of the explanatory variables.
If a household/smallholder farmer is a microfinance participant, then K t > K t * meaning K t * = 1 while if the farmer is not a microfinance participant, K t K t * = 0 .
The independent variables are described below:
A G E t –age of farmer household head, E D U t –highest level of education attained by the farmer was decomposed into primary ( E D U 2 t ), secondary ( E D U 3 t ) , and tertiary education ( E D U 4 t ), S E X t –gender of the farmer, M S t –marital status of the farmer or household head, H H S t –household size, H F A t –household farming assets ownership, D I S t –distance to the nearest MFI, O P C t –operating costs, I N T t –rate of interest, R I S t –risk perceptions, A P C t –administrative and processing charges, A P T t –loan processing time in number of days, R P P t –repayment or payback period in months, G R P t –grace period given to the before the first instalment in months, O F Y t –off-farm income, M S A V t –savings, E X T t –number of extension visits, F R E Q t –represents the frequency of borrowing measured by the number of times the farmer borrowed microcredit size, and M F A t –1 if the farmer belongs to a smallholder farmers’ association and 0 if not.

3.2.1. Determinants of Microcredit Demand (Probit Model Specification)

K t * = 0 + 1 R I S t + 2 M S A V t + 3 O P C t + 4 D I S t + 5 L N t + 6 S E X t + 7 M S t + 8 A G E t + 9 H H S t + 10 E X P t + 11 H F A t + 12 O F Y t + 13 I N T R t + 14 E X T t + 15 M F A t + 16 E D U 2 t + 17 E D U 3 t + 18 E D U 4 t + 19 G P t + 20 P B P t + 21 F R E Q t + 22 A P C t + ε t

3.2.2. Determinants of the Microcredit Size (Tobit Model Specification)

The Tobit model was estimated to capture the intensity of microfinance demand where the dependent variable changed from the binary outcome variable to a continuous variable and catering for sample selection bias. The same variables used in the determinants of participation were used as the determinants of the magnitude of participation only considering the borrowers, hence, a reduced sample size and the model specified as below.
A M N T t = 0 + 1 R I S t + 2 M S A V t + 3 O P C t + 4 D I S t + 5 L N t + 6 S E X t   + 7 M S t + 8 A G E t + 9 H H S t + 10 E X P t + 11 H F A t + 12 O F Y t + 13 I N T R t + 14 E X T t + 15 M F A t + 16 E D U 2 t + 17 E D U 3 t + 18 E D U 4 t + 19 G P t + 20 P B P t + 21 F R E Q t + 22 A P C t + ε t
All the explanatory variables were defined as in the Probit model above except ε t for the error term which is a normally distributed random probability variable. The Probit model estimated assumes that the error term is normally distributed random variable so that the probability that K t K t * can be computed from a normal cumulative probability function. Like in the Probit model, 0 is a constant while 1 to 20 are the parameters estimated.

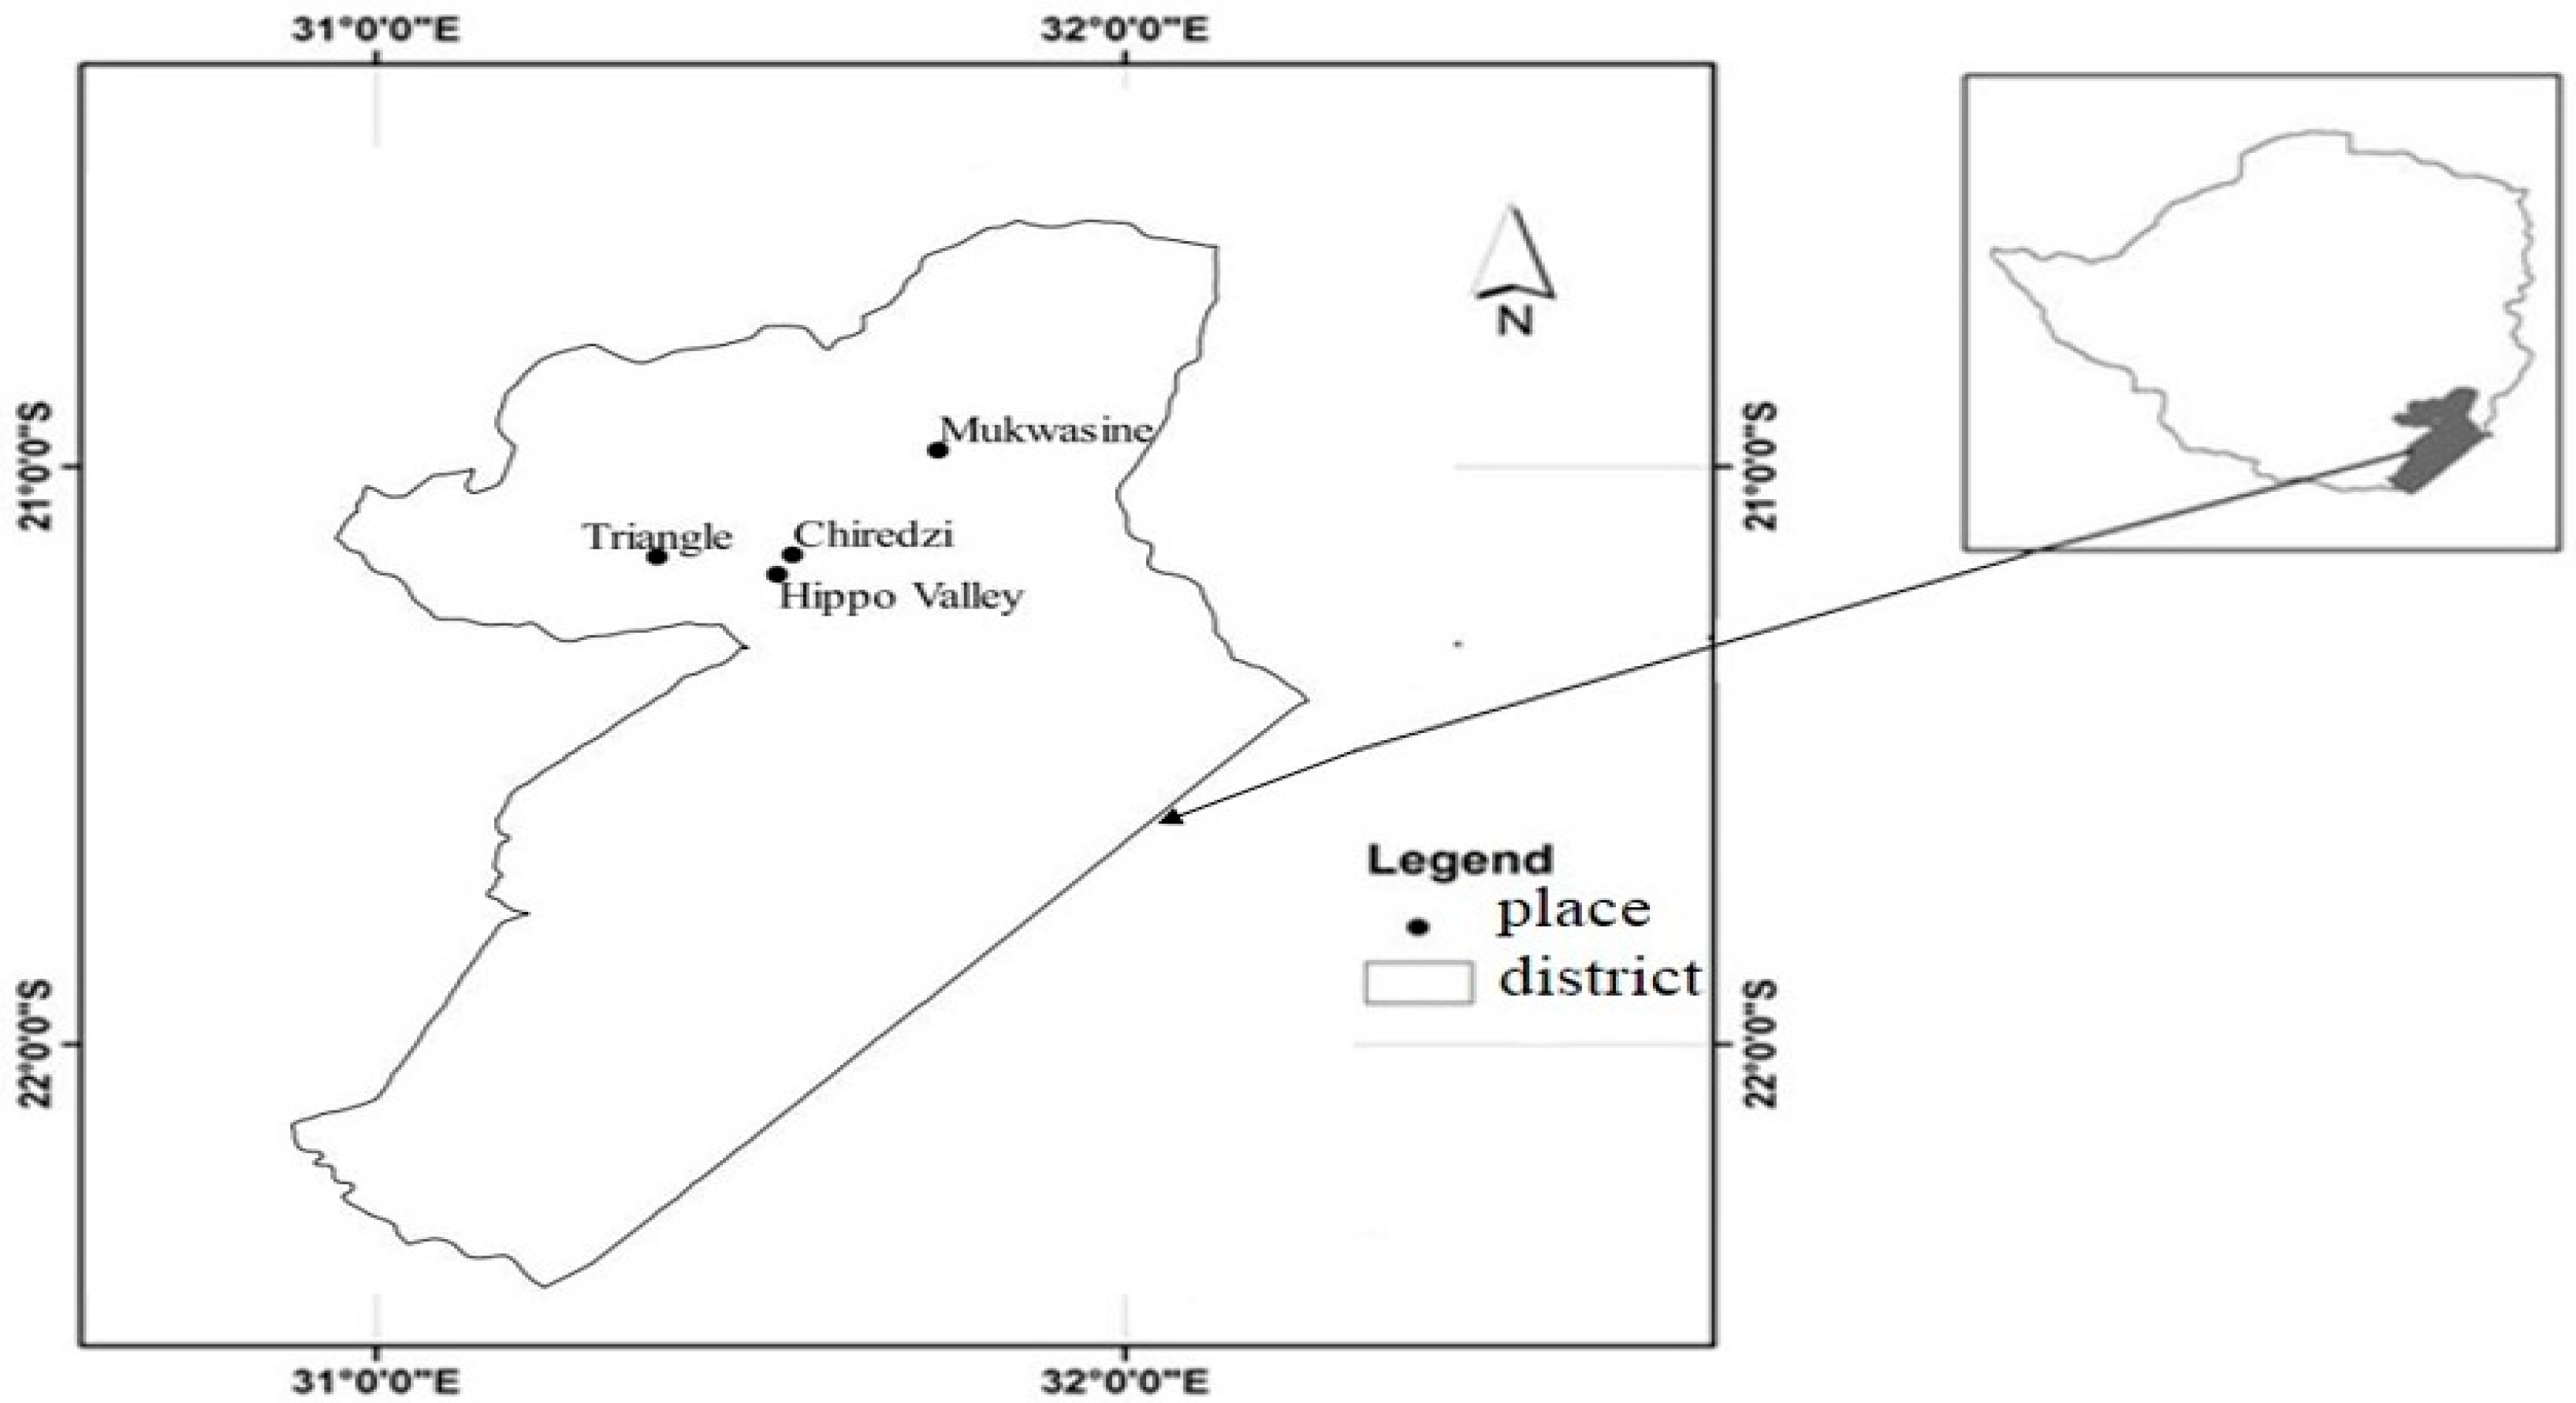
3.3. Description of the Study Area

Chiredzi is located in the southeastern part of Zimbabwe in Masvingo province and about 200 km from Masvingo town in the agro-ecological region 5 of Zimbabwe [36]. This part of the country experiences a Savanna type of climate, with very high temperatures (with the highest and lowest ranging from 34 degrees Celsius and 5 degrees Celsius in summer and winter, respectively). Moreover, there is low, erratic, and uncertain rainfall (less than 620 mm/annum) [36]. The high temperatures are also estimated to evaporate between 600 mm and 1000 mm per year [36] meaning evaporation exceeds precipitation. As such, the excess evaporation will be directly from the dams and indirectly from plants irrigated by water from the dams. The Lowveld (Chiredzi) is about 900 m above sea level (altitude). The southeast Lowveld (Chiredzi) area is estimated to have an aridity index between 0.2 and 0.5, an indication that it is a semi-arid region [36]. The area is commonly vegetated with Mopane vegetation making it conducive for extensive cattle and game ranching.
The area is among the drought- and flood-vulnerable areas in the country due to uncertainly low rainfall and low-lying land, respectively. Due to low rainfall and high temperatures, sugar production is strongly dependent on irrigation with the irrigation water siphoned from six dams, mainly Lake Mutirikwi, Bangala, Nyajena, Manjirenji, Muzhwi, and Tokwane Barage. The above sources of irrigation water have been boosted by the biggest inland lake, the Tokwe Mukosi Dam, which has been earmarked to supply the vast of the irrigation water required for sugar production. The major crop grown is sugarcane, which is considered as a commercial or cash crop, while other food crops are also grown mainly for domestic consumption. Other agricultural activities include cattle ranching and cotton farming. There are major financial institutions that are also found in Chiredzi and mainly serve the estate workers, smallholder farmers, farm workers, and the business community that thrive on sugarcane farming. The financial institutions include Barclays, CBZ, Agribank, BancABC, CABS, ZB, Standard Chartered Bank, and also microfinance institutions. The map of the study area is in Figure 1 below.

3.3.1. Expected Signs

All the explanatory variables discussed above have been further summarized in Table 1 below. The expected signs to which they were hypothesized to affect the demand for microfinance illuminate the need for participation and the magnitude of demand are presented in the table below (Apriori expectation/hypothesized signs). Also captured is a summary of how the variables were measured.

3.3.2. Multi-Collinearity Diagnosis

To study the factors affecting smallholder farmers’ demand for microfinance, before subjecting the data gathered to Probit and Tobit regressions models, both the continuous and discrete explanatory variables were checked for the existence of multi-collinearity in order to avoid wrong signs and smaller t-ratios for the estimated regression coefficients [30], thereby avoiding wrong conclusions. Multi-collinearity was also checked to ensure the consistency and unbiasedness of the Probit and Tobit model estimates. The variance inflation factor (VIF) was used. For VIF, the minimum possible value is 1.0; while values greater than 10 indicates collinearity problem [30].
According to Gujarati (2004) [37], VIF can be expressed as:
V I F x i = 1 1 R i 2
where R i 2 is the square of multiple correlation coefficients that results when one explanatory variable (Xi) is regressed against all other explanatory variables. The larger the value of VIF that is ( x i ), the more “troublesome” or collinear the variable Xi is. Using the rule of thumb, if the VIF of a variable is greater than 10, then there is the problem of multi-collinearity as advanced by [37]. After checking for the problem of multi-collinearity, both the Probit and Tobit models were estimated. The next section discusses the methodology used for the technical efficiency impact of microfinance for the proceeding third, fourth, and fifth objectives.

4. Results Presentation, Interpretation, and Analysis

4.1. Descriptive Statistics

Table 2 shows the results for the descriptive statistics for the continuous variables where the mean age of the whole sample is 61 years. The lowest age range was 29, oldest was 89. This shows that sugarcane farming is dominated by farmers who are over the age of 60 years and this can be because, in many developing countries, farming is generally considered as a retirement occupation (urban to rural migration by the elderly upon retirement). The average operating costs were $48,202 while the minimum and maximum were $13,966 and $125,464, respectively. The results show that, on average, sugarcane farming is expensive, given that it is both capital- and labor-intensive; hence, the costs will tend to rise (due to hiring costs, especially for labor, capital, and transportation costs). For the treatment group only, the average amount borrowed was $5016, while the minimum and maximum amounts were $1275 and $10,000, respectively, and this applies to the micro-borrowers only. The average household size was found to be 9 while the minimum and maximum numbers of people per household were 2 and 17 family members, respectively, meaning the labor-intensive nature of sugarcane farming; hence, the large household sizes are often a proxy for family labor which characterize smallholder farm production (an indication that smallholder farming and sugarcane farming is labor intensive).
Table 2 further shows that the average distance to the nearest town (Chiredzi) where microfinance institutions are located was 22 km, while the minimum and maximum are 2 km and 64 km, respectively. The average payback period was 4 months while the minimum and maximum payback periods were between 2 months and 12 months, respectively. This shows that on average the payback seems short despite the fact that some farmers were advocating for once-off payments after selling their sugarcane to avoid default and abuse of funds. The results showed that at most, the average rate of interest charged was 11.65% with the minimum interest rate and the maximum interest rate ranging between 10.5% and 12.8%, respectively. These descriptive statistics indicate that all the MFIs in the study area are driven by the profit motive (institutionalist/financial systems approach rather than the pioneering social motive where the main objectives included rural development and poverty alleviation) given that from the development of microfinance, it was an interest-free development initiative.
The mean grace period given to the farmers was 3 months (with the minimum and maximum grace periods being 1 month and 14 months, respectively). This indicates that MFIs are not patient enough to sustain the sugarcane growing season; hence, most suitable for other short-season crops or horticultural crops where the seasons are a bit short. The other reason for short grace periods might be the financial sector fragility, and instability to currency (crisis) uncertainty of the Zimbabwean financial sector (for instance, depreciation of the local currency which may render the local currency-denominated microcredit worthless by the time of repayment). With regards to land, the results indicated that the mean landholding size by the households was 11.4 ha while the minimum and maximum landholding sizes were 4 ha and 25 ha respectively. Also, the mean experience was 11 years while the minimum and maximum years of experience were 2 years and 19 years respectively.
Also, the average extension visits per sugarcane farming season was 4 visits, while the minimum and maximum visits were 1 and 15 visits respectively for a period of 12 to 14 months. Reasons for low visits might be fuel shortages and lack of vehicles and motorcycles on the part of the government hence less mobility on the part of extension workers. The number of extension workers seems low for the large resettlement areas one will be obliged to oversee and their number and mobility should also be enhanced. The mean Off-Farm income value was estimated to be $3956 with a minimum of $350 and a maximum of $17,893. The Micro-savings value was found to be a mean $1274, with a minimum of $175 and a maximum of $11,850. The average for household farming assets was estimated to be $13,873 with a minimum of $3850 and a maximum of $105,000. For noting also is that these absolute and continuous variables were used in the determinants of the amount borrowed (Tobit regression model) while the dummy proxies (presented in Table 3) were used on the determinants of the decision to borrow (Probit regression model). Up next are the descriptive statistics for the dummy variables used in the models.
Presented in Table 3 above are the descriptive statistics of the dichotomous and categorical dummy variables of the collected data. Gender composed of 101 females (37 non-borrowers and 64 micro-borrowers) and 269 males (119 non-borrowers and 150 micro-borrowers), thereby exhibiting a bias towards males when it comes to the ownership and control of the factors of production such as land and therefore forms the greater percentage of the respondents in this study with respect to microfinance demand. Household farming assets indicates the ownership of agricultural machinery measured by at least a tractor. From the survey results presented in Table 3, a total of 165 farmers (110 from non-borrowers and 55 from the micro-borrower categories) did not own at least a tractor whilst, 205 were in ownership of at least a farming asset such as a tractor. These findings conclude that the majority of smallholder farmers without the least expected farming assets were non-borrowers, while the majority of farmers in ownership of farming assets were micro-borrowers (159 compared to 46 farmers). This then means that ownership of such assets paves the way for micro-borrowing given that those assets are often used as collateral security. This measure was used in the Probit regression.
As presented in Table 3, 250 farmers (107 non-borrowers and micro-borrowers) did not have off-farm income, meaning the majority of the respondents solely depended on sugarcane farming. About 143 farmers from the micro-borrowers group did not have off-farm income and might have borrowed in order to finance their agricultural expenses. Hence, a lack of off-farm income justifies their microfinance demand. These statistics reveal that those who did not borrow had enough supplementary finance to cover for their sugarcane-growing financial needs and those with off-farm income who borrowed might have because their off-farm income was less than enough for their supplementary agriculture finance requirements. Also, the borrowers with off-farm income might have leveraged it as collateral since many MFIs are offering salary-based microcredit where the salary is used as collateral security. This measure was used in the Probit regression. The marital status of the participants as indicated in Table 3 highlighted that 95 (30 non-borrowers and 65 micro-borrowers) farmers were single and 275 (126 control and 149 treatment) married.
As shown in Table 3, 66 farmers did not attain any educational qualifications (no schooling), with 30 from the control group and 36 from the treatment group. Furthermore, a total of 103 farmers indicated that their highest educational qualification was primary education (64 control and 39 treatment), whereas 115 farmers had attained secondary education as their highest (49 control and 66 treatment). About 85 farmers had attained tertiary education as their highest qualification (12 from the control and 73 from the treatment). Generally, highly educated farmers were more skewed towards the micro-borrowers. From the descriptive statistical results presented in Table 3, farmers that were risk-averse were 167 (115 control and 52 treatment) while 203 (41 control and 162 treatment) farmers were risk-neutral. The risk perception of the farmers is further exhibited by the amount borrowed.
As shown in Table 3 regarding micro-savings, a total of 233 (110 non-borrowers and 123 micro-borrowers) farmers stated that they did not start the agriculture season with any savings from the previous season, while 137 (46 control and 91 treatment) farmers had savings from the previous sugarcane growing season. In other words, 110 farmers did not save from the previous season and did not borrow, while 123 farmers did not save but borrowed from MFIs. Also emerging from the findings was that 91 farmers who borrowed saved in the previous season proceeds. In relation to Zimbabwe, the low savings rates could be attributed to the hostile savings environment in the financial sector where funds saved will be losing value instead of gaining through interest over time. Instead of savings to accumulate or bear interests, the charges surpass the interests hence the principal amount saved will be reduced in value hence act as a disincentive to potential savers. The results in Table 3 also indicated that 58 (28 non-borrowers and 30 micro-borrowers) farmers were not members of any smallholder sugarcane farmers’ association, while 312 (128 control and 184 treatment) farmers subscribed to smallholder sugarcane farmers’ associations. On microfinance participation and the nature of farming, the results indicated that 67 (18 non-borrowers and 49 micro-borrowers) farmers were part-time, whilst 303 (138 non-borrowers and 165 micro-borrowers) farmers were full-time sugarcane farmers.

4.2. Multi-Collinearity Diagnosis

Before subjecting the primary household data gathered to Probit and Tobit regression analysis, the explanatory variables were checked for the existence of the problem of multi-collinearity to ensure the consistency and unbiasedness of both the Probit and Tobit model estimates. The variance inflation factor (VIF) was used. The VIF results indicated that there was no problem with multi-collinearity since no variable was found to have a VIF close to or greater than 10. The inexistence of multicollinearity signals that the estimated regression coefficients have the correct signs and t-ratios and that accurate conclusions were made [30].

4.3. Probit and Tobit Regression Results

From the results presented in Table 4, the p-value of the Probit model shows that the model is statistically significant that is Prob > chi2 = 0.0000. The Pseudo R-squared of 0.6462 indicates that the estimated model is a descent since the value is far much greater than 0.25. The Tobit model was used utilizing data for micro-borrowers only where the dependent variable is the amount borrowed. The results, the Prob > chi2 = 0.0000 showing a statistically significant model, Pseudo R-squared of 0.536 also indicates a descent model estimated since it is greater than 0.25.

4.4. Results Interpretation and Discussion

As presented in Table 4, from the estimated Probit and Tobit regression analysis, most of the variables that determine the decision of a farmer to borrow also affect the amount borrowed. Following the presentation clusters in Table 4, the results were interpreted and discussed under the following subheadings.

4.4.1. Demographic Determinants

Gender, household size, and marital status were found not to affect either the decision to borrow or the loan size. Secondary and tertiary education were found to have positive and statistically significant coefficients (0.522 and 1.819, respectively). These levels of education influence microfinance demand positively. An improvement from primary to secondary education qualification increases the probability of microfinance demand (Kt = 1) by 46.54% and a further improvement from secondary to tertiary education increases the probability of microfinance demand (Kt = 1) by 62.67%. Generally, education has a positive relationship with the probability of participation in microfinance which corroborates the findings of Chandio et al. [9], Dang et al. [27], and Silong and Gadanakis [38]. However, this was found to be contrary to Sangwan and Nayak [39] who concluded that the less educated tend to demand more credit than the more educated. Likewise, microcredit size increases with education (percentage point increase in secondary education results in a 5.1% increase in loan size, and graduation from secondary to tertiary education result in a 13.2% increase in microcredit size). The results corroborate those of Domanban [5] and Asiamah et al. [40]. Age and age squared have statistically negative and positive coefficients (−0.302 and 0.003); hence, the turning point is 58 years. A positive relationship between age and microfinance demand exists when farmers are below the age of 58 and a negative relationship starts from the age of 58 years. The risk averseness may be increased with age. The results were therefore contrary to Sangwan and Nayak [39] and Mpuga [15] who found a negative relationship between age and microfinance demand. From the Tobit regression model, age was found to have a negative and significant relationship with loan size. The findings contradicted those of Domanban [5] and Tura et al. [41] who concluded a positive relationship between age and loan size.

4.4.2. Financial/Institutional Determinants

Interest rate has a negative and statistically significant coefficient of −1.545. An increase in interest rate decreases the probability of microfinance demand. For a 1% increase in interest rate, there will be an anticipated decrease in microfinance demand of 84.48% which also confirms that this variable is among the major determinants of microfinance demand. The same negative relationship was also found in the Tobit model consistent with the findings of Osano and Languitone [42], Sangwan and Nayak [39], and Domanban [5]. This simply means that as the rate of interest is increased, there will be a reduction in loan size. The payback period has a negative and statistically significant coefficient of −0.314. The longer the payback period, the less the smallholder farmers demand for microfinance contrary to Domanban [5] and Tura et al. [41]. Sugarcane farmers therefore prefer facilities that deduct all their dues once to prevent default risk since in the case of sugarcane farmers, their revenue is realized in 12 to 14 months unlike other horticultural activities which may have shorter revenue waiting periods. A one-month increase in the payback period results in a 2.57% probability of reducing the demand for microfinance. On the other hand, the payback period was found not to affect loan size with respect to smallholder sugarcane farmers.
Grace period has a positive and statistically significant coefficient of 0.216 meaning that an increase in the months of the grace period increases the probability of microcredit demand by farmers envisaging a positive relationship. For the agriculture sector, revenue is seasonal as in sugarcane production; it ranges between 12 to 14 months’ revenue waiting period depending on whether the cane is ratoon or new plant. A one-month increase in grace period results in a 19.22% probability of micro-borrowing (Kt = 1) supporting the findings of Fecke et al. [30]. Loan size also responds positively to grace period. Farmers may need supplementary finance on the onset of the planting season hence may need grace period stretching to over 12 months though dependent upon microeconomic and financial sector stability. Application and processing charges were found to negatively affect the probability of borrowing and positively affect the loan size. A percentage increase in application and processing charges reduces the probability of participation (borrowing) by 9.2% and increases the magnitude of participation (loan size) by 19.15%. Micro-savings were also found to only affect loan size negatively and had no impact on the probability of borrowing (as micro-savings increases, microcredit/loan size decreases). The decision to borrow was found not to be affected by whether the farmer borrowed for the first time or not, but the magnitude of participation (loan size) was positively affected by whether the farmer was an old micro-borrower or new. First-time micro-borrowers tend to access smaller amounts of loans than repeat borrowers whether from the same institution or not, and lenders tend to have trust in their old farmers who did not default from the previous microcredits. Being a repeat borrower increases loan size by 15.3%.
Off-farm income has a negative and statistically significant coefficient of −0.45. As off-farm increases, the likelihood of Kt = 1 decreases. In the Probit regression model, having off-farm income reduces the probability of microfinance demand by 15.5%. Off-farm income can be a hedge or alternative source of agriculture financing; hence, an increase in it reduces the appetite for borrowing. This was however contrary to the findings of Dang et al. [27] who concluded a positive relationship between the probability of borrowing and household income in general. However, the Tobit regression model results indicated a positive and significant relationship between loan size and off-farm income, meaning that as the off-farm income increases, the loan size increases, thus justifying the prevalence of salary-based loans where an individual’s salary is used by many financial institutions in Zimbabwe as collateral and also used to determine an individual’s creditworthiness (loan size). The findings support those of Domanban [5], where an increase in income increases the loan size. Given that, the risk of default is reduced by offering salary-based loans and further reduced by directly deducting the monthly installments from the salary source. Farmers’ risk perception has a positive and significant coefficient of 1.077 at a 1%level of significance, showing that as a farmer changes from being risk-averse to risk-neutral, the likelihood of participating in microfinance (Kt = 1) increases by 3.9% and the amount borrowed is also positively affected. The findings were found to be consistent with Dube et al. [28] and Dang et al. [27].

4.4.3. General Farming Determinants

Extension services have a positive and statistically significant coefficient of 0.148. The more the frequency of extension contact, the more the chances of micro-borrowing. An additional extension visit increases the probability of micro-borrowing (Kt = 1) by 5.11%, thereby leading to the rejection of the null hypothesis that extension contact does not determine microfinance demand. This supports the findings of Dube et al. [28], Chandio et al. [9], and Nasereldin et al. [43]. On the other hand, loan size is not dependent on extension visits. Experience has a negative and statistically significant coefficient of −0.074. As experience increases, the likelihood of demand for microfinance decreases. A one-year increase in experience reduces the probability of Kt = 1 by 2.55%. That can be because more experienced farmers will be well-established and self-sustained. The null hypothesis was therefore rejected, that is, that experience does not affect the demand for microcredit. This corroborates the findings of Chandio et al. [9], Domanban [5], Nasereldin et al. [43], and Saqib et al. [44]. Operation costs have a positive and statistically significant coefficient of 0.0001 at a 1% level of significance. The probability of borrowing increases with increases in operating costs, together with the amount borrowed, and as hypothesized, in other words, the farmer derives the demand for microfinance together with loan size from the costs he/she wants to cover. A 1% increase in operation costs increases the probability of Kt = 1 (micro-borrowing) by 0.002%. Likewise, the loan size increases by 0.04% in response to a percentage increase in operational costs. The positive relationship concurs with findings of Vishwanatha and Eularie [33].
Household farming assets have a positive and statistically significant coefficient of 1.41. An increase in farming assets increases the likelihood of Kt = 1 (microfinance demand). This can be due to the increase in the much-needed assets for collateral security and this is contrary to the findings of Mamuye [34], who found a negative relationship between assets (in the form of livestock) and the probability of smallholder farmers’ participation in microfinance. From the Tobit model, a positive relationship was also found, i.e., as the value of farming assets increases, loan size increases, depicting an increase in the creditworthiness (value of collateral) of the farmers, and this corroborates the findings of Mason [45]. Land size also has a positive and statistically significant coefficient of 0.1362081 at one percent level of significance. An increase in the land (hectarage) under the sugarcane plant increases the likelihood of Kt = 1 (demand for microfinance) and a positive relationship to microcredit size. The larger the cultivated land, the more the required additional capital (machinery, inputs, and labor costs), hence increasing the farmers’ likelihood of borrowing (Kt = 1). This was in line with the findings of Dube et al. [28], Dang et al. [27] Chandio et al. [9], Domanban [5], and Asiamah et al. [40]. An additional hectare planted increases the probability of micro-borrowing (Kt = 1) by 4.4%. The nature of farming was captured as a dummy variable where 1 represents full-time sugarcane farmers and 0 for part-time farmers. From the findings, being a full-time or part-time farmer does not affect the decision to borrow but loan size. A positive relationship was found between loan size and the nature of farming, where full-time farmers tend to borrow more than part-time farmers, maybe because lenders also trust and invest their money (microcredit) in full-time farmers. Membership in sugarcane farmers’ associations was also found to positively influence loan size more than the probability of participation (borrowing) as also found in Mason [45], Domanban [5], and Behr et al. [46].

5. Conclusions and Recommendations

As summarized in Table 5, the study examined the factors that determine smallholder resettled farmers’ demand for microfinance and microcredit size. Most variables that affect the probability of participation also affect the magnitude of participation (microcredit size). The Probit regression results show that most of the explanatory variables were statistically significant. Specifically, secondary education, tertiary education, total operational costs, land size, extension visits, risk perception, and grace period affect microfinance demand positively while interest rate, payback period. Off-farm income and experience affect the demand for microfinance negatively. Also, interest rate, operation costs, risk perception, grace period, savings, farming assets, land size, and off-farm income affect the micro-loan size. From the theoretical underpinnings, given that the study focused on microfinance, it has been proven that micro-lending is more skewed towards the institutionalist approach. The study therefore recommends a move towards the poverty lending approach given that the study focused on the poor smallholder farmers who are traditionally considered unbankable. Hence, what only differs between the microcredit initiatives from the formal banking/financial system might be the loan size, but in terms of requirements and conditions, there is no any significant difference and to those farmers with collateral security; rather, it is a matter of choice of whether to use the mainstream banks or MFIs.
Based on the findings, the study recommends increased flexibility on the part of micro-lenders in designing crop/plant or customer-specific microfinance needs since they differ across the agriculture sector in terms of interest rates, payback periods, and grace periods. Also, the government should work towards stabilizing the financial sector in order to correct financial market price distortions which helps in protecting consumer (farmers) exploitation. This can be stabilized mainly through exchange rate stability where many of the payments are in foreign currency while the financial sector, especially the formal institutions are still lending in local currency (while the formal and parallel market rates are continuously diverging from each other). The Zimbabwean government, as they do in other crops such as maize, should also find ways of intervening in sugarcane production like using subsidized input schemes such as the presidential input schemes to be stretched to smallholder sugarcane farmers as their dependence on borrowing is found to be entrenching some of the farmers into a debt trap. This is evidenced by their repeated borrowing season after season with some isolated cases of farmers losing assets to the MFIs after defaulting through unsustainable debts.
Smallholder resettled sugarcane farmers are currently depending on off-farm income and household farming assets as collateral for both deciding to borrow and the amount to borrow because nowadays in Zimbabwe MFIs commonly use these to determine individual creditworthiness (guided by the net book value of the smallholder farmers’ farming assets). Given that, the Zimbabwean government must consider the prioritization of property rights to all the smallholder resettled farmers (allocated pieces of land are under the communal land ownership schemes) hence they are considered to be operating on state land with no title deeds despite the possibility of using title deeds as collateral to access credit (even from the mainstream financial sector). As a recommendation, the Zimbabwean government needs to facilitate and give title deeds to the smallholder resettled farmers. There is a need for the lending institutions to be driven by the social motive (poverty lending/welfarist approach) instead of the dominant institutionalist approach (driven by the profit motive especially when dealing with the marginalized smallholder resettled farmers. The cross-sectional design of the study limits its ability to establish definitive causal relationships; hence, the results may not be easily generalized to reflect microfinance demand on other populations and crops because of the specific characteristics of the studied farmers. Nonetheless, such limitations may not reduce the value of the study, as it provides a solid foundation for future studies and contributes towards the understanding of the determinants of microfinance demand (the decisions to borrow and the amount to be borrowed) context. Also, the findings of the study may be limited to plantation agriculture and difficult to apply to short-season agriculture activities such as horticulture, small livestock production, and other short-season agriculture activities such as maize, rice, soya beans that mature in less than four months hence the needs and management may be less capital intensive and labor that the sustenance will be bearable to smallholder farmers. Also given that some of the activities are rain-fed hence may require less than plantation agriculture. Similar studies in the smallholder resettled farming fraternity specializing in other agriculture activities to detect crop/plant-specific microfinance demand determinants (since the financial requirements of sugarcane may be different from the financial requirements for other agriculture activities) are recommended. Further studies may also look at the determinants of the microcredit source for instance using the multinomial logistic regression to ascertain the potential impact of the demographic, socioeconomic, institutional, and general characteristics on the source of agricultural microcredit since this study was limited to the determinants of the decision to borrow and the amount only.

Funding

This research was supported by the Small-Scale Agribusiness Non-Farm Enterprises research niche.

Institutional Review Board Statement

The study was conducted in accordance with the Declaration of Helsinki, and approved by the Ethics Committee of the University of Fort Hare (protocol code MUS421SMAT01 on 28 August 2018).

Informed Consent Statement

Ethically, the principles of confidentiality, informed consent, and anonymity of the participants were ensured and respected with voluntary participation in the survey, and the data collected were handled with complete confidentiality and used solely for research purposes.

Data Availability Statement

The data presented in this study are available on request from the author.

Acknowledgments

We thank Walter Sisulu University’s Small-Scale Agribusiness Rural Non-Farm Enterprises research niche for financing (digital) data collection and the APCs.

Conflicts of Interest

The author declares no conflicts of interest.

References

  1. Samuel, A.; Eric, N.; Gabriel, K.-B. Does Loan Size Matter in How Collateral Characteristics Relate to Credit Access? J. Econ. Financ. Account. Stud. 2023, 6, 1–4. [Google Scholar] [CrossRef]
  2. Kangogo, D.; Lagat, J.; Ithinji, G. The Influence of Social Capital Dimensions on Household Participation in Micro-Credit Groups and Loan Repayment Performance in Uasin Gishu, Kenya, MPRA Working Paper No. 48624. 2013. Available online: https://mpra.ub.uni-muenchen.de/48624/ (accessed on 23 August 2024).
  3. Khan, S.; Anuar, A.R. Access to finance: Exploring barriers to entrepreneurship development in SMEs. In Global Entrepreneurship and New Venture Creation in the Sharing Economy; IGI Global: Hershey, PA, USA, 2018; pp. 92–111. [Google Scholar]
  4. Armendariz, B.A.; Morduch, J. The Economics of Microfinance, 2nd ed.; MIT Press: London, UK, 2010; ISBN 9780262513982. [Google Scholar]
  5. Domanban, P.B. Determinants of loan sizes in microfinance institutions: Evidence from the Upper West Region of Ghana. Cogent Econ. Financ. 2024, 12, 2300924. [Google Scholar] [CrossRef]
  6. Dorfleitner, G.; Forcella, D.; Nguyen, Q.A. The digital transformation of microfinance institutions: An empirical analysis. J. Appl. Account. Res. 2022, 23, 454–479. [Google Scholar] [CrossRef]
  7. Reserve Bank of Zimbabwe. Microfinance Annual Report. 2022. Available online: https://www.rbz.co.zw/index.php/financial-markets/nps/27-bs-annual-report/1290-2022-microfinance-annual-report (accessed on 20 November 2023).
  8. World Bank. World Development Report 2022: Finance for an Equitable Recovery; World Bank: Washington, DC, USA, 2022. [Google Scholar] [CrossRef]
  9. Chandio, A.A.; Jiang, Y.; Rehman, A.; Twumasi, M.A.; Pathan, A.G.; Mohsin, M. Determinants of demand for credit by smallholder farmers’: A farm level analysis based on survey in Sindh, Pakistan. J. Asian Bus. Econ. Stud. 2020, 28, 225–240. Available online: http://creativecommons.org/licences/by/4.0/legalcode (accessed on 25 May 2024). [CrossRef]
  10. Hailu, B.K.; Abrha, B.K.; Weldegiorgis, K.A. Adoption and impact of agricultural technologies on farm income: Evidence from Southern Tigray, Northern Ethiopia. Int. J. Food Agric. Econ. 2014, 2, 91–106. [Google Scholar] [CrossRef]
  11. International Finance Corporation. Access to Finance for Smallholder Farmers©; International Finance Corporation: Washington, DC, USA, 2014; Available online: http://hdl.handle.net/10986/21679 (accessed on 13 April 2024).
  12. World Bank Group. Microfinance and Economic Development Policy Research Working Paper 8252; Cull, R., Morduch, J., Eds.; Finance and Private Sector Development Team, Development Research Group; New York University: New York, NY, USA, 2017; Available online: https://papers.ssrn.com/sol3/papers.cfm?abstract_id=3076231 (accessed on 16 May 2024).
  13. Masiyandima, N.; Chigumira, G.; Bara, A. Sustainable Financing Options for Agriculture in Zimbabwe. Zimbabwe Economic Policy Analysis Research Unit (ZEPARU) Working Paper Series (ZWPS 02/10). 2011. Available online: https://EconPapers.repec.org/RePEc:ags:zepars:305816 (accessed on 23 August 2024). [CrossRef]
  14. Guy, M.E. The Macro Drawbacks of Microfinance; Student Publications 872. 2019. Available online: https://cupola.gettysburg.edu/student_scholarship/872 (accessed on 13 April 2024).
  15. Mpuga, P. Constraints in Access to and Demand for Rural Credit: Evidence from Uganda. Afr. Dev. Rev. Tunis-Tunis. 2010, 22, 115–148. [Google Scholar] [CrossRef]
  16. Adebosin, W.G.; Adebayo, A.A.; Mobolaji, A.W.; Ayanyemi, A.A. Determinants of Farmers’ Demand for Micro Finance: The Case of a rural community in Nigeria. J. Econ. Sustain. Dev. 2013, 4, 5. [Google Scholar]
  17. Matsvai, S.; Mushunje, A.; Tatsvarei, S. Technical efficiency impact of microfinance on small scale resettled sugar cane farmers in Zimbabwe. Cogent Econ. Financ. 2022, 10, 2017599. [Google Scholar] [CrossRef]
  18. Kampala. Housing Microfinance Can Help Poor People to Build Better Homes. The Economist. 2019. Available online: https://www.economist.com/finance-and-economics2019/07/18/housing-microfinance-can-help-poor-people-build-better-homes (accessed on 27 August 2024).
  19. Colombo, and Nachchikuda. “Microfinance Is Driving many Sri Lankan Borrowers to Despair”. The Economist. 2019. Available online: https://www.economist.com/finance-and-economics/2019/08/15/microfinance-is-driving-many-sri-lankan-borrowers-to-despair (accessed on 13 October 2024).
  20. Kiriti-Nganga, T.W. Microfinance and Poverty alleviation: How effective is it in Alleviating Gender Based Poverty? In Poverty, Poverty Alleviation and Social Disadvantage: Analysis, Case Studies and Policies; Clem, T., Ed.; Serials Publications: New Dehli, India, 2007; Available online: http://erepository.uonbi.ac.ke:8080/xmlui/handle/123456789/49619 (accessed on 13 October 2024).
  21. de Janvry, A.; Sadoulet, E. Development Economics, 2nd ed.; Routledge: New York, NY, USA, 2021. [Google Scholar] [CrossRef]
  22. Nakano, Y.; Magezi, E.F. The impact of microcredit on agricultural technology adoption and productivity: Evidence from randomized control trial in Tanzania. World Dev. 2020, 133, 104997. [Google Scholar] [CrossRef]
  23. Bangura, S.; Sesay, A.K.; Bah, D.K.S.C.J.; Mansaray, I. The Impact of Microfinance on Smallholder Agricultural Productivity in Sierra Leone: A Case Study of Koinadugu District. Glob. Sci. J. 2020, 8. Available online: http://www.globalscientificjournal.com (accessed on 15 May 2024).
  24. Zimbabwe Association of Microfinance Institutions (ZAMFI) Creating Sustainable Microfinance’. Performance Report of the Microfinance Sector (December 2023). Available online: https://zamfi.org/download/analysis-of-the-performance-of-the-microfinance-sector-in-zimbabwe-dec-2023/ (accessed on 15 August 2024).
  25. Matsvai, S.; Mushunje, A.; Tatsvarei, S. Characterisation of smallholder resettled sugarcane farmers their perceptions towards microfinance in Zimbabwe (Chiredzi). J. Agribus. Rural Dev. 2021, 3, 293–306. [Google Scholar] [CrossRef]
  26. Asante-Addo, C.; Mockshell, J.; Zeller, M.; Siddig, K.; Egyir, I.S. Agricultural credit provision: What really determines farmers’ participation and credit rationing? Agric. Financ. Rev. 2017, 77, 239–256. [Google Scholar] [CrossRef]
  27. Dang, H.D.; Dam, A.H.; Pham, T.T.; Nguyen, T. Determinants of credit demand of farmers in Lam Dong, Vietnam. Agric. Financ. Rev. 2019, 80, 255–274. [Google Scholar] [CrossRef]
  28. Dube, L.; Mariga, T.; Mrema, M. Determinants of Access to Formal Credit by SmallholderTobacco Farmers in Makoni District, Zimbabwe. Greener J. Agric. Sci. 2015, 5, 33–42. [Google Scholar] [CrossRef]
  29. Robinson, M. The Microfinance Revolution: Sustainable Finance for the Poor; World Bank: Washington, DC, USA, 2001. [Google Scholar]
  30. Fecke, W.; Feil, J.; Musshoff, O. Determinants of loan demand in agriculture: Empirical evidence from Germany. Agric. Financ. Rev. 2016, 76, 462–476. [Google Scholar] [CrossRef]
  31. Rweyemamu, D.C.; Kimaro, M.P.; Urassa, O.M. Assessing Microfinance Services in the Agriculture Sector Development: A Case of Semi-Formal Financial Institutions in Tanzania; Economics and Social Research Foundation: Dar es Salaam, Tanzania, 2010. [Google Scholar]
  32. Pendame, S.; Akotey, J.O. The effect of a moveable collateral registry on MSME access to finance: Evidence from Malawi. Cogent Econ. Financ. 2023, 11, 2163873. [Google Scholar] [CrossRef]
  33. Vishwanatha; Eularie, M. Access to microcredit for smallholder agricultural producers in Rwanda (Africa): Emerging challenges and issues. J. Commer. Manag. Thought 2017, 8, 452. [Google Scholar] [CrossRef]
  34. Mamuye, W. Determinants of Smallholder Farmers Participation in Formal Credit and Challenges Faced by Institutions: The Case of Mojana Wodera District, Amhara Region, Ethiopia. Int. J. Financ. Bank. Res. 2021, 7, 9–20. [Google Scholar] [CrossRef]
  35. Sebatta, C.; Wamulume, M.; Mwansakilwa, C. Determinants of smallholder farmers’ access to agricultural finance in Zambia. J. Agric. Sci. 2014, 6, 11. [Google Scholar] [CrossRef]
  36. Chikodzi, D.; Murwendo, T.; Malvern, F.S. Climate Change and Variability in Southeast Zimbabwe: Scenarios and Societal Opportunities. Am. J. Clim. Change 2013, 2, 36–46. [Google Scholar] [CrossRef]
  37. Gujarati, N. Basic Econometrics, 4th ed.; McGraw Hill Publishing Company: New Delhi, India, 2004. [Google Scholar]
  38. Silong, A.K.F.; Gadanakis, Y. Credit sources, access and factors influencing credit demand among rural livestock farmers in Nigeria. Agric. Financ. Rev. 2019, 80, 68–90. [Google Scholar] [CrossRef]
  39. Sangwan, S.; Nayak, N.C. Factors influencing the borrower loan size in microfinance group lending: A survey from Indian microfinance institutions. J. Financ. Econ. Policy 2021, 13, 223–238. [Google Scholar] [CrossRef]
  40. Asiamah, T.A.; Steel, W.F.; Ackah, C. Determinants of credit demand and credit constraints among households in Ghana. Heliyon 2021, 7, e08162. [Google Scholar] [CrossRef] [PubMed]
  41. Tura, E.G.; Kenea, T.; Kaso, T. Determinants of demand for credit among wheat and teff smallholder farmers in central of Ethiopia (Arsi and South West Shewa). Am. Res. J. Bus. Manag. 2017, 3, 17. [Google Scholar]
  42. Osano, H.M.; Languitone, H. Factors influencing access to finance by SMEs in Mozambique: Case of SMEs in Maputo central business district. J. Innov. Entrep. 2016, 5, 1–16. [Google Scholar] [CrossRef]
  43. Nasereldin, Y.A.; Chandio, A.A.; Osewe, M.; Abdullah, M.; Ji, Y. The Credit Accessibility and Adoption of New Agricultural Inputs Nexus: Assessing the Role of Financial Institutions in Sudan. Sustainability 2023, 15, 1297. [Google Scholar] [CrossRef]
  44. Saqib, S.E.; Ahmad, M.M.; Panezai, S. Landholding size and farmers’ access to credit and its utilisation in Pakistan. Dev. Pract. 2016, 26, 1060–1071. [Google Scholar] [CrossRef]
  45. Mason, D.R. Who gets what? Determinants of loan size and credit rationing among microcredit borrowers: Evidence from Nicaragua. J. Int. Dev. 2014, 26, 77–90. [Google Scholar] [CrossRef]
  46. Behr, P.; Entzian, A.; G€uttler, A. How do lending relationships affect access to credit and loan conditions in microlending? J. Bank. Financ. 2011, 35, 2169–2178. [Google Scholar] [CrossRef]
Figure 1. Map of Chiredzi (Showing the Resettlement Areas).
Sustainability 16 09752 g001
Table 1. Model variables and hypothesized/Apriori expected signs.
Variable DescriptionProbitTobit
Demographics
Gender (1 if male and 2 if female-GEN)+/-+/-
Household size (number of people in the household-HHS)++
Primary education (Eductn2)++/-
Secondary education (Eductn3)++/-
Tertiary education (Eductn4)+-
Age (age of farmers years-AGE)++
Marital status (1 if married and 0 if not-MS)++/-
Financial/Institutional Characteristics
Interest rate (rate of interest charged on micro-borrowing-INTR)--
Grace period (number of months before the first installment-GP)++
Payback period (number of months taken to clear the debt-PBP)++
Application and processing charges (1 if low and 2 if high-APC)++
Micro-savings (1 for micro-savers and 0 for non-savers in Probit and the value of farmer’s previous season savings in Tobit-MSAV)--
Frequency of borrowing (times the farmer borrowed from MFIs-FREQ)++
Off-farm income (1 for having off-farm income and 0 if otherwise (in Probit) and value of farmer’s off-farm income (in Tobit)-OFY)+/-+/-
Microfinance risk perception (1-risk neutral and 0-for risk averse-RIS) +-
General Farming Characteristics
Extension visits (number of visits per sugarcane farming season-EXT)++/-
Farming experience (years of sugarcane farming-EXP)++
Operation expenses (value of the seasonal operating expenses-OPE)++
Household farming assets (1 for having assets and 0 if otherwise (in Probit) and the net book value of farming assets (in Tobit)-HFA)+/-+/-
Membership to farmers associations (1-members and 0 if not-MFA) +/-+/-
Land Size (continuous variable in hectares-LN)++
Nature of farming (dummy where fulltime = 1 and part-time = 0-NOF)++/-
Distance to the nearest MFI (in kilometers-DIS)--
Table 2. Descriptive statistics for continuous variables.
Characteristic (Variable) N = 370MeanStnd Dev.MinMax
Amount borrowed (AMNT)$5016$2440$1275$10,000
Age (years)60.8415.692989
Operating costs ($)$48,201.50$18,641.5013,966125,464
Household size (number)8.43.0367217
Payback period (months)3.86453.2696212
Distance to the nearest MFI in km21.968 km15.5291264
Interest rate (%)11.65%1.152710.512.8
Grace period (months)3.10283.2830114
Land size (ha)11.43243.91042425
Experience (years)11.11355.1169219
Off-farm income (OFY)$39562.971$350$17,893
Micro-savings value (MSAV)$12741.079$175$11,850
Extension visits (number)43.502115
Household farming assets @ estimated net book value (HFA)$13,8739.343$3850$105,000
Frequency of borrowing (FREQ)52.97317
Table 3. Descriptive statistics for dichotomous and categorical dummy variables.
Variable (N = 370)DescriptionUnitParticipantsNon-Participants
Gender (GEN)Male1150119
Female06437
Marital status (MS)Married114965
Single012630
Off-farm income (OFY)Have Off-farm Income171143
No Off-farm Income010749
Nature of farming (NOF)Full time1165138
Part time04918
Farmers association membership (MFA)Member1184128
Not a Member03028
Risk attitude/perception (RIS)Neutral116241
Averse052115
Savings (MSA)Microsavers19146
Non-microsavers0123110
Education (Eductn1, 2 &3) No Schooling03630
Primary13964
Secondary26649
Tertiary37312
Table 4. Probit and Tobit results presentation.
Probit Results Tobit Results
Number of Obs370 214
Prob > chi20.0000 0.0000
LR chi2 68.60 206.54
Pseudo-R20.6462 0.536
Log-likelihood−89.115 −89.1146
KtCoeffdy/dxcoeffStn   t
Cons−1.125 −6.94 ***−8667.51 −2.50 **
Demographic Characteristics
GEN−0.129−0.044−0.43−67.564.64−1.04
HHS0.0180.0060.36−56.5739.394−1.44
Eductn20.5220.181.280.1080.1041.17
Eductn31.0190.3512.19 **0.0510.0212.18 **
Eductn41.8190.6273.60 ***0.1320.2395.36 ***
AGE−0.302−0.07−4.34 ***−0.7240.281−2.04 **
AGE20.0030.0013.95 ***0.0160.3870.73
MS−0.111−0.038−0.350.3610.4581.39
Financial Characteristics
INTR−1.545−0.845−3.44 ***−937.96297.93−2.50 ***
GP0.2160.1923.01 ***1414.55262.285.39 ***
PBP−0.314−0.026−4.03 ***−829.02965.41−1.27
APC−0.0920.182−3.04 ***0.191590.8115.62 ***
MSAV0.0330.01140.14−518.82310.14−1.67 *
FREQ0.0590.2320.9120.1530.0502.075 **
OFY−0.4−0.155−1.73 *458.98239.241.92 *
RIS1.0770.39394.95 ***1366.53264.45.17 ***
General Farming Characteristics
EXT0.1480.0513.96 ***−35.98237.7−0.95
EXP−0.074−0.026−2.24 **1.0270.1646.17 ***
OPC0.0010.000024.84 ***0.0400.0084.81 ***
HFA1.4080.4854.53 ***1577.68310.465.08 ***
MFA0.3580.1241.174.7531.2576.38 ***
DIS0.0070.00250.93−0.0920.182−1.09
LN0.1360.043618.45 ***561.21125.834.46 ***
NOF−0.250.172−0.6720.4350.1384.32 ***
dy/dx = marginal effects estimated at the mean. Note: * significant at 10%; ** significant at 5% and *** significant at 1% levels of significance.
Table 5. Summary of findings.
VariableDeterminants of Borrowing
(Probit)
Determinants of Microcredit Size (Tobit)
Demographic Determinants
Secondary educationpositivepositive
Tertiary educationpositivepositive
AgePositive to negativepositive
Financial/Institutional Determinants
Interest ratenegativenegative
Payback periodpositivepositive
Application and processing chargesnegativepositive
Savingsno effectnegative
Frequency of borrowingno effectpositive
Off-farm incomenegativepositive
Microfinance risk perceptionpositivepositive
General Farming Characteristics/Determinants
Extension visitspositiveno effect
Farming experiencenegativepositive
Operation expensespositivepositive
Household farming assetsPositivepositive
Membership to farmers associationsno effectPositive
Land sizepositivePositive
Nature of farmingno effect positive
Disclaimer/Publisher’s Note: The statements, opinions and data contained in all publications are solely those of the individual author(s) and contributor(s) and not of MDPI and/or the editor(s). MDPI and/or the editor(s) disclaim responsibility for any injury to people or property resulting from any ideas, methods, instructions or products referred to in the content.

