Article

Impact of Urban Form in the Yangtze River Delta of China on the Spatiotemporal Evolution of Carbon Emissions from Transportation

1
School of Transportation, Shandong University of Science and Technology, Qingdao 266590, China
2
International Cooperation Center of National Development and Reform Commission, Beijing 100038, China
*
Author to whom correspondence should be addressed.
Sustainability 2024, 16(22), 9678; https://doi.org/10.3390/su16229678
Submission received: 8 October 2024 / Revised: 1 November 2024 / Accepted: 5 November 2024 / Published: 6 November 2024

Abstract

The impact of urban form on carbon emissions has become a crucial issue for sustainable socioeconomic development and the advancement of low-carbon cities. Transportation is a significant source of urban carbon emissions, highlighting the need for comprehensive research to aid China in achieving its carbon peak and neutrality goals. Currently, there is a lack of quantitative studies exploring the effects of urban form on transportation-related carbon emissions. This paper seeks to quantify the effect of urban form on the spatial and temporal patterns of transportation carbon emissions, utilizing panel data from 27 cities in the Yangtze River Delta (YRD) region of China, covering the years 2000 to 2020. First, CO2 emissions from transportation are estimated following IPCC guidelines, with Moran’s I utilized to analyze spatial autocorrelation. Next, urban form indicators are quantified based on landscape ecology theory. Finally, econometric models are employed for regression analysis of the panel data. The findings reveal that urban complexity, compactness, and expansion influence transportation carbon emissions to varying degrees, with urban expansion and complexity associated with increased emissions, while compactness contributes to their reduction. This study offers theoretical support and a scientific basis for low-carbon urban spatial planning and development, underscoring the importance of urban form in emissions reduction strategies.

1. Introduction

CO2 is the primary greenhouse gas emitted by human activities and is recognized as a significant contributor to global warming [1]. Cities, recognized as major centers of human activity and energy consumption, are significant sources of carbon emissions [2]. Although only 2% of the world’s land area is occupied by cities, 75% of global carbon emissions are attributed to them [3]. Since 1978, China’s urbanization level has steadily increased from 17.92% to 63.89% in 2020, with projections suggesting it will surpass 80% by 2050 [4]. As urbanization accelerates, urban energy consumption rises steadily, leading to an expansion of carbon sources while severely constraining carbon sinks, which results in substantial increases in urban carbon emissions. Changes in urban form reflect urbanization patterns and resource allocation efficiency [5], affecting carbon emissions through factors such as land use, transportation infrastructure, and building density. Thus, understanding the relationships between different urban dimensions and sustainable development is crucial for achieving the dual carbon goals of reaching carbon peak and attaining carbon neutrality.
Research by relevant scholars has led to the development of various models for estimating carbon emissions and quantifying urban morphology. For instance, Sargent et al. [6] assessed carbon reduction efforts in surrounding areas by integrating CO2 emission inventories with the Lagrangian particle dispersion model. The IPCC method typically utilizes a “top-down” approach, estimating emissions based on carbon sources, which effectively simulates regional carbon emissions [7]. Utilizing IPCC methodologies for estimating transportation carbon emissions offers significant advantages, including standardized guidelines that ensure comparability across regions and time periods crucial for effective climate policy evaluation. The incorporation of comprehensive emission factors and activity data allows precise assessments of emissions from various transport modes, facilitating targeted interventions and sustainable policies. Additionally, the scientific rigor of IPCC methodologies enhances the credibility of emissions estimates, fostering public trust and stakeholder engagement. Adherence to these guidelines also promotes transparency and accountability in national greenhouse gas inventories, aligning with international agreements like the Paris Accord. Overall, IPCC methodologies improve the accuracy and reliability of transportation emissions data, supporting effective policy development. Sun et al. [8] utilized the IPCC method to calculate transportation carbon emissions for 30 provincial capitals in China, developing a comprehensive assessment system for transportation-related carbon emissions. While numerous factors influence carbon emissions, including industrial production, transportation, and fossil fuel combustion, the spatial evolution of urban sprawl—specifically, changes in urban morphology—remains a particularly significant influencing factor [9].
Clifton et al. [10] defined urban morphology from various perspectives, including ecological landscape patterns, transportation, and urban design. Fang et al. [11] integrated human–environment relationships, defining urban morphology based on population distribution and urban characteristics. Tao et al. [12] addressed this issue by examining land use structure and urban landscape features. Although a clear definition remains elusive in academia, urban morphology is widely studied due to its crucial role in sustainable urban development and carbon reduction. Research by Sweeney [13] found that compact cities contribute to reducing energy-related carbon emissions. Similar studies by Ou and Lee [14,15] indicated that compact, multi-nodal development patterns are associated with lower CO2 emissions. Resch et al. [16] found that compact residential patterns correlate with lower emissions and increased infrastructure efficiency. The development of compact cities has emerged as a widely accepted low-carbon urban model [17]. Yin et al. [18] identified a U-shaped relationship between urban compactness and carbon emissions among 281 Chinese cities.
Urban structure is inherently three-dimensional, encompassing horizontal, vertical, and temporal dimensions. To provide adequate living space, urban structures tend to develop vertically rather than expand horizontally [19]. Berardi’s research [20] found that buildings of varying heights not only alter the heterogeneity of urban landscapes and vertical roughness but also significantly affect energy consumption and CO2 emissions in cities. Falahatkar and Rezaei [21] indicated that irregular, complex, and fragmented urban morphological structures positively influence urban carbon emissions. Shi et al. [22] suggested that irregular urban forms contribute to increased CO2 emissions due to longer travel distances. Chen et al.’s case study [23] of 232 cities in China demonstrated that multi-nodal urban development can alleviate traffic pressure while enhancing carbon efficiency, making it particularly suitable for densely populated areas.
The literature clearly demonstrates the significant impact of urban morphology on carbon emissions, indicating that reductions in CO2 emissions can potentially be achieved through effective planning of urban spatial structures. However, from a transportation perspective, the intrinsic relationship between urban morphology and transportation-related carbon emissions requires further exploration, particularly because existing research often emphasizes two-dimensional aspects while neglecting the vertical dimension of urban buildings. The Yangtze River Delta (YRD), as China’s most economically active and urbanized region, confronts environmental issues and traffic congestion alongside rapid economic development, making it a critical area for achieving China’s “dual carbon” goals [24].
In summary, this paper investigates 27 cities in the YRD to analyze the impact of urban morphology on the spatiotemporal evolution of transportation carbon emissions. First, the paper estimates transportation carbon emissions related to energy for these cities using Intergovernmental Panel on Climate Change (IPCC) carbon emission factors, followed by cluster analysis and spatial autocorrelation analysis. The scope of transportation carbon emission (TCE) estimation in this study mainly includes carbon emissions from direct energy consumption of urban road transportation as well as energy consumption from rail, water, aviation, pipeline, and intermodal transportation. The results from the Moran’s I index indicate that transportation-related CO2 emissions in these cities exhibit spatial dependence. Second, the paper applies landscape ecology theory and employs indicator measurement methods to construct an econometric model that quantifies relevant indicators of urban morphology. The landscape pattern index represents characteristics such as complexity, compactness, and urban expansion. Using ArcGIS 10.7 and Fragstats 4.3 software, the relevant research data were obtained. Finally, a panel regression model is used to estimate the coefficients of various indicators, with the aim of analyzing how urban morphology in the YRD influences transportation carbon emissions.

2. Study Area

Built-up regions, characterized by rapid urban development and expansion, are particularly suitable for studying the relationship between urban morphological structure and carbon emissions. This paper selects 27 cities in the YRD as the research area, based on the “Outline of the Development Plan for the Integration of the YRD Region”, issued by the National Development and Reform Commission and the Ministry of Transport of China. The study aims to investigate how changes in urban morphology affect the spatiotemporal evolution of transportation carbon emissions. The spatial distribution of the research area is illustrated in Figure 1.
While urban development can enhance residents’ income and living standards, it also leads to increased energy consumption and numerous environmental challenges. Consequently, identifying the key factors influencing CO2 emissions in rapidly developing cities is essential for achieving carbon intensity targets and mitigating climate change impacts. Additionally, a deeper understanding of this relationship is necessary to support policymakers and urban planners in managing carbon emissions while promoting sustainable urban development.

3. Materials and Methods

3.1. Estimating Carbon Emissions from Transportation

This study aims to quantitatively estimate the impact of spatial structure in the YRD region of China on the spatiotemporal evolution of transportation CO2 emissions, which requires the establishment of a CO2 emissions model. The estimated emissions primarily encompass those related to eight types of energy, with data sourced from the “China Energy Statistical Yearbook”. Carbon emission factors for various energy sources are calculated based on the “IPCC National Greenhouse Gas Inventory Guidelines”, using the following formula:
T C E = i = 1 6 E i K i = i = 1 9 E i × A L H i × 10 9 × A H C i × R i × 10 3 × 44 12
where T C E denotes the regional transportation carbon emissions, i denotes the types of energy required by the transportation sector, and the terminal consumption of various modes of transportation mainly includes raw coal, coke, gasoline, kerosene, diesel fuel, fuel oil, liquefied petroleum gas (LPG), and natural gas. E i denotes the consumption of energy type i , A L H i denotes the average low-level heat generation of energy type i , A H C i denotes the carbon content per unit calorific value of energy type i , R i denotes the carbon oxidation rate of energy type i , and K i denotes the carbon emission factor of energy type i . The statistical results of energy carbon emission factors, as shown in Table 1.
Data on carbon emissions from transportation in the 27 cities of China’s YRD were obtained. Additionally, to analyze whether spatial autocorrelation exists in transportation-related CO2 emissions across these cities, Moran’s I was employed as the primary indicator for exploring this relationship. The calculation formula [25] is as follows:
M o r a n s I = i = 1 n j = 1 n ω i j ( C E i C E ¯ E ¯ ) ( C E j C E ¯ ) S 2 i = 1 n j = 1 n ω i j
where n is the total number of cities, C E i and C E j represent the carbon emissions of cities i and j , respectively, w i j denotes the spatial weights, C E ¯ is the average carbon emissions, and S 2 is the sample variance.

3.2. Analysis of the Spatial Structure of Urban Form

To characterize the spatiotemporal dynamic features of urban forms in the 27 cities of the YRD in China, a dataset from scholar Sun Zhongchang was utilized to identify and extract urban built-up area boundaries for the years 2000, 2010, and 2020. This dataset employed Sentinel data [26] from the Google Earth Engine cloud platform and proposed a rapid extraction algorithm for impervious surfaces, referencing the United Nations’ definition standards for urban built-up areas. The result was a standardized urban built-up area dataset for Chinese cities. Using ArcGIS 10.7 software, a total of 81 scenes were extracted from the dataset, with 27 scenes corresponding to each of the years 2000, 2010, and 2020.
Utilizing the aforementioned remote sensing imagery dataset and the technical support of ArcGIS 10.7, elevation data from a 250 m digital elevation model (DEM) were employed as the background to delineate the boundaries of the urban built-up area and to add polygon attributes to the imagery, thereby generating a digital map. The vector digital map was subsequently edited and cropped to enhance clarity. Figure 2 illustrates the urban sprawl footprints of four representative cities in different regions of the YRD in China.
Urban morphology influences the economic functions and efficiency of urban environments and has social implications, ultimately impacting the design and regulation of urban space use. Metric measurement methods are among the most popular approaches for assessing urban morphology, effectively revealing the internal characteristics of urban spatial forms. Whether analyzed from a single or multiple dimensions, these methods adequately capture the complexity of urban spatial morphology [27]. Building on previous research [28,29,30], we selected 12 landscape pattern metrics to represent changes in urban morphology: Total Area (TA), Patch Density (PD), Landscape Shape Index (LSI), Patch Cohesion Index (COHESION), Aggregation Index (AI), Maximum Patch Index (LPI), Area-Weighted Mean Shape Index (SHAPE_AM), Area-Weighted Mean Patch Fractal Dimension Index (FRAC_AM), Perimeter–Area Ratio Distribution (PARA_MN), Percent of Similar Adjacent (PLADJ), Road Network Density (RD), and Traffic Coupling Degree (CF).
Total Area (TA) represents the sum of the urban built-up area across all patches of a given type, helping to reveal the sprawl process of the built-up area in a specific city. Patch Density (PD) measures the density of patches in the landscape, indicating overall heterogeneity and fragmentation, as well as the degree of fragmentation of a specific type per unit area. The LSI quantifies the ratio of the landscape’s perimeter to its area. The Cohesion Index (COHESION) evaluates the physical connectivity of urban land patches, with greater cohesion resulting from clustered patch types that enhance physical connections. The Aggregation Index (AI) is calculated as an area-weighted average class aggregation index. The Maximum Patch Index (LPI) measures the area of the largest patch of a specific type relative to the total landscape area, indicating that type’s dominance within the landscape. The SHAPE_AM assesses landscape structure across spatial scales, reflecting complexity based on urban patch size. The FRAC_AM indicates the irregularity of urban patch shapes, where a higher fractal dimension suggests more irregular forms. Lastly, the PARA_MN provides a straightforward measure of shape complexity. Percent of Similar Adjacent (PLADJ) measures the degree of aggregation in an urban landscape on an absolute scale. Road Network Density (RD) is the ratio of major urban roads to built-up area, assessing the level of urban road development. Finally, the Traffic Coupling Degree (CF) is the ratio of the area of major road buffers to the built-up area, reflecting the extent of interaction between urban roads and built-up regions.
Using Fragstats 4.3 [31], specialized software for landscape ecology, ten spatial pattern metrics were computed. Road Network Density (RD) and Traffic Coupling Degree (CF) were computed using ArcGIS 10.7. The resulting metric data table is presented in Table 2.

3.3. Econometric Modeling

This study employed a panel data model covering the period from 2000 to 2020. Panel data typically allow for better control of individual heterogeneity and help mitigate the effects of multicollinearity among variables, thereby increasing the degrees of freedom.
This study aims to quantitatively estimate the impact of urban morphology in the region of China’s YRD on the spatiotemporal evolution of transportation CO2 emissions, which necessitates the construction of a CO2 model. The specific equation for the model is as follows:
T C E i t = α i + Z i t φ + β i + δ i t
where T C E i t is the CO2 emissions of the city i in year t , α i is a scalar, φ is a vector of parameters, β i denotes individual effects capturing the heterogeneous characteristics of each city, and δ i t denotes random errors. Z i t is a vector of exogenous variables including TA, LPI, SHAPE_AM, FRAC_AM, PARA_MN, PLADJ, COHESION, AI, LSI, CONTIG, RD, and CF.
To address the issue of model stationarity, this study utilized the Levin, Lin, and Chu (LLC) panel unit root test, which provides greater power than standard tests for both time series and cross-sectional data [32]. The LLC test is typically based on the following autoregressive model [33]:
Δ y i t = ρ y i t 1 + j = 1 k i r j i Δ y i t 1 + Z i t φ + δ i t
where Z i t represents the column vector of exogenous (deterministic) variables, and φ denotes the column vector of regression coefficients. The null and alternative hypotheses can be expressed as follows: H 1 : ρ < 0 and H 0 : ρ = 0 .

4. Results and Discussion

4.1. Analysis of Energy-Related CO2 Emissions from Transportation

Using Equation (1), the energy-related transportation CO2 emissions for the 27 cities in the YRD region of China were estimated for the selected years. Following this estimation, additional analyses of emission trends and spatial clustering were performed. The results of the carbon emissions clustering are shown in Figure 3.
Figure 3 displays the clustering results of carbon emissions for the selected years. Throughout the study period, CO2 emissions from cities in the research area increased. The eastern part of the YRD in China shows a high–high clustered distribution, indicating an elevated level of carbon emissions, while the western part shows a low–low (LL) clustered distribution, reflecting a lower level of carbon emissions. Overall, a correlation appears to exist between energy-related transportation CO2 emissions and the region’s economic development level. The spatial distribution of CO2 emissions in the YRD region of China reveals a “high in the east and low in the west” pattern, with no significant spatial distribution characteristics noted between the northern and southern regions.
To further examine whether transportation carbon emissions display spatial clustering characteristics, the Moran’s I index was employed, and a corresponding Moran’s I index map was generated.
Figure 4 displays a scatter plot of the global Moran’s I index for CO2 emissions across the 27 cities in the YRD region of China, highlighting the local spatial correlation and clustering of transportation CO2 emissions. A noticeable upward trend in autocorrelation is evident, with Moran’s I rising from 0.15 in 2000 to 0.24 in 2020. The distribution of the Moran index distinctly reveals the spatial clustering trend of transportation CO2 emissions among the cities, indicating that the data align with the requirements for exploring the spatiotemporal distribution patterns of CO2 emissions and highlights the temporal and spatial clustering characteristics of these emissions.

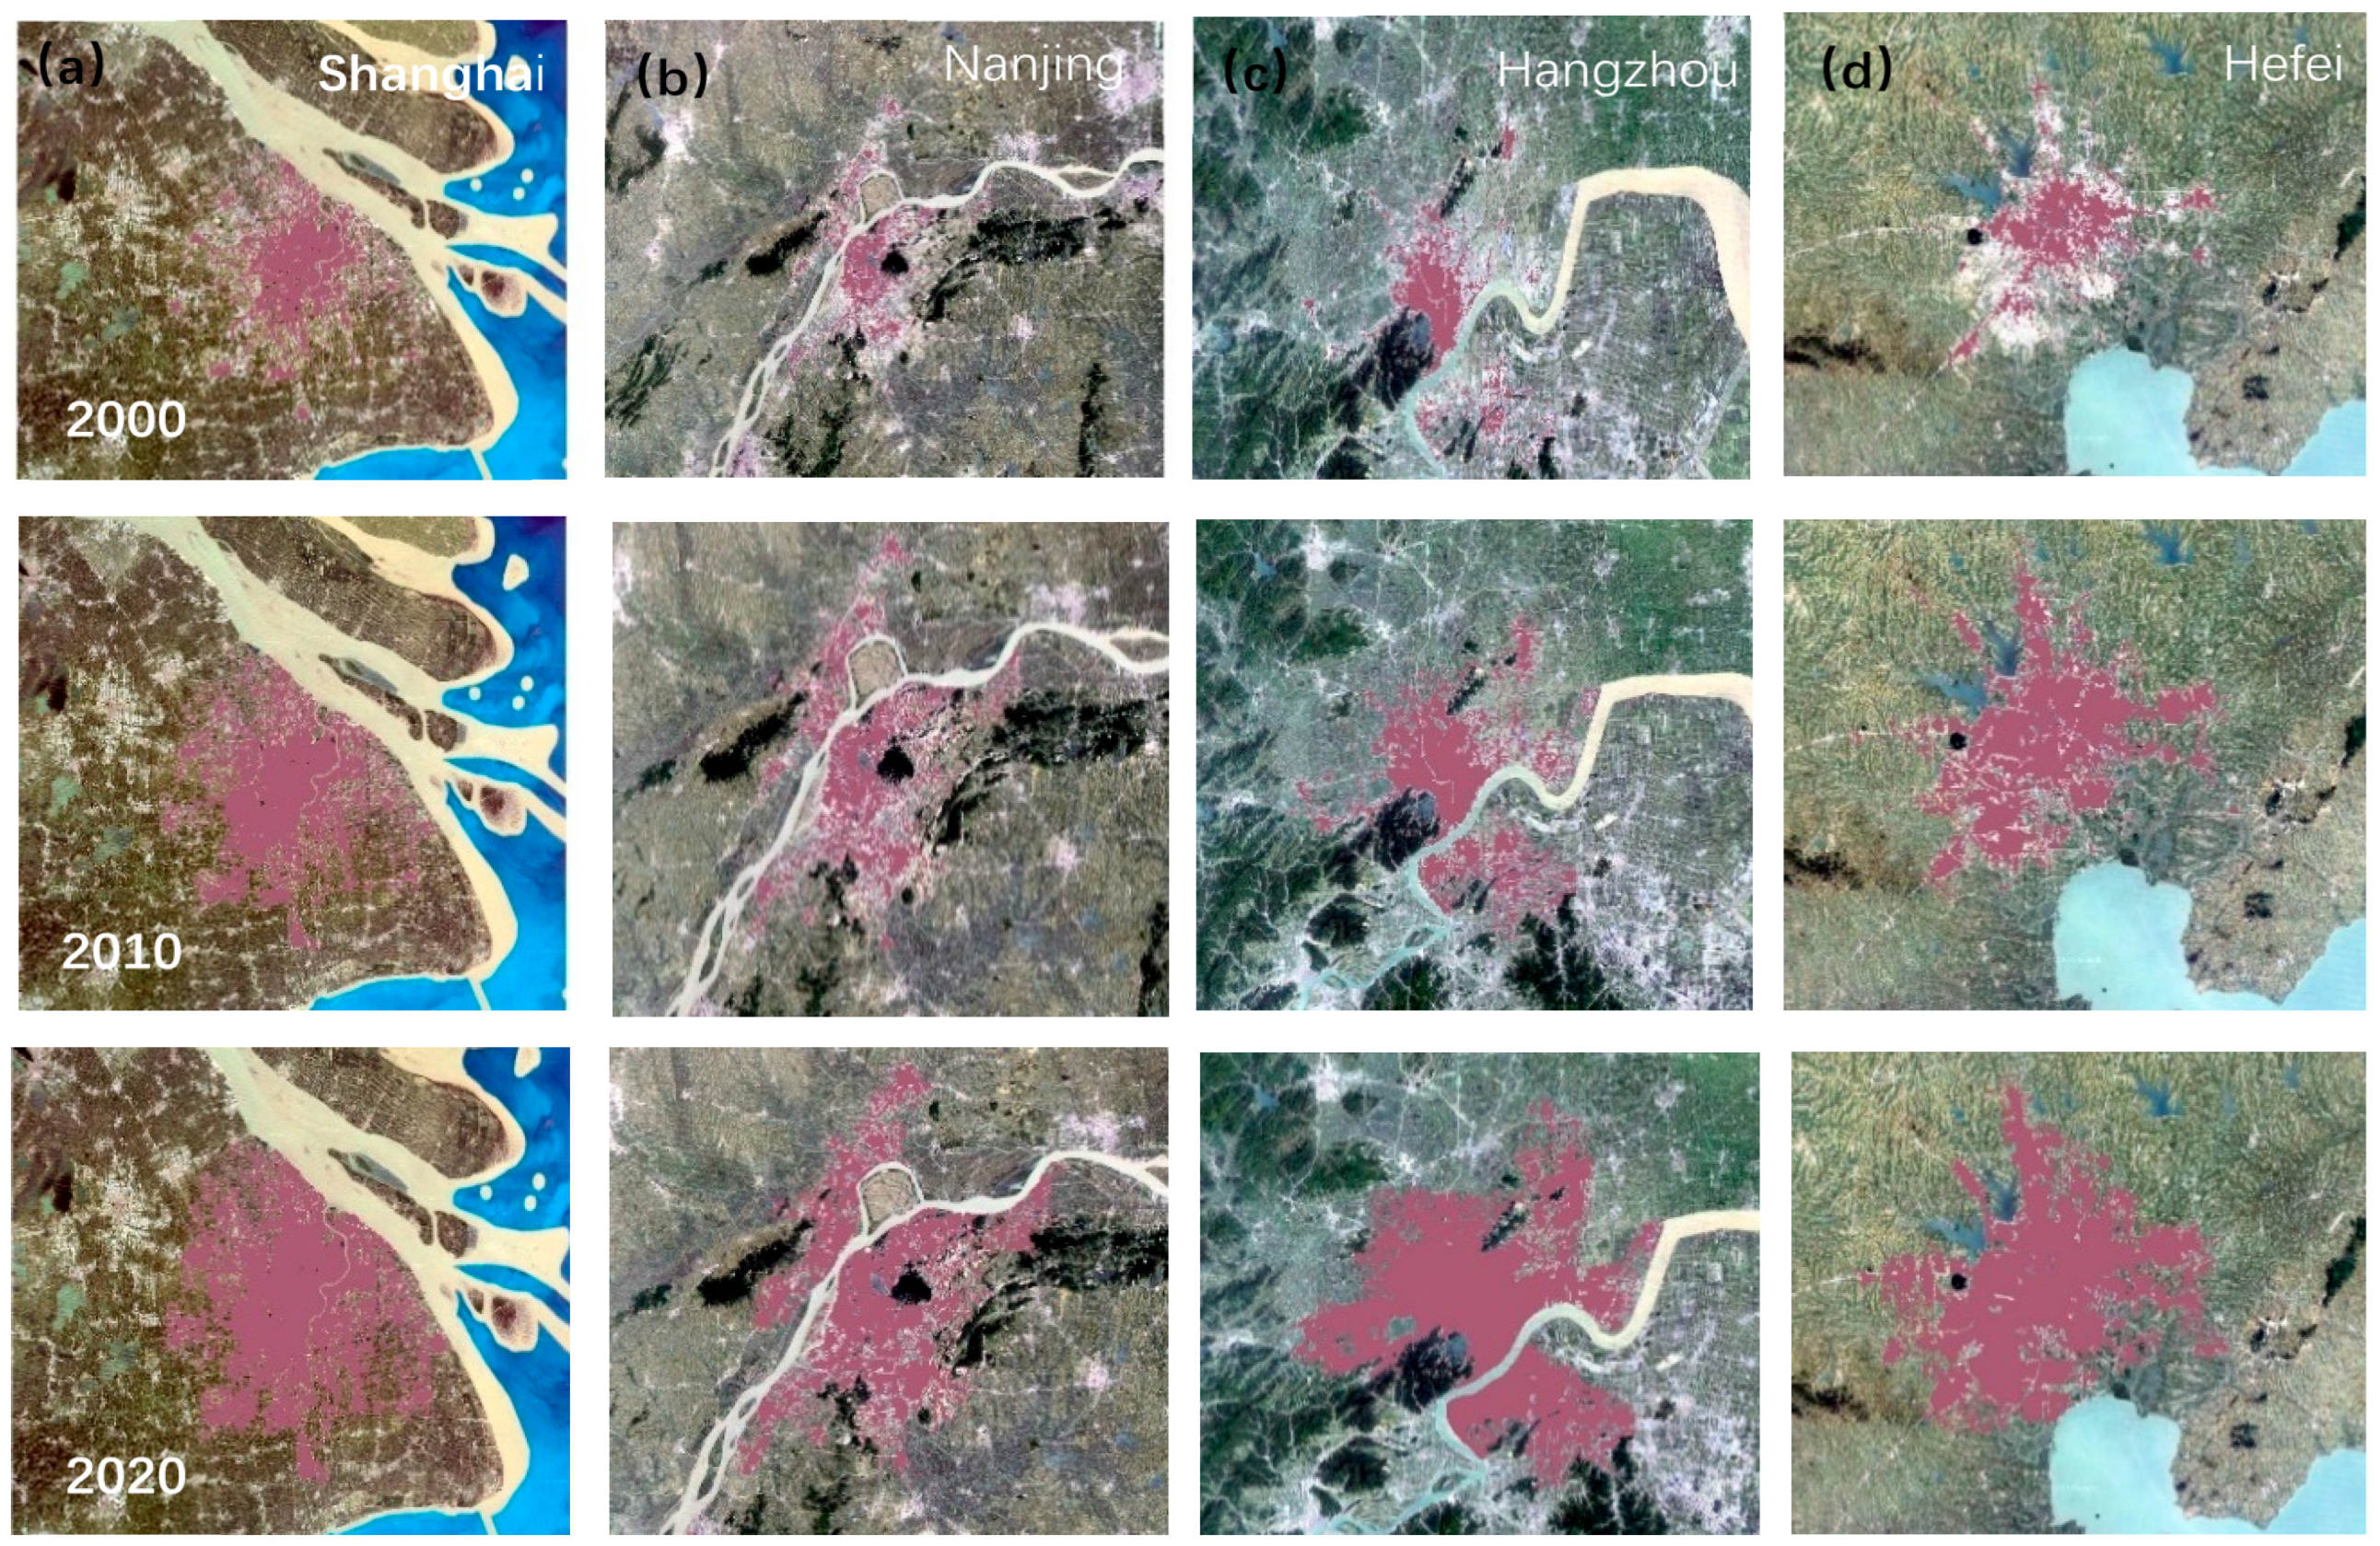
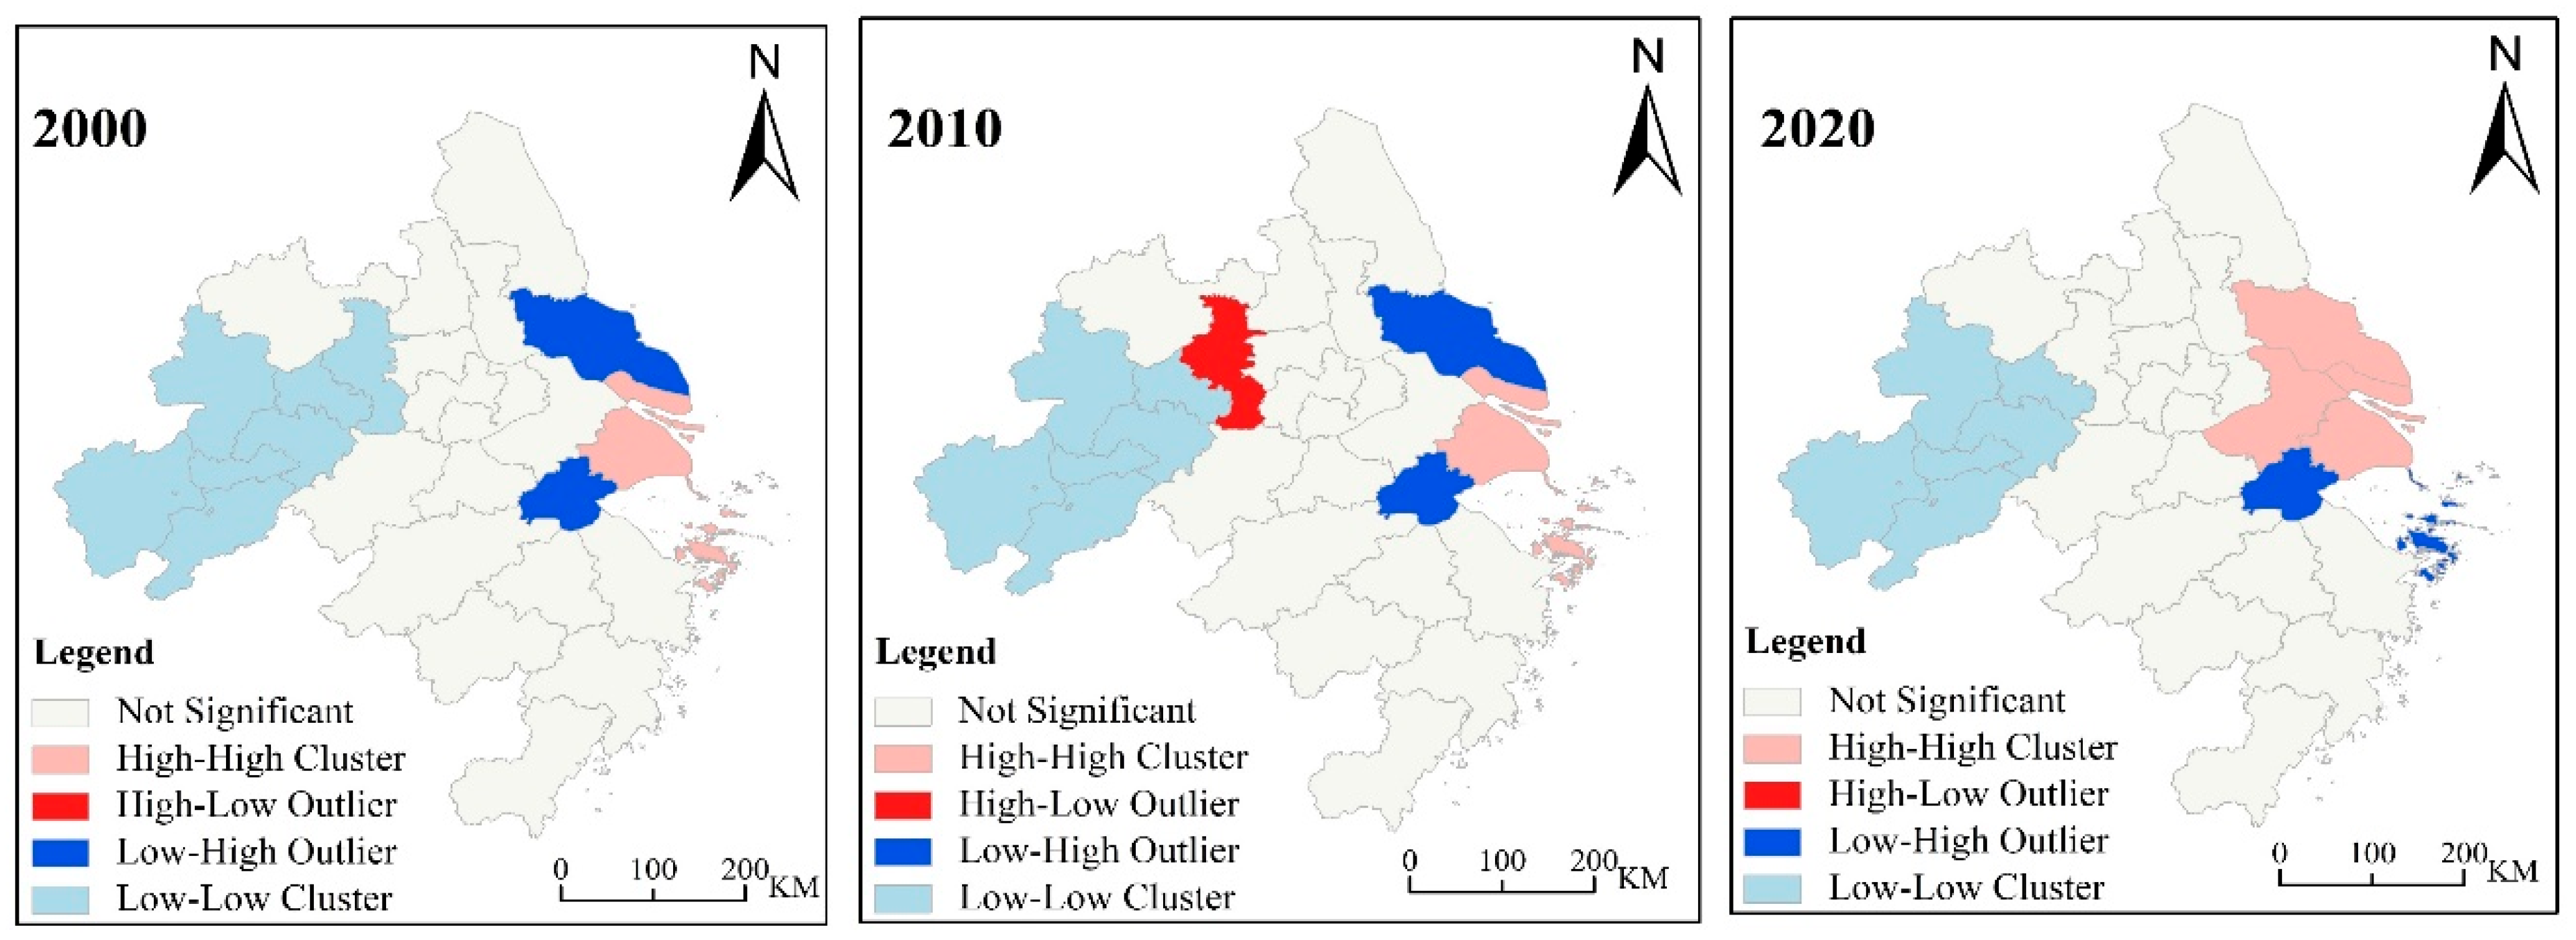
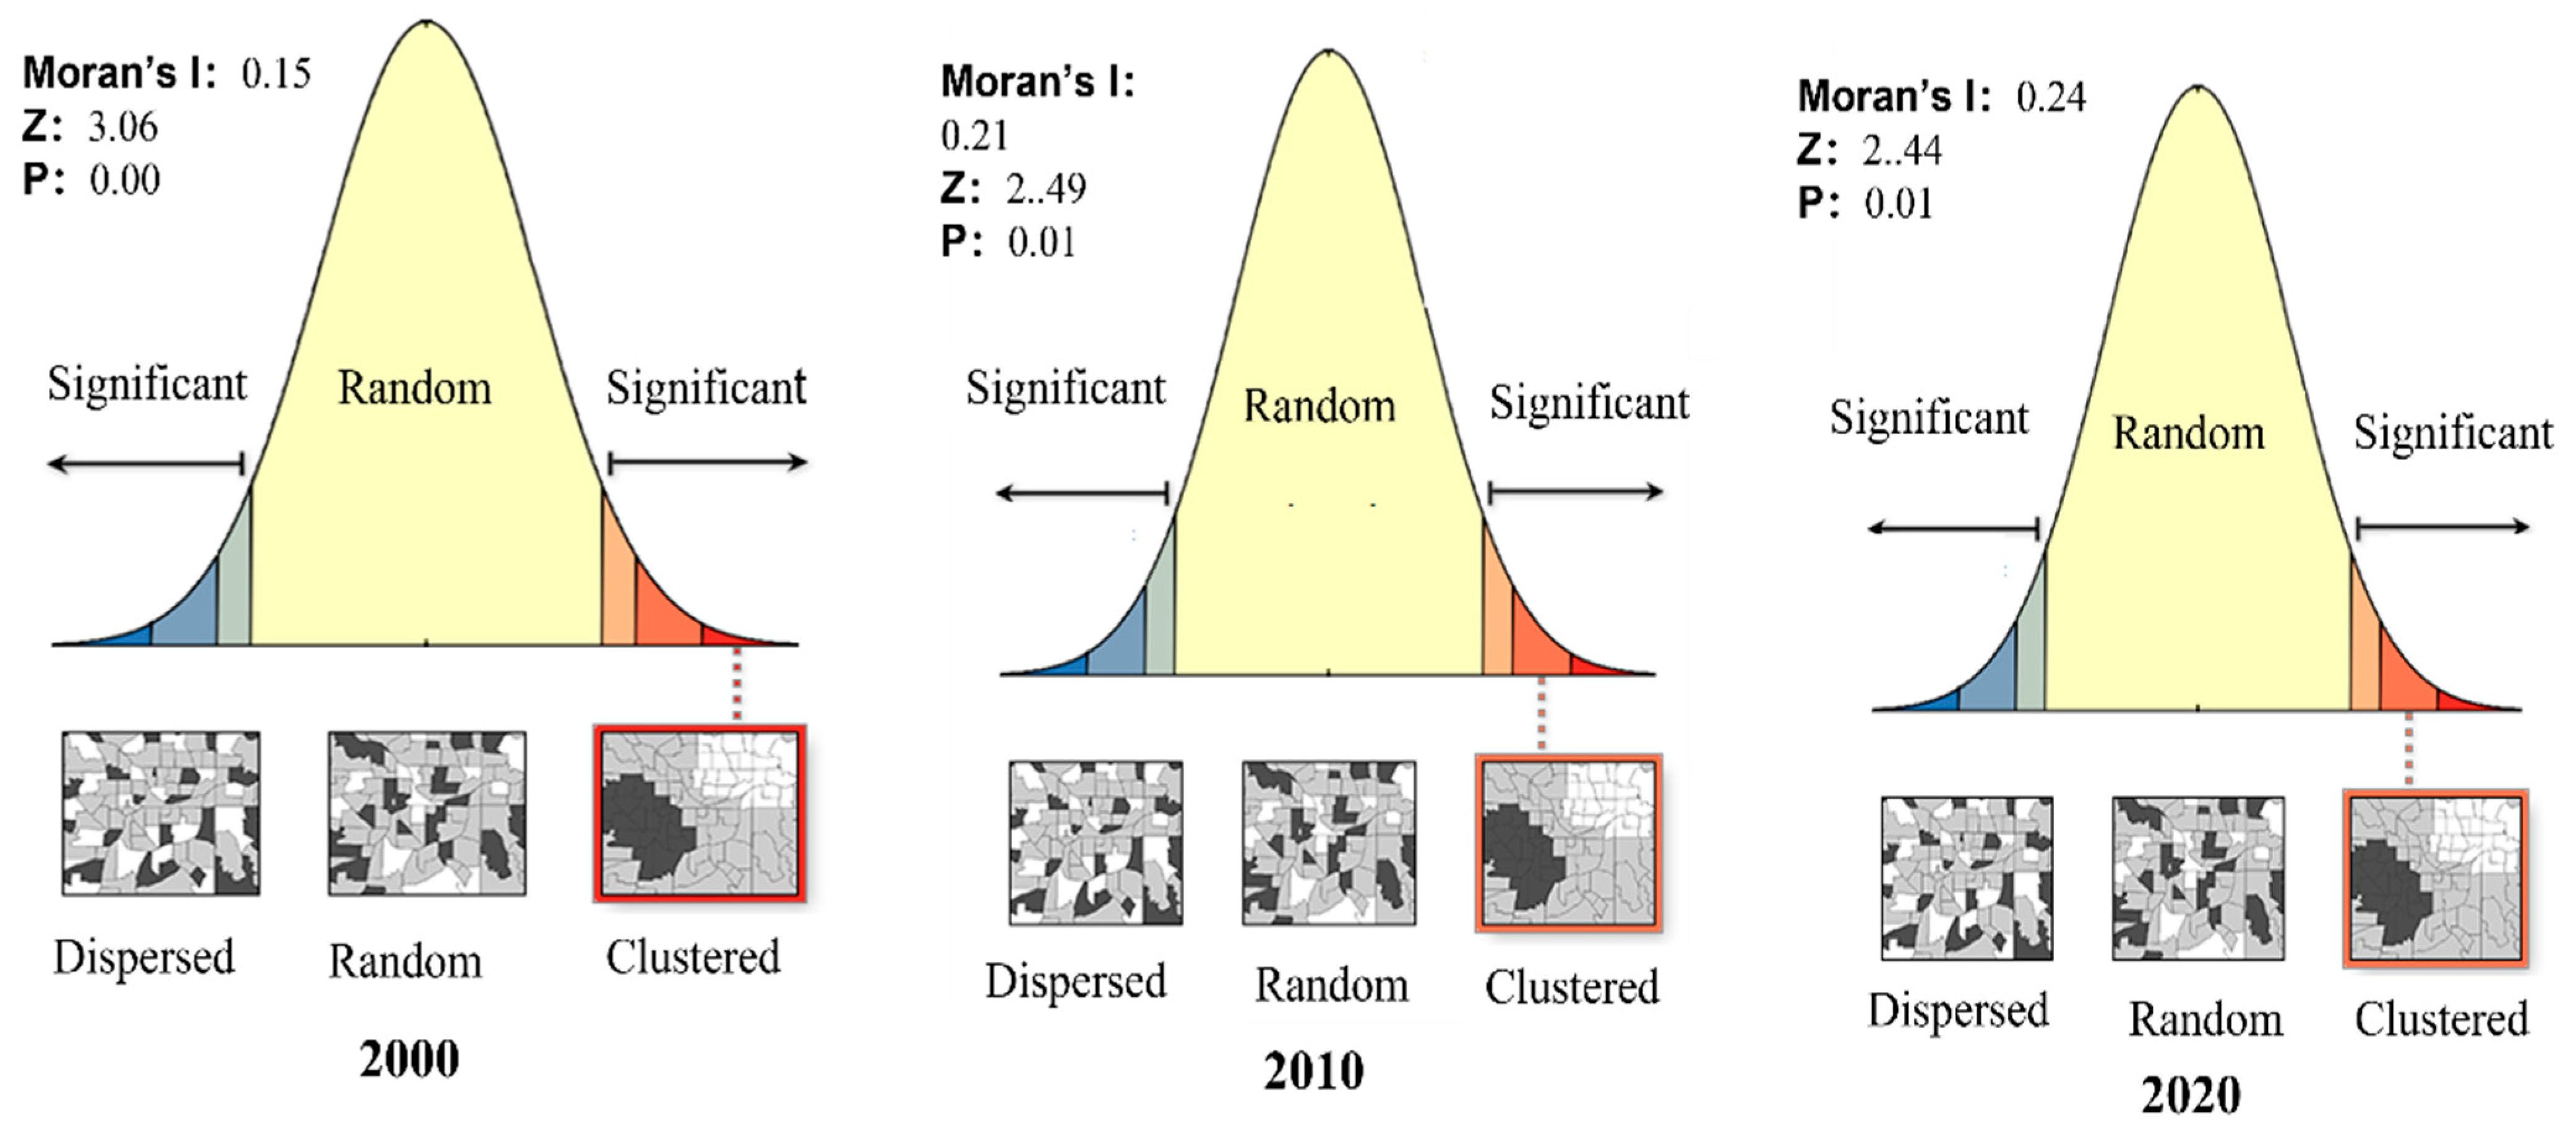
4.2. Analysis of Urban Form

Using ArcGIS 10.7 and Excel 2016, the built-up area data were analyzed, and the estimated values for each city in the selected years are presented in Table 3.
As shown in Table 3, the built-up areas of various cities expanded rapidly between 2000 and 2020. In 2000, Chizhou had the smallest built-up area at 5.04 km2, while Shanghai had the largest at 771.53 km2. By 2020, Chizhou’s built-up area had increased to 36.09 km2, and Shanghai’s had grown to 1877.62 km2. The data indicate that cities with larger economic scales and higher income levels have significantly greater built-up areas compared to their less developed counterparts.
To clearly illustrate the changes in urban morphology of the 27 cities in the YRD region of China from 2000 to 2020, Figure 5 depicts the spatial patterns of urban built-up area expansion during this period.
Figure 5 illustrates the dynamic spread of built-up areas in 2000, 2010, and 2020. The red areas represent the built-up zones in 2000, the yellow areas indicate expansion from 2000 to 2010, and the blue areas depict growth from 2010 to 2020. Utilizing built-up area data from the 27 cities in the YRD region of China and employing ArcGIS 10.7, along with pre-identified urban sprawl indices and remote sensing land cover metrics, a series of urban morphology indicators (TA, PD, LSI, PLADJ, SHAPE_AM, FRAC_AM, PARA_MN, COHESION, AI, LPI, RD, and CF) were calculated for each city during the study phases using Fragstats 4.3.

4.3. Estimation Results of the Panel Model

Before estimating the parameters using panel data, it is essential to test for multicollinearity among the regression models. Table 4 presents the correlation results among the variables included in this study. Due to space limitations, the twelve indicators—PD, LSI, PLADJ, COHESION, AI, TA, LPI, SHAPE_AM, FRAC_AM, PARA_MN, RD, and CF—are sequentially labeled as V1 through V12.
Table 4 indicates that there is no significant correlation among the variables. This suggests that serious multicollinearity issues among the independent variables are absent, allowing us to proceed with the panel data analysis. Relevant details about the model are presented in Table 5.
R2 and the p-value are critical indicators for evaluating the model’s performance. An R2 value closer to 1 signifies greater precision, while a p-value less than 0.001 indicates statistical significance. As shown in Table 5, the model meets the testing requirements and is deemed valid for use. The results of the panel data analysis for the model are displayed in Table 6.
Table 6 presents the coefficients estimated from the panel analysis. The results again reveal a number of links between urban form and transportation-related CO2 emissions for the 27 cities in the YRD region of China, confirming that the relationship between urban form and CO2 emissions at the city level in the Chizhou region is evident. The data in Table 6 indicate that indicators with a significance level of less than 5% (TA, PD, LSI, PLADJ, AI, SHAPE_AM, FRAC_AM, PARA_MN, and RD) are statistically significant in their influence on the relationship between urban form and transportation CO2 emissions.
During the research period, transportation carbon emissions in the 27 cities in the YRD region of China exhibited significant heterogeneity in their spatiotemporal distribution. Temporally, CO2 emissions generally showed an upward trend from 2000 to 2020, characterized by notable differences in carbon emission intensity. Spatially, transportation CO2 emissions were higher in the east and lower in the west, with a relatively balanced distribution between the north and south. These changes can primarily be attributed to the rapid economic development in China over the past 20 years, which has driven the increase in carbon emissions.
Model I examines the impact of changes in urban form on the spatial and temporal evolution of transportation CO2 emissions in 27 cities in the YRD region of China. The coefficient for Total Area (TA) is positive, and the estimated results from regression Model I aligns with expectations. Urbanization drives regional coordinated development, expands domestic demand, promotes industrial upgrading, and accelerates urbanization, thereby benefiting industrial development, economic growth, and living standards. However, excessive urbanization can result in environmental issues, including pollution and traffic congestion.
Firstly, the expansion of urban areas reduces vegetation and carbon sink capacity, potentially harming carbon storage and causing environmental changes, including urban heat island effects. Secondly, rapid urbanization in the YRD region of China increases energy demand and exacerbates traffic congestion, resulting in significant CO2 emissions.
The eight additional landscape indicators used in this study characterize two key aspects of urban form: complexity and compactness.
Urban form complexity [34] measures the irregularity or “jaggedness” of urban boundary shapes. Generally, higher complexity values indicate more irregular urban landscapes. Urban areas with lower compactness tend to exhibit highly complex and irregular boundaries, which can increase commuting times and distances. As shown in Table 6, PLADJ, SHAPE_AM, PARA_MN, and RD demonstrate significant positive correlations with transportation CO2 emissions in the 27 cities of the YRD in China. PLADJ measures urban landscape aggregation, while SHAPE_AM and PARA_MN reflect landscape structure based on patch complexity. RD indicates the ratio of major road length to built-up area, serving as a proxy for road development levels. The findings suggest that CO2 emissions rise with changes in urban landscape patterns, characterized by more complex and irregular spatial configurations and road networks. This trend may arise from irregular urban landscapes increasing trips between residential and work areas, significantly elevating car travel frequency and duration. Unplanned urban growth increases long-distance transport and CO2 emissions [35]. In contrast, more structured urban development and associated road improvements enhance land use efficiency, reducing commuting time and distance. This approach has proven effective in lowering carbon emissions [36].
Urban compactness refers to the extent of aggregation and connectivity within urban landscapes. Higher values of urban continuity indicate greater clustering, which is expected to shorten commuting times and distances, alleviate traffic congestion, and improve carbon efficiency [23]. As shown in Table 6, PD, LSI, AI, and FRAC_AM exhibit significant negative correlations with transportation CO2 emissions in the 27 cities of the YRD in China. These findings suggest that high levels of urban compactness and continuity contribute to reduced transportation CO2 emissions, aligning with studies by Bereitschaft and Debbage [37], which found that more aggregated and connected urban areas experience significantly lower emissions. Other research indicates that increased connectivity within urban built areas correlates with reduced private car usage, shorter travel distances, enhanced urban efficiency, higher land use intensity, and lower energy consumption.

5. Conclusions and Policy Implications

5.1. Conclusions

Research quantifying the impact of urban form on CO2 emissions is currently limited. To address this gap, this paper employs panel data, remote sensing data, and road data from 27 cities in the YRD region of China, covering the period from 2000 to 2020, to investigate the effects of urban form on the spatiotemporal evolution of transportation-related CO2 emissions.
In this study, we used remote sensing images to extract the built-up area of each city and obtained road data from the official website of OMS to calculate the transportation CO2 emissions of 27 cities in China’s YRD from 2000 to 2020. We selected and quantified urban-form-related indicators based on previous research, employing spatial (landscape) metrics for a categorical analysis of the built-up areas. Our findings indicate an overall upward trend in CO2 emissions across all cities during the study period, with variations in carbon emission intensity. Cluster analysis revealed a spatial distribution of transportation CO2 emissions characterized by “higher levels in the east and lower levels in the west”, with no significant distribution characteristics in the north–south region. Additionally, local Moran’s I analysis indicated a growing trend of spatial autocorrelation (spatial dependence) among the 27 cities.
From 2000 to 2020, urban areas in each city experienced rapid expansion, with notable differences in the characteristics and magnitude of urban form changes. For clearer analysis, 12 indicators related to urban form were initially categorized into three key aspects: urban expansion, urban form complexity, and compactness [38]. Through regression analysis using SPSS 27 software, nine significant indicators were identified. The study found that urban sprawl inevitably accelerated the increase in CO2 emissions. On one hand, the growth in urban areas reduced carbon sinks and increased resource consumption; on the other hand, rapid urbanization led to environmental pollution and traffic congestion, contributing to higher transportation CO2 emissions. Urban form complexity indicators (PLADJ, SHAPE_AM, PARA_MN, and RD) positively impact CO2 emissions, indicating that fragmented or irregular urban areas, often resulting from improper land use, exacerbate transportation CO2 emissions. In contrast, urban compactness indicators (PD, LSI, AI, and FRAC_AM) show a negative correlation with CO2 emissions, suggesting that clustered and continuous urban development patterns help reduce transportation CO2 emissions.
The results suggest that urban compactness is particularly advantageous for rapidly developing cities, as it can mitigate CO2 emissions and foster sustainable urban development. However, in contexts of resource constraints and excessive urban planning, overly high compactness may result in environmental issues such as diminished per capita living space, urban heat island effects, and increased traffic congestion [39].

5.2. Policy Implications

Based on the effects of urban expansion, complexity, and compactness on carbon emissions, this paper presents several policy recommendations to mitigate transportation CO2 emissions in the YRD region of China. The following regional policy suggestions are designed to promote low-carbon urban planning:
First, China must tackle rapid urban expansion through effective urban planning by establishing a scientifically grounded urban spatial structure. In the context of swift urbanization, cities should select appropriate development boundaries based on their developmental stages and existing challenges. To mitigate the impact on transportation CO2 emissions and carbon intensity, decision-makers should also judiciously regulate urban form indicators, including building height, volume, and shape. Consequently, urban planners and decision-makers should approach expansion issues with greater caution and deliberation in their decision-making processes.
Second, Chinese cities should optimize land use strategies to enhance land utilization efficiency. Shape complexity, measured by the perimeter–area ratio, reflects the irregularity of urban boundaries and the porosity of urban landscapes, indicating the mix of urban and non-urban land cover. Research indicates that fragmented or irregular urban areas lead to higher CO2 emissions. Thus, regulating urban development within reasonable limits and minimizing shape complexity can effectively reduce urban CO2 emissions.
Third, the government should enhance land management and establish scientific standards for urban compactness. Compact urban development is widely regarded as a model for low-carbon cities, as maintaining appropriate compactness fosters low carbon emissions within a livable environment. For instance, balancing urban density with water bodies and green spaces allows for the coexistence of regulated urban microclimates and compact cities. Additionally, future urban development should explore alternative urban forms, such as polycentric and strip development. Thus, it is essential for policies to establish reasonable standards for urban compactness to effectively reduce CO2 emissions while mitigating negative consequences of excessive compactness, such as traffic congestion and poor accessibility. This research contributes to the literature on the relationship between urban form and carbon emissions and offers strong support for low-carbon urban development through effective spatial planning.

Author Contributions

Conceptualization, Y.S., B.C. and Q.L.; methodology, Y.S., B.C. and Q.L.; software, B.C.; validation, Y.S., B.C. and Q.L.; formal analysis, Y.S., B.C. and Q.L.; investigation, Y.S.; resources, Y.S. and Q.L.; data curation, B.C.; writing—original draft preparation, Y.S. and B.C.; writing—review and editing, Y.S. and Q.L.; visualization, B.C.; supervision, Y.S.; project administration, Y.S. and Q.L.; funding acquisition, Y.S. and Q.L. All authors have read and agreed to the published version of the manuscript.

Funding

This study was funded by the Natural Science Foundation of Shandong Province (Grant No. ZR2021MG021) and the Youth Innovation Technology Project of Higher School in Shandong Province (Grant No.2021RW030).

Institutional Review Board Statement

Not applicable.

Informed Consent Statement

Not applicable.

Data Availability Statement

No new data were created.

Conflicts of Interest

Author Qingli Li was employed by the International Cooperation Center of National Development and Reform Commission. The remaining authors declare that the research was conducted in the absence of any commercial or financial relationships that could be construed as a potential conflict of interest.

References

  1. Zhang, P.; He, J.; Hong, X.; Zhang, W.; Qin, C.; Pang, B.; Li, Y.; Liu, Y. Carbon sources/sinks analysis of land use changes in China based on data envelopment analysis. J. Clean. Prod. 2018, 204, 702–711. [Google Scholar] [CrossRef]
  2. Zhu, E.; Qi, Q.; Chen, L.; Wu, X. The spatial-temporal patterns and multiple driving mechanisms of carbon emissions in the process of urbanization: A case study in Zhejiang, China. J. Clean. Prod. 2022, 358, 131954. [Google Scholar] [CrossRef]
  3. Shi, F.; Liao, X.; Shen, L.; Meng, C.; Lai, Y. Exploring the spatiotemporal impacts of urban form on CO2 emissions: Evidence and implications from 256 Chinese cities. Environ. Impact Assess. Rev. 2022, 96, 106850. [Google Scholar] [CrossRef]
  4. Zhang, Y.; Liu, Y.; Wang, Y.; Liu, D.; Xia, C.; Wang, Z.; Wang, H.; Liu, Y. Urban expansion simulation towards low-carbon development: A case study of Wuhan, China. Sustain. Cities Soc. 2020, 63, 102455. [Google Scholar] [CrossRef]
  5. Wang, S.; Fang, C.; Wang, Y.; Huang, Y.; Ma, H. Quantifying the relationship between urban development intensity and carbon dioxide emissions using a panel data analysis. Ecol. Indic. 2015, 49, 121–131. [Google Scholar] [CrossRef]
  6. Sargent, M.; Barrera, Y.; Nehrkorn, T.; Hutyra, L.R.; Gately, C.K.; Jones, T.; McKain, K.; Sweeney, C.; Hegarty, J.; Hardiman, B.; et al. Anthropogenic and biogenic co 2 fluxes in the boston urban region. Proc. Natl. Acad. Sci. USA 2018, 115, 7491–7496. [Google Scholar] [CrossRef]
  7. Xu, Q.; Dong, Y.X.; Yang, R.; Zhang, H.O.; Wang, C.J.; Du, Z.W. Temporal and spatial differences in carbon emissions in the pearl river delta based on multi-resolution emission inventory modeling. J. Clean. Prod. 2019, 214, 615–622. [Google Scholar] [CrossRef]
  8. Sun, Y.; Yang, Y.; Liu, S.; Li, Q. Research on transportation carbon emission peak prediction and judgment system in China. Sustainability 2023, 15, 14880. [Google Scholar] [CrossRef]
  9. Wang, S.; Fang, C.; Ma, H.; Wang, Y.; Qin, J. Spatial differences and multi-mechanism of carbon footprint based on gwr model in provincial China. J. Geogr. Sci. 2014, 24, 612–630. [Google Scholar] [CrossRef]
  10. Clifton, K.; Ewing, R.; Knaap, G.J.; Song, Y. Quantitative analysis of urban form: A multidisciplinary review. J. Urban. Int. Res. Placemak. Urban Sustain. 2008, 1, 17–45. [Google Scholar] [CrossRef]
  11. Fang, C.; Wang, S.; Li, G. Changing urban forms and carbon dioxide emissions in China: A case study of 30 provincial capital cities. Appl. Energy 2015, 158, 519–531. [Google Scholar] [CrossRef]
  12. Tao, Y.; Zhang, Z.; Ou, W.; Guo, J.; Pueppke, S.G. How does urban form influence PM2.5 concentrations: Insights from 350 different-sized cities in the rapidly urbanizing Yangtze River Delta (YRD) region of China, 1998–2015. Cities 2020, 98, 102581. [Google Scholar] [CrossRef]
  13. Liu, X.; Sweeney, J. Modelling the impact of urban form on household energy demand and related CO2 emissions in the Greater Dublin Region. Energy Policy 2012, 46, 359–369. [Google Scholar] [CrossRef]
  14. Ou, J.; Liu, X.; Li, X.; Chen, Y. Quantifying the relationship between urban forms and carbon emissions using panel data analysis. Landsc. Ecol. 2013, 28, 1889–1907. [Google Scholar] [CrossRef]
  15. Lee, S.; Lee, B. The influence of urban form on GHG emissions in the U.S. household sector. Energy Policy 2014, 68, 534–549. [Google Scholar] [CrossRef]
  16. Resch, E.; Bohne, R.A.; Kvamsdal, T.; Lohne, J. Impact of Urban Density and Building Height on Energy Use in Cities. Energy Procedia 2016, 96, 800–814. [Google Scholar] [CrossRef]
  17. Li, Z.; Wang, F.; Kang, T.; Wang, C.; Chen, X.; Miao, Z.; Zhang, L.; Ye, Y.; Zhang, H. Exploring differentiated impacts of socioeconomic factors and urban forms on city-level CO2 emissions in China: Spatial heterogeneity and varying importance levels. Sustain. Cities Soc. 2022, 84, 104028. [Google Scholar] [CrossRef]
  18. Yin, K.; Yao, X. The impact of urban compactness on urban carbon emissions: A study of 281 Chinese cities. Urban Clim. 2024, 56, 102052. [Google Scholar] [CrossRef]
  19. Lin, J.; Huang, B.; Chen, M.; Huang, Z. Modeling urban vertical growth using cellular automata—Guangzhou as a case study. Appl. Geogr. 2014, 53, 172–186. [Google Scholar] [CrossRef]
  20. Berardi, U. Building Energy Consumption in US, EU, and BRIC Countries. Procedia Eng. 2015, 118, 128–136. [Google Scholar] [CrossRef]
  21. Falahatkar, S.; Rezaei, F. Towards low carbon cities: Spatio-temporal dynamics of urban form and carbon dioxide emissions. Remote Sens. Appl. Soc. Environ. 2020, 18, 100317. [Google Scholar] [CrossRef]
  22. Shi, K.; Xu, T.; Li, Y.; Chen, Z.; Gong, W.; Wu, J.; Yu, B. Effects of urban forms on CO2 emissions in China from a multi-perspective analysis. J. Environ. Manag. 2020, 262, 110300. [Google Scholar] [CrossRef] [PubMed]
  23. Sha, W.; Chen, Y.; Wu, J.; Wang, Z. Will polycentric cities cause more CO2 emissions? A case study of 232 Chinese cities. J. Environ. Sci. 2020, 96, 33–43. [Google Scholar] [CrossRef]
  24. Sun, Y.; Zhang, G. Analysis of the measurement of transportation carbon emissions and the emission reduction path in the Yangtze River economic belt under the background of “dual carbon” goals. Energies 2024, 17, 3364. [Google Scholar] [CrossRef]
  25. Chen, Y. An analytical process of spatial autocorrelation functions based on Moran’s index. PLoS ONE 2021, 16, e0249589. [Google Scholar] [CrossRef]
  26. Sun, J.; Sun, Z.; Guo, H.; Wang, J.; Jiang, H.; Gao, J. Dataset of built-up areas of Chinese cities in 2020. Chin. Sci. Data 2022, 7, 1. [Google Scholar] [CrossRef]
  27. Wang, J. Research on Urban Spatial Morphology and Urban Low-Carbon Development Quality. Master’s Thesis, Wuhan University, Wuhan, China, 2022. [Google Scholar] [CrossRef]
  28. Schwarz, N. Urban form revisited—Selecting indicators for characterising European cities. Landsc. Urban Plan. 2010, 96, 29–47. [Google Scholar] [CrossRef]
  29. Ronchi, S.; Salata, S.; Arcidiacono, A. An indicator of urban morphology for landscape planning in Lombardy (Italy). Manag. Environ. Qual. Int. J. 2018, 29, 623–642. [Google Scholar] [CrossRef]
  30. Jia, Y.; Tang, L.; Xu, M.; Yang, X. Landscape pattern indices for evaluating urban spatial morphology—A case study of Chinese cities. Ecol. Indic. 2019, 99, 27–37. [Google Scholar] [CrossRef]
  31. Kupfer, J.A. Landscape ecology and biogeography: Rethinking landscape metrics in a post-fragstats landscape. Prog. Phys. Geogr. Earth Environ. 2012, 36, 400–420. [Google Scholar] [CrossRef]
  32. Du, L.; Wei, C.; Cai, S. Economic development and carbon dioxide emissions in China: Provincial panel data analysis. China Econ. Rev. 2012, 23, 371–384. [Google Scholar] [CrossRef]
  33. Al-Mulali, U. Factors affecting CO2 emission in the middle east: A panel data analysis. Energy 2012, 44, 564–569. [Google Scholar] [CrossRef]
  34. Zheng, Y.; Cheng, L.; Wang, Y.; Wang, J. Exploring the impact of explicit and implicit urban form on carbon emissions: Evidence from Beijing, China. Ecol. Indic. 2023, 154, 110558. [Google Scholar] [CrossRef]
  35. Zheng, S.; Huang, Y.; Sun, Y. Effects of urban form on carbon emissions in China: Implications for low-carbon urban planning. Land 2022, 11, 1343. [Google Scholar] [CrossRef]
  36. Wu, H.; Fang, S.; Zhang, C.; Hu, S.; Nan, D.; Yang, Y. Exploring the impact of urban form on urban land use efficiency under low-carbon emission constraints: A case study in China’s yellow river basin. J. Environ. Manag. 2022, 311, 114866. [Google Scholar] [CrossRef]
  37. Bereitschaft, B.; Debbage, K. Urban form, air pollution, and co 2 emissions in large u.s. metropolitan areas. Prof. Geogr. 2013, 65, 612–635. [Google Scholar] [CrossRef]
  38. Egidi, G.; Cividino, S.; Vinci, S.; Sateriano, A.; Salvia, R. Towards local forms of sprawl: A brief reflection on Mediterranean urbanization. Sustainability 2020, 12, 582. [Google Scholar] [CrossRef]
  39. Iizuka, S.; Xuan, Y.; Takatori, C.; Nakaura, H.; Hashizume, A. Environmental impact assessment of introducing compact city models by downscaling simulations. Sustain. Cities Soc. 2020, 63, 102424. [Google Scholar] [CrossRef]
Figure 1. Map of the study area: 27 cities in the YRD region of China.
Sustainability 16 09678 g001
Figure 2. Displays remote sensing imagery depicting the urban expansion footprints of (a) Shanghai, (b) Nanjing, (c) Hangzhou, and (d) Hefei. The background image is based on 250 m DEM elevation data, with urban built-up areas highlighted in purple.
Sustainability 16 09678 g002
Figure 3. Clustering results for CO2 emissions in selected years.
Sustainability 16 09678 g003
Figure 4. Displays the Moran’s I index map for CO2 emissions for the selected years.
Sustainability 16 09678 g004
Figure 5. Spatial patterns of built-up areas in 27 cities in the YRD region, China.
Sustainability 16 09678 g005
Table 1. Energy carbon emission factor statistics.
EnergyAverage Low
Calorific Value (kJ/kg)
Standard Coal Conversion FactorCarbon Content per Unit Calorific Value (tC/TJ)Carbon Oxidation RateCarbon Emission
Factor (kgCO2/kg)
raw coal20,9340.714327.370.941.975
coke28,4700.971429.50.932.860
gasoline43,1241.471418.90.982.929
kerosene43,1241.471419.50.983.022
diesel fuel42,7051.457120.20.983.010
fuel oil41,8681.428621.10.983.171
liquefied petroleum gas50,2421.714317.20.983.105
natural gas38,9311.330015.320.992.162
Table 2. Indicators related to urban morphology.
IndicatorsAbbreviationEquation
Total AreaTA T A = j = 1 n a i j
Maximum Patch IndexLPI L P I = m a x j 1 n ( a i j ) T A
Area-Weighted Mean Shape IndexSHAPE_AM S H A P E A M = i = 1 m j = 1 n ( p i j min p i j ) ( a i j T A )
Area-Weighted Mean Patch Fractal Dimension IndexFRAC_AM F R A C A M = i = 1 m j = 1 n ( 2 ln ( 0.25 p i j ) ln ( a i j ) ) ( a i j T A )
Perimeter–Area Ratio DistributionPARA_MN P A R A M N = i = 1 m j = 1 n ( p i j / a i j ) m n
Percent of Similar AdjacentPLADJ P L A D J = ( i = 1 m g i i i = 1 m k = 1 n g i k )
Patch Cohesion IndexCOHESION C O H E S I O N = 1 i = 1 m j = 1 m P i j i = 1 m j = 1 m P i j n G i j m 1 1 T A 1
Aggregation IndexAI A I = g i j max ( g i j )
Landscape Shape IndexLSI L S I = 0.25 k = 1 m e i k T A
Patch DensityPD P D = n i / T A
Road Network DensityRD R D = L e n g t h / T A
Traffic Coupling DegreeCF C F = A r / T A
Table 3. The built-up area of 27 cities in the YRD region of China.
CityArea of Built-Up Area (km2)CityArea of Built-Up Area (km2)
200020102020200020102020
Shanghai771.531371.471877.62Shaoxing75.87148.68243.07
Nantong67.08143.72230.26Jinhua25.0464.3698.42
Wuxi102.44239.51448.36Zhoushan17.8732.1957.80
Suzhou79.06219.66418.60Taizhou22.74102.96174.99
Yancheng35.7567.54155.66Wenzhou64.0190.29129.52
Changzhou146.39288.58487.85Hefei148.66389.45649.94
Nanjing188.99365.61687.11Wuhu44.9097.97163.10
Yangzhou39.3786.61217.53Maanshan38.2580.32109.22
Zhenjiang38.45106.71188.28Tongling22.0239.3177.35
Taizhou27.0268.78130.15Anqing24.4947.3787.70
Hangzhou143.65372.45765.30Chuzhou15.2938.6893.30
Ningbo82.90207.89317.01Chizhou5.0418.6636.09
Jiaxing18.8762.18140.24Xuancheng10.5523.4454.50
Huzhou12.3428.5362.58
Table 4. Correlation test results.
PDLSIPLADJCOHESIONAITALPISHAPE_AMFRAC_AMPARA_MNRDCF
V11
V2−0.1021
V3−0.786
**
−0.0311
V4−0.816
**
0.1580.707
**
1
V5−0.772
**
−0.1030.995
**
0.691 **1
V6−0.313
**
0.802
**
0.339
**
0.356 **0.293 **1
V7−0.546
**
−0.1600.632
**
0.819 **0.646 **0.1611
V8−0.456
**
0.639
**
0.440
**
0.645 **0.393 **0.807
**
0.536 **1
V9−0.572
**
0.534
**
0.424
**
0.811 **0.372 **0.581
**
0.640 **0.889
**
1
V10−0.409
**
0.0290.467
**
0.588 **0.450 **0.1660.621 **0.527
**
0.640 **1
V11−0.472
**
0.461
**
0.496
**
0.546 **0.455 **0.633
**
0.387 **0.764
**
0.696 **0.550
**
1
V12−0.502
**
0.408
**
0.483
**
0.530 **0.446 **0.573
**
0.396 **0.703
**
0.644 **0.450
**
0.817 **1
Note: ** denotes significance at 5% level.
Table 5. Model summary.
ModelRR2FSignificance
I0.9620.92569.497p < 0.001
Table 6. Coefficients of results of panel data analysis.
ModelVariableCoefficientTpN
IPD−480.592 ***−3.8800.00081
LSI−19.657 ***−3.8050.00081
PLADJ2962.224 ***3.3320.00181
COHESION1111.8891.7900.07881
AI−3727.839 ***−3.7880.00081
TA0.026 ***9.5220.00081
LPI6.5861.8590.06781
SHAPE_AM63.212 ***5.6580.00081
FRAC_AM−18,750.877 ***−5.5240.00081
PARA_MN0.220 ***3.4650.00181
RD69.524 **2.1440.03681
CF−495.671−1.5070.13681
constant−12,817.602−0.2260.82281
Note: *** denotes significance at 1% level; ** denotes significance at 5% level.
Disclaimer/Publisher’s Note: The statements, opinions and data contained in all publications are solely those of the individual author(s) and contributor(s) and not of MDPI and/or the editor(s). MDPI and/or the editor(s) disclaim responsibility for any injury to people or property resulting from any ideas, methods, instructions or products referred to in the content.

