Review

Dewatering and Transport in Sustainable Sediment Management: A Review

M2C Morphodynamique Continentale et Côtière, Unicaen, ComUE Normandie University, 14000 Caen, France
*
Author to whom correspondence should be addressed.
Sustainability 2024, 16(22), 9663; https://doi.org/10.3390/su16229663
Submission received: 30 August 2024 / Revised: 17 October 2024 / Accepted: 29 October 2024 / Published: 6 November 2024

Abstract

:
This paper deals with the dewatering and handling of dredged sediments in the context of sustainability and renewability of natural resources. Dewatering is a critical part of sediment management, as the high water content of dredged sediments becomes a challenge for transportation, final storage and/or recycling. This is why it is necessary to reduce their water content before transportation. Conventional methods suggest using land-based drained basins, which is a sustainable solution. However, this solution has certain drawbacks: dewatering the sediment is time-consuming and involves the use of large land areas. The main problem with this method of dewatering can be solved by proposing mechanical dewatering in the vicinity of the dredging operation. Once the sediment has been sufficiently dewatered, it should be shoveled and transported again. The proposed paper covers the study of the dewatering and shoveling ability of sediments. After introducing why dewatering is a critical phase in the recycling process of sediment, some techniques for dewatering large volumes of high-water sediments are briefly reported. Typical dewatering laboratory tests are detailed, demonstrating their usefulness for understanding the mechanisms of natural dewatering. A laboratory dewatering press machine is reported and the procedure used for a sediment sludge. The last section concerns a recent innovative test implemented for the study of the shoveling ability and adhesion of sediments. This study improves our understanding of the phenomenon of sediment dewatering, for both natural and mechanical dewatering. It also provides the protocols for typical laboratory tests on sediment dewatering and shoveling ability.

1. Introduction

Sediments are a complex mixture of fine elements even if they are composed with clays, silts sands and gravels. Dredged sediments usually have a high water content depending on the dredging methods used. Organic matter is added to sediments in non-urban areas through natural processes. Near-inhabited and agricultural areas, waste waters, pesticides, fertilizers and microplastics contribute to the pollution of sediments. Industrialized areas accentuate this contribution of contaminants through the presence of heavy metals, PCBs, PAHs, TBTs, etc. The proximity of the ocean brings salt into the water and sediments. The challenge that stakeholders face when dredging is how to manage dredged sediments according to regulations, grain size distribution, contamination and high water content? Sediment management is carried out according to the level of contamination and the regulations in place in each country, as shown in Figure 1.
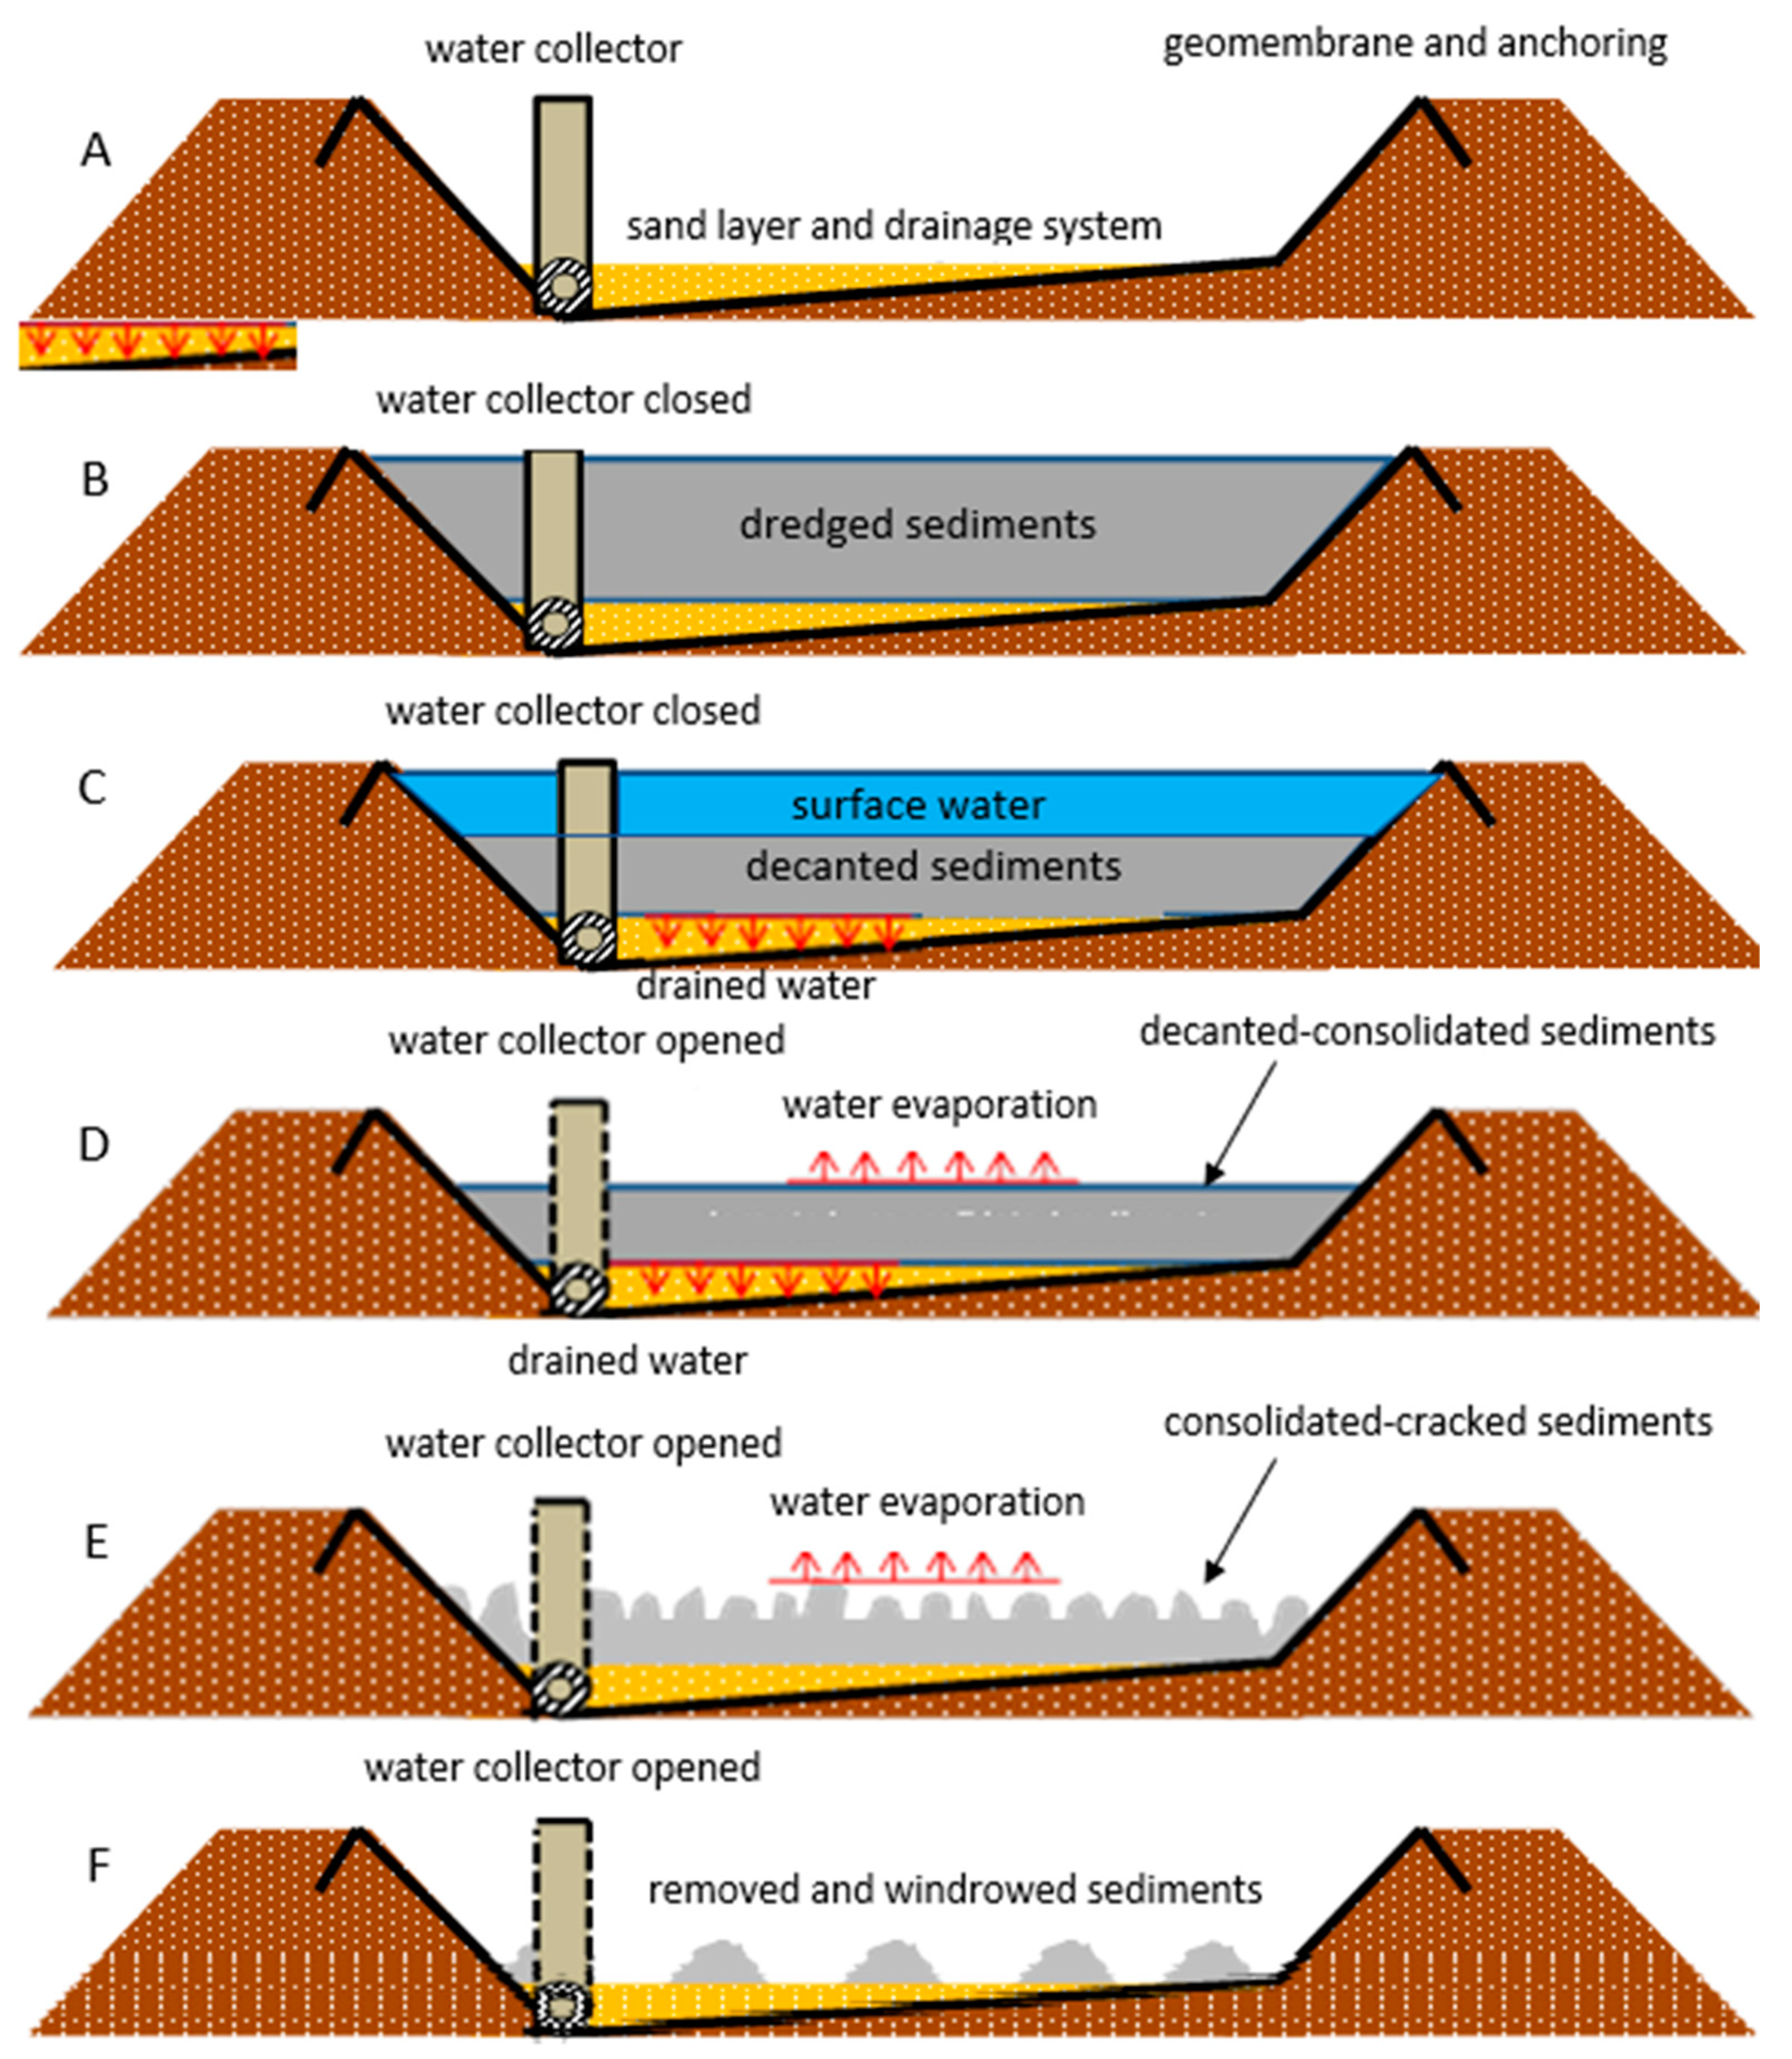
Regardless of the origin of the dredged sediments (port, river, dam or reservoir), with the exception of those authorized to be dumped in the sea when dredging nears coastal areas, once dredged, the sediments must be deposited in a confined site, usually in re-sedimentation basins. However, as soon as it is dredged, the sediment has to be transported in its initial state, from liquid (very high water content) to very little consistency (high water content, highly compressible, low shear resistance and very sticky). This transport is carried out by hydraulic pumping, by barge in a river environment or by road in a truck specifically equipped for transporting sludge. The purpose of these methods of transport is to deposit the high-water-content sediments in land-based ponds or basins to ensure the rapid settling and natural dewatering of the sediment, as shown in Figure 2.
High water content is an obstacle to the recovery of sediments. Therefore, the dewatering of high-water-content sediments is essential to ensuring that they can be recycled, either directly with raw, untreated sediments for use in agronomy and raw or fired bricks, or in a more sophisticated way that requires the use of stabilization/solidification techniques, primarily for recycling in construction and road materials [2,3,4,5].
Once deposited, the natural dewatering of the sediments begins, which can be time-consuming. The supernatant water is evacuated towards a water collection system, the water in the sediments is drained and a portion is evaporated (see Figure 2) [6]. Natural dewatering depends on many parameters (geometry of the basins, texture and grain size of the sediments) but primarily atmospheric conditions. An important question arises for managers: when is sediment shovelable and transportable? This is because they have to be shoveled to load them and transport them to recovery sites.
Figure 2. Mechanisms of natural sediment dewatering in land-based ponds showing the main stages in the process [6]: (A), land-based pond structure; (B), filling the basin with the newly dredged sediments; (C), settling and decantation of sediments; (D), dewatering continued and self-weight consolidation of sediments; (E), dewatering continued and drying of sediments; (F), removing of sediments.
Sustainability 16 09663 g002
The monitoring of dewatering and the implementation of sediment transport constitute the complete phase of dewatering. Transportation represents the end of this phase. Dewatering is the concern of the following section. Although a brief reminder is given of the dewatering techniques available for dredged sediments, natural dewatering with respect to sustainable development, energy savings and minimization of greenhouse gas emissions is presented in detail. The first part of this study analyzed the behavior of sediments during natural drying, with the aim of improving this dehydration technique through the use of simple laboratory tests. These tests were used to understand the mechanisms of the dewatering of the sediments and to collect information useful for the design of the land-based basins or ponds and at the same time for the residence time of the sediments in them.
Natural dehydration remains the most cost-effective method, and even the most environmentally friendly solution. Understanding the mechanisms of dewatering through these laboratory tests meant we could better manage the residence time of sediments in these basins.
The residence time of sediments depends on climatic conditions, but also on the ability of sediments to be shoveled so that they can be transported. To the best of our knowledge, no laboratory test exists for investigating the shovelability of sediments. Little information is available on sediment adhesion, but its applications do not concern its shovelability. This is why a specific test was developed and reported in this review. So, the last section of this study focuses on the transport of sediments, including an innovative laboratory test that could help to establish criteria for the shovelability of sediments on the one hand and the spreading of these in the event of direct recovery in agronomy. As illustrated in Figure 3, the critical phases were dewatering and transport from dredging to reuse of high-water sediments.
Finally, this article presents a review on recent advances in the field of natural and mechanical dewatering applied to various inert sediments. The following sections are based on previous research works [6,7] performed in the laboratory and on-site [8,9,10]. The last section is completely innovative, with the development of a specific test to investigate the shovelability of sediments for transport. It can also be used to study the adhesion of sediments, which poses a problem for certain uses, such as spreading in agronomy [11].

2. Dewatering of High-Water Sediments

2.1. Available Dewatering Techniques

The dewatering of sediments can be defined as the process of reducing or removing the water content of a set of solid particles that make up the sediments [6]. According to the energy source or the force applied for the separation of sediments and water, several technical processes can be distinguished. Natural drying, mechanical, chemical and thermal dewatering are some examples. The natural drying of sediments allows for the reduce in the water content of sediments by drainage and evaporation, and mechanical dewatering allows for a decrease in water by applying mechanical forces to sediments. Some studies [6,7] have shown that natural dewatering is the most economical and eco-friendly method of dewatering, and mechanical dewatering improves this method because it can optimize the time and surface area and thus has higher productivity in the dewatering process [6]. For these reasons, this paper focuses on these two methods.
The natural drying of sediments starts when sludge is stored in lagoons, drying beds or planted drying beds, as shown in Figure 2, and once deposited (Figure 2B), sediments decant by gravity. Water remains on the surface of sludges, because it is less dense than sediments (Figure 2C), and it is drained by a pipe or water collector and a drained land composed of sand (Figure 2D). When the drying process stops, the evaporation process becomes more and more important (Figure 2E) because sediments are in contact with air. It should be underlined that the higher the contact surface for sediments, the more the evaporation speed increases (Figure 2F). Regarding natural drying, it is important to emphasize that it is greatly conditioned by weather conditions and the physical, chemical and mineralogical characteristics of sediments [6]. Sludges with a high content of clays are most difficult to dewater in rainy climates, as shown in Section 2.2. To remove these inconveniences, mechanical dewatering for sediments is proposed.
Mechanical dewatering for sediments consists of introducing sludges into a machine where mechanical forces such as shear or compression forces will be applied. Usually, flocculants must be added to sludges to improve the mechanical dewatering process [8] and their percentage depends on the type of machine, as shown in Table 1. The results of dewatered sediments using a mechanical dewatering process depend on the machine’s parameters and the process. The most important one is the work system. In this way, sediments can be dewatered using either a discontinuous process (the traditional method) or a continuous method (the new generation of dewatering machines).
Traditional machines for dewatering sediments, such as a filter press, belt press, screw press or centrifuge, work using a discontinuous process of dewatering. This implies that the machine must be stopped at the end of each cycle of dewatering to introduce sediments and/or clean the machine, increasing time and decreasing productivity. One of the best ways to dewater sediments in a discontinuous manner can be through a filter press, because this machine appears to achieve the highest rate of dryness using less energy than other presses, as shown in Table 1.
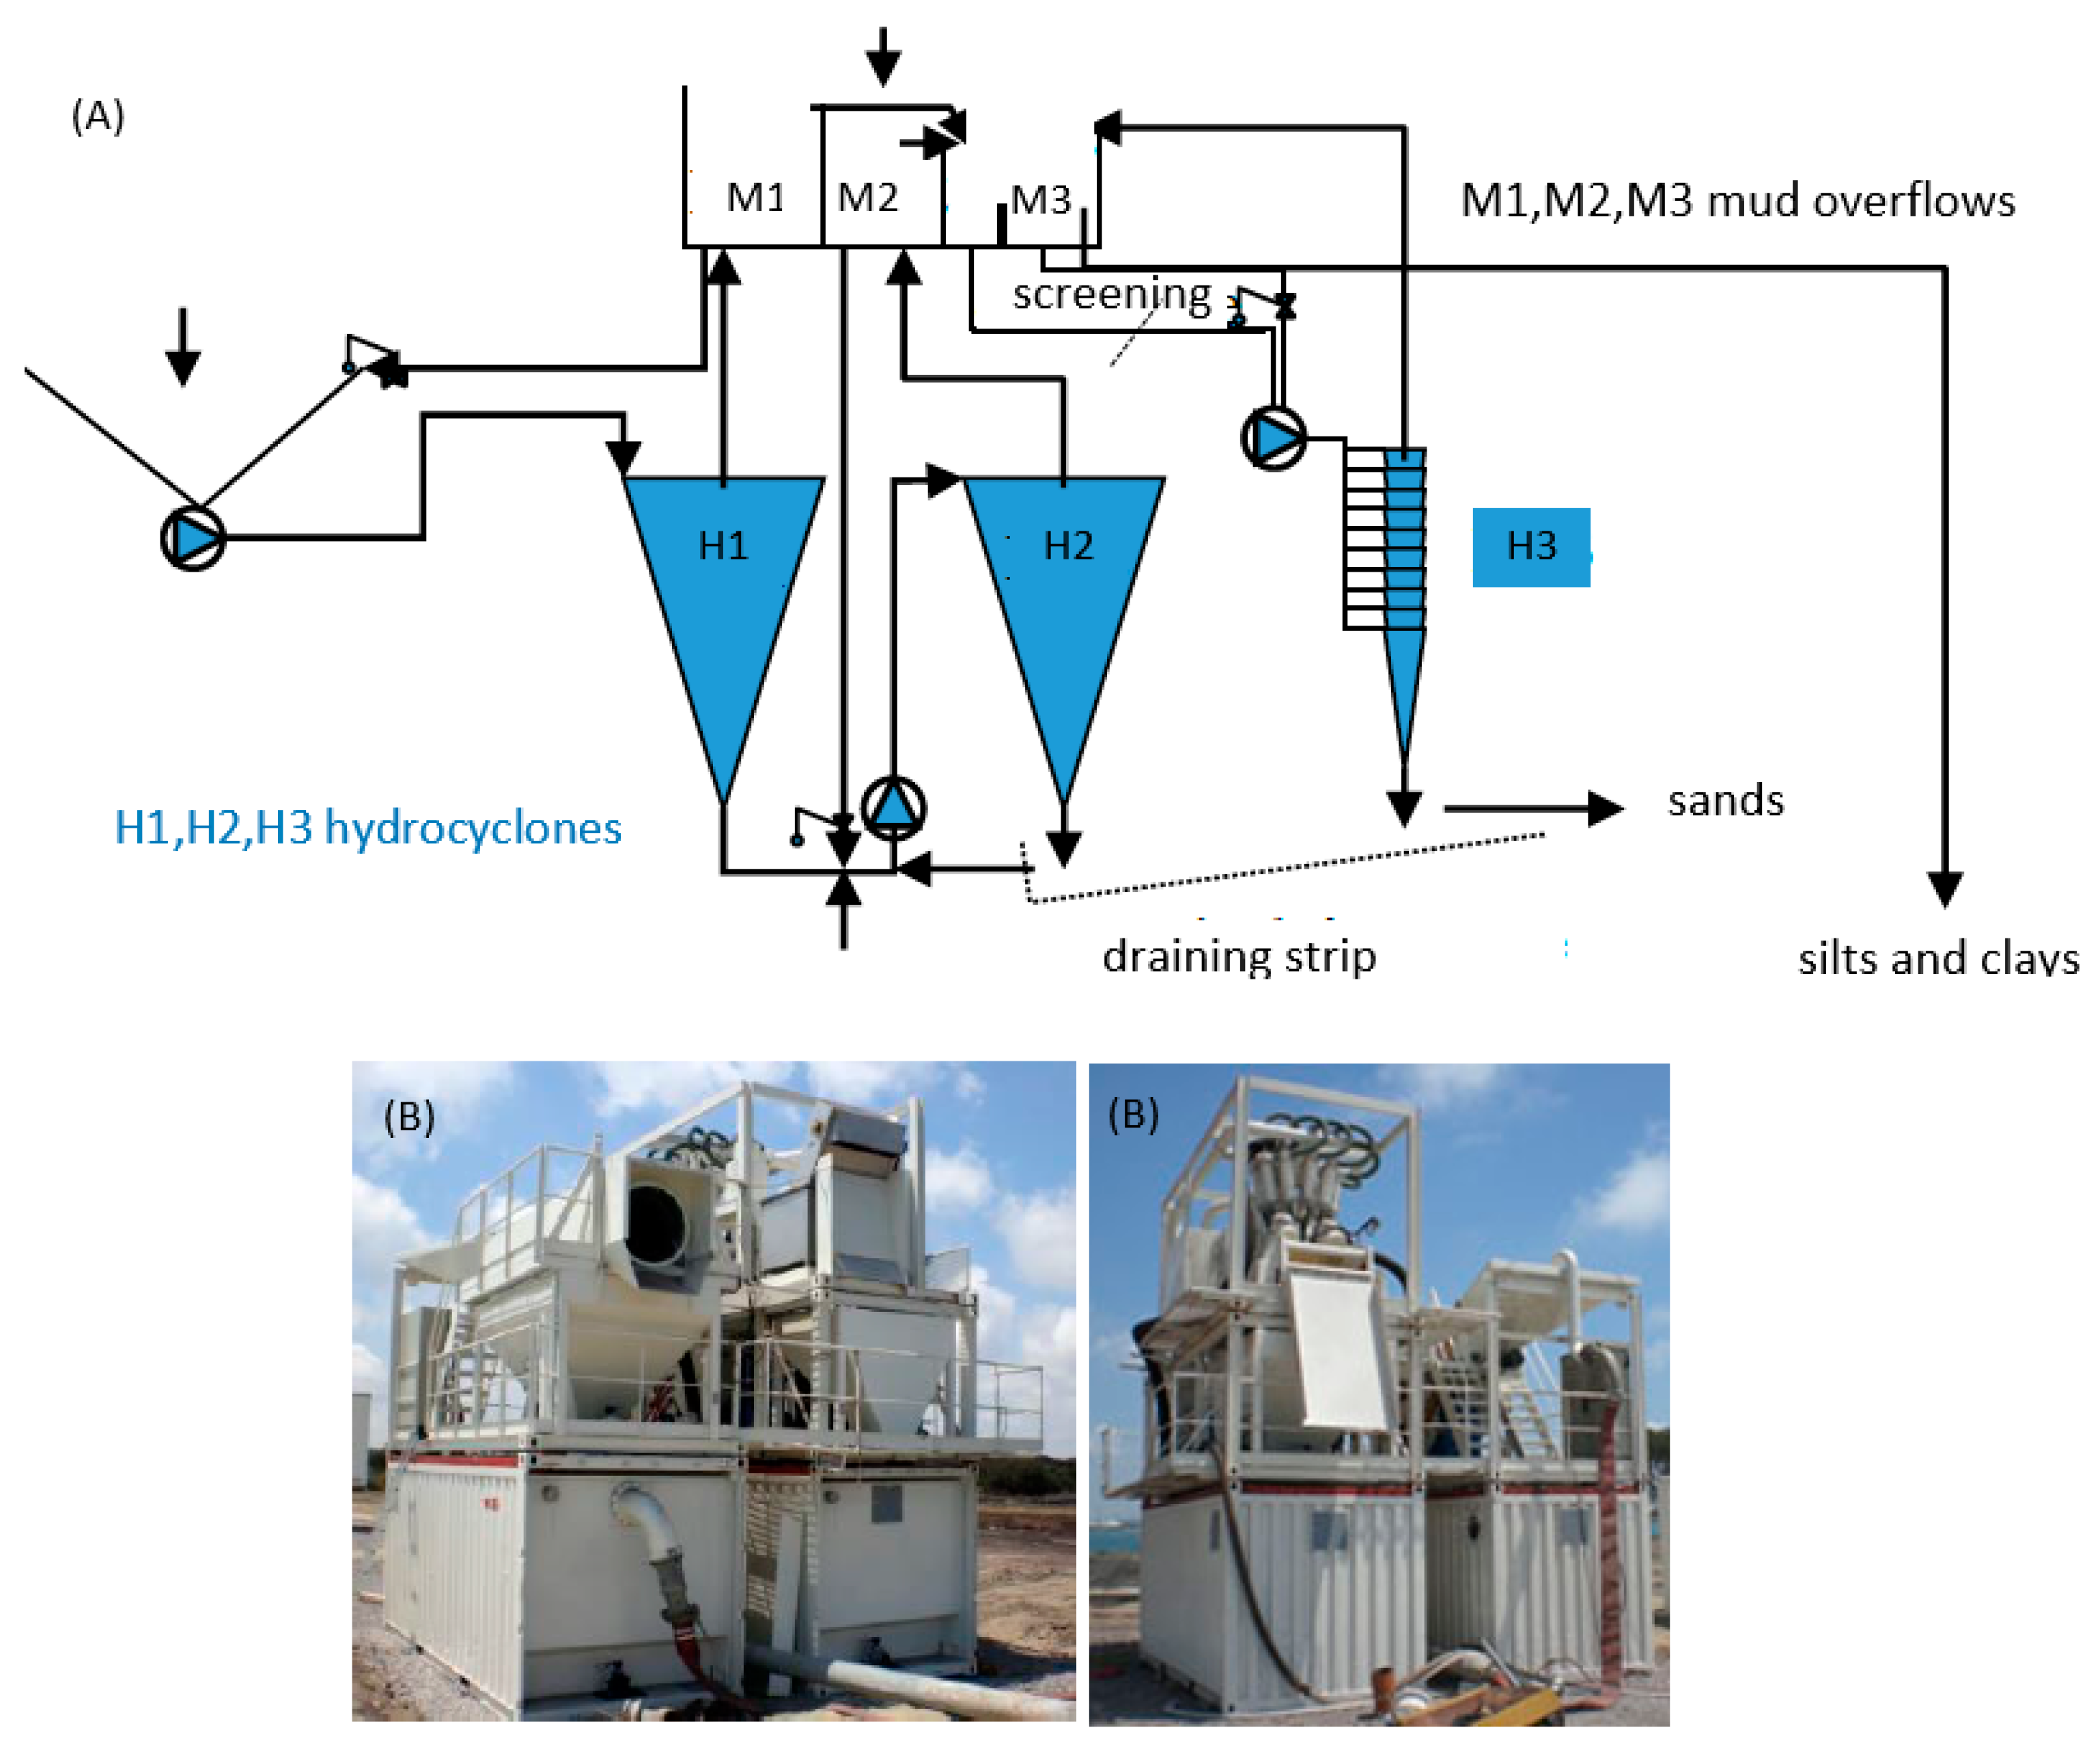
The new generation of machines for dewatering sediments aims to solve the disadvantages of traditional machines, such as lost time between two cycles of dewatering, reduce power consumption for starting and CO2 emissions, and thus be eco-friendlier by dewatering sediments without stopping the machine [8]. The Hydrosplit® system (Valgo, Paris, France), dynamic decanter Nemeau® (ARD Normandie Technologies, Hérouville Saint-Clair, France), screw-press Volute® (EC’eau Press, Atlantique Industrie group, Ancenis, France and Amcon, Yokohama, Kanagawa, Japan), KDS® machine (Eco Wave®, Atlantique Industrie group, Ancenis, France and Kendensha Co., Ltd., Tokyo, Japan, [12]) and Doris® (Ixsane, Villeneuve d’Ascq, France) are some examples of mechanical dewatering in a continuous manner [12,13,14,15,16,17]. The Hydrosplit® system is a sediment dewatering machine composed of a series of hydrocyclones (see Figure 4A). It uses centrifugal and gravitational forces to separate fine and coarse particles using centrifugal and gravitational forces, and at the same time, this machine can perform a granulometric classification of sediments and separate polluted sludge sections. Polluted materials are often found between the particles of clays, and the system allows for the depollution of sediments (see Figure 4B) [6].
The Nemeau® machine is a dynamic decanter for sediment dewatering composed of three standard containers. The first two are focused on the dewatering process and the last one is necessary for the storage of flocculants and proper function (see Figure 5A). Nemeau® can dewater sediments using a combination of decantation by gravity and sifting (see Figure 5B) [9,10]. Its method for dewatering consists of introducing dredged sediments into a pipe, where flocculants are injected along the pipe (container 1). During transportation to container 2, the sediments are flocculated, and consequently, coarse particles (sediments with a diameter larger than 2 mm) settle down and are collected in the first bag. Fine particles are transported into the second container, where they are decantated and stored in other bags. In this way, sediments are arranged by diameters for a better assessment.
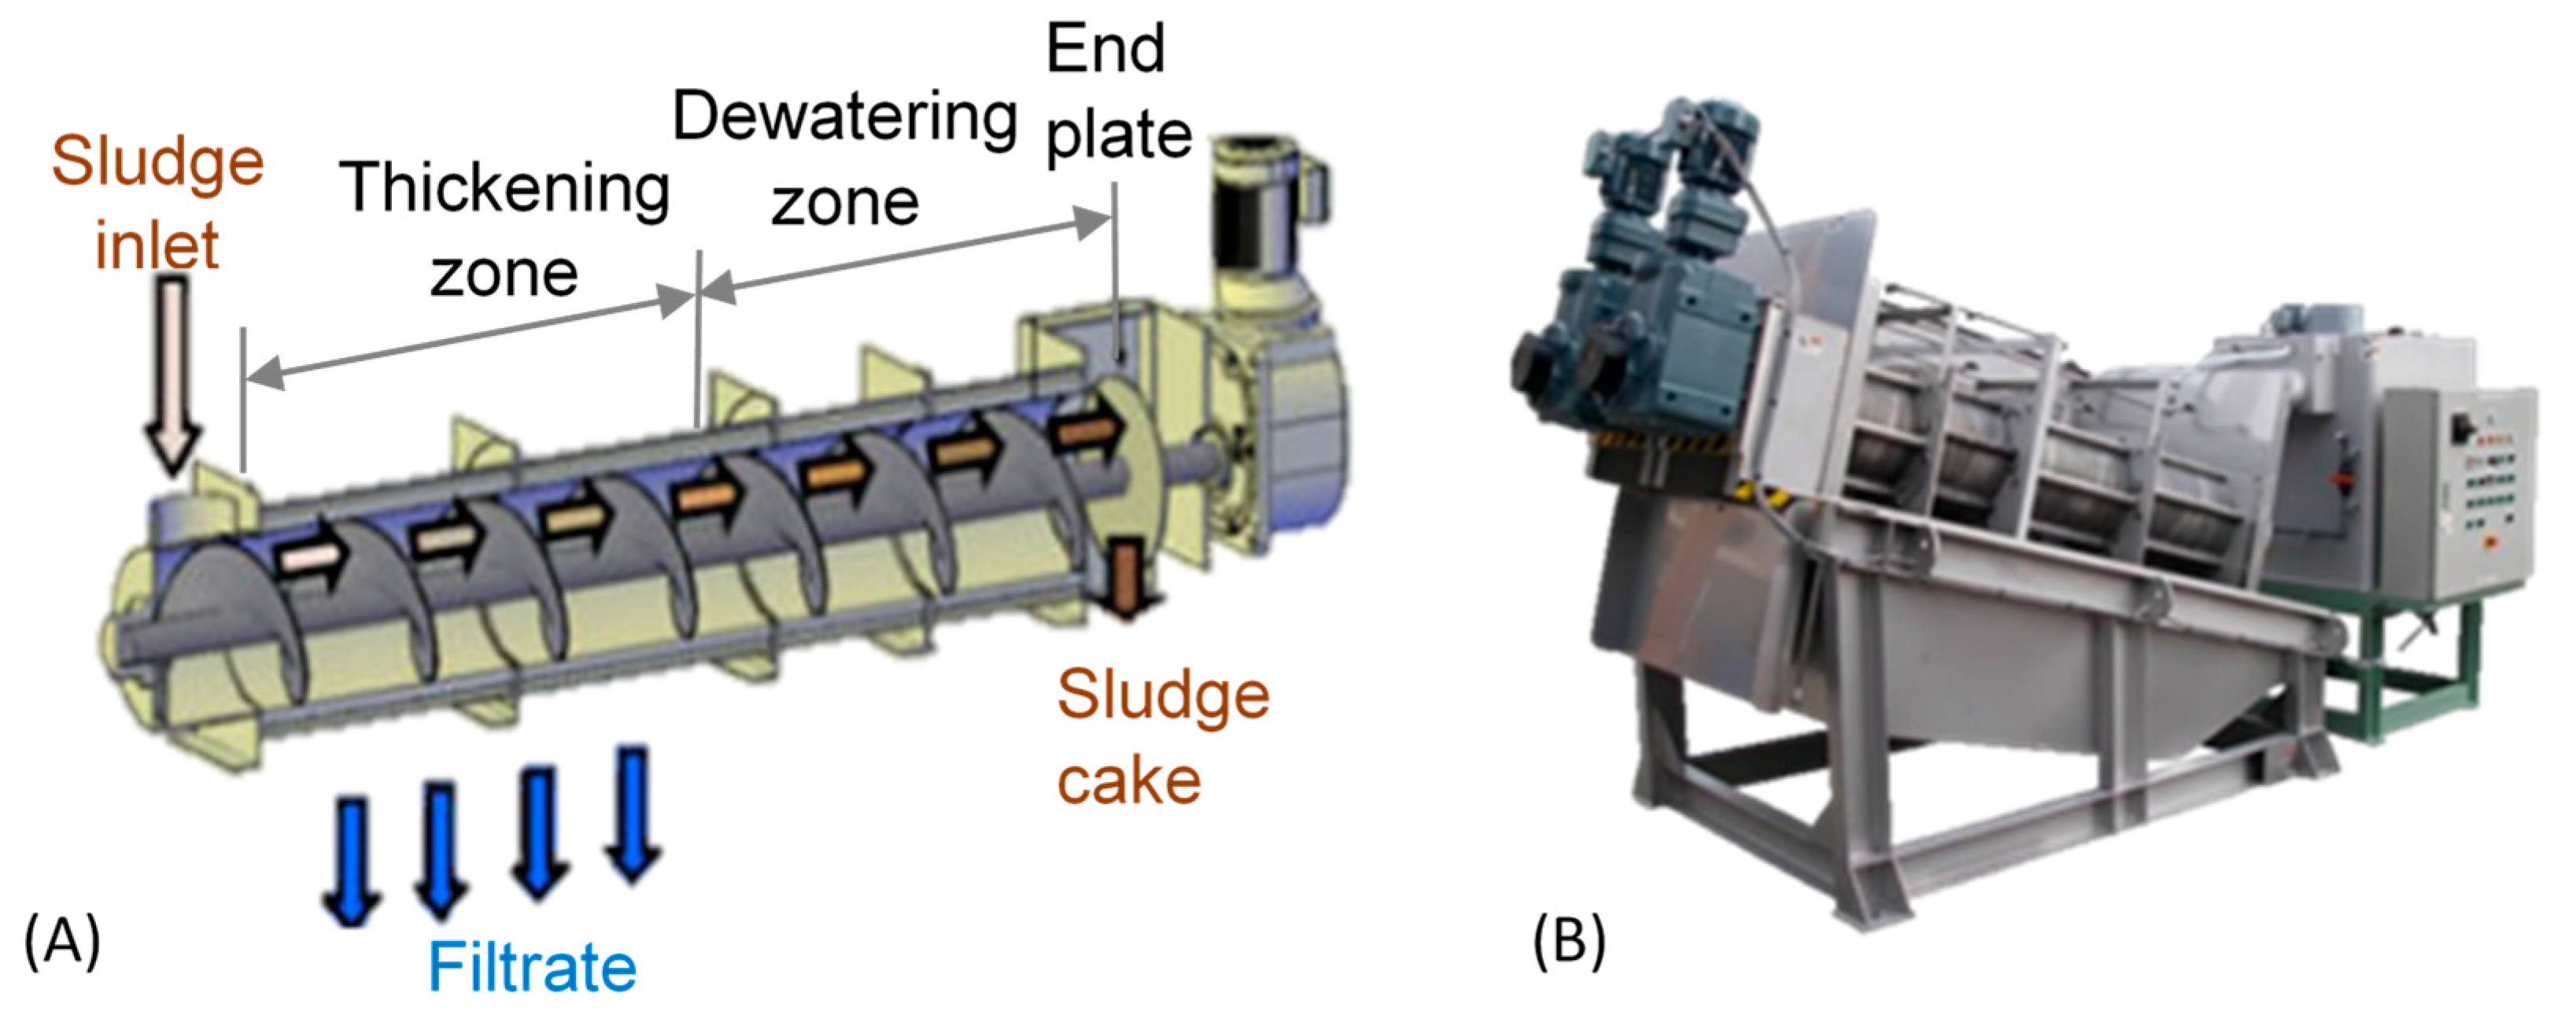
The Volute® machine, also known as “EC’eau Press”, is a conical screw press that combines compression, gravitational and pressure forces for dewatering sludges. Unlike other machines, Volute® is only adapted for organic sludge [6,15,16,17]. This press enables dewatering sludges in a continuous manner due to its design and conical shape: Volute® is composed of a screw that rotates rings at a constant speed within a succession of fixed and moving rings gradually separated, between 0.5 mm and 0.15 mm (see Figure 6A). When sludges are introduced into the tank of the machine, they are flocculated and transported by a screw. Firstly, solid–liquid particles are separated by the filtration process and progressively solid particles are dewatered by compression, reduction in machine shape volume and shear forces. Finally, a pressure force can be applied at the end of the dewatering cycle to improve the dewatering process (see Figure 6B).
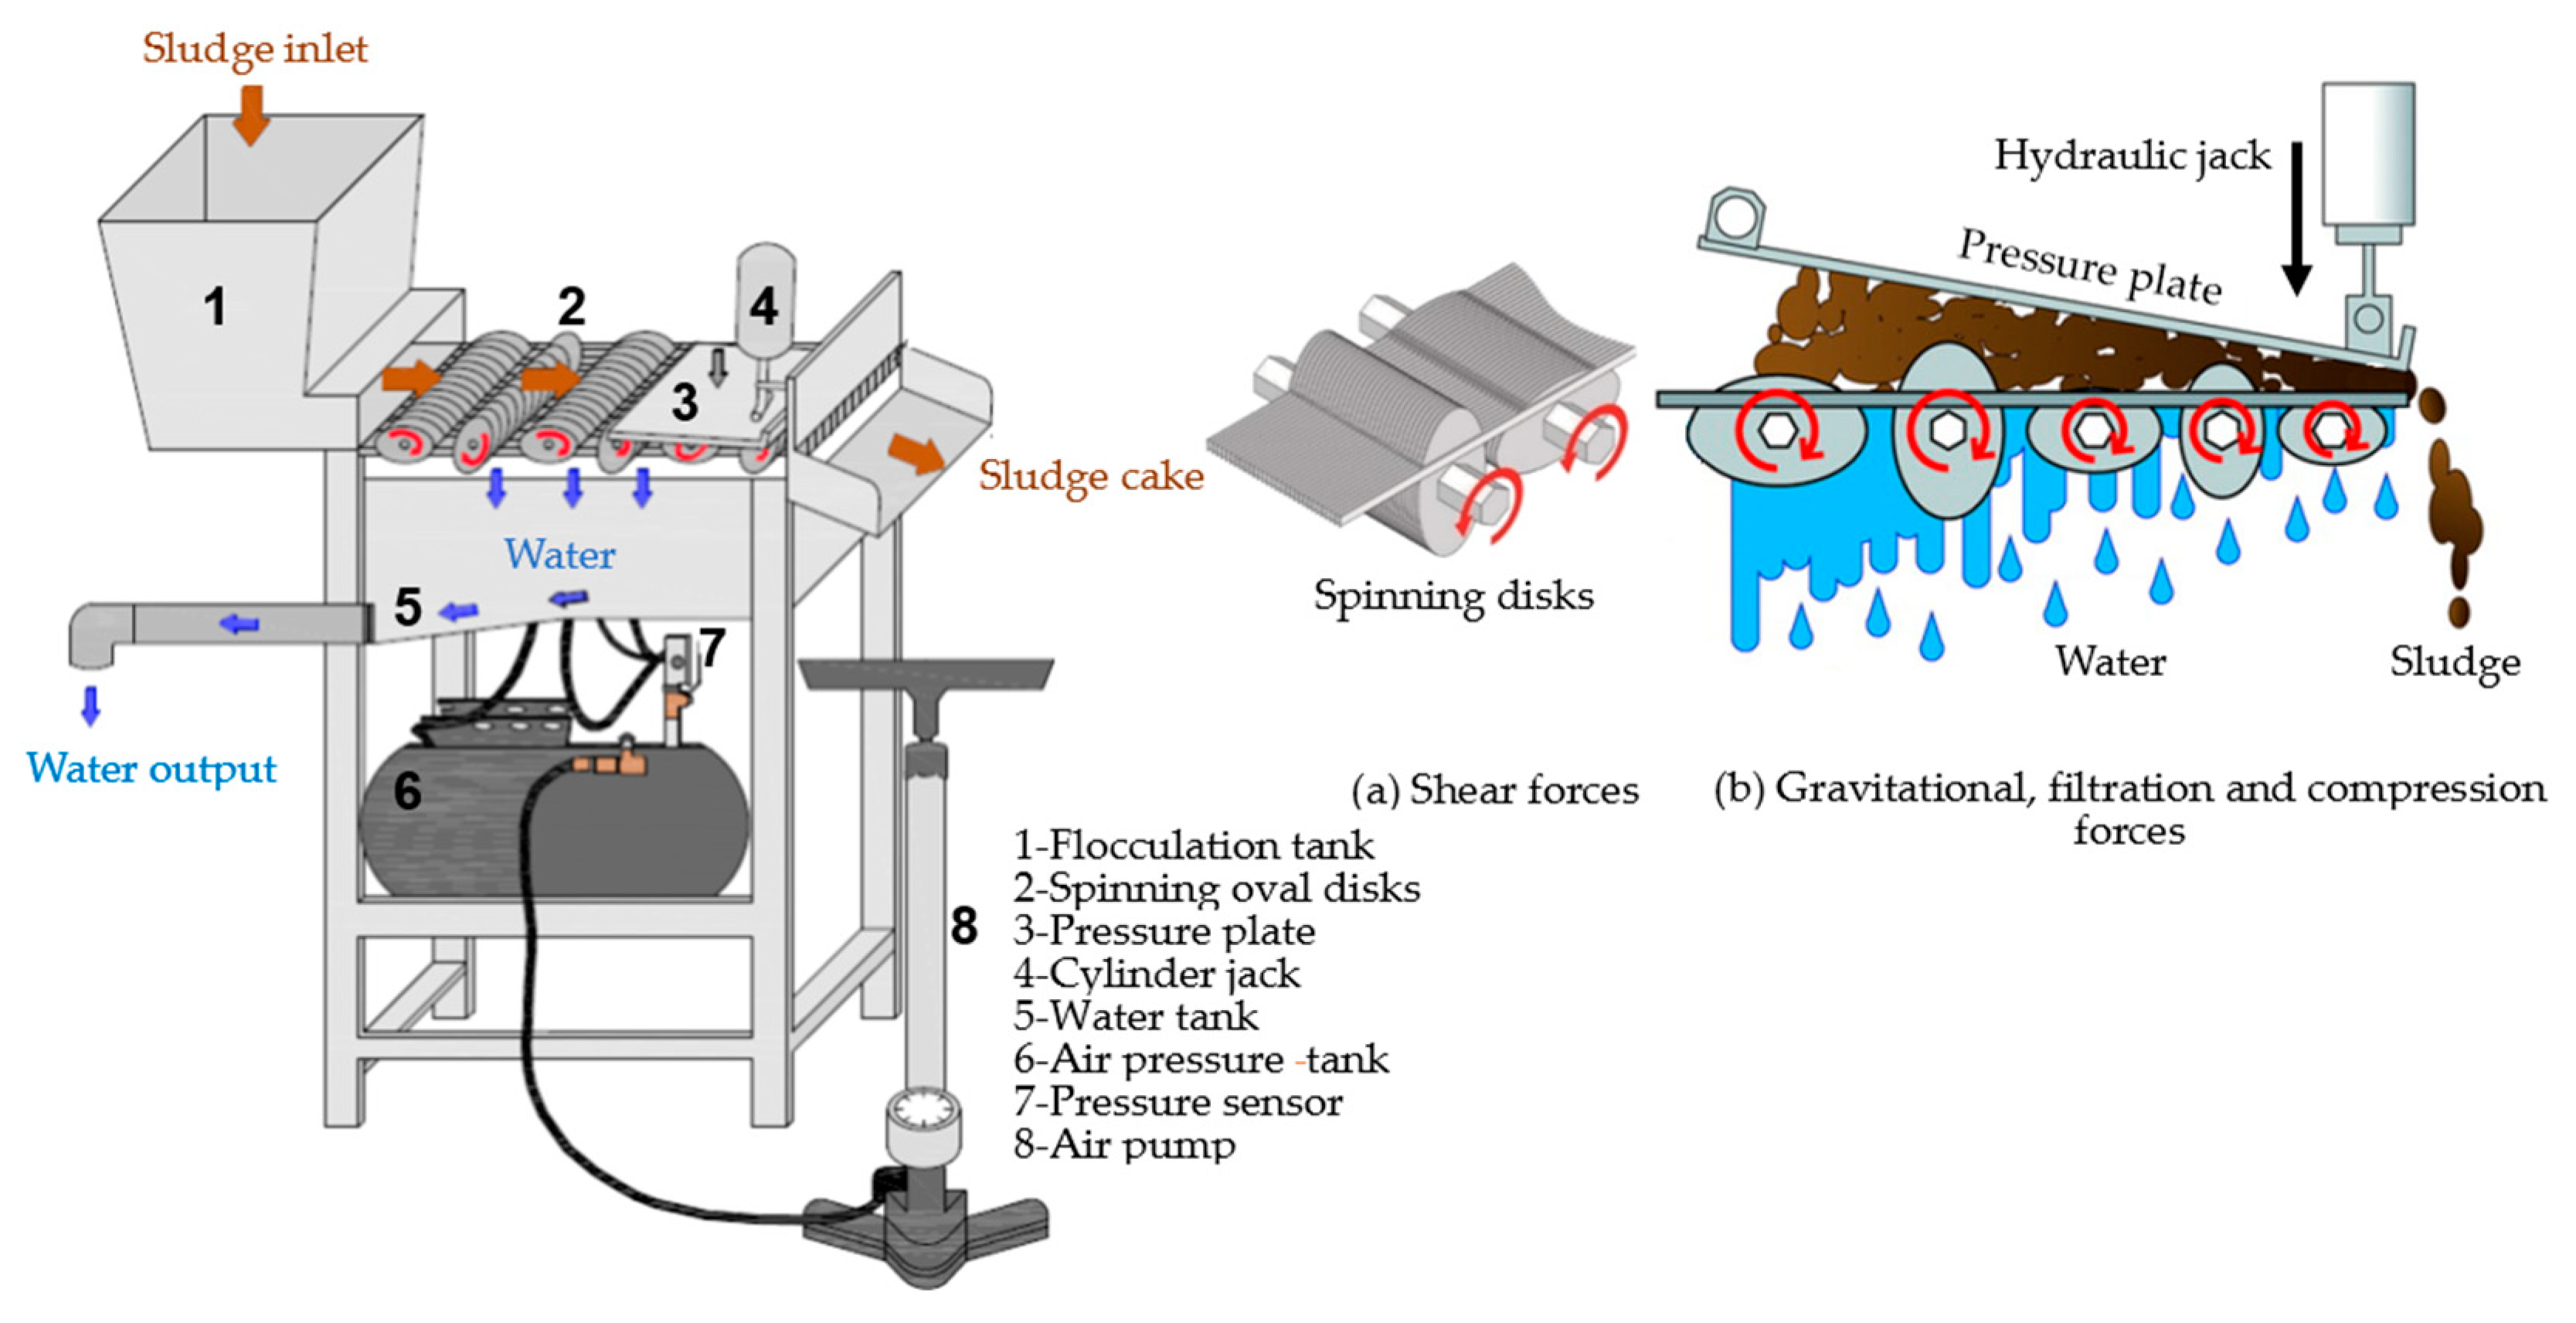
The KDS® machine, also known as “Eco Wave®”, is a continuous press for dewatering sludges [12]. It is composed of elliptical spinning discs and a pressure plate placed at the end of the machine (see Figure 7A). The procedure to dewater sludges is very similar to the Volute® press, both using shear, gravitational and compression forces. The differences between the Volute® press and the KDS® machine are that the discs are elliptical in the KDS® machine and they have a double functionality: they allow for the application of shear force to sediments for decreasing the water content of sediments, and they can transport them during the entire dewatering process. The second difference is that the KDS® machine does not have a cylindrical shape and it is open. This could stop the machine, if necessary, due to the possible presence of rocks or blockages in the machine [6]. Concerning the dewatering process using the KDS® machine, it is important to note that as with the Volute® press, raw sediments are flocculated into the tank at the beginning of the process, then they are transported by elliptical discs, where firstly water falls by gravitational and shear forces caused by the elliptical disk in continuing to decrease the water content of sediments. Secondly, a pressure force needs to be applied to obtain better drying. Finally, sediments are collected in a tank after the compression force and water are collected by another tank (see Figure 7B) [6]. It is important to highlight that as the KDS® architecture was inspired by the Volute® model and that these machines were not originally designed for dewatering sediments, it was necessary to study the behavior of KDS® during the dewatering of sediments. For these reasons, some research studies were conducted [6,8] to examine its behavior during these processes (for more details, see Section 2.5).
Doris® or “Optimized Dewatering of Industrial Residues and Sediment” is a dewatering prototypical machine that proposes a combination of KDS®, Hydrosplit® and Nemeau® decanters for dewatering sediments in a continuous manner. Using these systems, Doris® can take advantage of previous systems and obtain ranges of dryness up to 80% (see Table 2) [18]. Doris® is composed of three forty-foot containers that can be transported (see Figure 8A).
The procedure for dewatering sludges is a mix of machines previously described in this section. In this prototype, sludges are injected into a decanter for sifting sediments and to prevent coarse particles from damaging the machine. Then, the sediments are transported into hydrocyclones by a pipe, and this can separate fine and coarse particles. The fine particles are flocculated, and they are dewatered using KDS® (see Figure 8B). As with the KDS® machine, sediments are discharged at the end of the dewatering process and water is gradually collected during the dewatering process.
A summary of the basic parameters of the dewatering machines that dewater sludge in a continuous manner is shown in Table 2, where their results are compared. As seen in Table 2, the Nemeau® decanter could dewater the largest volume of sediments. However, its occupied surface area was a disadvantage for small zones. Doris® had the same problem but it could dewater the most important flow of sludges (≤80 m3/h). For small zones, the best option seemed to be KDS® if the sludge had a high content of sediments or the Volute® press if the sludge was organic. The highest rate of dryness could be obtained using KDS® or Doris® (≤80 m3/h and ≤80 m3/h) because they used the same process for dewatering sediments. Concerning energy use, it is important to note that all of these machines do not have a high power consumption. They can be operated only by two operators, which in turn reduces the cost of dewatering.
However, the choice of a dewatering process depends mainly on the volume of dredged sediment to be treated, the availability of land close to the dredging site, a potential recovery process not far from the dewatering site (<100 km) and the costs involved. The nature and level of contamination of the sediments are the subject of preliminary studies in the context of the laws in force. Chemical or thermal dewatering techniques should only be used for contaminated sediments. Natural dewatering, which consists of discharging dredged sediments into medium-depth drying cells (lagooning, large volumes) or into shallow concrete basins (drying beds, small volumes), remains the most economical and environmentally friendly technique. Drying beds can also be planted with macrophytes, such as drying beds planted with reeds [19,20]. Nevertheless, there are a number of disadvantages to be highlighted, including the following: discontinuous working system, strong dependence on the properties of the sediment matrix and the local climate, pasty, heterogeneous and poorly dehydrated products obtained, etc. [21]. These drying systems need to be improved by determining criteria suitable for natural drying or replacing them with other mechanical dewatering methods. Compared with the most commonly used types of dewatering, mechanized dewatering represents an alternative and can overcome the disadvantages mentioned in relation to natural drying. Mechanized dewatering can play an important role in sediment dewatering. In fact, it is an effective, rapid solution that depends little on the physiochemical characteristics of a sediment and local meteorology. Mechanized dewatering also makes it possible to reduce the water content of sediments through a combination of mechanical forces: filtration with filter presses or centrifugation with centrifuges. With these mechanical systems, the volumes dewatered remain limited, but the process can operate continuously. More recently, new mechanical dewatering systems have offered a continuous working system that reduces dewatering time, by working 24 h a day, as is the case with the Hydrosplit® hydrocyclone unit, Nemeau® dynamic decanter, Volute® sludge press (EC’eau PRESS with discs) or the combination of hydrocyclones and a sludge press such as the Doris® model.

2.2. Laboratory Air-Drying Test

The natural air-drying test (NADT) can be applied to a small volume of sediment and provides useful data for understanding the mechanisms of dewatering [6,7]. It is similar to the continuous shrinkage test used in geotechnical engineering [22]. The procedure is very simple. The NADT test is performed using an oedometer ring and specific elements as porous stones and filtering materials as geotextiles. Measurements consist of the weighing of sediment during NADT testing obtained by the difference in masses of each part of the experimental setup. All dimensions (height h and diameter d) and mass (m) of sediment samples are measured along and at the end of the NADT test. The oedometer ring is filled with sediments mixed at the initial required high water content w0. Then, natural dewatering is operated in air curing conditions at ambient temperature and relative humidity. Water balance is measured with the time of dewatering. By different weighing, the water content and water quantities of sediments samples SW, drained water DW and quantity of water evaporated EW are deduced (see Figure 9).
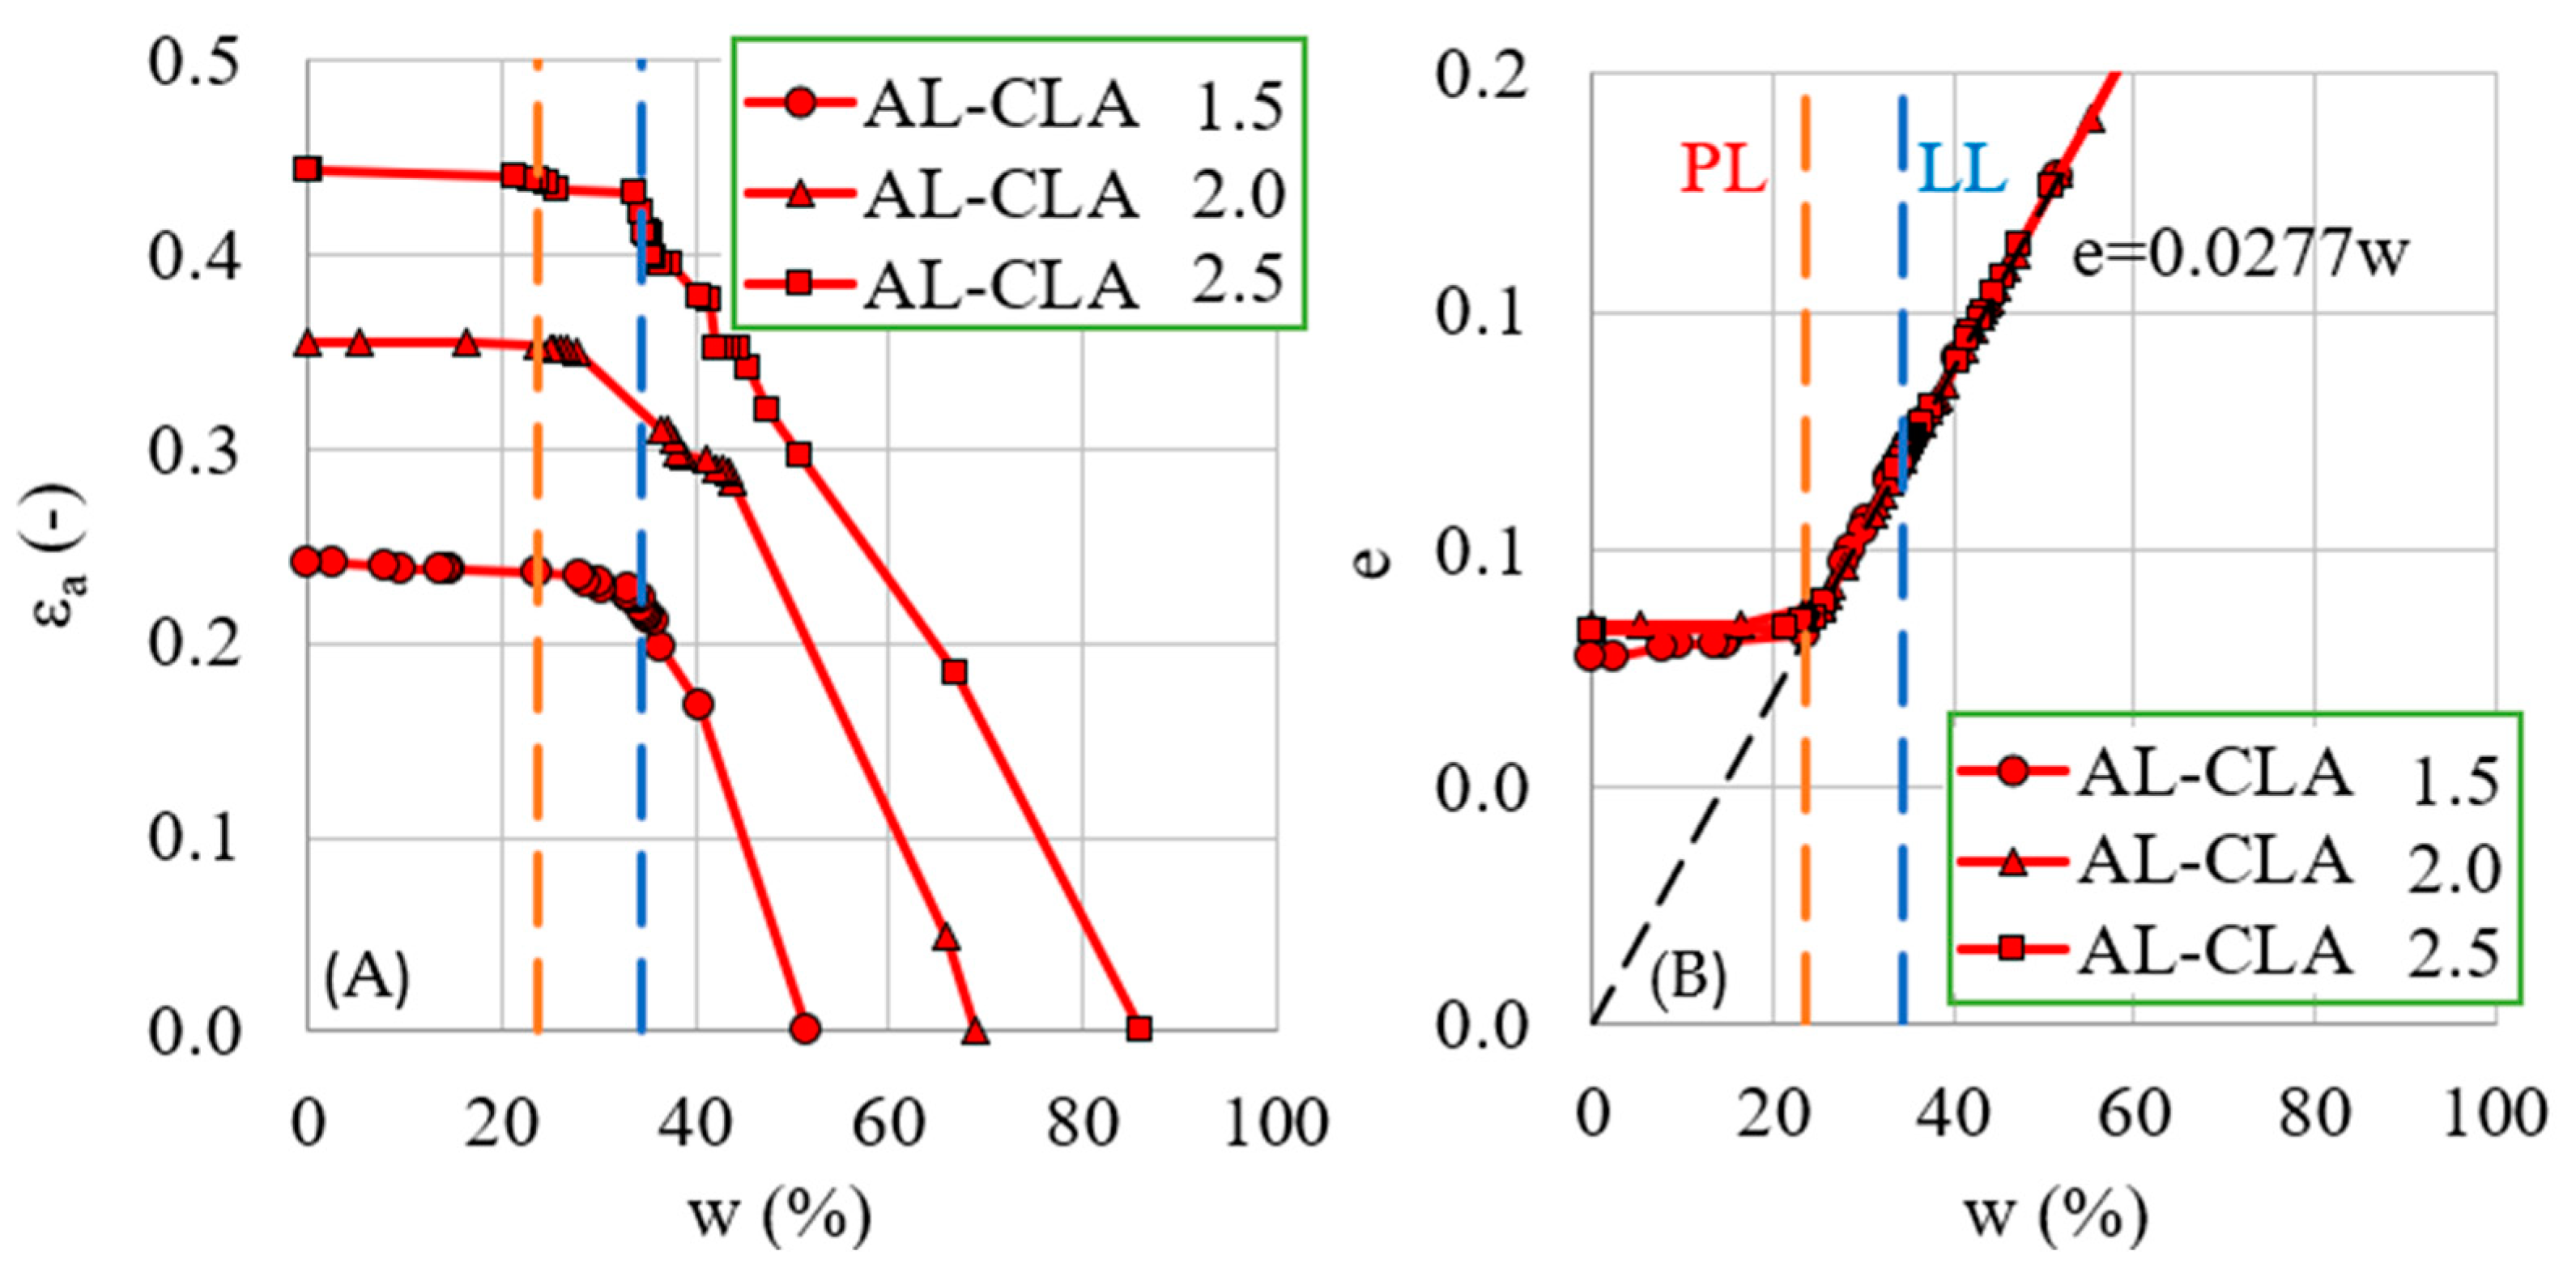
At the end of the test, the sample is oven dried to obtain the dry unit weight of solid particles γd. All the recorded data allow for the definition of state parameters as the water content w, degree of saturation Sr, void ratio e, unit weight γ and axial deformation εa. So, it is possible to illustrate the dewatering process using different graphs versus time such as the water content–time, axial deformation–time, void ratio–time or degree of saturation–time. Combining the parameters, the water content–void ratio and water content–axial deformation relationships were also drawn as shown in Figure 10.
The dam sediments tested in Figure 10 had initial water contents of 1.5 LL, 2 LL and 2.5 LL, respectively, indicated as 1.5, 2 and 2.5 in the legend, with LL being the liquid limit (LL = 34%) and PL the plastic limit (PL = 24%) of the sediments concerned. On the εa–w chart, a negative slope was observed at the start of the test in the linear part. The equation of this corresponding line at the beginning of the test is written as the following [22]:
εa = γs (w0 − w)/3 (1 + e0) Sr γw
where γs is the specific weight, γw is the unit weight of water, w0 is the initial water content and e0 is the initial void ratio. High-water sediments, as shown in Figure 10 for dam sediments, have large axial deformations and significant decreases in water content. These parameters are stabilized when water content approaches LL values and become constant beyond the plastic limit PL. Sediments tested in the NADT showed similar chart behavior but they did not have the same ability to dewater due to intrinsic properties. From these observations, it will be important in practice (i) to define a natural dewatering ability criterion for sediments and (ii) to determine at what moment it is necessary to remove sediments deposited either to accelerate dewatering or to shovel them for transportation.

2.3. Laboratory Automated Dewatering Test

An automated natural dewatering system (ANDS) was installed in the laboratory. It allowed for the study of dewatering on a representative volume of fine sediments (maximal diameter dmax < 2 mm), depending on the size of the metallic sieve (diameter d, height h) used as a bucket filled with the sediments on a draining liner at the bottom. Draining water was collected in a closed plastic bottle that was placed on a balance (see Figure 11). Successive automatic weighing at a rate of 1 h was recorded as the temperature and relative humidity. All quantities of drained DW, evaporated water EW and water in sediment SW were deduced. The initial water content of sediment was known with the geotechnical properties of the sediment tested.
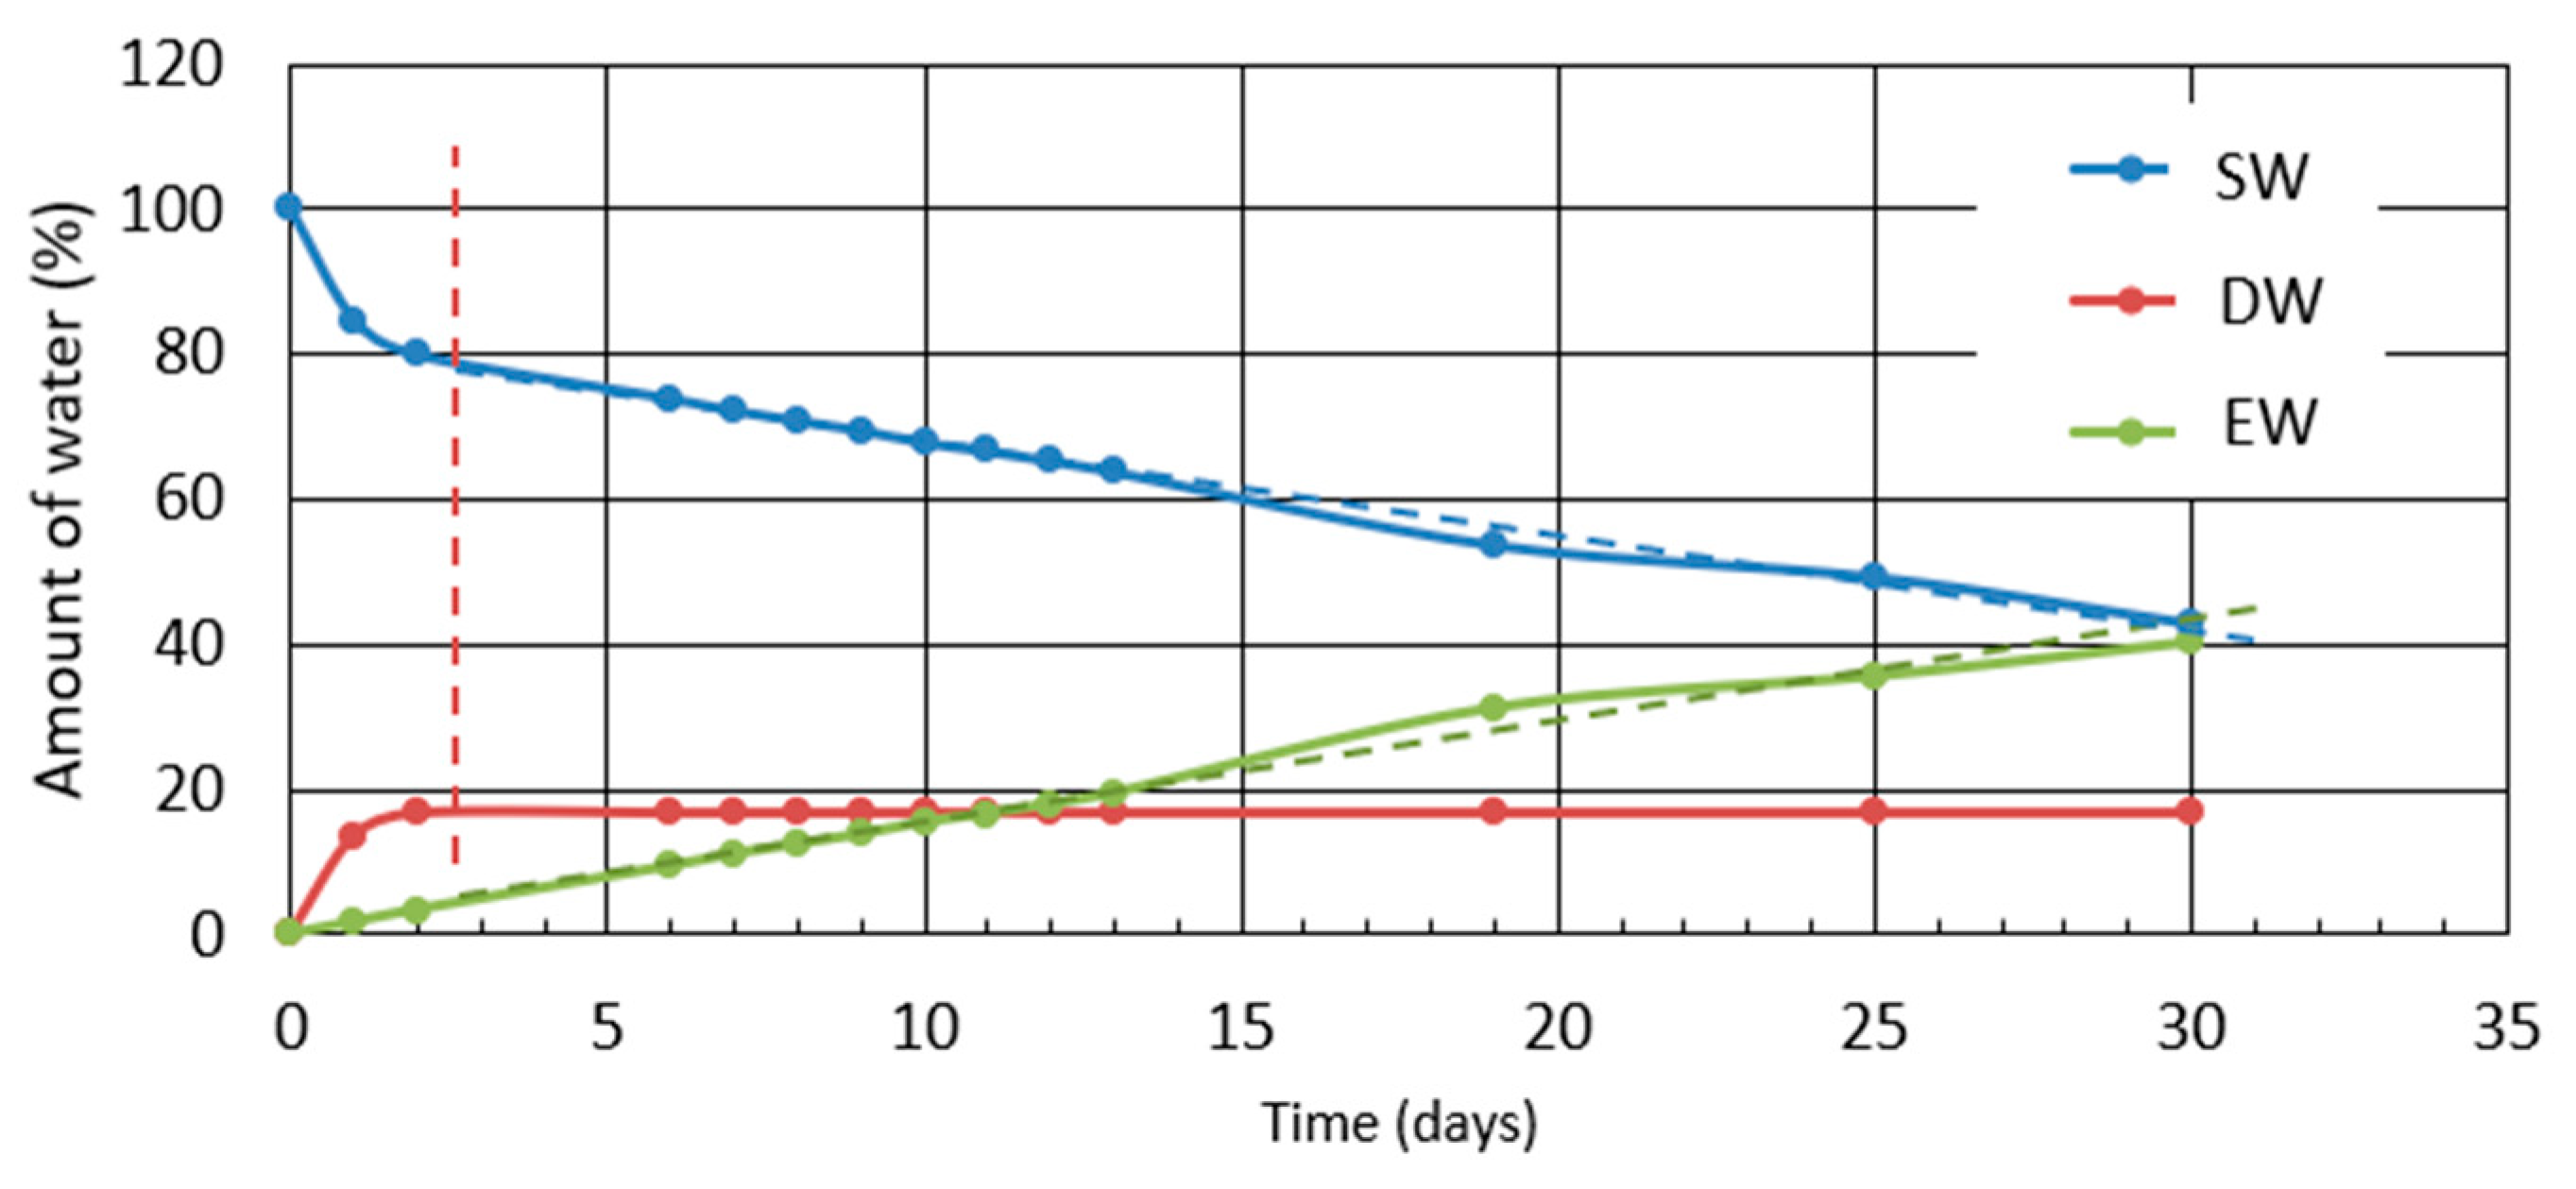
The typical results of this test have concerned the recorded data as the different amounts of water with time, i.e., period of testing. As shown in Figure 11, for a reservoir sediment with an initial water content of 2 LL (LL = 35%), the beginning of the ANDS test was governed by the drainage (DW). Drainage started at the beginning of the test and stopped after 2.5 days, reducing to nearly 20% of water. The duration of drainage was long and depended on the texture of sediments. Evaporation also took place and controlled the dewatering until the end of the test. Usually, evaporation evolves linearly for different types of sediments. Water in sediments after the drainage period decreases constantly.
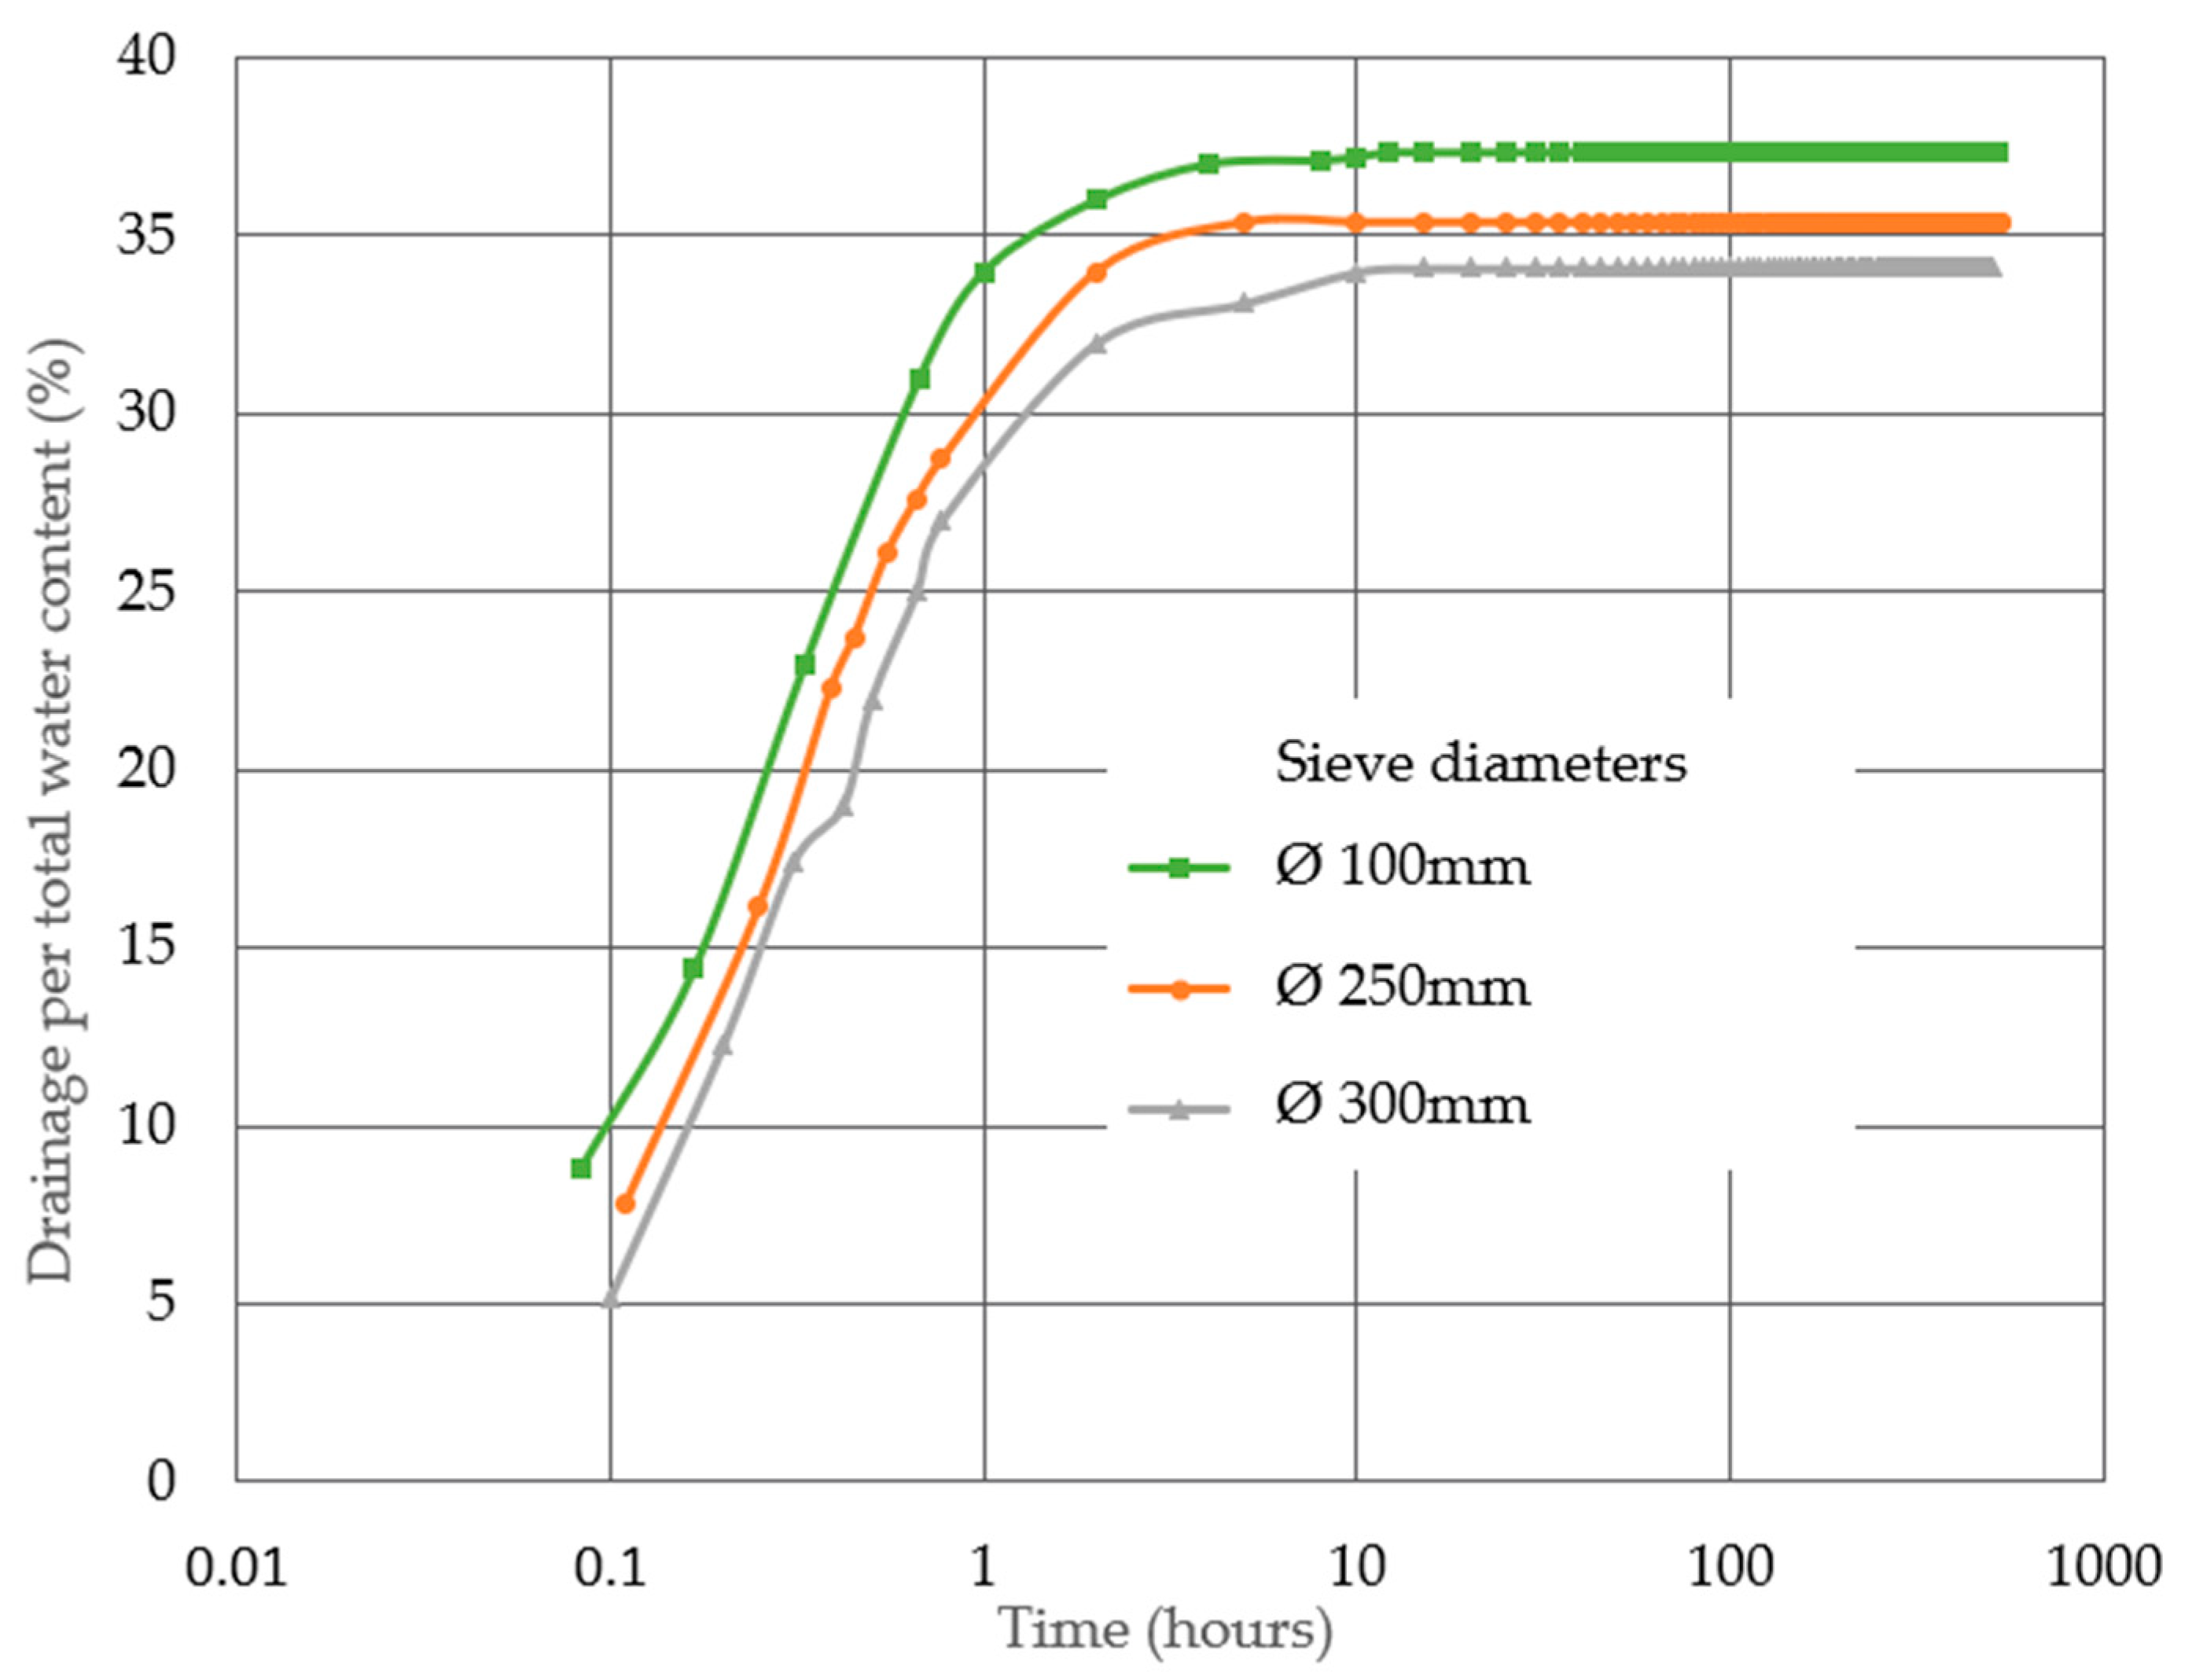
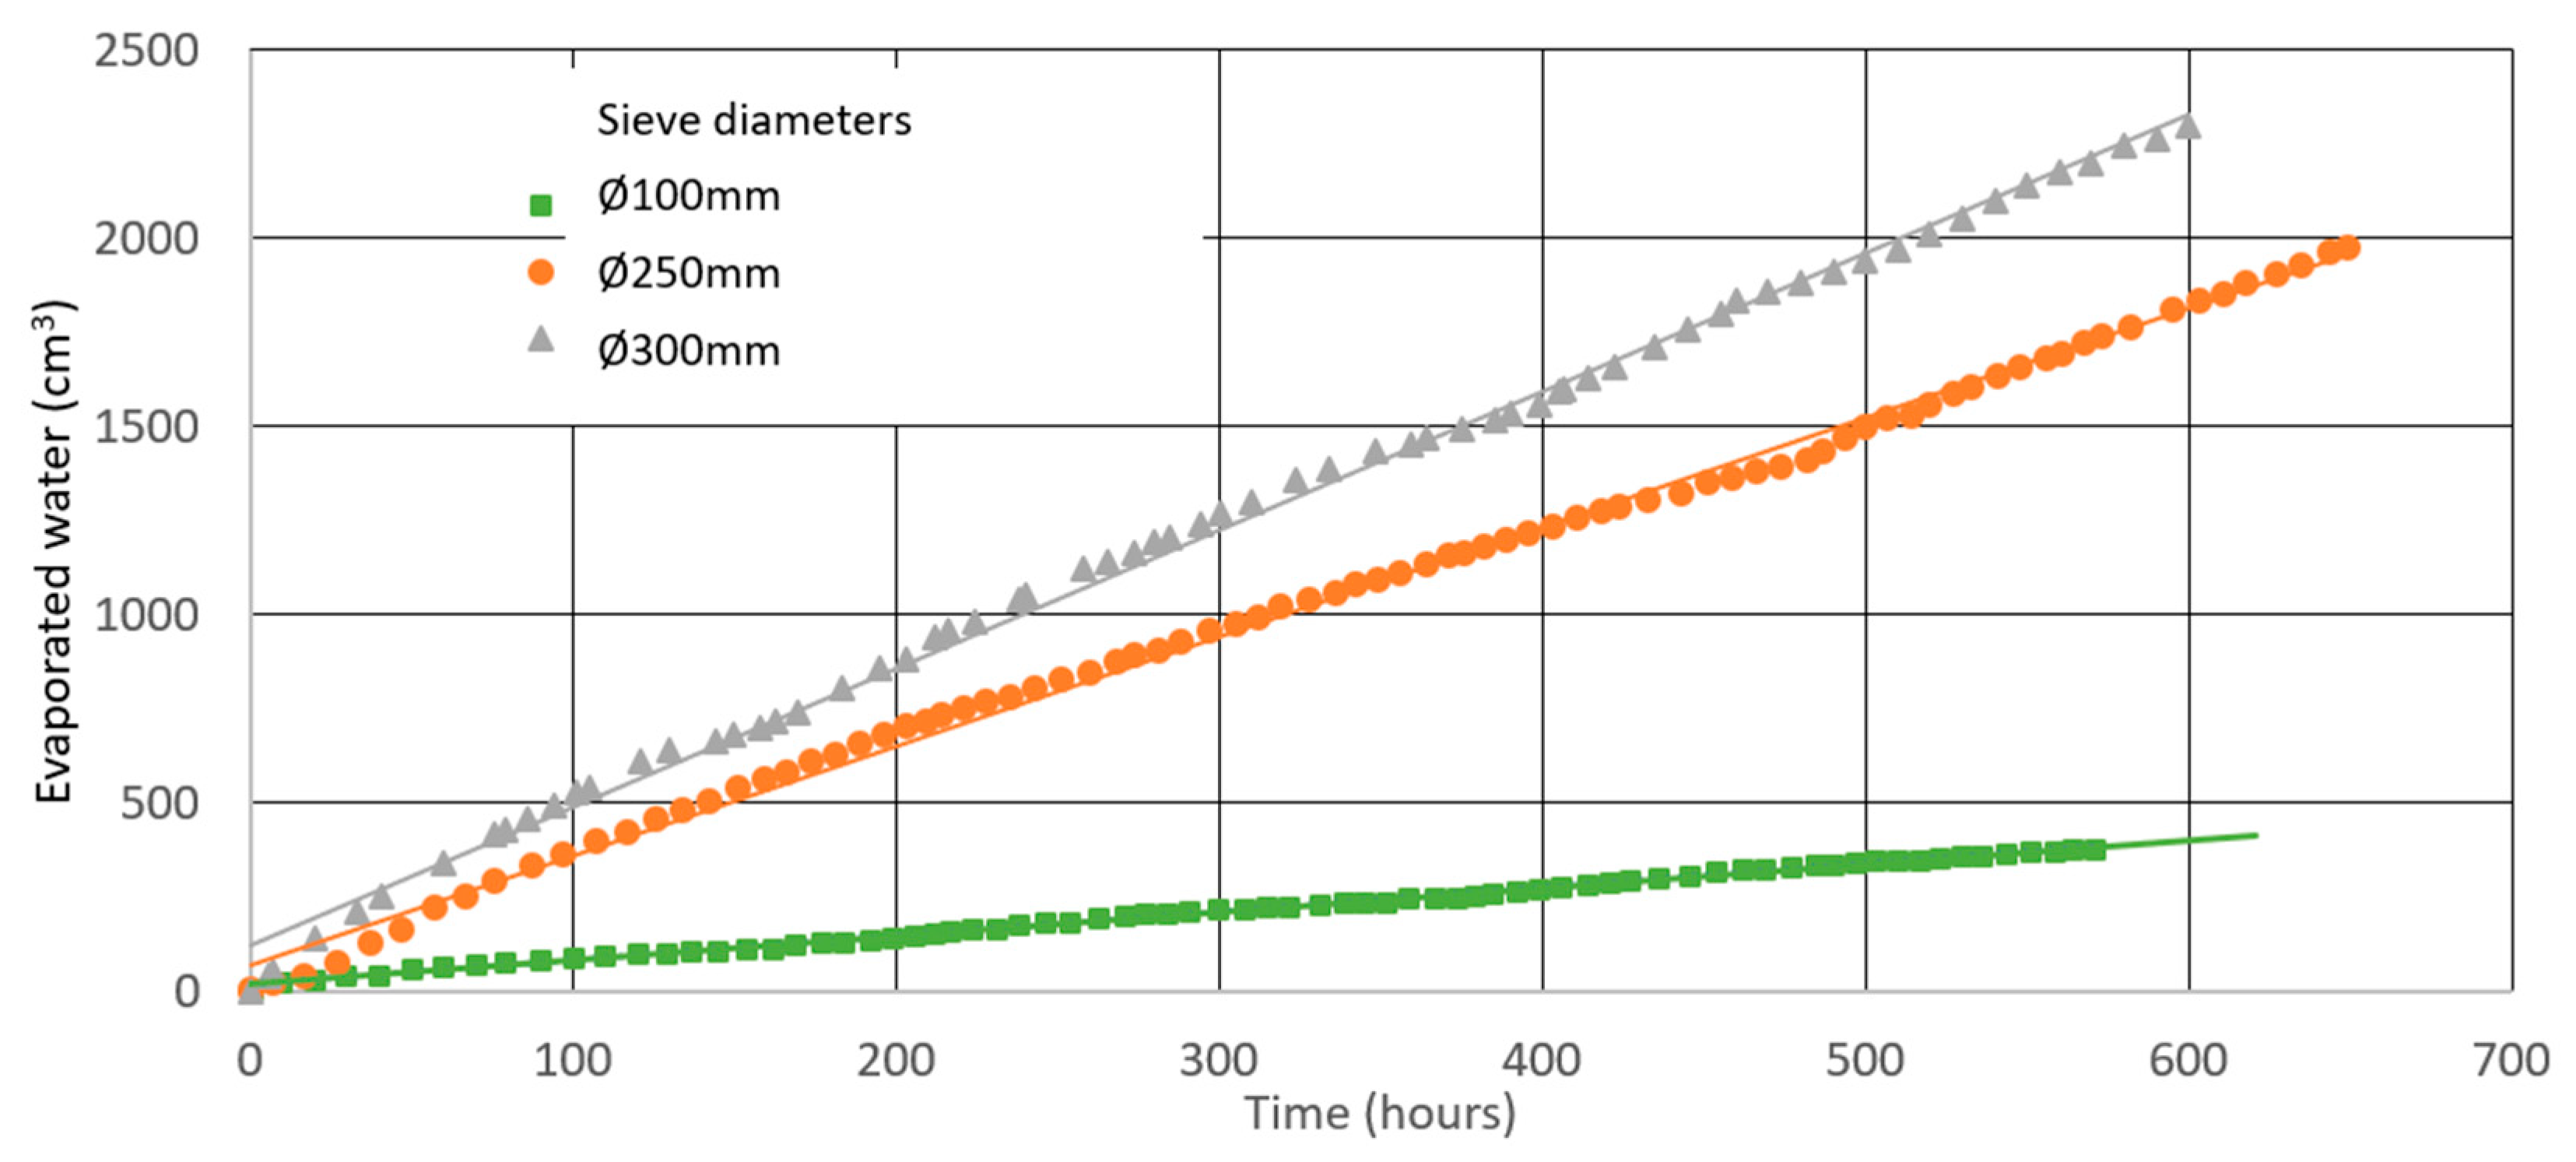
Drainage caused a reduction in the total water content as shown in Figure 12. If tests were performed in different sieves with variable diameters (d) and the following test conditions, the same height (h) of sediments, same initial water content and same ambient temperature and relative humidity, it was observed that drainage per total water content was almost the same for all sieves (see Figure 13). Considering the same ANDS tests, it was observed that weight loss by evaporation was linear with time, depending on the ambient conditions and the diameter of the sieves, i.e., the surface offered for evaporation. The rate of evaporation for the different sieves increased as the diameters also increased, as illustrated in Figure 14.

2.4. Comments on Water Evaporation Laws

From Figure 14, it was possible to determine the potential of evaporation POE, i.e., the weight loss per surface available for evaporation. It is expressed in mm. For another alpine dam sediment, tested with the same sieves used for the sediment of the port of Cherbourg (France), the typical results versus time are presented in Figure 15. It can be seen that the potential of evaporation of all three different sizes of sieves was constant around 0.018 mm/h. These observations were made of other sediments [6,7].
Rohwer’s model [7,23,24] and Penman’s model [25] are proposed to predict the potential of evaporation using Equations (2) and (3), respectively.
POE = 0.296 e x p ( 17.27 T 237.3 + T ) ( 1 H r )
where POE is in mm/day and temperature T in °C, and Hr is the relative humidity. In Rohwer’s model, the only values that are required are temperature and humidity.
POE = mR n   +   ρ a c p ( δ e ) g a λ v ( m   +   γ )
where POE is in kg.m−2.s−1 ≈ mm.s−1, m is the slope of the saturating steam pressure curve (Pa.K−1), Rn is the net irradiance (W.m−2), ρa is the air density (kg.m−3), cp is the thermal capacity of air (J.kg−1.K−1), ga is the momentum surface aerodynamic conductance (m.s−1), δe is the vapor pressure deficit (Pa), λv is the latent heat of vaporization (J.kg−1), and γ is the psychrometric constant (Pa.K−1).
The potential of evaporation measured for the alpine dam sediment from the Maurienne Valley (France) with the same three sieves having different diameters is presented in Figure 15. In this figure, the two theoretical models were applied according to the ANDS test conditions. The results showed that Penman’s model overestimated the potential of evaporation while Rohwer’s was in accordance with the measured values. These models seemed to correctly approach the evaporation behavior of sediments during laboratory testing.

2.5. Mechanical Dewatering Laboratory Press Machine

A laboratory multi-disc roller separator for testing its ability to dewater high-water sediments is presented. It is a small-scale DKS® model from Kendensha and Co. (Shimane, Japan, [12]) and was provided by Atlantique Industrie (Ancenis, France). This laboratory machine was installed in Laboratory M2C 6143 CNRS at the University of Caen Normandie. It was possible to test all types of sludges, but mainly the high-water sediments for research and industrial activities. This model was designed after the Volute models (Amcon Inc., Yokohama, Japan, [16]), and it is based on the coupling draining and pressing of flocculated sludge. It is therefore composed of a drip table that transports the flocculated sediment using oval wheels arranged perpendicularly to each other. Then, the flocculated sediment arrives under a pressing plate where it is pressed and dewatered depending on the pressure applied, before being taken out in the form of a cake. The prototype of the KDS® sludge press used in the laboratory consists of a table with oscillating bars that are 47 cm long and 23 cm wide. It is equipped with six rows of elliptical discs and a pressure plate that is 29 cm long and 23 cm wide. Each elliptical disc has a major axis length equal to 11 cm and a minor axis length equal to 4.6 cm. The separation between the discs is 0.1 cm ± 0.01 cm. The laboratory prototype has a total height of 1.5 m. The flocculation tank has an approximate volume of 13 L. Figure 16 shows in detail how the laboratory model works.
Various muds and sediments were tested in the laboratory on this prototype. The complete procedure included several steps, as shown in Figure 17.
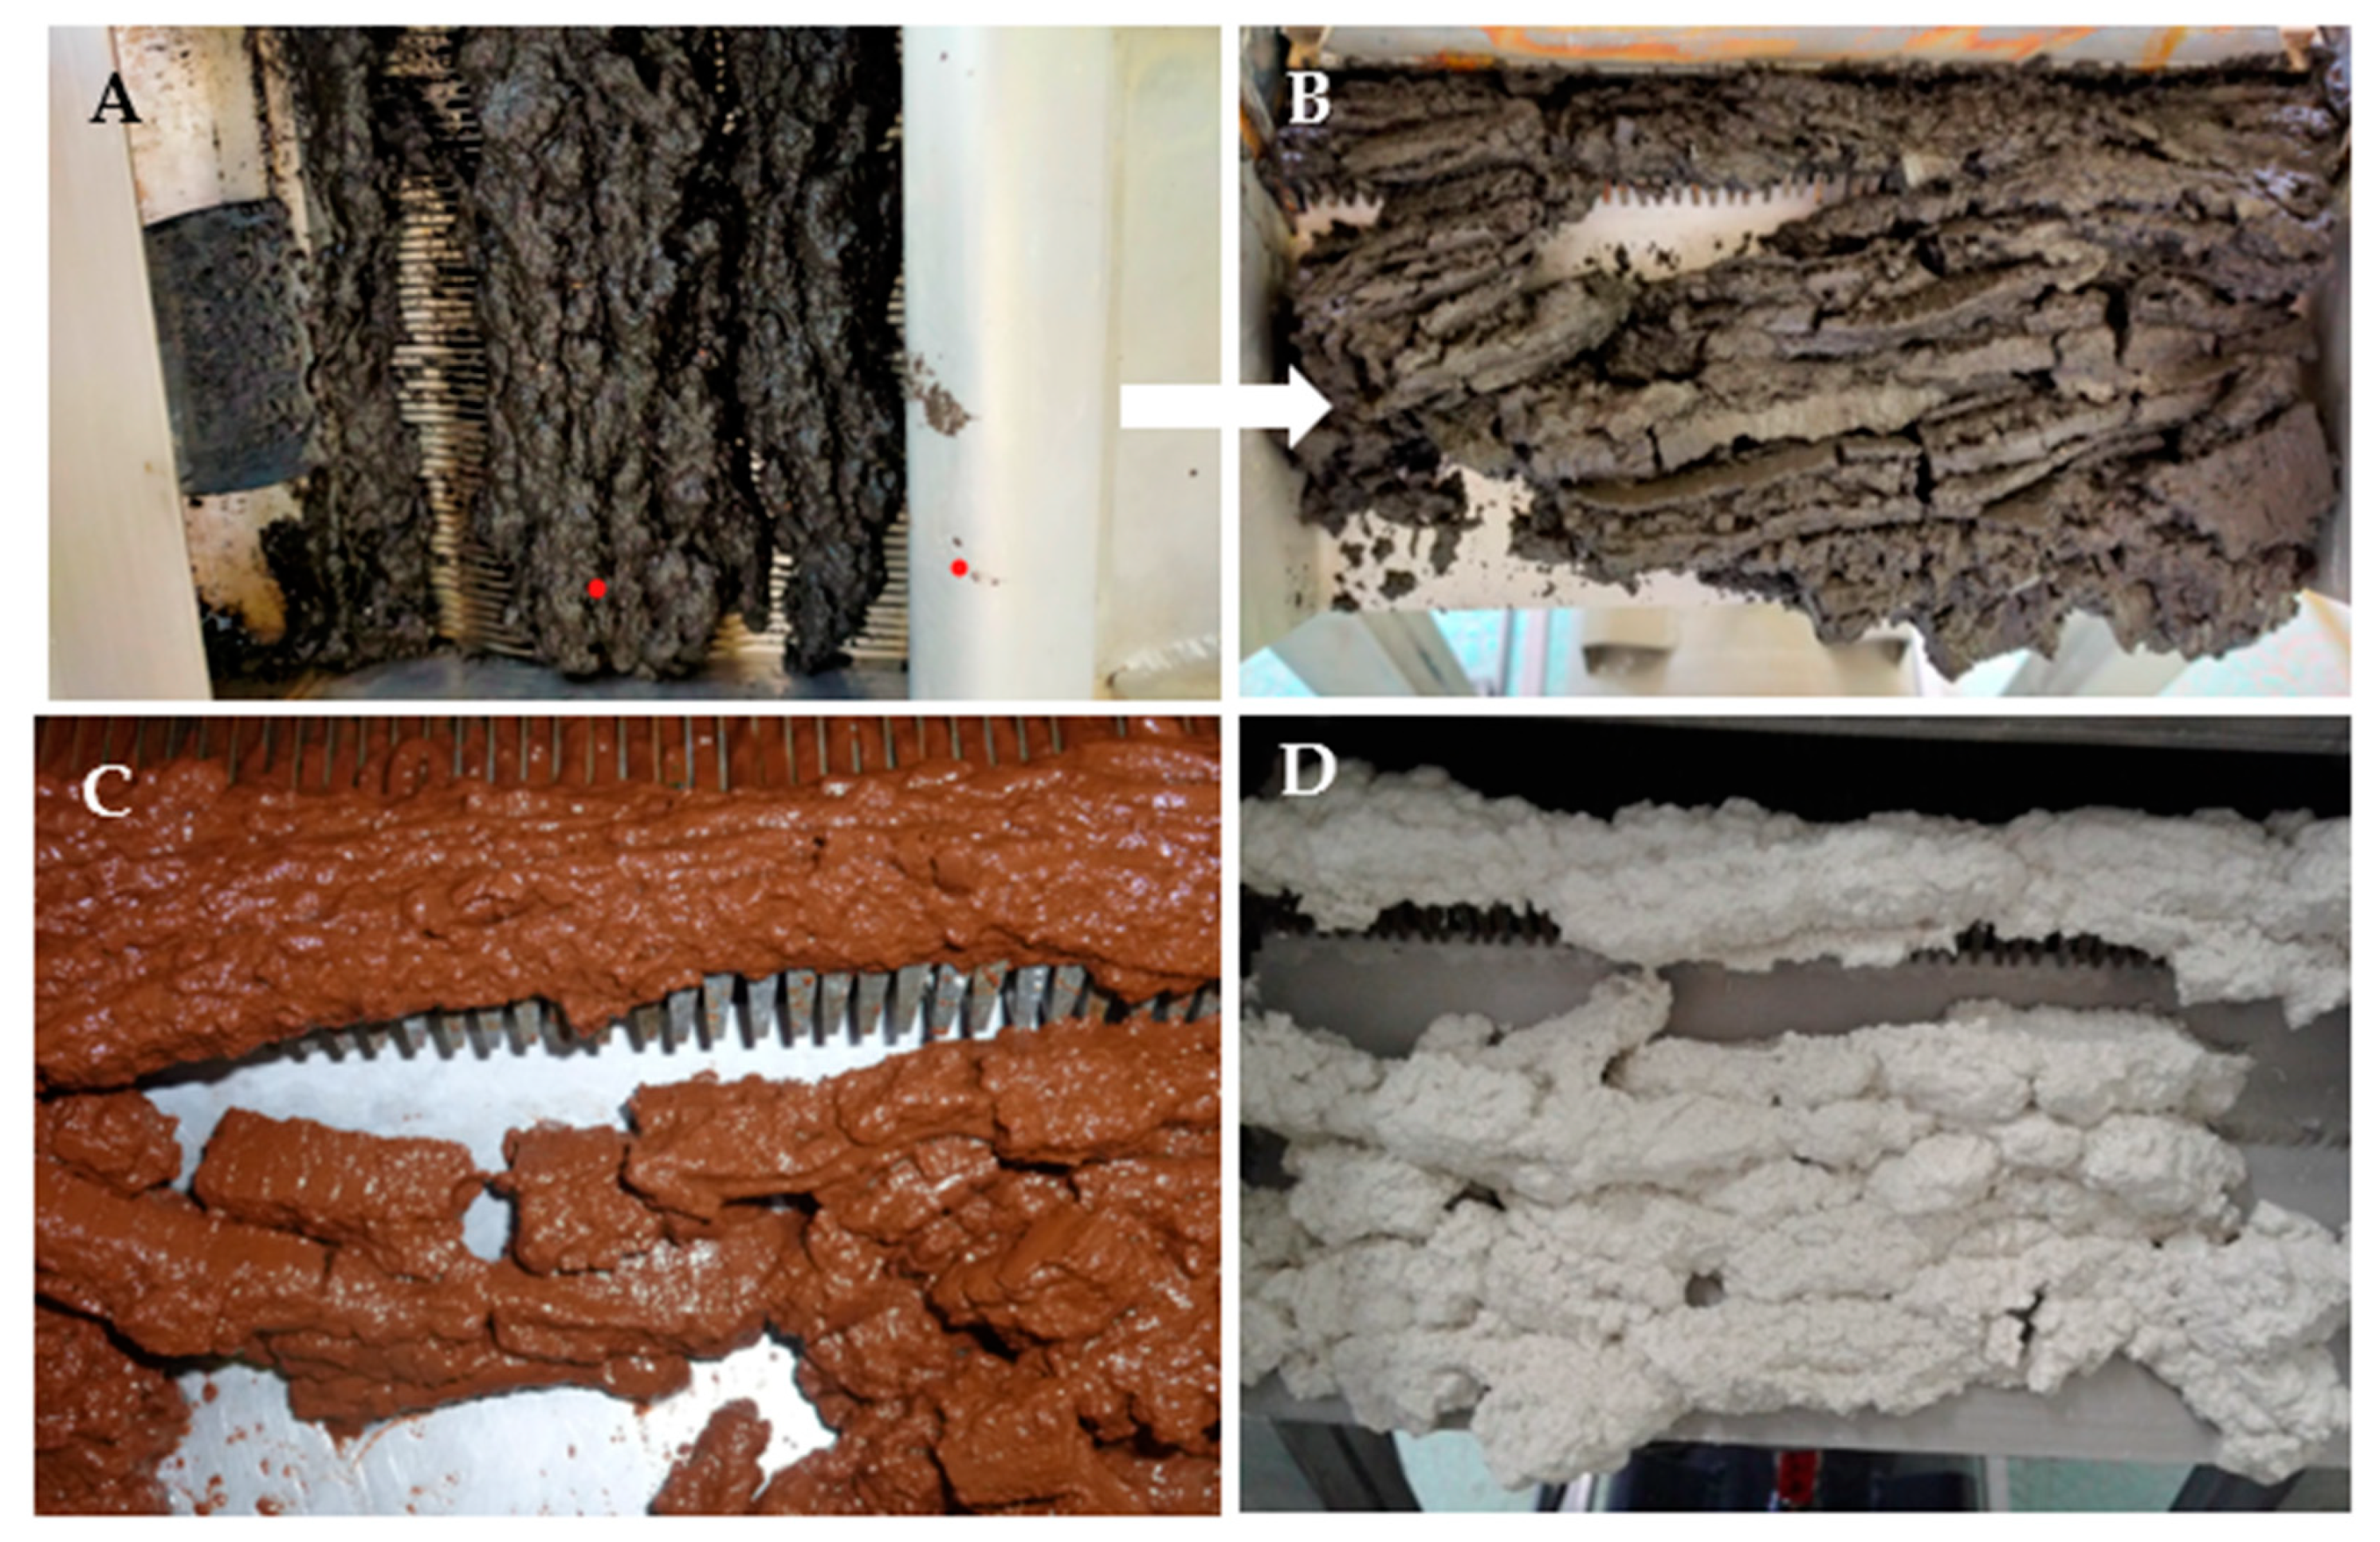
A minimum characterization of the sediment or sludge to be tested was useful in selecting the type of flocculent. The grain size distribution, texture, chemical composition, organic matter and contaminants constituted the minimum of this characterization. The choice of flocculent (anionic, cationic, neutral, biodegradable, emulsion, etc.) was made on small volumes of sludge at their initial dredging water content using the jar test or equivalent. This was followed by the preparation of the necessary volume of flocculated sediment or sludge dosed with the selected flocculent for the mechanical dewatering test. Once the flocculated sediment or sludge had been discharged, it passed over the drip table and was transported by oval multi-discs under the pressure plate to be dewatered. The dewatered sediments or sludge were then output in the form of cakes. These successive passages are illustrated for a canal sediment (Antananarivo, Madagascar, (Figure 18A,B), for industrial metal oxide sludge (Figure 18C) and for laboratory kaolinite (Figure 18D [6]).
Whatever the type of dewatering process used—natural or mechanized—the physical, chemical and mineralogical properties of sediments are the focus of preliminary investigations within a well-defined legislative framework in each country in order to obtain dredging and deposit authorizations, as mentioned at the end of Section 2.1. These properties are essential to the choice of a dewatering process, but more to the study of recycling possibilities. The particle size distribution, texture and organic matter content have an influence on the natural dewatering process and on the choice of flocculants in mechanized dewatering [6].

3. Transportation of Sediments

3.1. Shovelability of Sediments

The transport of sediments either from a dredging site to a disposal site or from a disposal site to a sediment recycling site poses a problem for decision-makers. For the first destination, transporting water is not necessary, and there are costs associated with this transport. The loading process depends on the dredging methods used. At the next destination, there is the problem of reloading the more or less dewatered sediments and the cost of transport. For sustainability and economy, it is recommended to be close to the disposal and reclamation sites. This does not solve the problem of reloading the sediments. This aspect of sediment shovelability has not really been investigated, and it is the subject of the following sections.
As mentioned above, sediments need to be shoveled in order to be transported and collected at a storage and/or recovery site. Assuming that dewatering techniques have been overcome and adapted to sediments, the question facing managers is the following: at what water content can we expect to shovel and/or load sediments for transportation?
The literature provides few recommendations relating to the concept of the shovelability of sediments. Similarly, no classification associated with water content (w) has been established for sediments. A proposal was made by Wang [26], who defined three categories of water content (low to high) to which could be added compact sediments in the form of blocks (water content w < 30% and dredging sludge for contents above 200%, see Table 3).
The shovelability of sediments depends not only on their consistency but also on their adhesion. The parameters that govern the shovelability are the following:
  • the state parameters of the sediment, see Section 2.2, and mainly the water content w;
  • the consistency of the sediment defined by the Atterberg limits LL and PL;
  • the mechanical properties of the sediment, such as undrained cohesion Su and adhesion.
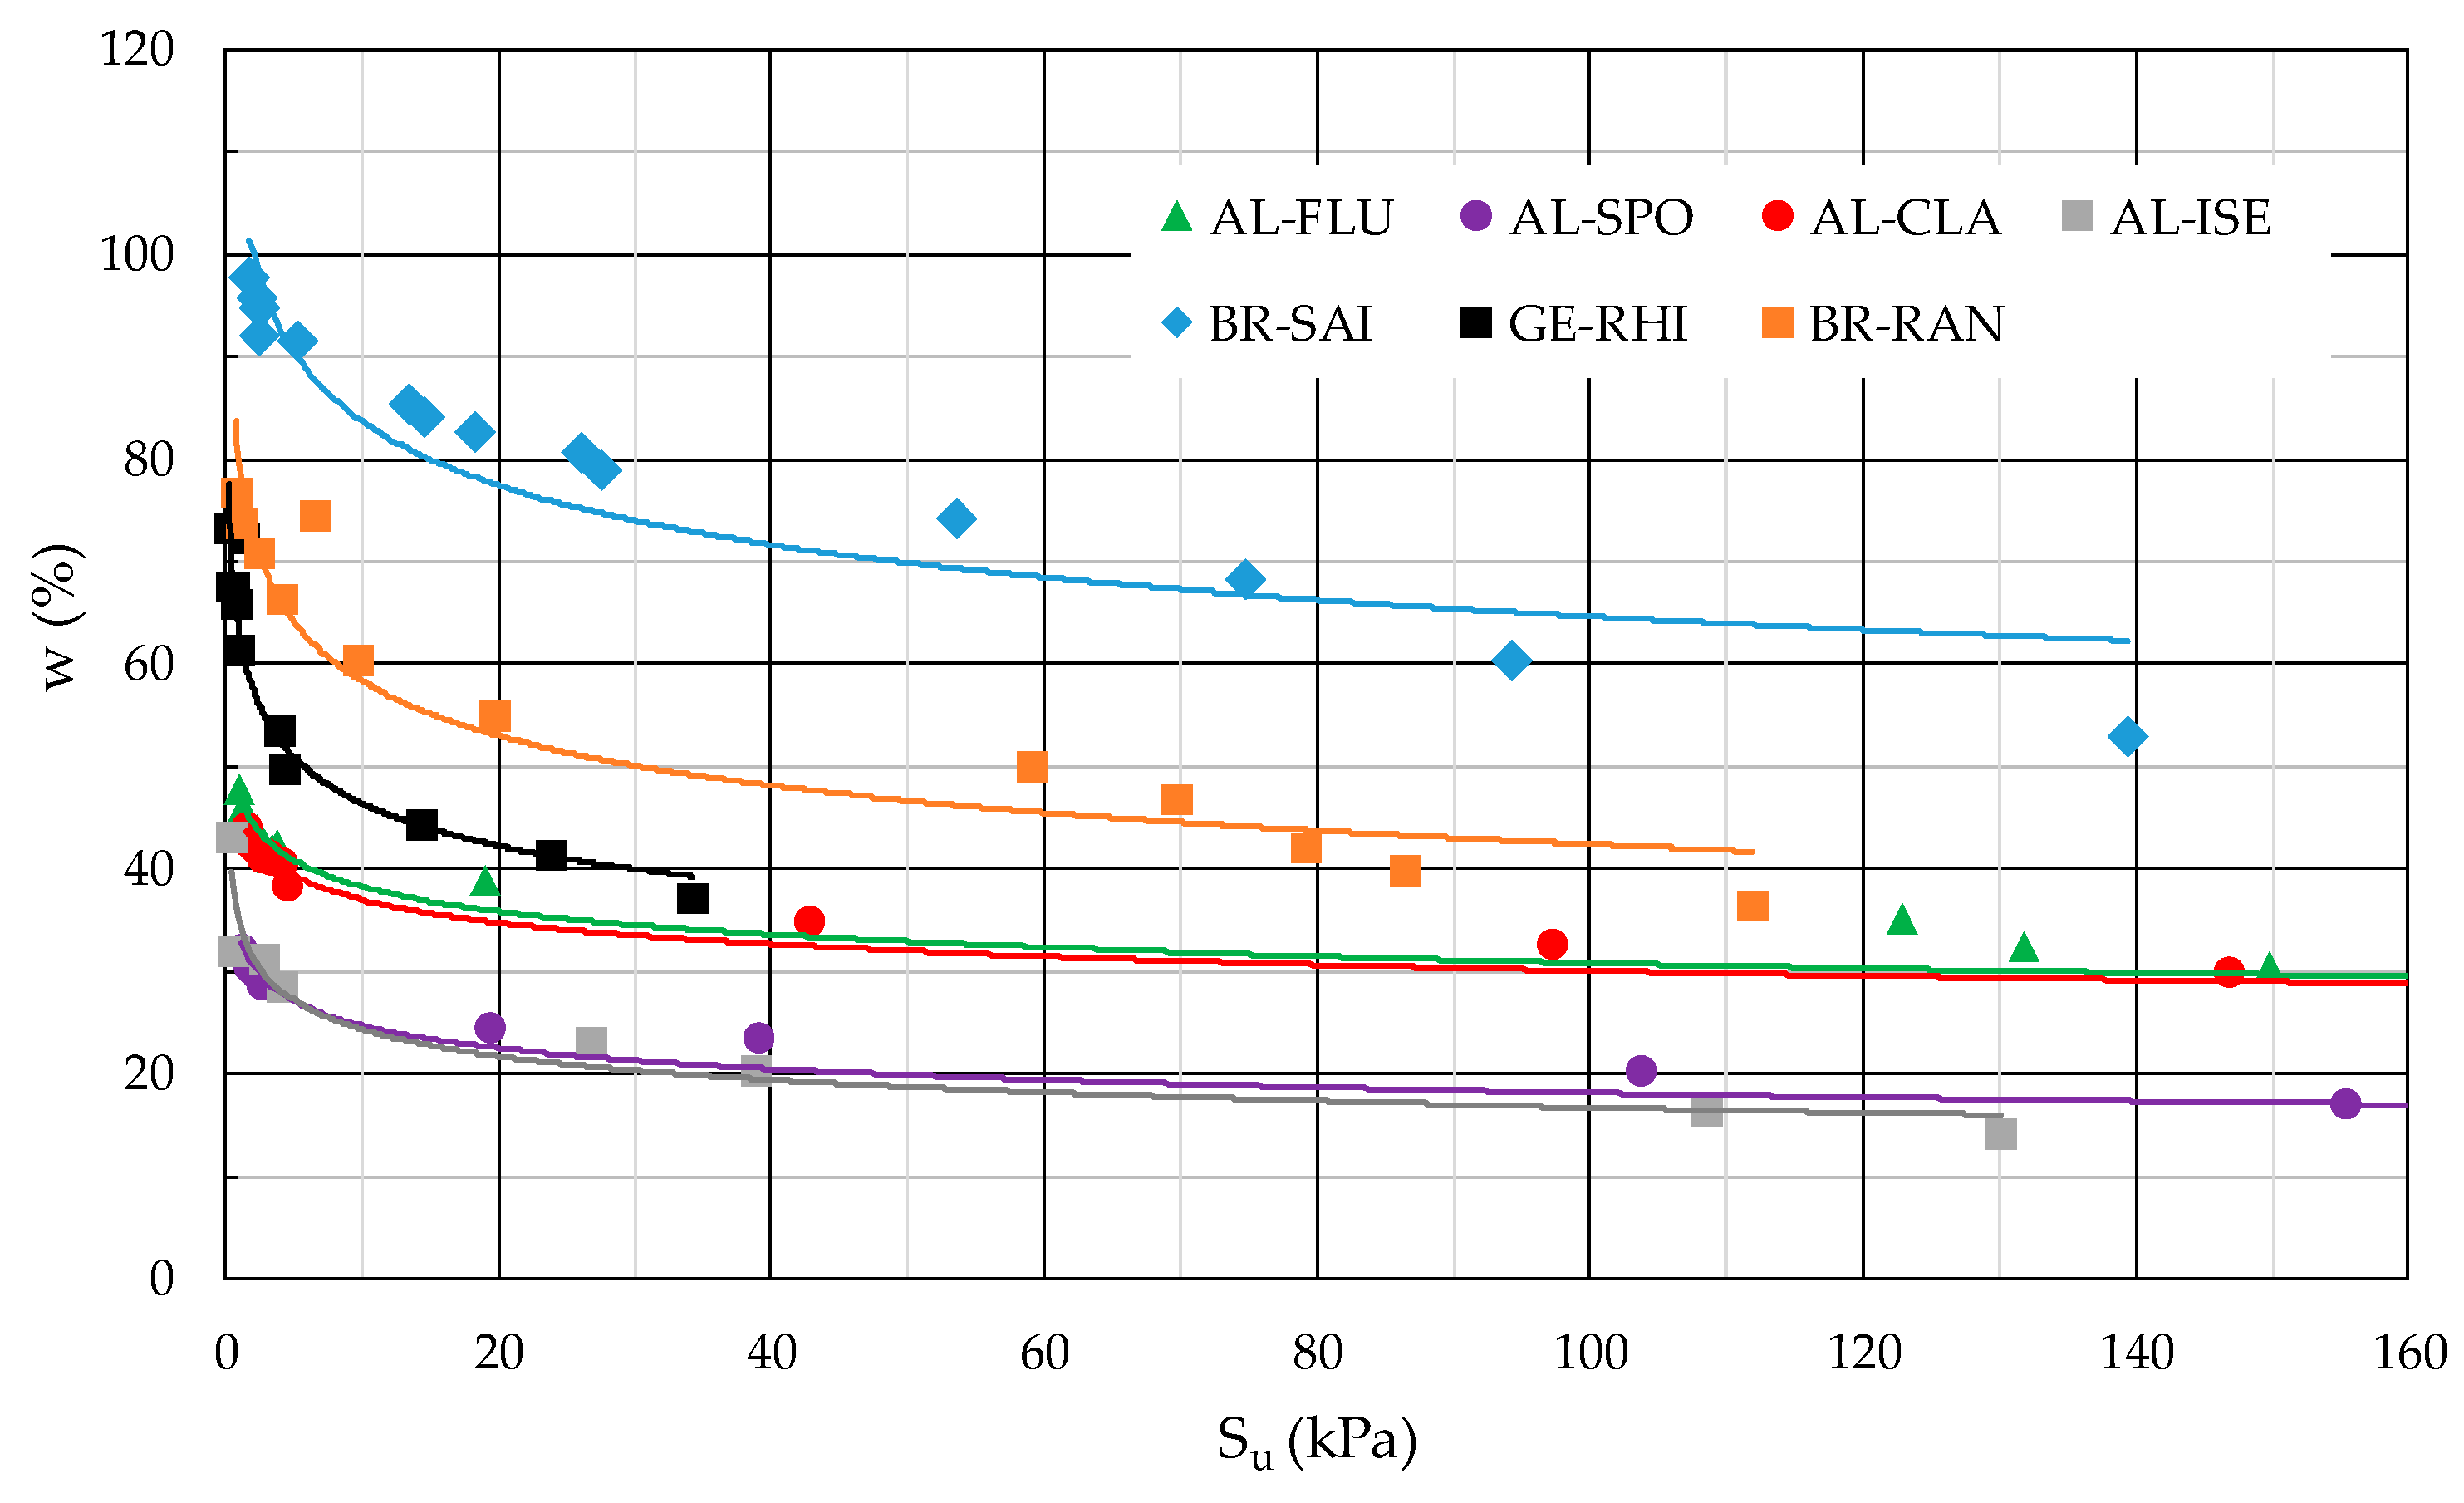
Adhesion can be defined as the moisture content at which soil adheres to the surface of a metal. And in the case of sediment transportation, steel is the metal concerned with loaders. Undrained cohesion Su can be expressed with the sediment water content as shown in Figure 19 for dam sediments. Also, Su can be indirectly related to consistency by measuring the slump of a volume of sediments (cone, truncated cone or cylinder). These parameters have already been used in studies on sediment drying and dewatering [6,7,22], soil transport [27], and the pumpability of stabilizing sediments [26].

3.2. Shovelability Meter

There is no standard test in the literature for define sediment shovelability. While the parameters governing this phenomenon are well identified, no criteria specifying a threshold of shovelability is recommended. The development of a specific shovelability test was based on the knowledge of these parameters, namely the following: the undrained cohesion Su, the slump of a volume of sediment S, the water content w and the sediment adhesion. Measurements of these parameters are usually obtained from conventional geotechnical tests. They are practiced on small-volume sediment samples. The measurement of undrained cohesion is deduced from either the vane shear test or the fall cone test. The latter only indicates the undrained cohesion on the surface but is much more practical than the laboratory vane shear test [28,29,30]. Slump measurement relates to the subsidence of a truncated cone of sediment. The measurement is comparable to that carried out on fresh concrete, even though the cone is smaller but of homothetic dimensions [11,31]. The adhesion of a sediment to a metal support is evaluated by measuring a limit angle β obtained during the rotation of the support when a volume of sediment slides on this same support. This last parameter is linked with the roughness μ of the metallic support and its inclination β. But the initial parameter, which remains constant along these tests and measurements, is the water content w of the sediment, whose geotechnical characteristics are determined beforehand (texture, particle size, limits of liquidity, plasticity [32]). The shovelability test must collect all of these measurements with a simple, repeatable procedure and for a reduced volume of sediment. The test design is illustrated in Figure 20. The procedure is the following: (i) for a sediment’s given water content and type of support, measurements of the slump and the determination of the undrained cohesion Su are performed when the support is horizontal and (ii) then, the support rotates at constant rate until the sliding of the mass of sediments occurs, at which point the limit angle is recorded.
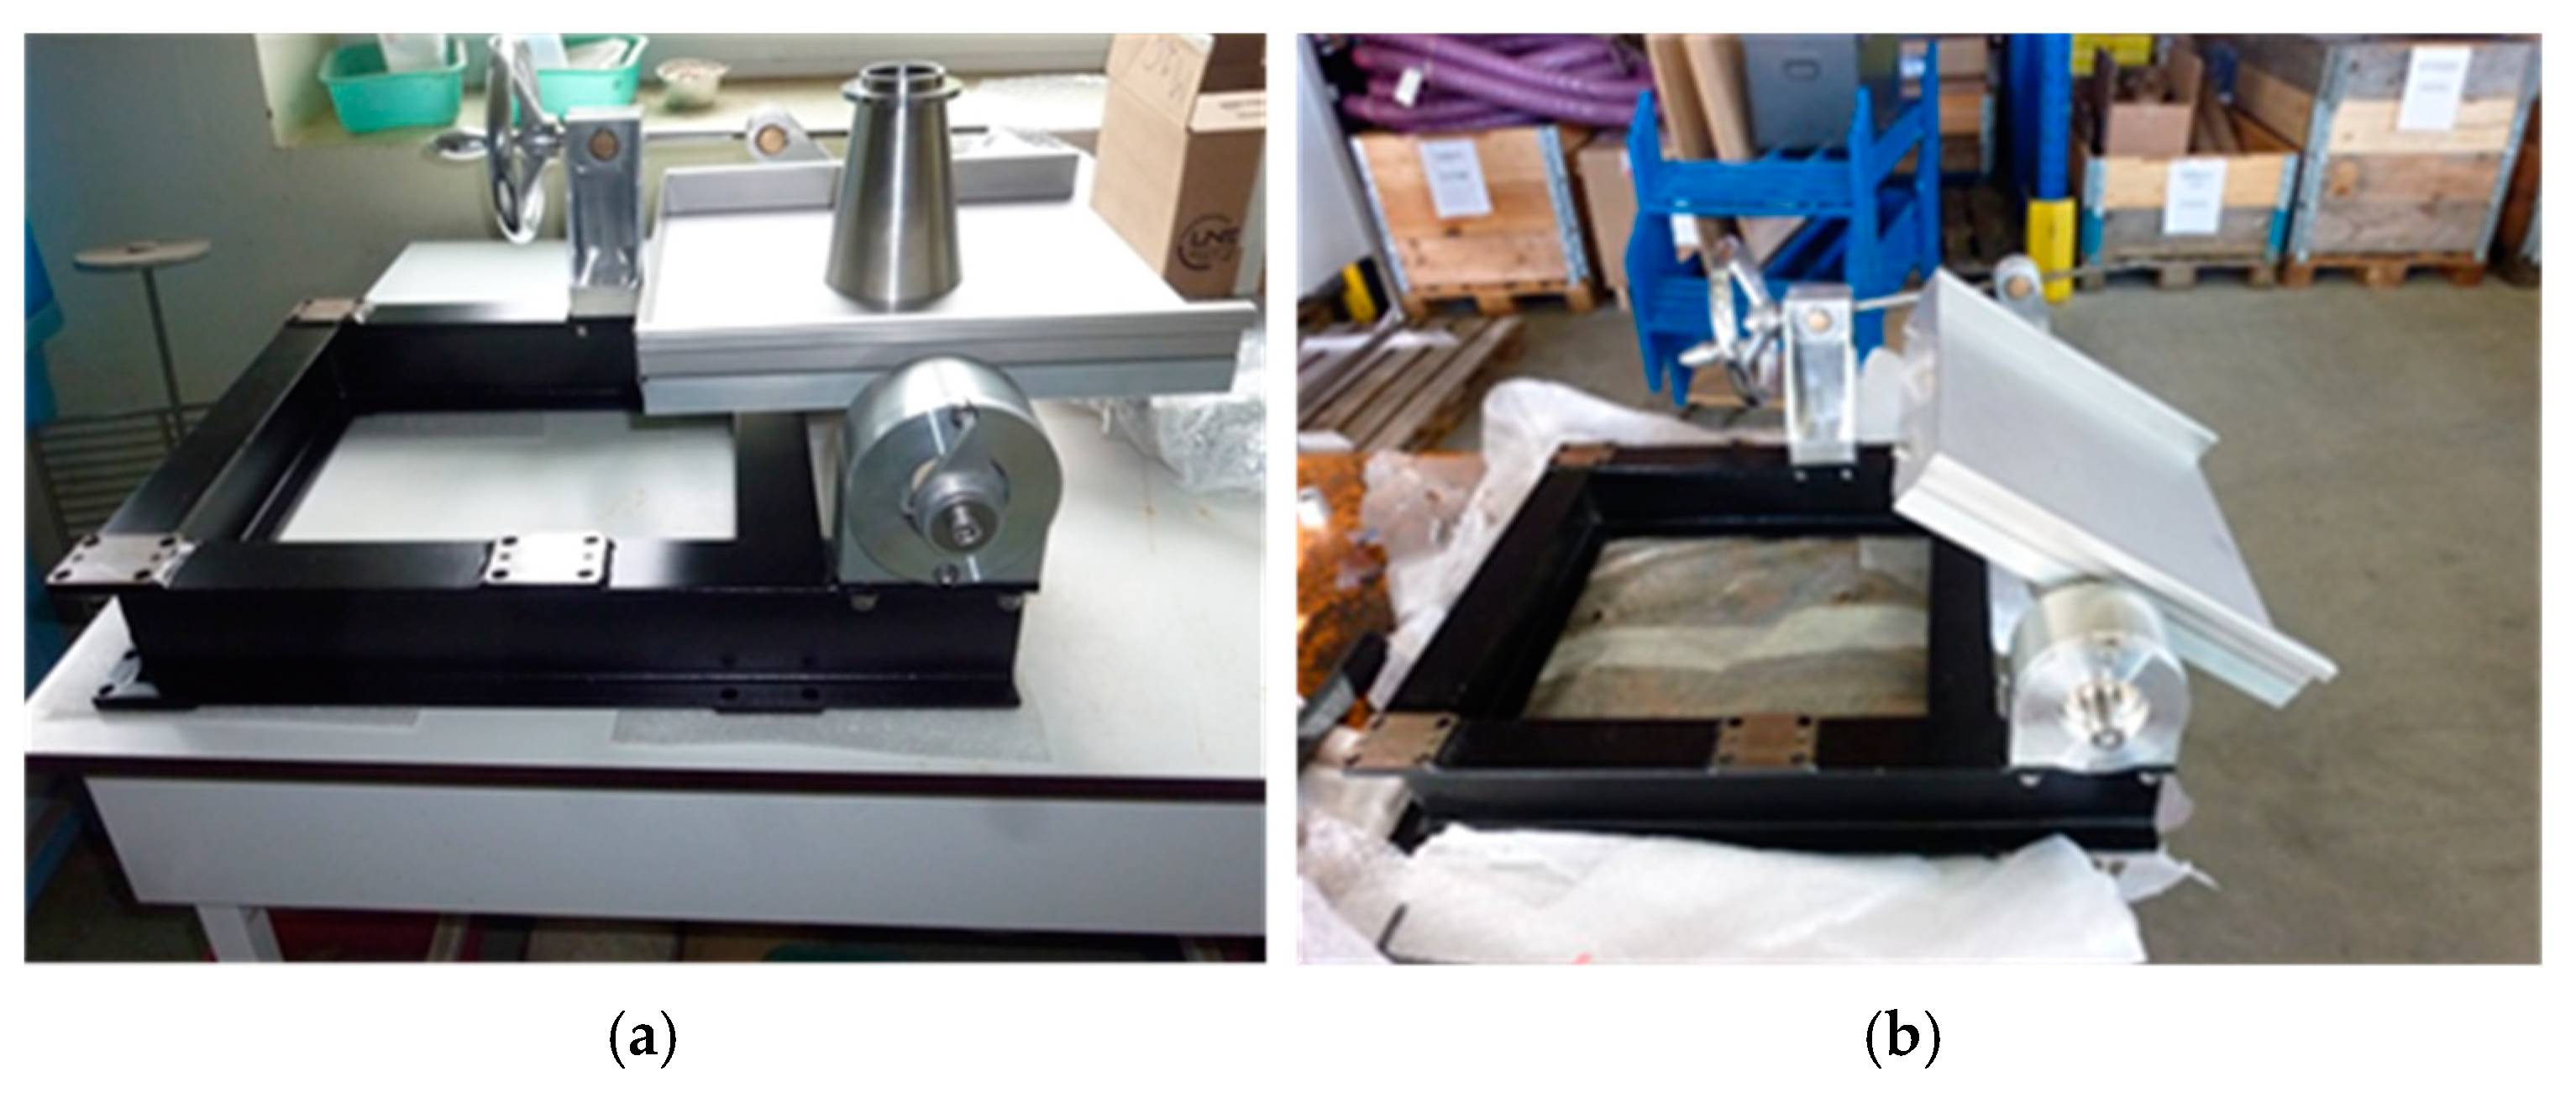
A first prototype in its manual version (Figure 21) was built and used to test different sediments in the laboratory. This test device allows for the study of the shovelability and sliding behavior of sediments according to their consistency. It essentially consists of a support frame with a support (Figure 21a) that can be rotated from a horizontal to a nearly vertical position (Figure 21b). The device being a manual version requires visual reading of the rotation angle, and its accuracy is in the order of one degree. The roughness involved in the adhesion can be simulated by a plate with a particular roughness. For each test, a volume of sediment is placed on a selected plate with a miniature cone (see Figure 21a in the case of a smooth plate).
From these shovelability tests, typical curves were obtained for the same sediment whose water content varied from its dry state to liquid state. This is representative of a sediment wetting cycle. The main typical curves were the following:
  • the slump S versus the water content w, where it was possible to represent the cone base footprint, i.e., average diameter, obtained after the slump versus water content;
  • the undrained cohesion Su (from the vane shear or fall cone test) versus water content w;
  • the limit angle of sliding versus water content.
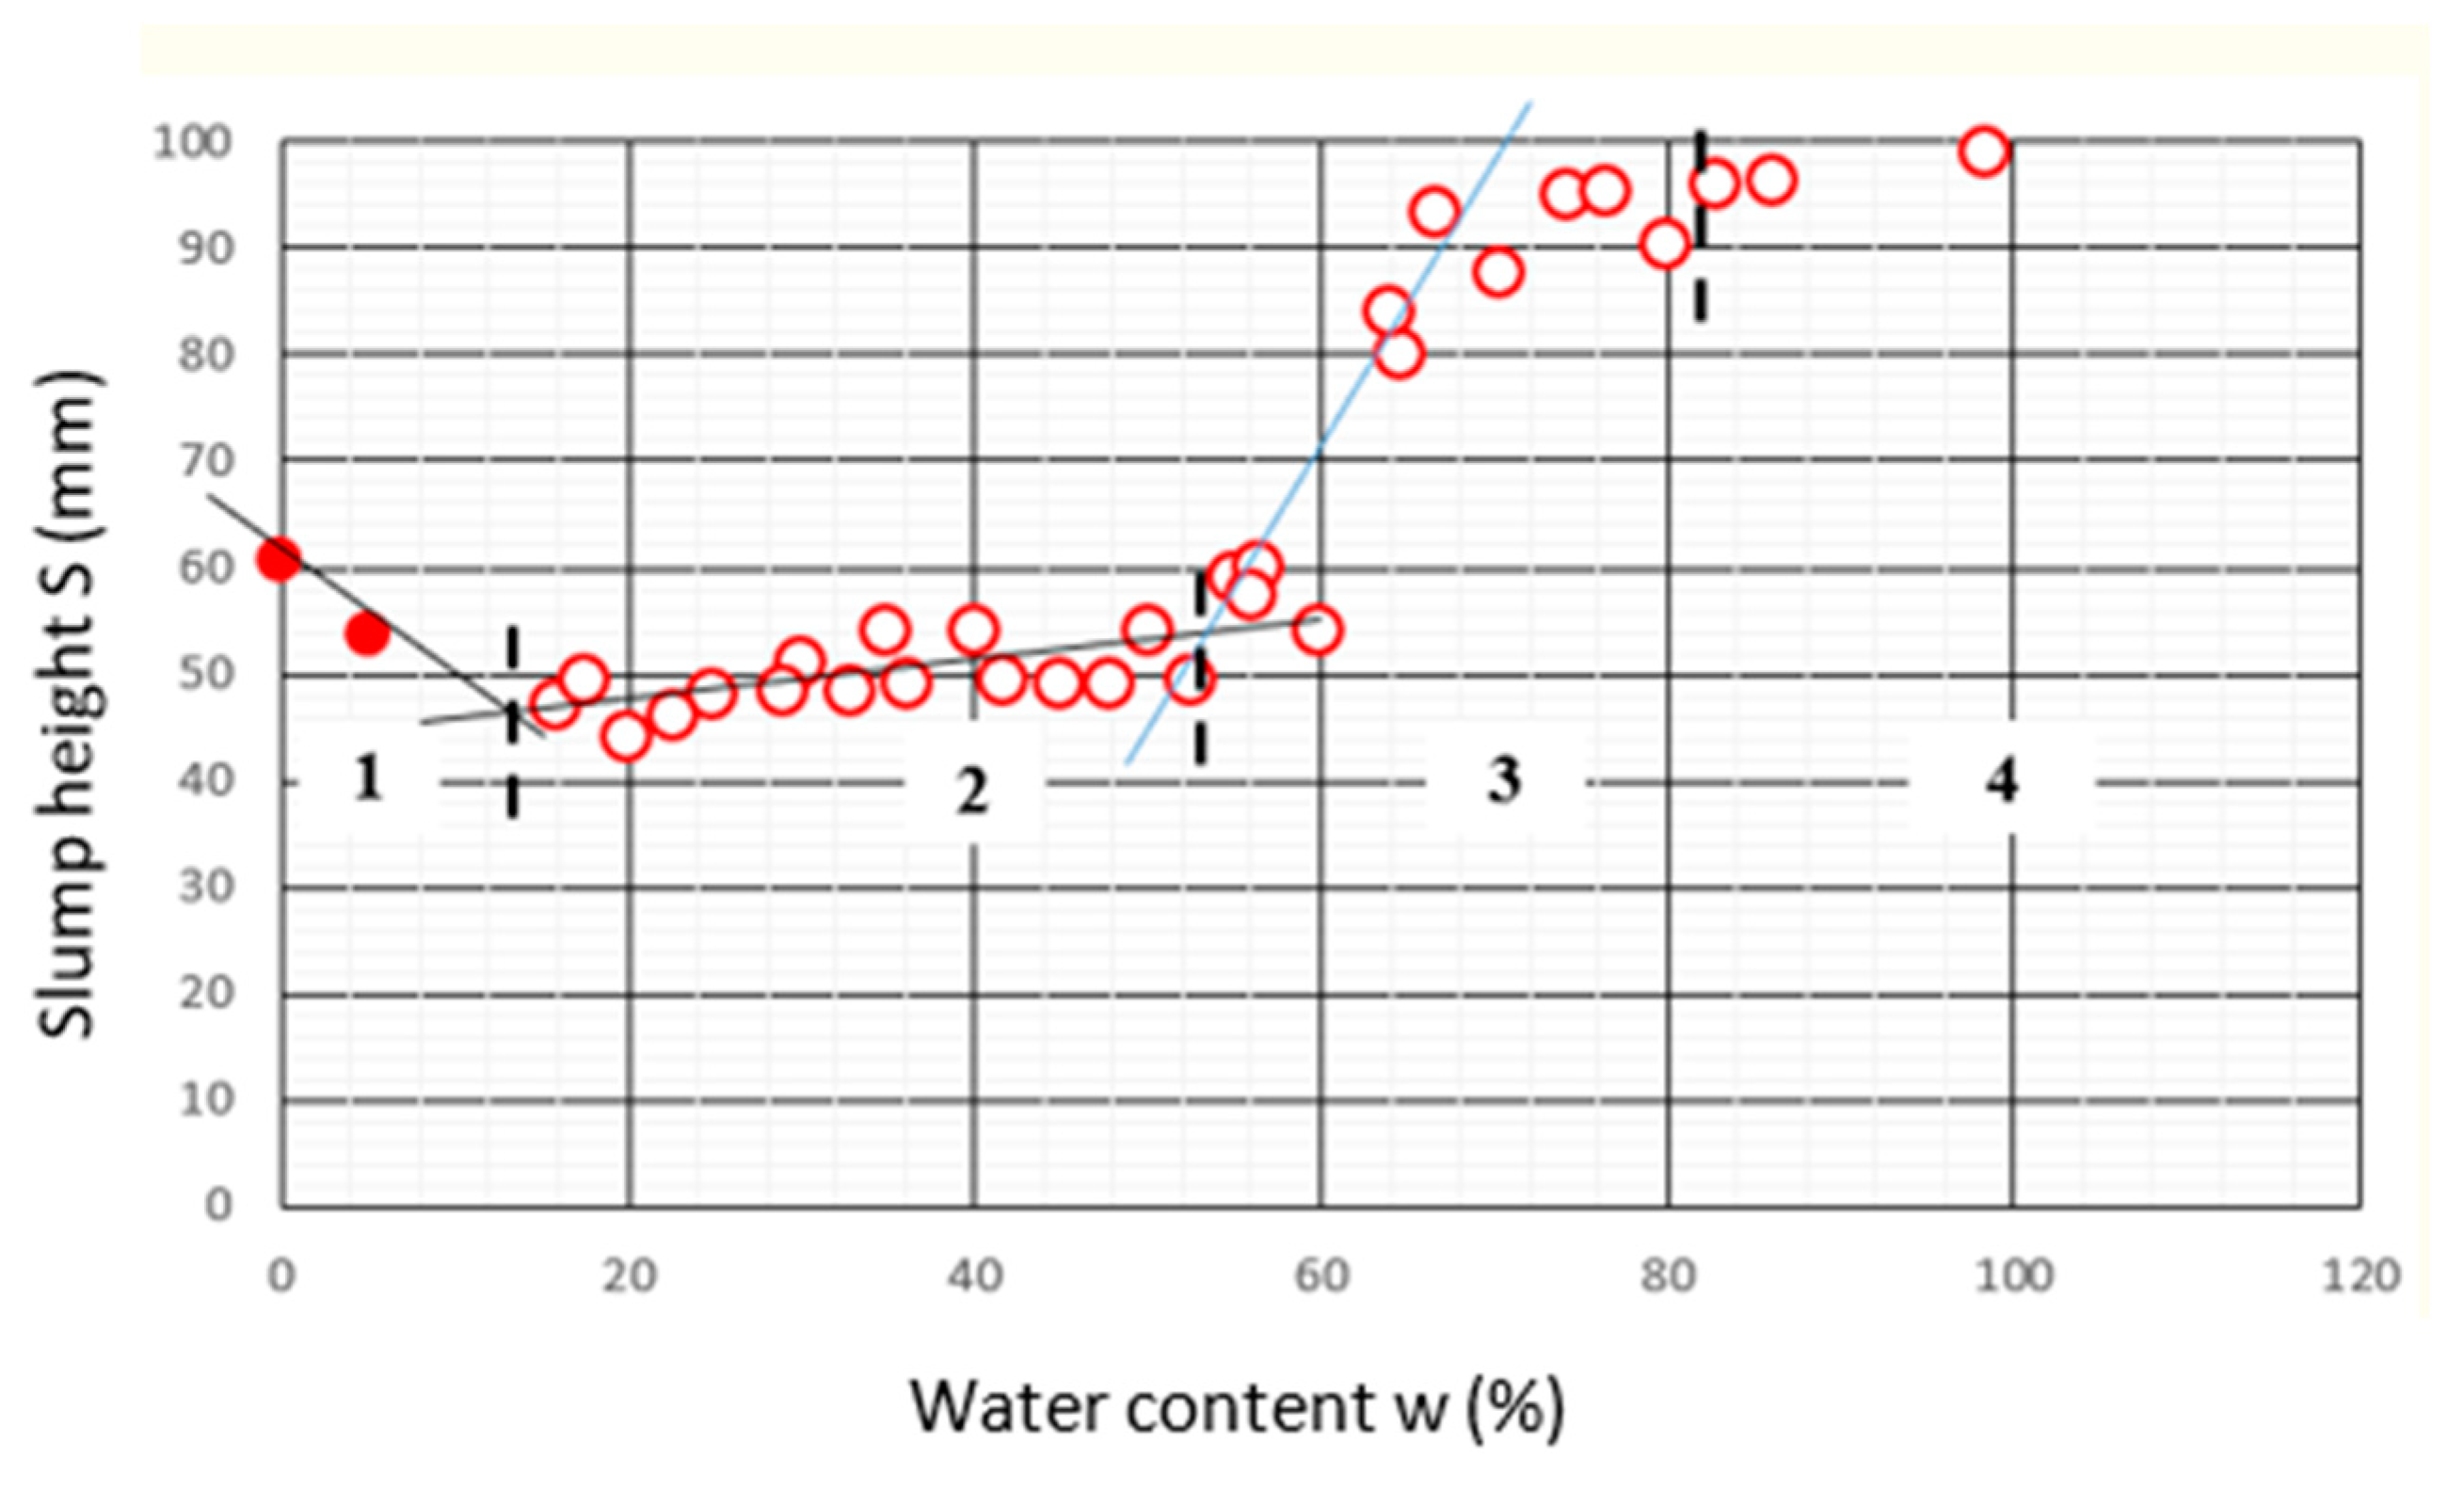
Among these relationships, during a wetting cycle, the slump evolution showed a typical bilinear behavior in zones 2 and 3 as observed in Figure 22 for a marine sediment. The measured slump corresponded to the initial cone height, i.e., here, 100 mm minus the height of the mass of sediments. Evolution was recorded which allowed for the establishment of a relationship. A typical relationship for each sediment was obtained for different water contents, from dry to liquid states. For this marine sediment, four zones corresponded to the granular state of the sediment in zone 1 where the shrinkage limit seemed to indicate the beginning of zone 2. In zone 2, the sediment became cohesive or even plastic, and the limit of zone 2 was close to the liquidity limit. Beyond this, in zone 3, the sediment became like a paste, very plastic, and then it took on a liquid appearance in zone 4.
Another relationship allows for the study of the behavior of sediments at different water contents, i.e., different consistencies during sliding (see Figure 23). With the help of the shovelability meter, the limit slip angle of the sediment mass was measured just following the slump when the metal support rotated. It could be observed that the limit angles of rotation initiating sliding decreased as the water content increased and this variation was almost linear whatever the consistency of the sediment (see Figure 23 for a marine sediment). Remember that limit angles are measured during a wetting cycle so, in Figure 23, the point at 0% of water corresponds to the dry state of the sediment in a granular state. Water was added along the shovelability tests which increased sediment cohesion, adhesion and made it plastic and fluid. But the same linearity was observed on other tested sediments from different sites [11]. In practice, for shoveling sediments, water content could indicate a minimum of shovel inclination required to avoid the sliding of sediments.
In Figure 23, the β–w relation shows a decreasing linear evolution when the water content increased. The slope obtained for different sediments tested was variable but when the parameter ratio wi/LL (wi was the water content of each test) was used on the X-axis, a unique graph was observed. The trend of evolution could be fitted as a power type equation, as shown in Figure 24.
In Figure 24, three sediments sampled from different sites were tested as the following: a marine sediment referenced as CHER, a waterway sediment SCOT and a dam sediment as MAUR. They were tested during a wetting cycle with the water content increasing from a dry state to a liquid state. In this figure, range Δ corresponds to a transition zone where particles agglomerated and gained more cohesion and plasticity.
The shovelability meter allows for the study of the behavior of the slump of a cone of sediments and the sliding of a mass of sediments but it was also designed to establish criteria for the shovelability of sediments.

3.3. Adhesion of Sediments

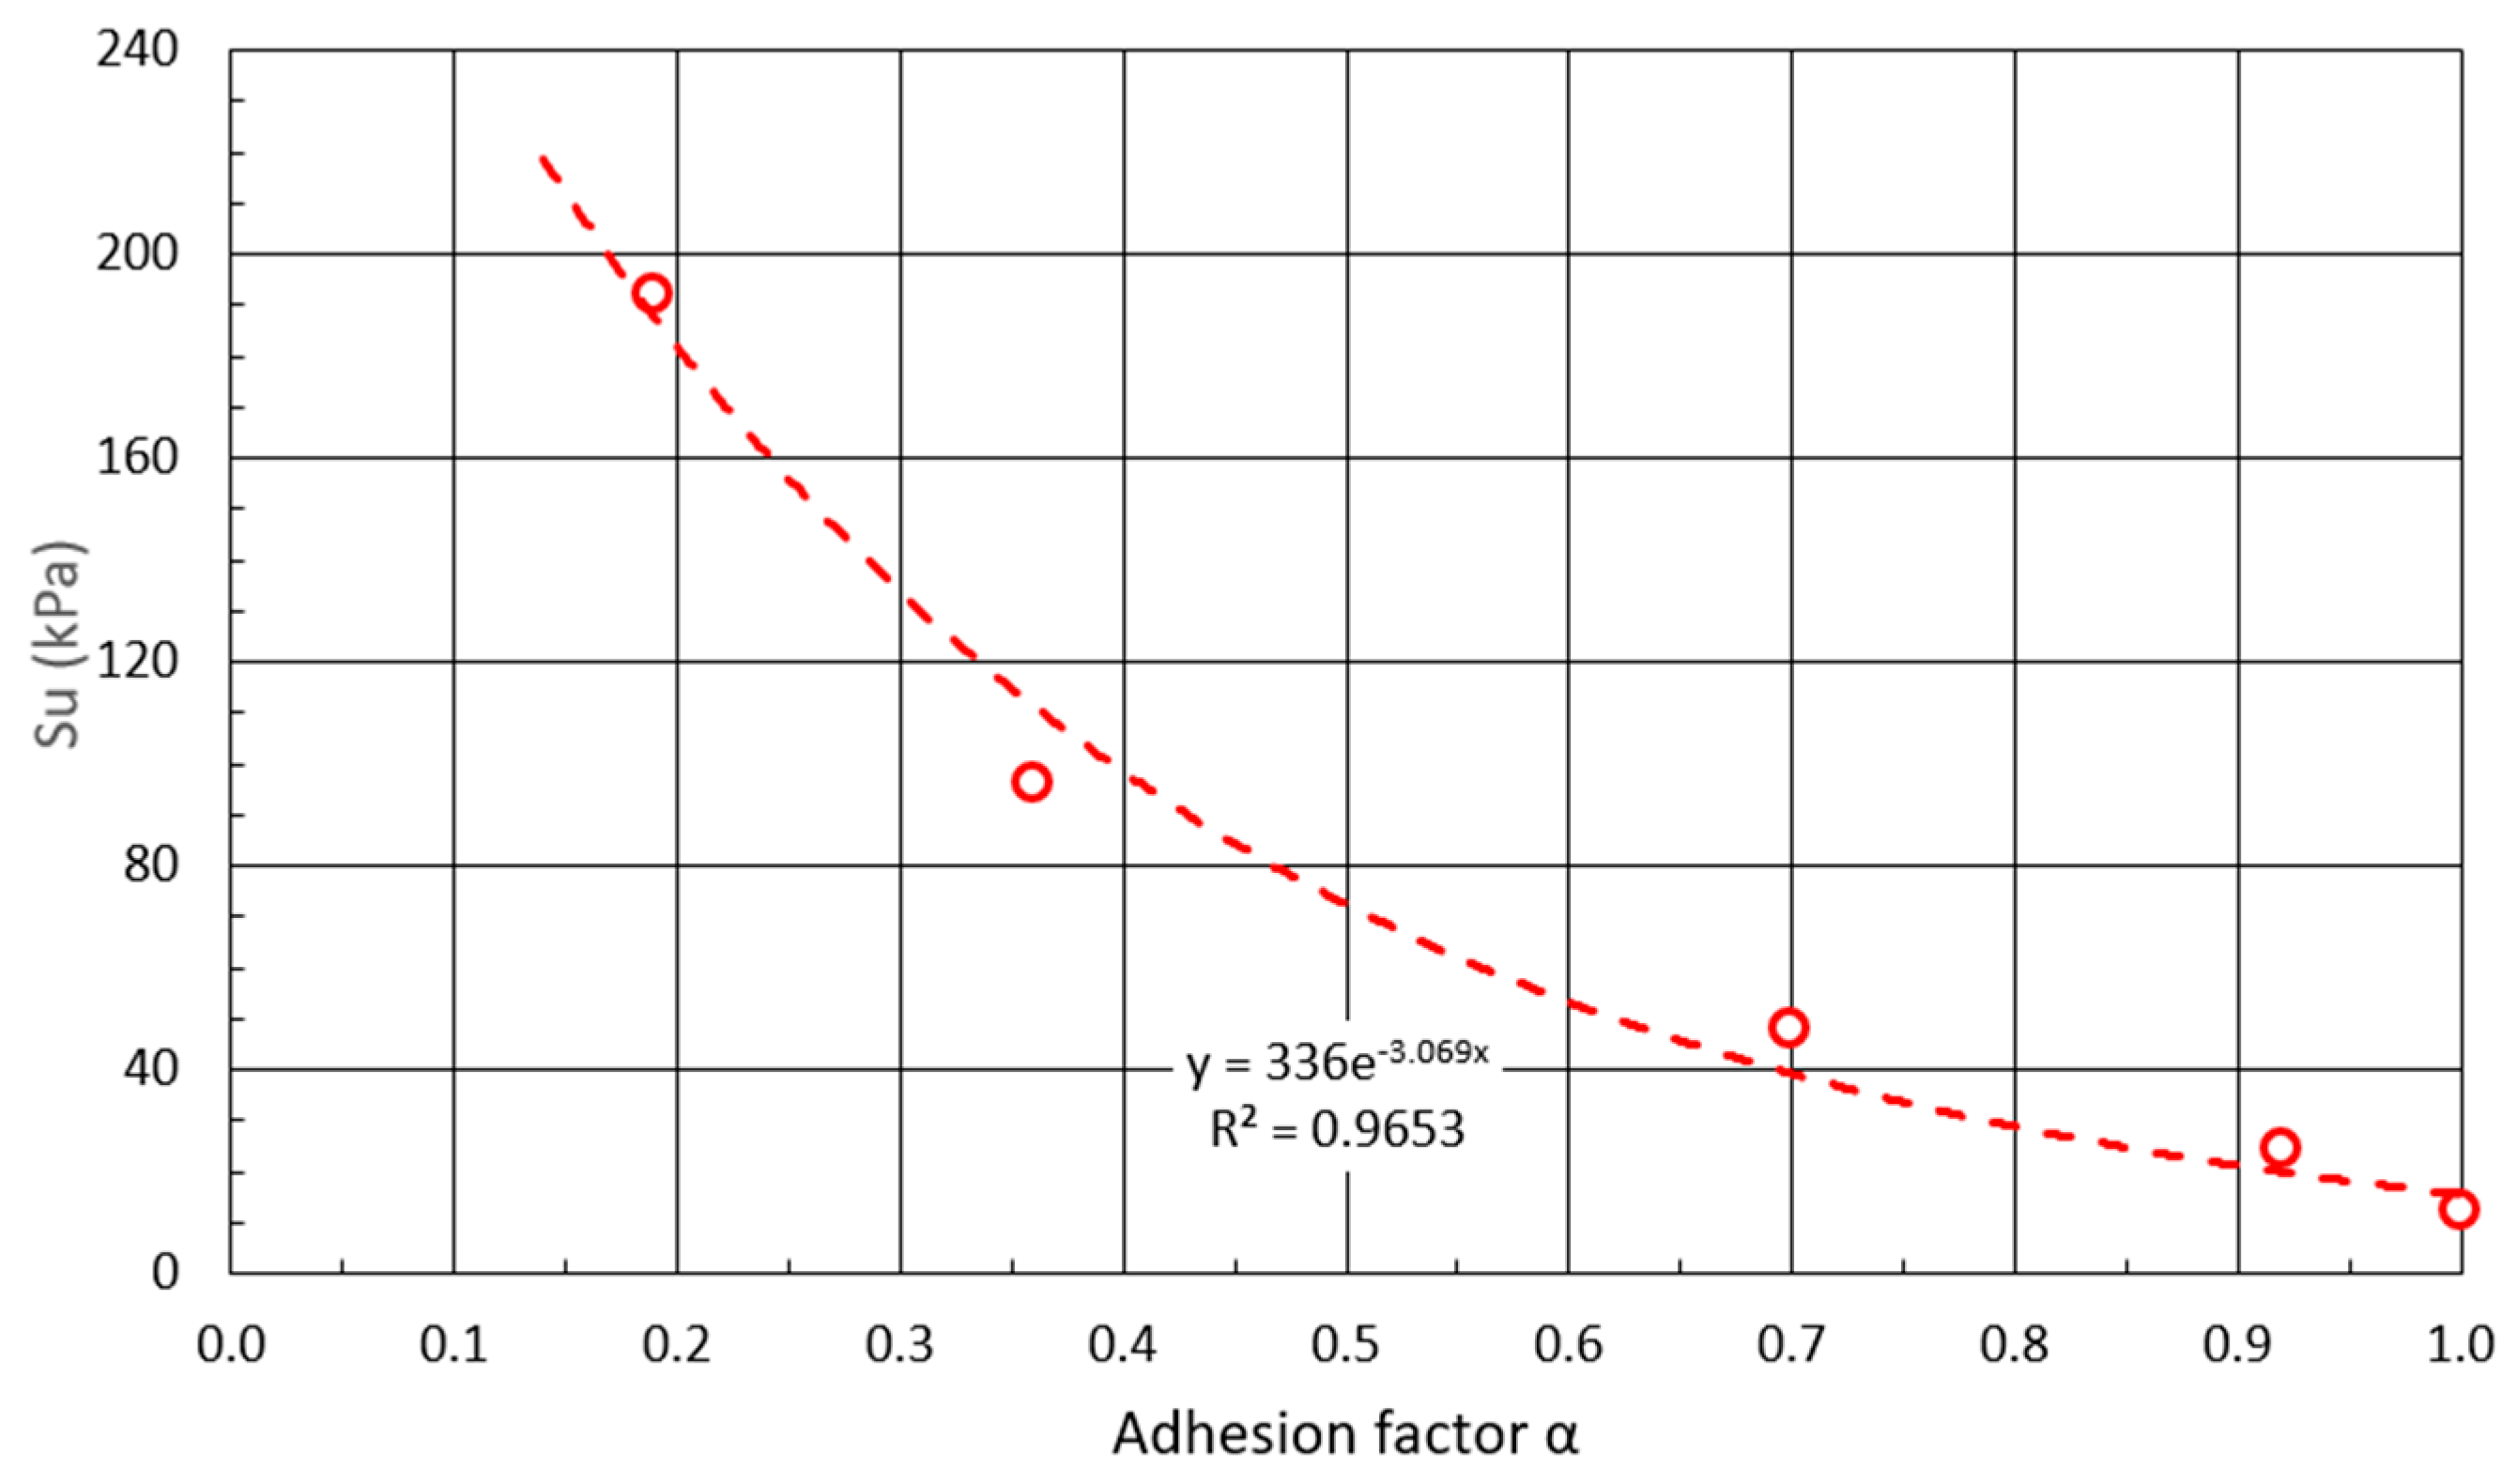
Sediments are cohesive soils and their mechanical parameters such as their cohesion c, undrained cohesion Su and friction angle φ depend first on the quantity and nature of their fine and coarse particles. Fine clayey sediments (dmax. < 2 mm) develop a cohesion that varies according to their proportions of clay and water content. When this kind of sediment is placed on a metal support, it adheres to the metal and adhesive forces evolve at the interface. Usually, adhesion is linked to the undrained cohesion Su using adhesion factor α, i.e., adhesion stress A = α Su (see Figure 25). The shovelability of sediments involves both cohesion and adhesion. Adhesion and cohesion govern sliding at the interface of a metal support. Both properties are highly dependent on water content. Few studies have been performed on the adhesion of sediments, except for soil/structure interaction in geotechnics or for tool agronomy engineering [33,34,35,36,37,38]. In geotechnical laboratories, equipment has been developed to determine the adhesion force and the shear stress at different interfaces.

3.4. Loss of Adhesion and Upcycling

This high water content poses a problem for shoveling sediments and also when sediments are spread in an agricultural field, where the adhesion of the sediments requires the use of adapted tools and intensive water cleaning. The introduction of short fibers or plant particles into sediments presents certain advantages: water absorption and dewatering by natural fibers or particles, decreased sediment adhesion, and finally an increase in agronomic properties by composting. Both are wastes, i.e., sediments and natural plants are reused and the resulting compost improves the quality of spreading in agronomy compared to recycling only sediments and reducing adhesion; this process corresponds to upcycling (Figure 26).
A recent investigation demonstrated the benefits of using plants to treat sewage sediment in a specific context in Madagascar. The promising results obtained are interesting insofar as local fibers were used to dewater sewage sediments, and what is more, these fibers ensured that the sediments could be trafficable during dewatering. The approach investigated, to the best of our knowledge, deserves to be applied to other sites and countries. It is ecological, eco-responsible, sustainable and economical. It involves developing local techniques using local resources: fibrous waste from plants. And for such fiber-reinforced, dewatered inert sediments, there are ways of recycling them.

4. Conclusions

This article as a short review focused on the dewatering and shovelability of dredged sediments, which are critical phases in sediment management and known for being time- and land-consuming. From the available dewatering techniques, natural and mechanical processes are promoted. Natural dewatering is the most cost-effective and eco-friendly process but it is a time- and land-consuming process. Mechanical dewatering requires energy, the use of flocculants and maintenance but it is preferable to chemical- or energy-consuming techniques. Some mechanical systems—only mobile units—able to dewater large volumes of sediments were first presented. Natural dewatering is more detailed because it is a simple, eco-friendly and promising technique.
By comparing the two dewatering methods, we were able to highlight the following points regarding their application on-site:
  • Natural dewatering is the most sustainable, even ecological, method. The volume of sediment to be dewatered is significant, depending on the availability of land for ponds. This technique is time- and area-consuming. It requires little energy. It is best suited to harbor, estuary and coastal sediments.
  • Mechanical dewatering is a more territorial method for river, canal and dam sediments. It is a sustainable method insofar as dewatering can be carried out close to the dredging site for small volumes of sediment. It is more energy-intensive and can be time-consuming for large volumes of sediment.
However, it was necessary to optimize the natural dewatering technique to save time and land use. In this study, through laboratory testing, some mechanisms of sediment dewatering were explained with simple tests. The air-drying test (ANDT) performed on a small volume allowed for the study of state parameters as in the shrinkage test. A more representative test (ANDS) was able to simulate a land-based basin for dewatering sediments. It provided interesting data on the setting time of sediments, effects of drainage and evaporation in the process. Additionally, a laboratory small-scale prototype press machine demonstrated the ability to perform mechanical dewatering on flocculated sediments in a similar site situation. This test allowed for the selection of flocculants and the assessment of the efficiency of mechanical dewatering. Finally, this article discussed the shovelability of sediments, an important phase, because it marks the end of dewatering. A novel test, the shovelability meter was reported. Typical results were presented with the view of researching the shovelability criteria for sediments.
So, laboratory tests are suitable for both methods:
  • The automated or non-automated dewatering tests (NADT and -ANDS) provide results for natural dewatering. They can contribute to the design of basins and also to the definition of sediment drying kinetics. In particular, they can be used to determine the time required to obtain water contents that are compatible with the removal of sediments by public works vehicles.
  • The shovelability test defines the water content required for sediments to be shoveled, depending on the type of public works equipment used, but also provides valuable information on the phenomenon of adhesion. The more a sediment adheres to transport, by spreading or other methods, the more difficult it is to handle, spread or even unload.
  • Testing on a mechanical dewatering laboratory press machine (DKS® model) helped in the design of a future full-scale mechanical press to be used and to define one or more flocculants to best dewater a given sediment. The laboratory press is a replica of presses already in use and manufactured for various applications. Its operating principle is exactly the same.
However, there are limits to these technologies and further research is required. The limitations at the moment do not concern the variability in sediment characteristics, but the need for space for natural dewatering to manage large volumes. The pressure on land is making it a rarity. As for mechanized dewatering, although the idea of a mobile unit was adopted, the volumes that are dewatered are still too small. Future research should explore new dewatering techniques that are more environmentally friendly, economical and sustainable, and that also fit in with the local context. Dewatering sediments by adding fibrous waste is a promising way of simultaneously addressing the issues of transport, dewatering and recovery.

Author Contributions

Conceptualization, D.L., B.B.A. and A.H.; methodology, D.L.; software, B.B.A. and A.H.; validation, D.L., B.B.A. and A.H.; formal analysis, D.L., B.B.A. and A.H.; investigation, D.L., B.B.A. and A.H.; resources, D.L.; data curation, D.L., B.B.A. and A.H.; writing—original draft preparation, D.L., B.B.A. and A.H.; writing—review and editing, D.L. and B.B.A.; visualization, D.L., B.B.A. and A.H.; supervision, D.L.; project administration, D.L.; funding acquisition, D.L. All authors have read and agreed to the published version of the manuscript.

Funding

This research was funded by the COVASED research program funded by the Fund Unique of Inter-ministries (FUI) and French companies (Groupe Atlantique Industrie, Electricité de France EDF, SNF Floerger). A part of this research was partially funded by the project “Hydrased”, a collaborative project with the French companies Groupe Atlantique Industrie, Electricité de France EDF and Ixsane.

Institutional Review Board Statement

Not applicable.

Informed Consent Statement

Not applicable.

Data Availability Statement

Data are available by contacting the corresponding author.

Acknowledgments

All tests reported in this review article were performed at the M2C—Continental and Coastal Morphodynamics UMR 6143 CNRS of Caen Normandie University.

Conflicts of Interest

The authors declare no conflicts of interest.

References

  1. Michallet, I.; Charruau, P.; Monzón Alvarado, C. Les Sédiments du Bassin Versant de l’Usumacinta en 12 Questions, 1st ed.; GRAIE: Villeurbanne, France; ECOSUR: Villahermosa, Tabasco, Mexico, 2022; pp. 34–37. Available online: https://univ-lyon3.hal.science/hal-03739228 (accessed on 29 August 2024).
  2. Mastoi, A.K.; Bhanbhro, R.; Traore, A.F.; Oad, M.; Zardari, S.; Jhatial, A.A. Preliminary investigation of high-water content dredged sediment treated with chemical-physical combined method at low cement content. Environ Sci. Pollut. Res. 2022, 29, 32763–32772. [Google Scholar] [CrossRef] [PubMed]
  3. Mukasa, G.P. Stabilization-Solidification of Highwater Content Dredged Sediments—Strength, Compressibility and Durability Evaluations. Ph.D. Thesis, Lulea University of Technology, Lulea, Sweden, 2015. [Google Scholar]
  4. Pu, H.; Mastoi, A.K.; Chen, X.; Song, D.; Qiu, J.; Yang, P. An integrated method for the rapid dewatering and solidification/stabilization of dredged contaminated sediment with a highwater content. Front. Environ. Sci. Eng. 2021, 15, 67. [Google Scholar] [CrossRef]
  5. Zhang, Z.; Omine, K.; Flemmy, S.O.; Li, C. The liquid limit as a factor in assessing the improvement of stabilized cement-based highwater content clayey sediments. Materials 2022, 15, 7240. [Google Scholar] [CrossRef] [PubMed]
  6. Boullosa Allariz, B. Déshydratation Naturelle et Mécanisée de Sédiments—Étude des Processus Mis en Jeu et Applications. Ph.D. Thesis, Caen Normandie University, Caen, France, 2018. [Google Scholar]
  7. Hussan, A. Cοntrοlled Dewatering, Transpοrtability and Valοrizatiοn οf Sediments. Ph.D. Thesis, Caen Normandie University, Caen, France, 2022. [Google Scholar]
  8. Boullosa Allariz, B.; Levacher, D.; Thery, F. La Presse à Boues KDS®: Une Nouvelle Technique de Déshydratation Mécanisée en Continu des Sédiments. In Proceedings of the XVème Journées Nationales Génie Côtier-Génie Civil—JNGCGC, La Rochelle, France, 29–31 May 2018; pp. 607–615. [Google Scholar] [CrossRef]
  9. Bertrand, M. Optimisation de L’injection d’un Floculant Dans un Décanteur Dynamique. Master’s Thesis, University of Caen Normandy, Caen, France, 2010; 20p. [Google Scholar]
  10. Mancioppi, L.; Dhervilly, P.; Levacher, D. Breaking Technology for Dewatering and Valorization of Sediment in France. In Proceedings of the 20th World Dredging Congress and Exhibition 2013 (WODCON XX), The Art of Dredging, Brussels, Belgium, 3–7 June 2013; pp. 584–589. Available online: https://www.proceedings.com/content/021/021902webtoc.pdf (accessed on 29 August 2024).
  11. Levacher, D.; Hussan, A.; Haquin, S.; Friboulet, G. A combined slump-sliding test (SST) for dredged fine sediments. Geotech. Test. J. 2024; in progress. [Google Scholar]
  12. KENDENSHA, 2024, Kendensha Co., Ltd. Tokyo Office, 2F, 2-11-5 Nishikojiya, Ota, Tokyo, 144-0034, Japan. Available online: https://kendensha.com/product/kds-separator (accessed on 25 October 2024).
  13. Wakeman, R.J. Separation technologies for sludge dewatering. J. Hazard. Mater. 2007, 144, 614–619. [Google Scholar] [CrossRef] [PubMed]
  14. Chitte, P.G.; Tapsi, P.; Deshmukh, B.B. Design and Development of Dewatering Screw Press. In Recent Advances in Manufacturing Modelling and Optimization; Lecture Notes in Mechanical Engineering; Kumar, S., Ramkumar, J., Kyratsis, P., Eds.; Springer: Singapore, 2022. [Google Scholar] [CrossRef]
  15. Wambui Mumbi, A.; Li, F.; Mwarania, F.; Uuganchimeg, B. An assessment of multi-plate screw press in dewatering process of sludge treatment (the best option?). Int. J. Adv. Res. 2017, 5, 740–747. [Google Scholar] [CrossRef] [PubMed]
  16. AMCON, 2024, Amcon, 1926, Nippa-cho, Kohoku-ku, Yokohama, Kanagawa 223-0057, Japan. Available online: https://www.amcon-jp.com/ (accessed on 25 October 2024).
  17. Mark Allen Group. Dewatering device for disposal issues. Filtr. Sep. 2019, 56, 28–30. [Google Scholar] [CrossRef]
  18. Suricates European Project 2017–2023, Ixsane, Company Partner, A Machine Test on a Site with River Sediment [Internet]. 2023. Available online: https://www.team2.fr/projets/projets-europeens/suricates (accessed on 8 July 2023).
  19. De Maeseneer, J.L. Constructed wetlands for sludge dewatering. Water Sci. Technol. 1997, 35, 279–285. [Google Scholar] [CrossRef]
  20. Molle, P.; Vincent, J.; Troesch, S.; Malamaire, G. Les Lits de Séchage de Boues Plantés de Roseaux Pour le Traitement des Boues et des Matières de Vidange. Guide de Dimensionnement et de Gestion, Guide LSPR. Office Français de la Biodiversité, 2013, 82p. Available online: https://oai-gem.ofb.fr/exl-php/document-affiche/ofb_recherche_oai/OUVRE_DOC/59608?fic=PUBLI/R7/92.pdf (accessed on 29 August 2024).
  21. Perroni, A.C. Gestion des Sédiments de Dragage: Inventaire des Méthodes de Prétraitement et Application aux Matériaux du Port Autonome du Havre en Vue de Leur Valorisation. Master’s Thesis, Université de Caen Normandie, Caen, France, 2006; 101p. [Google Scholar]
  22. Serratrice, J.-F. A Presentation of Shrinkage Curves for Clayey Soils. In Proceedings of the International Symposium SEC 2015, Marne-La-Vallée, France, 17–19 June 2015; pp. 179–186. [Google Scholar]
  23. Rohwer, C. Evaporation from different types of pans. Trans. Am. Soc. Civ. Eng. 1934, 99, 673–703. [Google Scholar] [CrossRef]
  24. Dalton, J. Experimental essays on the constitution of mixed gases; on the force of steam or vapour from water or other liquids in different temperatures, both in a Torricellian vacuum and in air; on evaporation; and on expansion of gases by heat. In Memoirs of the Literary and Philosophical Society of Manchester; Biodiversity Heritage Library: London, UK, 1798; Volume 5, pp. 536–602. Available online: https://www.biodiversitylibrary.org/partpdf/308525 (accessed on 29 August 2024).
  25. Penman, H.L. Natural evaporation from open water, bare soil and grass. Proc. R. Soc. Lond. Ser. A Math. Phys. Sci. 1948, 193, 120–145. [Google Scholar] [CrossRef]
  26. Wang, X. Méthodologies de Valorisation de Sédiments Mises en Œuvre Dans des Ouvrages Géotechniques en Chine. Ph.D. Thesis, Caen Normandie University, Caen, France, 2019. Available online: https://tel.archives-ouvertes.fr/tel-02520015v1 (accessed on 29 August 2024).
  27. Prabhakar, Y.S.; Satyeswararao, B. Earth Work Handling Problems due to Stickiness of Soils-Sticky Limit—Evaluation & Measurement Methods. In Proceedings of the TRACE-2012 Conference, National Conference Proceedings, San Diego, CA, USA, 30 August 2012; Amity School of Engineering & Technology, Amity University: Noida, UP, India, 2012; Volume 1, pp. 8–19. [Google Scholar]
  28. ISO 17892-6:2017; Reconnaissance et Essais Géotechniques—Essais de Laboratoire sur les Sols—Partie 6: Essai de Pénétration de Cône. AFNOR: Paris, France, 2017.
  29. Hansbo, S. A new approach to the determination of the shear strength of clay by the fall cone test. R. Swed. Geotech. Inst. Proc. 1957, 14, 5–47. [Google Scholar]
  30. Shimobe, S.; Spagnoli, G. Fall cone tests considering water content, cone penetration index, and plasticity angle of fine-grained soils. J. Rock Mech. Geotech. Eng. 2020, 12, 1347–1355. [Google Scholar] [CrossRef]
  31. Malusis, M.A.; Evans, J.C.; McLane, M.; Woodward, N.R. A miniature cone for measuring the slump of soil-bentonite cutoff wall backfill. Geotech. Test. J. 2008, 31, 373–380. [Google Scholar] [CrossRef]
  32. EN ISO 17892-12:2018; Geotechnical Investigation and Testing. Laboratory Testing of Soil. Determination of Liquid and plastic Limits. ISO: Geneva, Switzerland, 2018.
  33. Abbaspour-Gilandeh, Y.; Hasankhani-Ghavam, F.; Shahgoli, G.; Shrabian, V.R.; Abbaspour-Gilandeh, M. Investigation of the effect of soil moisture content, contact surface material and soil texture on soil friction and soil adhesion coefficients. Acta Technol. Agric. 2018, 2, 44–50. [Google Scholar] [CrossRef]
  34. Azadegan, B.; Massah, J. Effect of temperature on adhesion of clay soil to steel. Cercet. Agron. Mold. 2012, XLV, 21–27. [Google Scholar] [CrossRef]
  35. Bircha, R.A.; Ekwue, E.I.; Phillip, C.J. Soil-metal sliding resistance forces of some Trinidadian soils at high water contents. West Indian J. Eng. 2011, 38, 52–58. [Google Scholar]
  36. Chen, X.; Van Den Broecke, J.W.; Liu, G.; Hong, G.; Miedema, S.A. Experimental study on the adhesion factor of clay. Terra Aqua 2021, 163, 7–17. Available online: https://www.iadc-dredging.com/wp-content/uploads/2021/06/terra-et-aqua-163-complete-issue.pdf (accessed on 29 August 2024).
  37. NAVFAC. Foundation and Earth Structures; Design Manual-DM 7.02; U.S. Department of the Navy, Naval Facilities Engineering Command Publications Transmittal: Alexandria, VA, USA, 1986; 279p. [Google Scholar]
  38. Zimnik, A.R.; Van Baalen, L.R.; Verhoef, P.N.W.; Ngan-Tillard, D.J.M. The Adherence of Clay to Steel Surfaces. In Proceedings of the ISRM International Symposium, Melbourne, Australia, 19 November 2000; IS 2000 International Society for Rock Mechanics: Lisbon, Portugal, 2000. [Google Scholar]
Figure 1. Sediment management requirements [1].
Sustainability 16 09663 g001
Figure 3. Main phases of the process of sediment valorization.
Sustainability 16 09663 g003
Figure 4. Hydrosplit® system: (A) schematic concept; (B) external view schematic concept [6,9].
Sustainability 16 09663 g004
Figure 5. Nemeau®: (A) schematic concept; (B) external view [6,9,10].
Sustainability 16 09663 g005
Figure 6. Volute®: (A) schematic concept; (B) external view [6].
Sustainability 16 09663 g006
Figure 7. KDS®: (A) schematic concept; (B) external view [6,12].
Sustainability 16 09663 g007
Figure 8. Doris®: (A) external view of containers; (B) schematic concept [18].
Sustainability 16 09663 g008
Figure 9. NADT principle: (A) test arrangement; (B) schematic view of test [6,7].
Sustainability 16 09663 g009
Figure 10. NADT relationships—(A) w–εa and (B) w–e charts, in the case of a dam sediment (Le Clapier, France) [6].
Sustainability 16 09663 g010
Figure 11. Scheme of the automated natural dewatering system ANDS.
Sustainability 16 09663 g011
Figure 12. Evolution of amount of water versus time—alpine reservoir sediment (Le Flumet, France [6,7]).
Sustainability 16 09663 g012
Figure 13. Drainage rate versus time. Case study of port sediment (Cherbourg, France), with sieve diameters ranging from 100 mm to 300 mm, an initial height of sediment of 6 cm and an initial water content of w0 = 1.67 LL, LL = 60% [7].
Sustainability 16 09663 g013
Figure 14. Evaporation water volume versus time. Case study of port sediment (Cherbourg, France), with sieve diameters ranging from 100 mm to 300 mm, an initial height of sediment of 6 cm and an initial water content of w0 = 1.67 LL, LL = 60% [7].
Sustainability 16 09663 g014
Figure 15. Potential of evaporation versus time. Experimental and theoretical results for a dam sediment (Maurienne Valley, France), with sieve diameters from 100 mm to 300 mm, an initial height of sediment of 6 cm and an initial water content of w0 = 1.67 LL, LL = 37% [7].
Sustainability 16 09663 g015
Figure 16. Laboratory model for mechanical dewatering of high-water sediments.
Sustainability 16 09663 g016
Figure 17. Steps in the procedure for the mechanical dewatering laboratory test.
Sustainability 16 09663 g017
Figure 18. Flocculated sludge on obtained oval multi-discs and cakes: (A) flocculated canal sediment over the spinning disks; (B) canal sediment cake; (C) cake of metal oxides sludge; (D) cake of kaolin clay.
Sustainability 16 09663 g018
Figure 19. Relationship between water content w versus undrained cohesion Su for dam sediments. AL, BR and GE were, respectively, from the alpine, Breton and east regions of France, [6].
Sustainability 16 09663 g019
Figure 20. Protocol of the test: (A) slump test; (B) vane shear test; (C) fall cone test; (D) rotation angle, no sliding; (E) limit angle, sliding; (F) rough support use, where m is the mass of the sediment [11].
Sustainability 16 09663 g020
Figure 21. The shovelability meter: (a) horizontal position and miniature cone; (b) in sliding position [11].
Sustainability 16 09663 g021
Figure 22. Typical slump evolution as a function of water content for a marine sediment (Port of Cherbourg, France) [11].
Sustainability 16 09663 g022
Figure 23. Typical evolution of the limit rotation angle β measured just before sliding (impeding motion) as a function of water content for a marine sediment (Port of Cherbourg, France). The LL value for the sediment was 52.3% [11].
Sustainability 16 09663 g023
Figure 24. A typical and unique relationship of the limit angle β versus the ratio of water content on the liquid limit for 3 different sediments: CHER, a marine sediment from Port of Cherbourg (France), MAUR, a dam sediment from alpine region (France), and SCOT, a waterway sediment near Strathclyde (Scotland) [11].
Sustainability 16 09663 g024
Figure 25. Suggested Su–adhesion factor relationship by NAVFAC [37].
Sustainability 16 09663 g025
Figure 26. Upcycling of sediments in landscapes and agronomy.
Sustainability 16 09663 g026
Table 1. Basic parameters of traditional mechanical dewatering machines [6].
Basic ParameterFilter PressBelt PressScrew PressCentrifuge
Work systemDiscontinuousDiscontinuousPseudo-continuousDiscontinuous
Surface area occupied (m2)6.0–6.510–10.504.0–4.50
Rate of dryness (%)≈6518–2540≈20
Sludge flow (m3/h)0.5–803–20
Energy use (kW/m3)0.250.5–2.750.201.95
Noise (dB)71<7082.4
Flocculant consumption
(kg/t DMS *)
5–93–75–79–11
Water consumption (m3/h)4.60.52.5
Power consumption (kW/h)1.22.020.5
kWh/DMS *30–404010150–200
Note: * DMS = Dry matter of sediments.
Table 2. Basic parameters of dewatering machines that work in a continuous manner [6,18].
Basic ParameterNemeau®Volute® * KDS® **Doris®
Work systemContinuousContinuousContinuousContinuous
Volume of sludge to be processed450 m3/h12–20 m3≤75 m3/h≤80 m3/h
Rate of dryness (%)40–50≈5570–80≤75
Surface area occupied (m2)27.2–1681.33–5.65Width =
0.3 m–1.2 m
3 × 40 feet containers
Energy use0.25 kW/m30.2–1.95 kW0.4–1.5
Operators for each machine2222
Note: * Two types of machines were compared, with the smallest machine and the biggest one being the Volute ES-101ST Unit and Volute ES-303ST Unit, respectively (EC’eau Press, Atlantique Industrie group, Ancenis, France and Amcon, Yokohama, Kanagawa, Japan); ** Two types of machines were compared, with the smallest machine and the biggest one being the KDS-311D and KDS-1224D, respectively (Eco Wave®, Atlantique Industrie group, Ancenis, France and Kendensha Co., Ltd., Tokyo, Japan, [12]).
Table 3. Water content ranges suggested for sediments.
Water ContentCompact StateLow Intermediate HighSludge State
w (%)0–30%30–80%80–120%120–200%>200%
Disclaimer/Publisher’s Note: The statements, opinions and data contained in all publications are solely those of the individual author(s) and contributor(s) and not of MDPI and/or the editor(s). MDPI and/or the editor(s) disclaim responsibility for any injury to people or property resulting from any ideas, methods, instructions or products referred to in the content.