
Analysis of Factors Affecting CO2 Emissions in Türkiye Using Quantile Regression


Abstract
1. Introduction
- Do changes in economic growth in Türkiye affect CO2 emissions?
- Is the effect of population growth on CO2 emissions in Türkiye statistically significant?
- Is the trend towards renewable energy sources effective in reducing CO2 emissions in Türkiye?
2. Materials and Methods
3. Results
3.1. Dataset and Structure
3.2. Findings
4. Conclusions and Discussion
Author Contributions
Funding
Institutional Review Board Statement
Informed Consent Statement
Data Availability Statement
Conflicts of Interest
References
- Moalla, M. Energy Consumption, CO2 Emissions, and Economic Growth Nexus: ARDL Analysis for Turkiye. Kent Akad. Derg. 2023, 16, 19–37. [Google Scholar] [CrossRef]
- Ofori-Sasu, D.; Abor, J.Y.; Agyekum Donkor, G.N.; Otchere, I. Renewable energy consumption and carbon emissions in developing countries: The role of capital markets. Int. J. Sustain. Energy 2023, 42, 1407–1429. [Google Scholar] [CrossRef]
- Kaya, K.; Şenel, M.C.; Koç, E. Dünyada ve Türkiye’de Yenilenebilir Enerji Durumu-Genel Değerlendirme. Technol. Appl. Sci. (NWSATAS) 2018, 13, 219–234. [Google Scholar]
- Türkyılmaz, T. Geliştirilen Yeni Bir Yazılım ile Rüzgar ve Güneş Enerji Sistemlerinin Analizi ve Uygulaması. Ph.D. Thesis, Bilecik Şeyh Edebali Üniversitesi, Fen Bilimleri Enstitüsü, Bilecik, Türkiye, 2020. [Google Scholar]
- Seydioğulları, H.S. Sürdürülebilir Kalkınma için Yenilenebilir Enerji. Planlama 2013, 23, 19–25. [Google Scholar]
- Karagöl, E.T.; Kavaz, İ. Dünyada ve Türkiye’ de Yenilenebilir Enerji. Analiz 2017, 197, 1–28. [Google Scholar]
- Emek, Ö.F.; Atay Polat, M. Examining the Relationship between Carbon Emission and Economic Growth in G7 Countries. In Macro Aspects of Environmental Economics; Durgun, B., Ed.; Özgür Publications: Gaziantep, Türkiye, 2023; pp. 131–145. [Google Scholar] [CrossRef]
- İklim Değişikliği Bakanlığı. Kyoto Protokolü. 2024. Available online: https://iklim.gov.tr/kyoto-protokolu-i-35# (accessed on 4 August 2024).
- Çoban, O.; Şahbaz Kılınç, N. Yenilenebilir Enerji Tüketimi ve Karbon Emisyonu İlişkisi: TR Örneği. Sos. Bilim. Enstitüsü Derg. 2015, 38, 195–208. [Google Scholar]
- TURKONFED. 2024. Available online: https://turkonfed.org/tr/detail/4245/2022-sera-gazi-istatistikleri-yayinlandi (accessed on 9 September 2024).
- Our World in Data. 2023. Available online: https://ourworldindata.org/co2-and-greenhouse-gas-emissions (accessed on 8 September 2024).
- Zaekhan; Nachrowi, N.D. The Impact of Renewable Energy and GDP Per Capita on Carbon Dioxide Emission in the G-20 Countries. Econ. Financ. Indones. 2012, 60, 145–174. [Google Scholar]
- Çetintaş, H.; Bicil, İ.M.; Türköz, K. Türkiye’de CO2 Salınımları Enerji Tüketimi ve Ekonomik Büyüme İlişkisi. Finans Polit. Ekon. Yorumlar 2016, 53, 57–67. [Google Scholar]
- Mapapu, B.; Andrew, P. Carbon emissions and economic growth in South Africa: A quantile regresison analysis. Int. J. Energy Econ. Policy 2018, 8, 195–202. [Google Scholar]
- Caporale, G.M.; Claudio-Quiroga, G.; Gil-Alana, L.A. CO2 Emissions and GDP: Evidence From China. Economics and Finance Working Paper Series (No:1915). 2019; pp. 1–27. Available online: https://www.brunel.ac.uk/economics-and-finance/research/pdf/1915-Sep-GMC-CO2-Emissions-and-GDP-Evidence-from-China.pdf (accessed on 9 October 2024).
- Altinoz, B.; Apergis, N.; Aslan, A. Energy Consumption, Carbon Dioxide Emissions and Economic Growth: Fresh Evidence From Panel Quantile Regressions. Energy Res. Lett. 2020, 1, 17075. [Google Scholar] [CrossRef]
- Keho, Y. An Empirical Study of Some Driving Factors of CO2 Emissions: Evidence from Quantile Regression. Bull. Appl. Econ. 2020, 7, 87–95. [Google Scholar] [CrossRef]
- Khan, H.; Khan, I.; Binh, T.T. The Heterogeneity of Renewable Energy Consumption, Carbon Emission and Financial Development in The Globe: A Panel Quantile Regression Approach. Energy Rep. 2020, 6, 859–867. [Google Scholar] [CrossRef]
- Akyol, M.; Mete, E. Çevresel teknolojik inovasyonların CO2 emisyonu üzerindeki etkisi: OECD ülkeleri örneği. İstanbul İktisat Derg.-Istanb. J. Econ. 2021, 71, 569–590. [Google Scholar] [CrossRef]
- Alotaibi, A.A.; Alajlan, N. Using Quantile Regression to Analyze the Relationship between Socioeconomic Indicators and Carbon Dioxide Emissions in G20 Countries. Sustainability 2021, 13, 7011. [Google Scholar] [CrossRef]
- Barak, D.; Tunc, A. How do environmental protection expenditures affect health status? Evidence from panel quantile regression. KAÜİİBFD 2022, 13, 1036–1068. [Google Scholar] [CrossRef]
- Baskaya, M.M.; Samour, A.; Tursoy, T. The Financial Inclusion, Renewable Energy And CO2 Emissions Nexus In The Brics Nations: New Evidence Based On The Method Of Moments Quantile Regression. Appl. Ecol. Environ. Res. 2022, 20, 2577–2595. [Google Scholar] [CrossRef]
- İlarslan, K.; Yıldız, M. Yenilenebilir enerji yatırımlarının finansal belirleyicileri üzerine karşılaştırmalı bir analiz: Asya-Pasifik ve Latin Amerika ülkeleri. Bus. Manag. Stud. Int. J. 2022, 10, 1397–1415. [Google Scholar] [CrossRef]
- Qudrat-Ullah, H.; Nevo, C.M. Analysis of the Dynamic Relationships among Renewable Energy Consumption, Economic Growth, Financial Development, and Carbon Dioxide Emission in Five Sub-Saharan African Countries. Energies 2022, 15, 5953. [Google Scholar] [CrossRef]
- Uğurlu, E. Impacts of Renewable Energy on CO2 Emission: Evidence from the Visegrad Group Countries. Sciendo-Politics Cent. Eur. 2022, 18, 295–315. [Google Scholar] [CrossRef]
- Akyüz, H.E. CO2 Emisyonu ve Birincil Enerji Tüketimi Arasındaki İlişkinin Kantil Regresyon Modeli ile İncelenmesi. Düzce Üniversitesi Bilim Ve Teknol. Derg. 2023, 11, 1529–1545. [Google Scholar] [CrossRef]
- Lyazzat, K.; Abubakirova, A.; Igilikovna, O.A.; Zhanargul, T.; Suleimenovna, S.B. The Relationship between Energy Consumption, Carbon Emissions and Economic Growth in ASEAN-5 Countries. Int. J. Energy Econ. Policy 2023, 13, 265–271. [Google Scholar] [CrossRef]
- Rehman, S.; Ullah, A.; Azim, F.; Khan, H.U.R. Impact of financial development, energy consumption and urbanization on CO2 emissions from buildings using quantile ARDL model. J. Infrastruct. Policy Dev. 2023, 7, 2166. [Google Scholar] [CrossRef]
- Abbas, M.; Yang, L. Measuring the long-run effect of economic growth, population aging, and unemployment on carbon emissions in South Asia. Pak. J. Commer. Soc. Sci. (PJCSS) 2024, 18, 113–133. [Google Scholar]
- Türk, M.M.; Barışık, S. CO2 emisyonunun ekonomik büyüme ve kentleşme ile etkileşimi: BRICS-T ülkeleri örneği. Manas Sos. Araştırmalar Derg. 2024, 13, 510–533. [Google Scholar] [CrossRef]
- Aldoukhi, M.A.; Gupta, S.M. A robust closed loop supply chain network design under different carbon emission policies. J. Pamukkale Univ. Eng. Sci. 2019, 25, 1020–1032. [Google Scholar] [CrossRef]
- Zhang, S.; Hou, Y.; Zhang, S.; Zhang, M. Fuzzy control model and simulation for nonlinear supply chain system with lead times. Complexity 2017, 2017, 2017634. [Google Scholar] [CrossRef]
- Zhang, S.; Zhang, C.; Zhang, S.; Zhang, M. Discrete switched model and fuzzy robust control of dynamic supply chain network. Complexity 2018, 2018, 3495096. [Google Scholar] [CrossRef]
- Zhang, S.; Zhang, P.; Zhang, M. Fuzzy emergency model and robust emergency strategy of supply chain system under random supply disruptions. Complexity 2019, 2019, 3092514. [Google Scholar] [CrossRef]
- Koenker, R.; Bassett, G., Jr. Regression quantiles. Econom. J. Econom. Soc. 1978, 46, 33–50. [Google Scholar] [CrossRef]
- Abid, N.; Ahmad, F.; Aftab, J.; Razzaq, A. A blessing or a burden? Assessing the impact of climate change mitigation efforts in Europe using quantile regression models. Energy Policy 2023, 178, 113589. [Google Scholar] [CrossRef]
- Öztürk, K.N.; Yiğit, Ö.E. Makroekonomik ve Sosyal Göstergelerin Mutluluk Üzerindeki Etkilerinin Araştırılması: Panel Kantil Regresyon Yaklaşımı. Bilecik Şeyh Edebali Üniversitesi Sos. Bilim. Derg. 2024, 9, 62–78. [Google Scholar] [CrossRef]
- Koenker, R. Quantile regression: 40 years on. Annu. Rev. Econ. 2017, 9, 155–176. [Google Scholar] [CrossRef]
- Long, H.; Feng, G.F.; Gong, Q.; Chang, C.P. ESG performance and green innovation: An investigation based on quantile regression. Bus. Strategy Environ. 2023, 32, 5102–5118. [Google Scholar] [CrossRef]
- Yağış, O. Gelir Eşitsizliği ve CO2 Emisyonu İlişkisi: Panel Veri Analizi. Dicle Üniversitesi Sos. Bilim. Enstitüsü Derg. 2024, 36, 412–435. [Google Scholar] [CrossRef]
- Zoundi, Z. CO2 emissions, renewable energy and the Environmental Kuznets Curve, a panel cointegration approach. Renew. Sustain. Energy Rev. 2017, 72, 1067–1075. [Google Scholar] [CrossRef]
- Apergis, N.; Kuziboev, B.; Abdullaev, I.; Rajabov, A. Investigating the association among CO2 emissions, renewable and non-renewable energy consumption in Uzbekistan: An ARDL approach. Environ. Sci. Pollut. Res. 2023, 30, 39666–39679. [Google Scholar] [CrossRef]
- Rehman, A.; Alam, M.M.; Ozturk, I.; Alvarado, R.; Murshed, M.; Işık, C.; Ma, H. Globalization and renewable energy use: How are they contributing to upsurge the CO2 emissions? A global perspective. Environ. Sci. Pollut. Res. 2023, 30, 9699–9712. [Google Scholar] [CrossRef]
- Ge, J.; Zhang, S. Adaptive inventory control based on fuzzy neural network under uncertain environment. Complexity 2020, 2020, 6190936. [Google Scholar] [CrossRef]
- Zhang, S.; Li, S.; Zhang, S.; Zhang, M. Decision of Lead-Time Compression and Stable Operation of Supply Chain. Complexity 2017, 2017, 7436764. [Google Scholar] [CrossRef]


| Author | Variable | Country | Period | Methodology | Findings |
|---|---|---|---|---|---|
| [12] | CO2: CO2 emissions, GDP: GDP per capita, UR: use of renewable energy per capita, EFC: total consumption of fossil energy per capita, ETC: trade openness | G20 Countries | 2001–2010 | Panel Data Analysis | According to the Environmental Kuznet’s Curve (EKC) hypothesis, GDP per capita has a positive influence. CO2 emissions per capita can rise in response to factors such as trade openness, urban population growth, and per capita fossil fuel energy consumption. As fossil energy prices rise and the amount of renewable energy used per person increases, CO2 emissions per person decrease. Additionally, using renewable energy sources like wind has a general positive impact on lowering CO2 emissions per person. |
| [13] | CO2: CO2 emissions, KGDP: real GDP per capita, SO: share of the population living in the city in the total population, EC: energy consumption (oil equivalent per capita kg) | Türkiye | 1960–2011 | ARDL Bounds Test | Growth and urbanization rates have a beneficial long-term influence on CO2, but they have no short-term effect on the CO2. |
| [14] | GDP, CO2: carbon emissions, INF: CPI inflation, INV: gross domestic investment, EMP: employment, TOT: terms of trade | South African | 1970–2014 | Quantile Regression | Empirical findings suggest that the greatest benefits for economic growth come from extremely low carbon emissions. The results should motivate governments to keep launching energy efficiency initiatives that particularly aim to reduce carbon emissions. |
| [15] | CO2: carbon emissions, GDP: GDP per capita | China | 1975–2015 | Fractional Integration Cointegration Methods | The cointegration tests (using both conventional and fractional procedures) suggest that the two variables (CO2, GDP) in first differences have a long-run equilibrium relationship, meaning that, over time, their growth rates are connected. |
| [16] | EC: energy consumption, CO2: carbon dioxide emissions, GCF: gross capital formation, L: labor force, GE: government expenditures | The European and Asian regions (22 countries), Latin American and Caribbean regions (15 countries), and Middle Eastern and African regions (20 countries) | 1990–2018 | Panel Quantile Regression | According to the results, energy consumption (at medium and high levels) and carbon emissions (at all levels) have a negative effect on economic growth, indicating that these countries are unable to attain sustainable economic growth. |
| [17] | CO2: carbon emissions, energy use, GDP: GDP squared, industrial sector, finance, trade, urbanization | 45 countries comprising 12 Sub-Saharan African countries, 10 American countries, 10 Asian countries, 5 European countries, and 8 MENA member countries | 1980–2011 | Quantile Regression | The consequences of energy consumption and financial development, which raise CO2 emissions, are more pronounced in nations with lower pollution levels. Industrialization increases pollution especially in countries with greater degree of pollution. In low-pollution countries, trade openness and urbanization have a negative correlation with emissions. |
| [18] | CO2: carbon dioxide emissions (metric tons per capita), RE: renewable energy consumption (% of total final energy), FDPVT: financial development proxied by domestic credit to private sector, FDI: foreign direct investment (net inflows as a percent of GDP), POP: urban population, TO: trade openness (% of GDP), FBF: labor force, MT: merchandise trade (% of GDP) | 192 countries | 1980–2018 | Panel Quantile Regression | Consumption of renewable energy has a negative impact on carbon emissions, while the influence of financial development on carbon emissions is growing. While financial development has a beneficial impact on the consumption of renewable energy, carbon emissions reduce the use of renewable energy. It has also been discovered that the use of renewable energy sources and carbon emissions have a growing impact on financial development. |
| [19] | CO: carbon emissions, IPNT: environmental innovation ENT: energy consumption, GDP: economic growth | OECD countries (18 countries) | 2005–2018 | Panel (GMM) models | The results show that CO2 emissions are reduced by 0.02% for every 1% increase in patent applications aimed at preventing climate change. Conversely, a 1% rise in energy demand results in a 0.56% rise in CO2 emissions. Lastly, there is a 0.001% rise in CO2 emissions for every 1% increase in the GDP growth rate. |
| [20] | CO2: carbon dioxide (CO2) emissions, GDP: GDP per capita, FC: fossil fuel consumption, URB: urbanization, TR: trade openness, PD: population density, LPI, HDI: socioeconomic indicators | G20 Countries | 2000–2019 | Quantile Regression | A reduction in CO2 emissions was accompanied by inclusive socioeconomic growth. At quantiles ranging from 0.2 to 1, the LPI and HDI showed a negative marginal association with CO2 emissions. Second, over the study period, the EKC hypothesis held true for the G20 countries, with an inflection point located around quantile 0.15. Third, during the study period, there was a negative correlation between trade openness and urbanization, while there was a strong positive correlation between CO2 emissions and the usage of fossil fuels. Lastly, the study provides empirical evidence for the possibility of reducing CO2 emissions without sacrificing inclusive growth through the implementation of efficient policies and coordinated policies across a wide range of social, economic, and living domains. |
| [21] | EPE: environmental protection expenditure (percent of GDP), CO2: carbon dioxide emissions measured in million tons per capita, EXP is employed as a proxy for health status. | 20 European Countries | 1995–2019 | Panel Quantile Regression | The findings indicate that whereas GDP, education, and spending on environmental preservation all contribute to improving health, CO2 emissions actually worsen it. |
| [22] | REC: renewable energy consumption NREC: natural gas power utilization, GDP: per capita as a proxy of economic growth, FC: an index that is calculated using four sub-indices, CO2: carbon dioxide emissions per capita | BRICS nations | 2002–2019 | The Method of Moments Quantile Regression (Panel) | The results of the panel quantile estimations demonstrated that the coefficients for financial inclusion and the use of renewable energy are negative for CO2 emissions across all quantiles, from the first to the ninth. This implies that financial inclusion and renewable energy lower CO2 emission levels. |
| [23] | YE: Renewable energy, FG: financial development, DYY: foreign direct investments | Asia-Pacific and Latin America | 2000–2020 | Simultaneous Panel Quantile Regression | The frameworks utilized for the analyses in this paper were simultaneous panel quantile regression analysis and the Dumitrescu–Hurlin panel causality test. A strong empirical argument has been established for the role that FG and DYY play in the development of YE based on the evidence gathered. Consequently, YE is greatly and favorably impacted by FG and DYY. |
| [24] | CN: per capita CO2, REC: renewable energy consumption GDP: per capita real gross domestic product, FD: financial development | Five sub-Saharan African nations | 2000–2020 | Panel Data Analysis | The study’s variables show a strong long-term link with one another, but no substantial short-term relationship. Financial development and CO2 emissions are positively correlated, although there is a negative correlation between CO2 emissions and renewable energy usage and financial development. |
| [25] | CO2: CO2 emissions, GDP: GDP per capita, REC: renewable energy consumption and URB: urban population | EU Member States | 1996–2018 | Fully Modified Ordinary Least Square (FMOLS) Model | The variables exhibit cointegration, according to the results. The calculated FMOLS model demonstrates that while consumption of renewable energy reduces CO2 emissions, GDP and population increase CO2 consumption. The utilization of renewable energy reduces CO2 emissions according to the results. |
| [26] | CO2, primary energy consumption (PEC, exajoule) | Türkiye | 2000–2020 | Linear Regression Analysis, Quantile Regression | Results of quantile regression: Using the RMSE and MAE criteria, the model based on the dependent variable’s 0.50 quantile value is the best appropriate model. This model predicts that a unit increase in energy consumption will result in an approximate rise of 54.3 million tons in CO2 emissions. |
| [7] | CO2: carbon emissions, GDP: GDP per capita | G7 Countries | 1991–2021 | (1) Cross-section dependence, (2) CIPS panel unit root test, (3) Durbin–Hausman panel cointegration test and (4) Adjusted Least Squares (FMOLS) and Dynamic Least Squares Method (DOLS) estimators. In testing cross-sectional dependence, Breusch and Pagan used CDLM1, Pesaran CDLM2, Pesaran CD and Pesaran et al. tests | The results show that there is a negative association between the factors. Stated differently, the G7 countries’ economic expansion results in a decrease in carbon emissions. This finding implies that the environmental Kuznets hypothesis’s claim, that development and expansion will not have a negative impact on pollution but will instead reduce it, is only partially true beyond a specific stage of economic growth and development. |
| [27] | CO2: carbon emissions (metric tons) Energy consumption: energy use (kg of oil equivalent per capita) Economic growth: GDP per capita (USD) | ASEAN-5 (Indonesia, Malaysia, Philippines, Singapore and Thailand) Countries | 1990–2021 | Causality Analysis | The relationship between economic growth and CO2 emissions in Singapore was found to be bilateral; in the Philippines, the relationship between economic growth and CO2 emissions was found to be unilateral; and in Indonesia and Malaysia, the relationship between CO2 emissions and economic growth was found to be unilateral. Furthermore, in Singapore, there exists a bidirectional causal relationship between economic growth and energy consumption, whereas in Indonesia and the Philippines, there is a unilateral causal relationship between economic growth and energy consumption. |
| [28] | CO2_BUILD: CO2 from the building, GDP: GDP per capita (current US$), URB: urban population growth (annual %) ENR_BUILD: energy consumption for residential and commercial and public services includes coal, oil, bio-fuels, electricity and natural gas (kiloton of oil equivalent), FD: domestic credit to the private sector | Pakistan | 1990–2020 | The Quantile Autoregressive Distributed Lag Error Correction Model (QARDL-ECM). | The results of this study support the hypothesis that the variables under study have a long-term, asymmetric, and nonlinear connection. |
| [29] | CO2: carbon dioxide emissions metric tons per capita, AGING: the aging population(65 years and above), GDP: gross domestic product per capita (constant at 2015 USD), TRDO: trade openness (% of GDP), RE: renewable energy (% of final energy consumption) | Bangladesh, India, Nepal, Pakistan, and Sri Lanka | 1996–2020 | Panel Data Analysis | Trade openness, population aging, and economic expansion all contribute to rising carbon emissions, but renewable energy sources and unemployment lower them. Additionally, an inverted U-shaped relationship between South Asian income and carbon emissions is confirmed by this study. |
| [30] | CO2: carbon emissions per capita, GDP: GDP per capita, URB: total urbanization | BRICS (Brazil, Russia, India, China, South Africa) | 1988–2018 | Panel Data Analysis, Westerlund Panel Cointegration Test with Multiple Structural Breaks Panel Causality | The empirical study led to the conclusion that, for the relevant nations and time period, urbanization had a greater influence on CO2 emissions than economic growth. The country-based study yielded inconsistent results, but at a significance level of 1%, the bidirectional causal link between urbanization, economic growth, and CO2 emissions was established. |
| Variable | Source | Measurement | Definition |
|---|---|---|---|
| CO2 Emissions | Turkish Statistical Institute (TURKSTAT) | Metric Tons | CO2 emissions refer to carbon dioxide released into the atmosphere as a result of burning fossil fuels, deforestation and various industrial processes. |
| GDP Per Capita Growth | World Bank Indicator | Annual Percentage | GDP per capita is an indicator that measures the pace of economic growth, obtained by dividing gross domestic product by the mid-year population. |
| Population Growth | World Bank Indicator | Annual Percentage | The exponential growth rate of the mid-year population, which includes all people living in a nation regardless of their citizenship or legal status, expressed as a percentage over the years t − 1 to t, is the population growth rate for year t. |
| Renewable Energy Consumption | World Bank Indicator | Percentage of Total Final Energy Consumption | Renewable energy consumption is the proportion of energy produced from renewable sources to total final energy use. |
| CO2 Emissions | GDP Per Capita Growth | Population Growth | Renewable Energy Consumption | |
|---|---|---|---|---|
| Number of observations | 32 | 32 | 32 | 32 |
| Mean | 2.8615 | 3.2684 | 1.4266 | 16.6843 |
| Standard Deviation | 0.9275 | 4.5619 | 0.2485 | 4.4377 |
| Variance | 0.8604 | 20.8116 | 0.0617 | 19.6936 |
| Skewness | 0.2233 | −0.8515 | −0.4117 | 0.5355 |
| Kurtosis | 1.7231 | 2.9996 | 3.395 | 1.7896 |
| Minimum | 1.5414 | −7.1382 | 0.7967 | 11.4 |
| Maximum | 4.5524 | 10.4294 | 1.8934 | 24.4 |
| Dependent Variable: CO2 Emission | ||||
|---|---|---|---|---|
| Variables | Coefficient | Standard Error | t | p-Value |
| Constant | 6.0405 | 0.4658 | 12.97 | 0.000 |
| GDP Per Capita Growth | 0.0008 | 0.0166 | 0.05 | 0.959 |
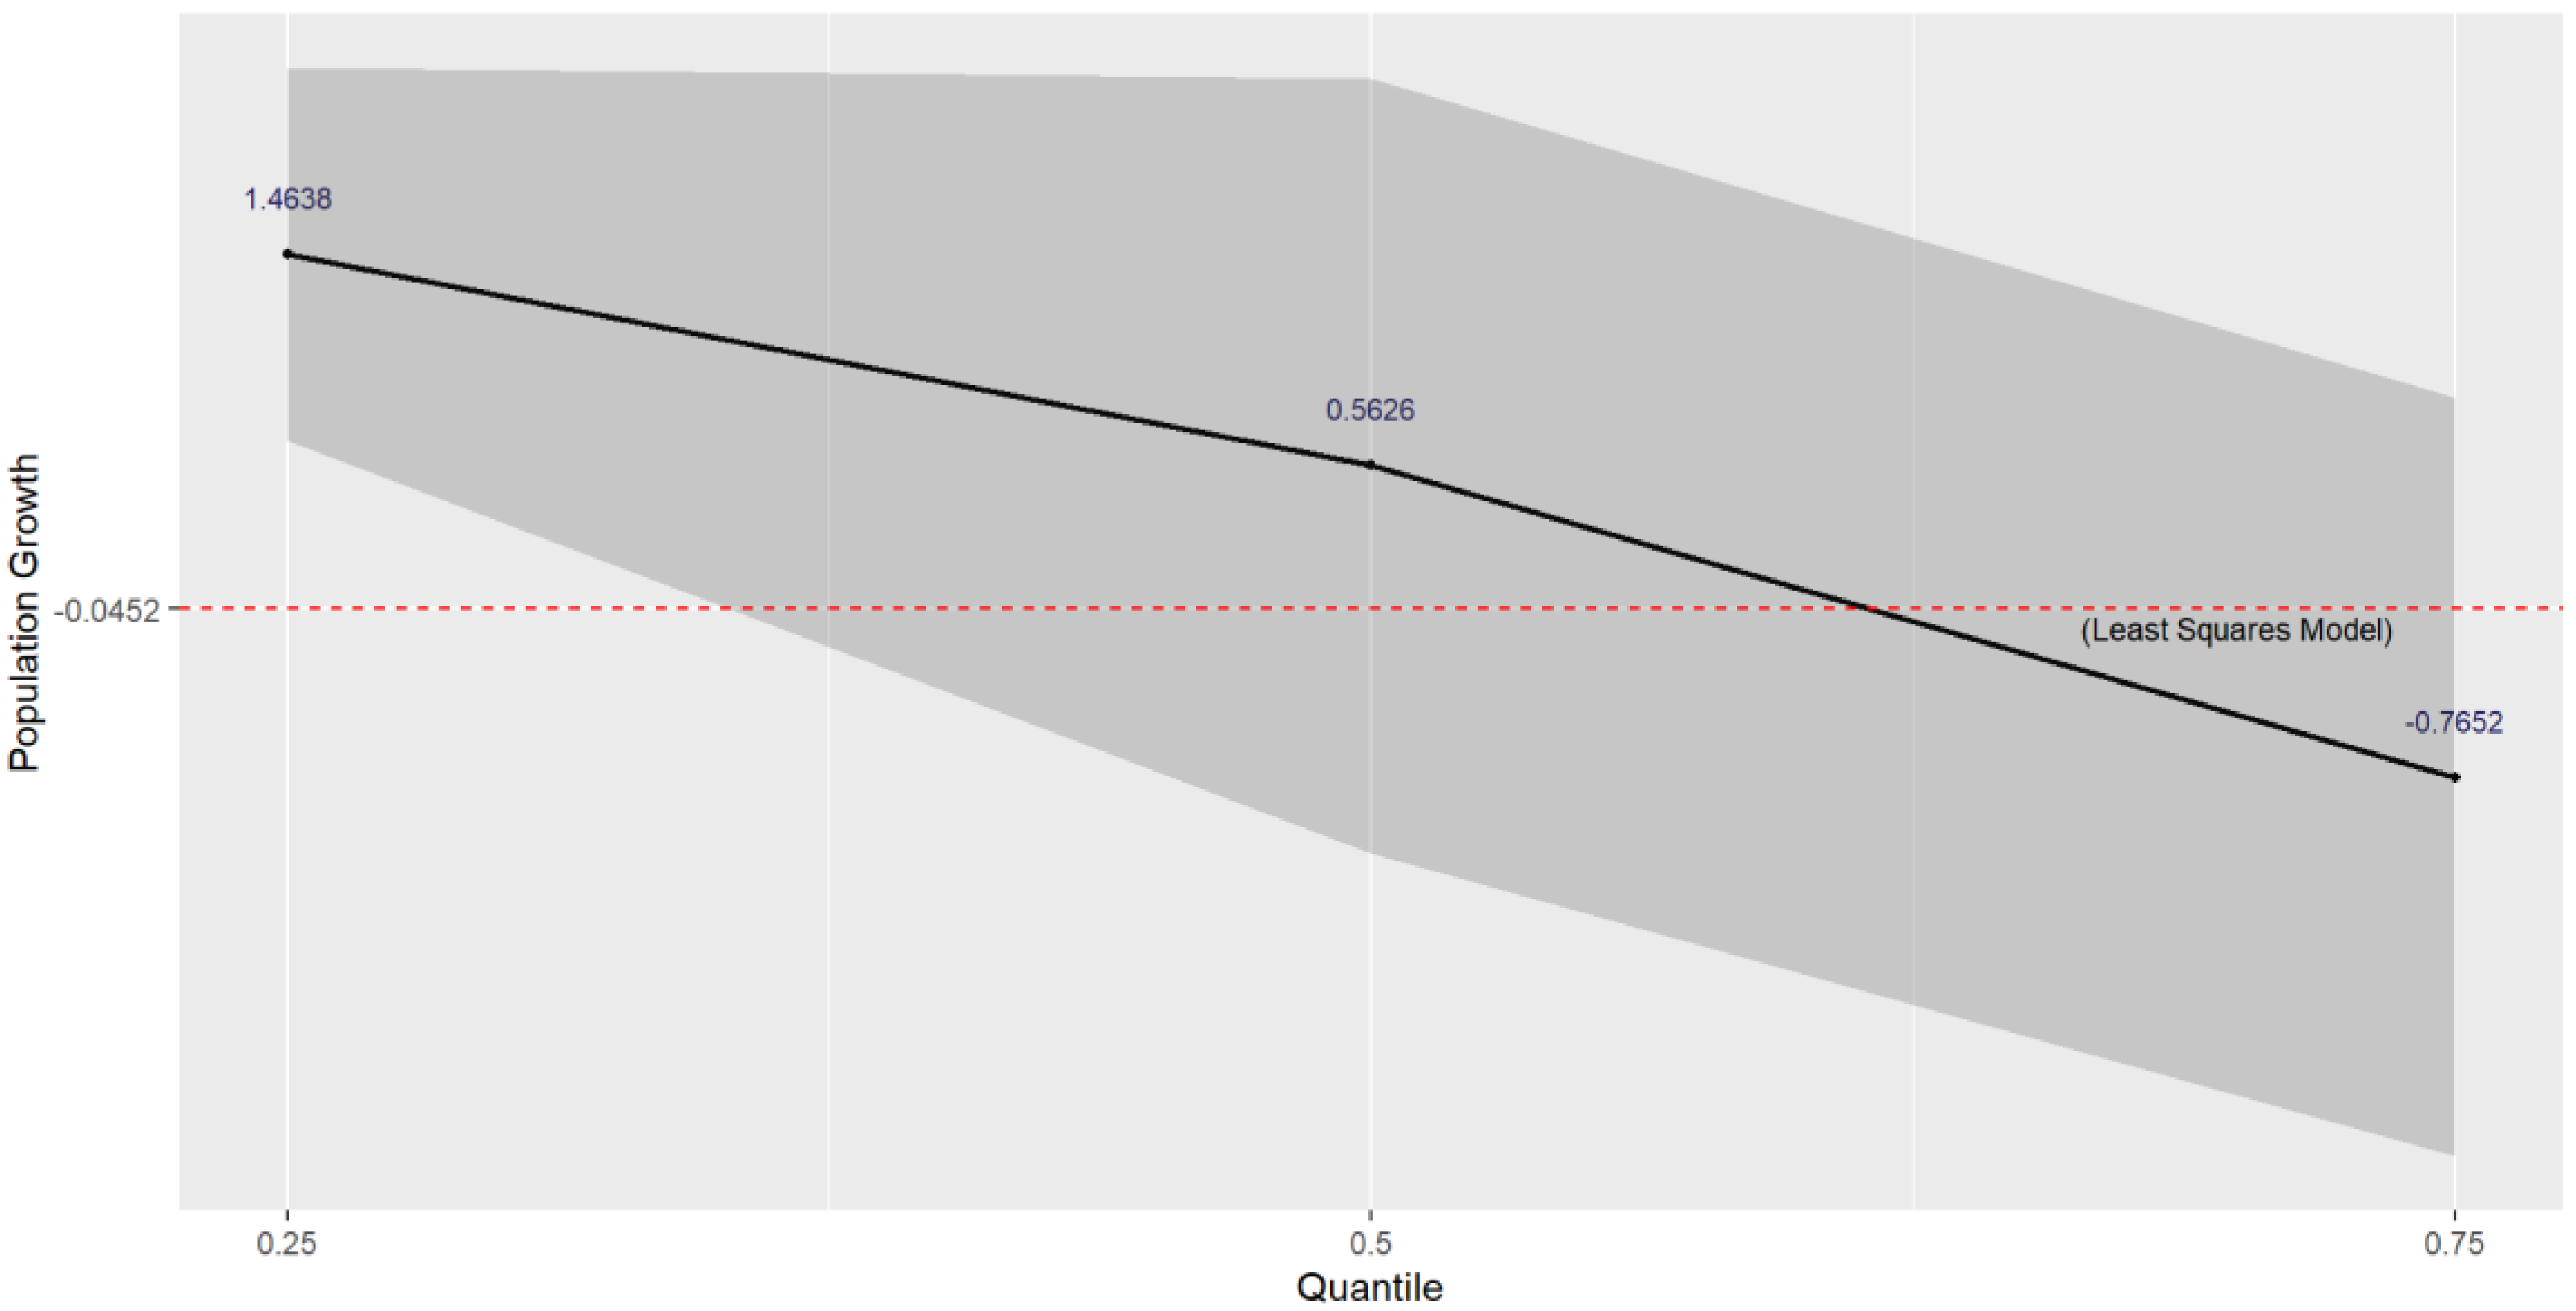
| Population Growth | −0.0452 | 0.5242 | −0.09 | 0.932 |
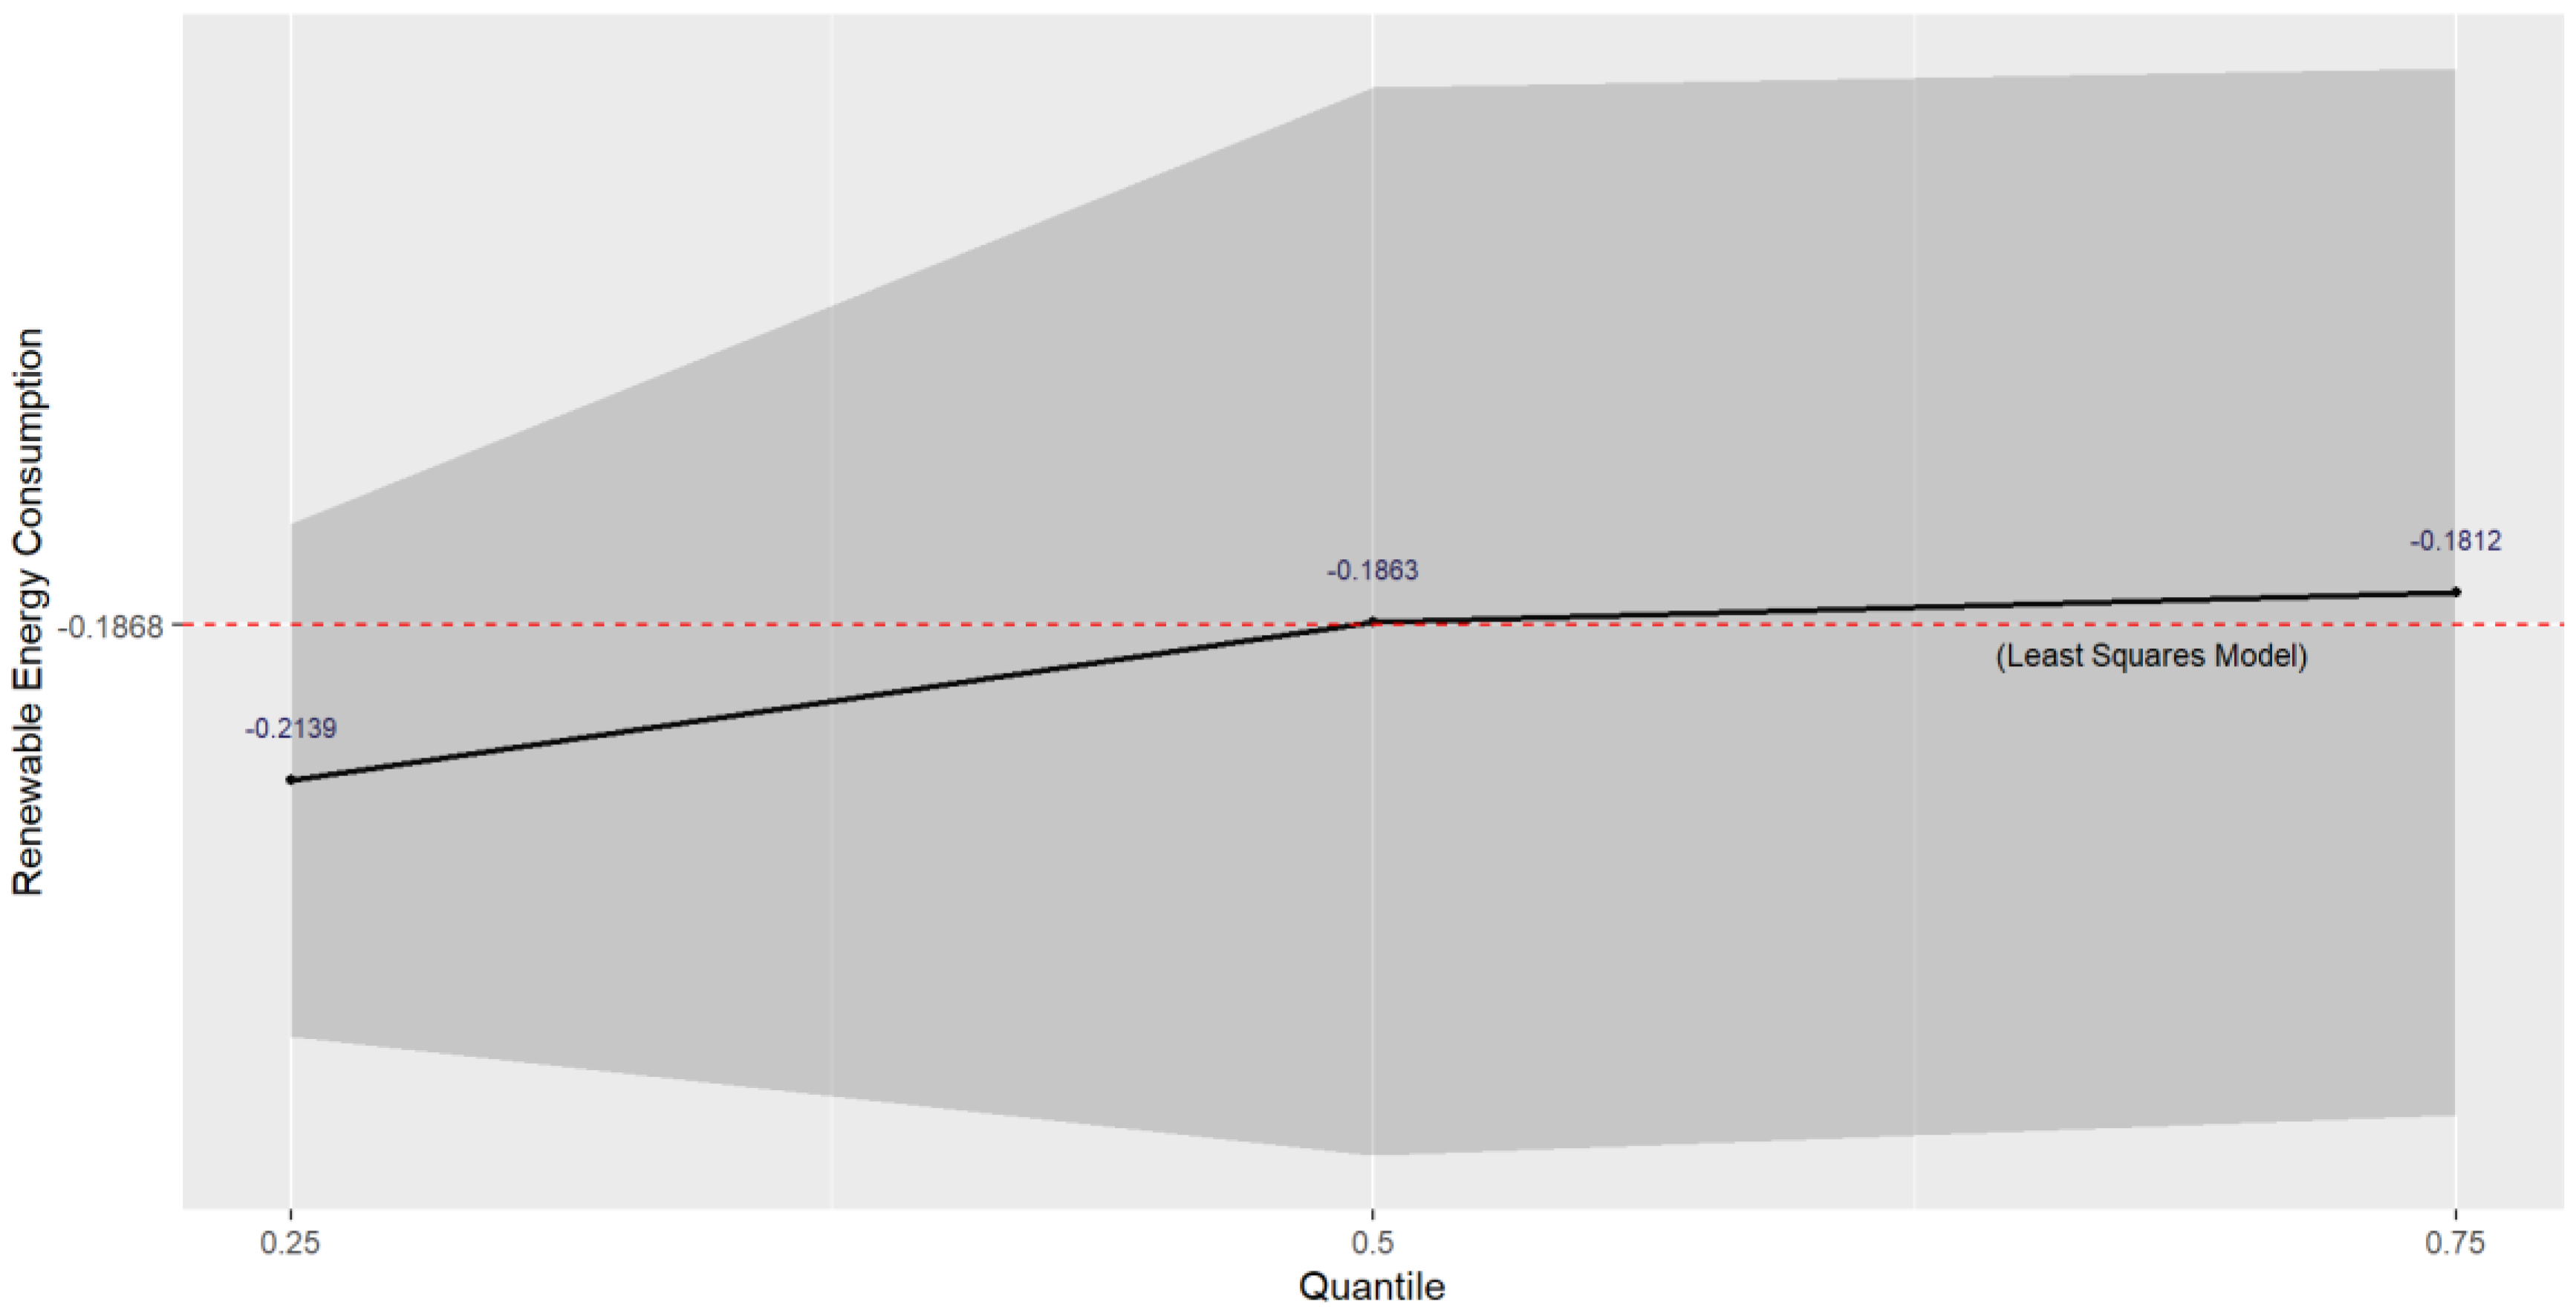
| Renewable Energy Consumption | −0.1868 | 0.0294 | −6.34 | 0.000 |
| Quantile | Variables | Coefficient | Standard Error | t | p-Value |
|---|---|---|---|---|---|
| 0.25 | Constant | 3.973 | 0.3446 | 11.53 | 0.000 |
| GDP Per Capita Growth | 0.0024 | 0.0123 | 0.20 | 0.841 | |
| Population Growth | 1.4638 | 0.3878 | 3.77 | 0.001 | |
| Renewable Energy Consumption | −0.2139 | 0.0217 | −9.82 | 0.000 | |
| 0.50 | Constant | 5.0572 | 0.7171 | 7.05 | 0.000 |
| GDP Per Capita Growth | −0.0048 | 0.0256 | −0.19 | 0.852 | |
| Population Growth | 0.5626 | 0.8070 | 0.70 | 0.852 | |
| Renewable Energy Consumption | −0.1863 | 0.0453 | −4.11 | 0.000 | |
| 0.75 | Constant | 7.3721 | 0.7022 | 10.50 | 0.000 |
| GDP Per Capita Growth | −0.0033 | 0.0250 | −0.13 | 0.896 | |
| Population Growth | −0.7652 | 0.7903 | −0.97 | 0.341 | |
| Renewable Energy Consumption | −0.1812 | 0.0444 | −4.08 | 0.000 |
Disclaimer/Publisher’s Note: The statements, opinions and data contained in all publications are solely those of the individual author(s) and contributor(s) and not of MDPI and/or the editor(s). MDPI and/or the editor(s) disclaim responsibility for any injury to people or property resulting from any ideas, methods, instructions or products referred to in the content. |
© 2024 by the authors. Licensee MDPI, Basel, Switzerland. This article is an open access article distributed under the terms and conditions of the Creative Commons Attribution (CC BY) license (https://creativecommons.org/licenses/by/4.0/).
Share and Cite
Türkyılmaz, S.; Öztürk, K.N. Analysis of Factors Affecting CO2 Emissions in Türkiye Using Quantile Regression. Sustainability 2024, 16, 9634. https://doi.org/10.3390/su16229634
Türkyılmaz S, Öztürk KN. Analysis of Factors Affecting CO2 Emissions in Türkiye Using Quantile Regression. Sustainability. 2024; 16(22):9634. https://doi.org/10.3390/su16229634
Chicago/Turabian StyleTürkyılmaz, Serpil, and Kadriye Nurdanay Öztürk. 2024. "Analysis of Factors Affecting CO2 Emissions in Türkiye Using Quantile Regression" Sustainability 16, no. 22: 9634. https://doi.org/10.3390/su16229634
APA StyleTürkyılmaz, S., & Öztürk, K. N. (2024). Analysis of Factors Affecting CO2 Emissions in Türkiye Using Quantile Regression. Sustainability, 16(22), 9634. https://doi.org/10.3390/su16229634