Article

Urban Transportation Data Research Overview: A Bibliometric Analysis Based on CiteSpace

1
School of Economics and Management, Tongji University, Shanghai 200092, China
2
School of Economics and Management, Beibu Gulf University, Qinzhou 535011, China
3
Beibu Gulf Marine Development Research Center, Qinzhou 535011, China
4
State Cloud Technology Company, Guangzhou 510308, China
*
Author to whom correspondence should be addressed.
Sustainability 2024, 16(22), 9615; https://doi.org/10.3390/su16229615
Submission received: 16 September 2024 / Revised: 1 November 2024 / Accepted: 3 November 2024 / Published: 5 November 2024
(This article belongs to the Section Sustainable Transportation)

Abstract

:
Urban transportation data are crucial for smart city development, enhancing traffic management’s intelligence, accuracy, and efficiency. This paper conducts a comprehensive investigation encompassing policy analysis, a literature review, concept definition, and quantitative analysis using CiteSpace from both domestic and international perspectives. Urban transportation data comprise multiple dimensions, such as infrastructure status, real-time monitoring, policy planning, and environmental assessment, which originate from various sources and stakeholders. Highly influential authors and active institutions, particularly in the USA, China, Canada, and England, contribute significantly to extensive and collaborative research. Key areas include intelligent transportation, traffic flow prediction, data fusion, and deep learning. Domestic research focuses on practical applications, while international studies delve into interdisciplinary research areas. With advancements in intelligent systems and big data technology, research has evolved from basic data collection to sophisticated methodologies, such as deep learning and spatiotemporal analysis, driving substantial progress. This paper concludes by recommending enhanced data integration, improved privacy and security, fostering big data and AI applications, facilitating policy formulation, and exploring innovative transportation modes, thereby underscoring the importance of urban transportation data in shaping the future of smart cities. The findings provide theoretical and practical guidance for the future intelligence, efficiency, and sustainability of urban transportation systems.

1. Introduction

Urban transportation is a vital component of city infrastructure, encompassing various modes such as private transportation, public transportation, professional transportation, walking, emerging shared transportation, and intra-city air and water transportation. These modes of transportation operate within a complex road system that includes ground, underground, elevated, waterway, and cableway routes across cities and suburban areas. Urban transportation’s efficient operation is crucial for the overall development of cities, facilitating the movement of people and goods and enhancing quality of life for urban residents. Smart transportation refers to the use of modern information technology to carry out comprehensive and in-depth intelligent transformation and improvement of traffic management, transportation, public travel, and other aspects by deeply mining transportation-related data and establishing a real-time dynamic information service system. The foundation of smart transportation development rests on the efficient collection, integration, and analysis of urban transportation data, which are generated in real-time and accumulated in a substantial historical database. These data are characterized by their large volume, diverse sources, and complexity, encompassing vehicle driving trajectories, traffic flow and congestion, public and shared transportation operations, intelligent transportation systems, transportation infrastructure, parking management, travel demand, traffic accident data, special event information, and other multidimensional aspects. In 2023, the open data capacity of the transportation department reached 1.081 billion, ranking second only to the market supervision and management department and the ecological and environmental protection department [1]. Furthermore, the scale of China’s intelligent transportation market is expected to reach CNY 261 billion in 2024 and will continue to grow at a rapid rate [2].
In recent years, the Chinese government has placed significant emphasis on the development of smart transportation. It has actively supported and promoted the capitalization and valuation processes of urban transportation data through a series of policies, as shown in Table A1. These policies not only provide guidance and support for the collection and integration, processing and analysis, platform construction, open sharing, and innovative applications of urban transportation data but also emphasize the important role of data resources in transportation development and encourage enterprises and social institutions to engage in innovative applications. In particular, documents such as the “Implementation Plan for Promoting ‘Internet +’ Convenient Transportation to Advance the Development of Intelligent Transportation” [3] and the “Action Outline for Promoting the Development of Big Data in Comprehensive Transportation (2020–2025)” [4] clearly propose the application of big data to improve collaborative transportation management and public service capabilities, thereby promoting the deep integration of big data with comprehensive transportation systems. Driven by both policy support and market demand, urban transportation data will play an increasingly important role. Consequently, sorting out and analyzing the research progress in this field will facilitate the innovation and application of smart transportation technology, while also providing both theoretical support and practical guidance for the sustainable development of smart transportation.
Despite the Chinese government’s introduction of various policies aimed at promoting the development of smart transportation and big data, several challenges persist in the actual implementation process. For instance, the concept of urban transportation data remains inadequately defined, resulting in cognitive confusion and inconsistent practical operations, which in turn hamper the efficiency of data sharing and utilization. Additionally, the full potential of urban transportation data has yet to be realized, and the development of its data trading market is lagging. Furthermore, with the increasingly severe issues of urban traffic congestion and environmental pollution, research on urban transportation data has become crucial for addressing these challenges. To gain a deeper understanding of these issues, Section 2 systematically analyzes the current research status of urban transportation data both domestically and internationally through a comprehensive literature review. Section 3 summarizes the relevant definitions of urban transportation data, subsequently defining the concept itself while clarifying its types, sources, application scenarios, and users. Section 4 describes the research methods and data sources of this paper. In Section 5, CiteSpace is employed to conduct a quantitative analysis of the relevant literature, encompassing aspects such as publication year, core author groups, research institutions, and countries, as well as keyword co-occurrence networks. This analysis seeks to reveal the research hotspots, frontiers, and shortcomings in the field of urban transportation data, and provide direction and reference for subsequent research. Section 6 explores the application of smart city transportation data through case analysis and highlights the challenges associated with urban transportation data in terms of privacy protection and security. In Section 7, the current research results are summarized and future research directions are discussed in the field of urban transportation data research through comprehensive analysis. This paper aims to promote the construction of a digital economy and smart transportation, efficiently and standardly utilize urban transportation data resources, optimize urban traffic management, and promote the intelligent, efficient, and sustainable development of the transportation system. The main contributions of this paper can be summarized as follows:
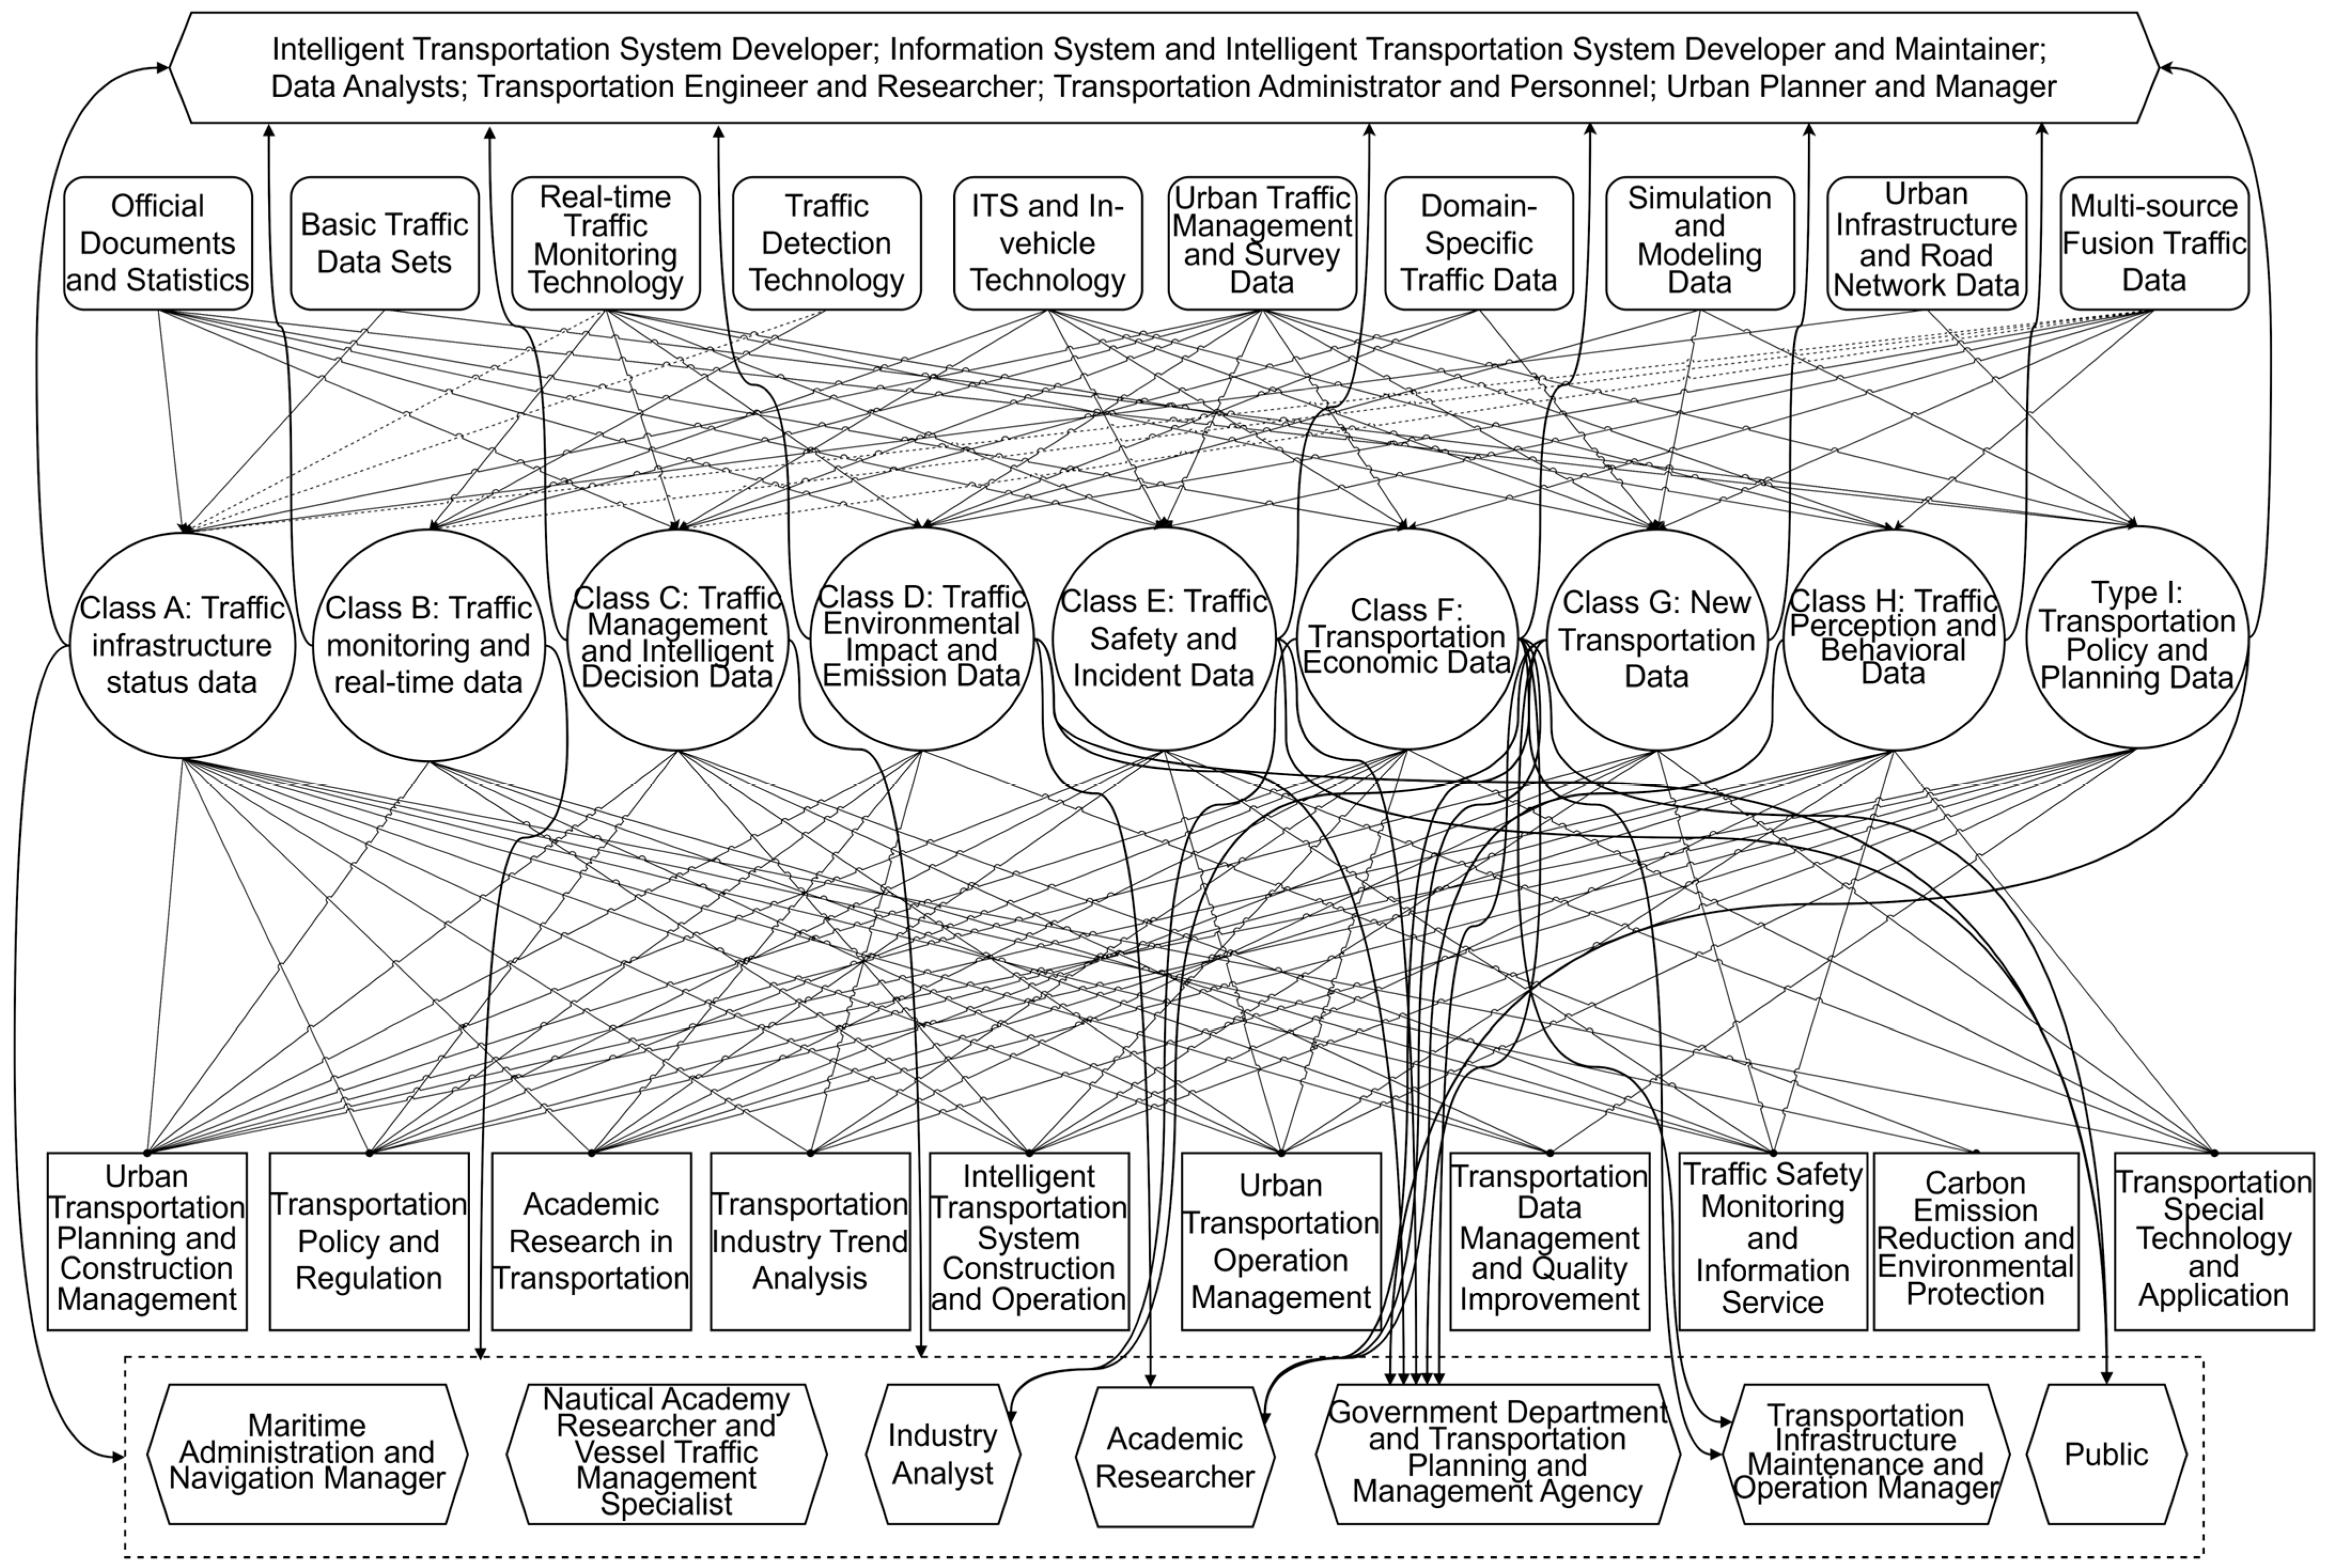
  • It presents a systematic categorization of concepts, types, sources, application scenarios, and users of urban transportation data, thereby establishing a clear theoretical framework for subsequent research;
  • It identifies key hotspots in urban transportation data on both domestic and international levels using CiteSpace, including areas such as intelligent transportation, traffic flow prediction, data fusion, and deep learning;
  • Additionally, a comparative analysis of the research differences between domestic and foreign sources is conducted, resulting in targeted policy recommendations that provide guidance for future research and applications of urban transportation data.

2. Literature Review

Smart transportation data management, as a new productive force driving the development of the transportation sector, hinges on the efficient utilization of urban transportation data, exerting a profound impact on supporting energy-saving transportation projects in smart cities [5]. Currently, urban transportation data not only promote data as a key production factor in terms of workers, labor objects, labor tools, and infrastructure but also promote the development of economic and social needs [6]. In light of this context, significant advancements have been achieved in the research of transportation data prediction models. A variety of models have emerged, including the spatiotemporal graph convolution model [7], the urban traffic congestion prediction model based on deep learning [8], support vector regression combined with a long short-term memory prediction model [9], and the multi-period component spatiotemporal neural network model [10], all of which have significantly improved the accuracy of traffic flow prediction. Simultaneously, data security and privacy protection have emerged as critical areas of research. References [11,12] offer analyses and monitoring solutions to address the risks of data leakage and misuse in urban transportation, thereby establishing a robust theoretical foundation for the management and security assurance of urban transportation data. Currently, the application of urban transportation data across various fields has demonstrated significant practicality and far-reaching impacts.

2.1. Theory and Practice of Urban Transportation Data Application

A series of studies, including urban transportation data analysis and event detection [13,14,15], traffic safety and risk assessment [16,17,18], energy management and environmental impact assessment [19,20,21], and ecological protection [22], have provided important theoretical and practical support for urban transportation data. Specifically, based on urban transportation data, technologies such as data-driven approaches, computer vision, and anomaly detection are employed to significantly improve traffic flow prediction [23,24,25] and enhance event detection accuracy [26,27], as well as to bolster the safety of transportation infrastructure [28,29,30]. By utilizing trajectory data [31,32], driver data [33,34,35], traffic signal information [36], and pedestrian data [37,38], a comprehensive assessment and analysis of collision risk can be conducted. Methods and technologies such as cloud speed planning [39], ecological routing algorithms [40], Internet of Vehicles technology [41], spatiotemporal speed prediction [42], and adaptive dynamic programming [43] have brought new perspectives to optimize traffic flow and improve energy efficiency. In addition, research on the energy consumption and regional traffic emissions of private cars and buses [44,45,46], as well as the measurement and modeling of highway carbon emissions [47], offers robust data support for policy formulation.

2.2. Application Scenarios and Value Display of Urban Transportation Data

The application of urban transportation data can also be extended to the accessibility of elderly care institutions [48], the spatiotemporal accessibility of medical services [49], urban rail or road visualization [50,51], transportation planning [52,53], epidemic risk analysis [54], and many other fields. At the same time, research on the establishment of causal relationships in spatiotemporal data [55] and the development of data collection technology in urban traffic control [56] have further promoted the application of transportation data. In addition, transportation data are widely utilized across various fields, including pedestrian behavior prediction [57], non-motor vehicle travel pattern analysis [58,59,60], driver psychology and behavior analysis [61,62], taxi travel pattern and route prediction [63], electric vehicle charging planning [64,65,66], public transportation system spatiotemporal demand prediction [67,68], vehicle signal extraction [69], traffic signal optimization [70], human–computer interaction system design [71], traffic noise [72], and air pollution prediction [73,74,75], as well as traffic system emission measurement [76,77,78], drone operation [79], automatic driving control [80,81], and parking management [82]. This demonstrates its significant application potential and value.

2.3. New Technologies for Urban Transportation Data Collection, Processing, and Analysis

In the domain of intelligent networked vehicle trajectory prediction and traffic flow forecasting, researchers have markedly enhanced prediction accuracy through the hyper-relational multi-modal trajectory prediction method [83] and have optimized resource allocation utilizing a multi-channel edge computing system [84]. Furthermore, edge computing technology also offers efficient connection services and data loss prediction, effectively ensuring the privacy of vehicle users [85,86]. Within intelligent transportation systems, deep learning technology grounded in the Internet of Things enhances the accuracy of data collection and analysis [87], while blockchain technology strengthens data security and privacy protection [88,89,90]. Regarding data sharing in the Internet of Vehicles, the integrated application of blockchain, the Internet of Things, edge computing, and other technologies not only strengthens the security and integrity of data sharing [91,92,93] but also diminishes the energy consumption of the transportation system by optimizing traffic management [94]. Collectively, these technological advancements provide robust technical support for urban traffic management.

2.4. Literature Commentary

The existing literature indicates that the application of urban transportation data encompasses various domains, including traffic flow prediction, event detection, traffic safety and risk assessment, energy management, and environmental impact assessment, thereby demonstrating its widespread influence. Simultaneously, the continuous emergence of new technologies, including intelligent networking, edge computing, and blockchain, has significantly enhanced the capabilities for collecting, processing, and analyzing urban transportation data. However, the definition of urban transportation data in current research remains inconsistent, with a lack of clear conceptual frameworks, and comprehensive bibliometric analysis is relatively insufficient. Most studies focus on technical details or case analysis, lacking an in-depth analysis and synthesis of research hotspots, trends, and challenges within this field from a macro perspective. This paper aims to provide a clear definition of urban transportation data through conceptual clarification and bibliometric analysis, explore research hotspots, trends, and challenges, and propose targeted research recommendations to foster the in-depth development of research on urban transportation data. Furthermore, it seeks to promote the widespread application of these data in smart city traffic management.

3. Concept Definition of Urban Transportation Data

In academia, the term “transportation data” is commonly used, yet there are comparatively few references that specifically highlight “urban transportation data”. Therefore, this paper chose to use “transportation data” as the search term with which to conduct a literature search. On this basis, it further narrowed down and focused on the research literature in the field of urban transportation. Table A2 presents the definition of transportation data within Chinese academic circles. In conjunction with the previously discussed concepts of urban transportation and smart transportation, it can be concluded that urban transportation data refer to the public travel, passenger, and cargo data in the urban (including urban and suburban) transportation system. Transportation data is a general term for various types of data arising from transportation and other related activities. These data come from a variety of sources, including but not limited to traffic management systems, intelligent transportation systems, road sensors, coil detectors, cameras, operating vehicles, etc., and cover both static and dynamic types. Static transportation data mainly include the general geographical elements of the city and the attribute information of traffic management elements (such as road networks, transportation facilities, etc.), while dynamic transportation data involve real-time change information on traffic flow, speed, occupancy, traffic video, vehicle location, etc. Urban transportation data are characterized by their diverse types, varying formats and data standards, large volume, multi-dimensionality, frequent updates, and strong spatiotemporal correlations. These data serve as the foundation for the development of smart transportation systems. By leveraging modern information technology, we can conduct thorough analyses of these data and develop a real-time dynamic information service system that comprehensively improves and transforms various aspects of urban transportation. For instance, urban geographic information systems utilize drone aerial photography and satellite remote sensing technology to gather high-precision static transportation data, thereby assisting urban planners in optimizing road layouts and enhancing urban traffic operation efficiency. Additionally, by deploying advanced devices such as cameras and coil detectors on critical road segments, real-time dynamic transportation data are collected. These data are processed using big data analysis technology to support the dynamic adjustment of signal timing in intelligent signal control systems, thereby alleviating traffic congestion and enhancing road traffic capacity.
Since relevant research on urban transportation data in academia can intuitively demonstrate its value, this paper aims to systematically sort out and summarize the types of urban transportation data through a detailed analysis of the relevant literature (Table A3). Specifically, an in-depth analysis was carried out on 124 items of literature published in core Chinese journals and higher (numbered C1–C124) and 91 first-region items of SCI literature (numbered W1–W91) with Chinese regional institutions as the first affiliated unit. The 215 total items of literature are all sourced from the literature data source used for quantitative analysis in Part 4. They have been sorted one by one according to their serial number, title, author, data content, data source, application scenario, and data user. Then, based on their relevance, the main urban transportation data were further summarized and categorized, and the comparable data sources, application scenarios, and data user profiles were sorted.
According to the sample data in Figure 1, it can be seen that from the perspective of Chinese academic research, Category C (traffic management and intelligent decision data), Category B (traffic monitoring and real-time data), and Category I (transportation policy and planning data) occupy prominent positions, reaching, respectively, 29%, 28%, and 19%. It shows the important role of these three types of data in traffic management and decision-making. Category F (transportation economic data) and Category A (traffic infrastructure status data) account for the smallest proportions at only 2% and 3%, which shows that in the overall urban transportation data system, information on transportation cost-effectiveness and infrastructure status is relatively limited. Category E (traffic safety and incident data), Category D (traffic environmental impact and emission data), and Category G (new transportation data) account for 5%, 4.41%, and 4.06%, respectively. In addition, Category H (traffic perception and behavioral data) represents 6%, highlighting the public’s concern regarding the behaviors and perceptions of traffic participants. Collectively, these data contribute to a diverse pattern of urban transportation data ecology, offering a robust and comprehensive informational foundation for transportation planning, environmental protection, safety management, and economic analysis.
By sorting out and summarizing the relevant research on urban transportation data in Chinese academic circles, the main data sources of urban transportation data are shown in Table A4. They cover a wide range from official documents and statistical data to multi-source fusion transportation data. Clarifying the channels for obtaining urban transportation data can help researchers deeply understand and analyze urban traffic conditions, and provide a scientific basis for urban traffic planning, management, and policy formulation.
By synthesizing and summarizing pertinent research on urban transportation data within Chinese academic circles, Table A5 illustrates the primary application scenarios of urban transportation data. These scenarios encompass various aspects, including urban traffic planning, construction management, and specialized transportation technologies and their applications. Such application scenarios illustrate the extensive value and potential of urban transportation data, which not only provide a scientific basis for planning, management, and policy formulation but also promote academic research in transportation, industry trend analysis, and the development of intelligent transportation systems. Furthermore, they emphasize the importance of data management, security, and environmental protection, highlighting their critical role in promoting the sustainable development of transportation and ensuring safe public travel.
By synthesizing and summarizing pertinent research on urban transportation data within Chinese academic circles, Table A6 illustrates the primary users of urban transportation data, encompassing a diverse range of fields and roles, from intelligent transportation system developers to the general public. Urban transportation data are crucial in facilitating the work and research of these users, who depend on and utilize these data to varying extents based on their specific needs for data mining, analysis, system development, transportation planning and management, and policy formulation.
Figure 2 illustrates the relationships among data sources, application scenarios, and data users concerning various urban transportation datasets. From the perspective of data sources, all data types include urban traffic management and survey data. Notably, multi-source fusion transportation data are referenced across multiple data types, indicating that cross-type data constitute a significant source for urban transportation information. Furthermore, common data sources for various data types also encompass real-time traffic monitoring technology, official documents and statistics, intelligent transportation systems, and in-vehicle technology. It is important to note that the data sources in Categories C, D, and G also encompass transportation data in specific domains. Additionally, the data sources in Categories A and I include foundational transportation data sets, as well as data related to urban infrastructure and road networks. Moreover, the data sources in Categories A and B incorporate traffic detection technology. This highlights the diversity and complexity inherent in urban transportation data sources. From the perspective of application scenarios, urban transportation planning and construction management, transportation policy and regulation formulation, academic research in the transportation field, intelligent transportation system construction and operation, and urban transportation operation management are common application scenarios for various data types. Additionally, traffic safety monitoring and information services, transportation industry trend analysis, and special transportation technologies and applications are also important application scenarios across data types. Furthermore, the application scenarios of Categories A, B, C, and I encompass transportation data management and quality improvement, while Categories A and D additionally address carbon emission reduction and environmental protection. From the perspective of data users, Categories A, B, and C encompass all data users, highlighting the broad applicability of these three categories of data within the transportation field. Common data users across all data types include developers of intelligent transportation systems, information systems, maintenance personnel, data analysts, traffic engineers, researchers, and personnel from traffic management departments, as well as urban planners and managers. Additionally, government departments and transportation planning and management agencies are also listed as users of various data types, reflecting the key role of transportation data in government management and planning. Furthermore, data users in Categories D, G, and H also comprise academic researchers, emphasizing the significance of these data in academic research. The data users of Categories D, E, and F also involve the public, reflecting the concept of providing transportation data services to the public. Moreover, data users in Categories F and G also include industry analysts and transportation infrastructure maintenance and operation managers, further illustrating the application value of transportation data in industry analysis and infrastructure maintenance.

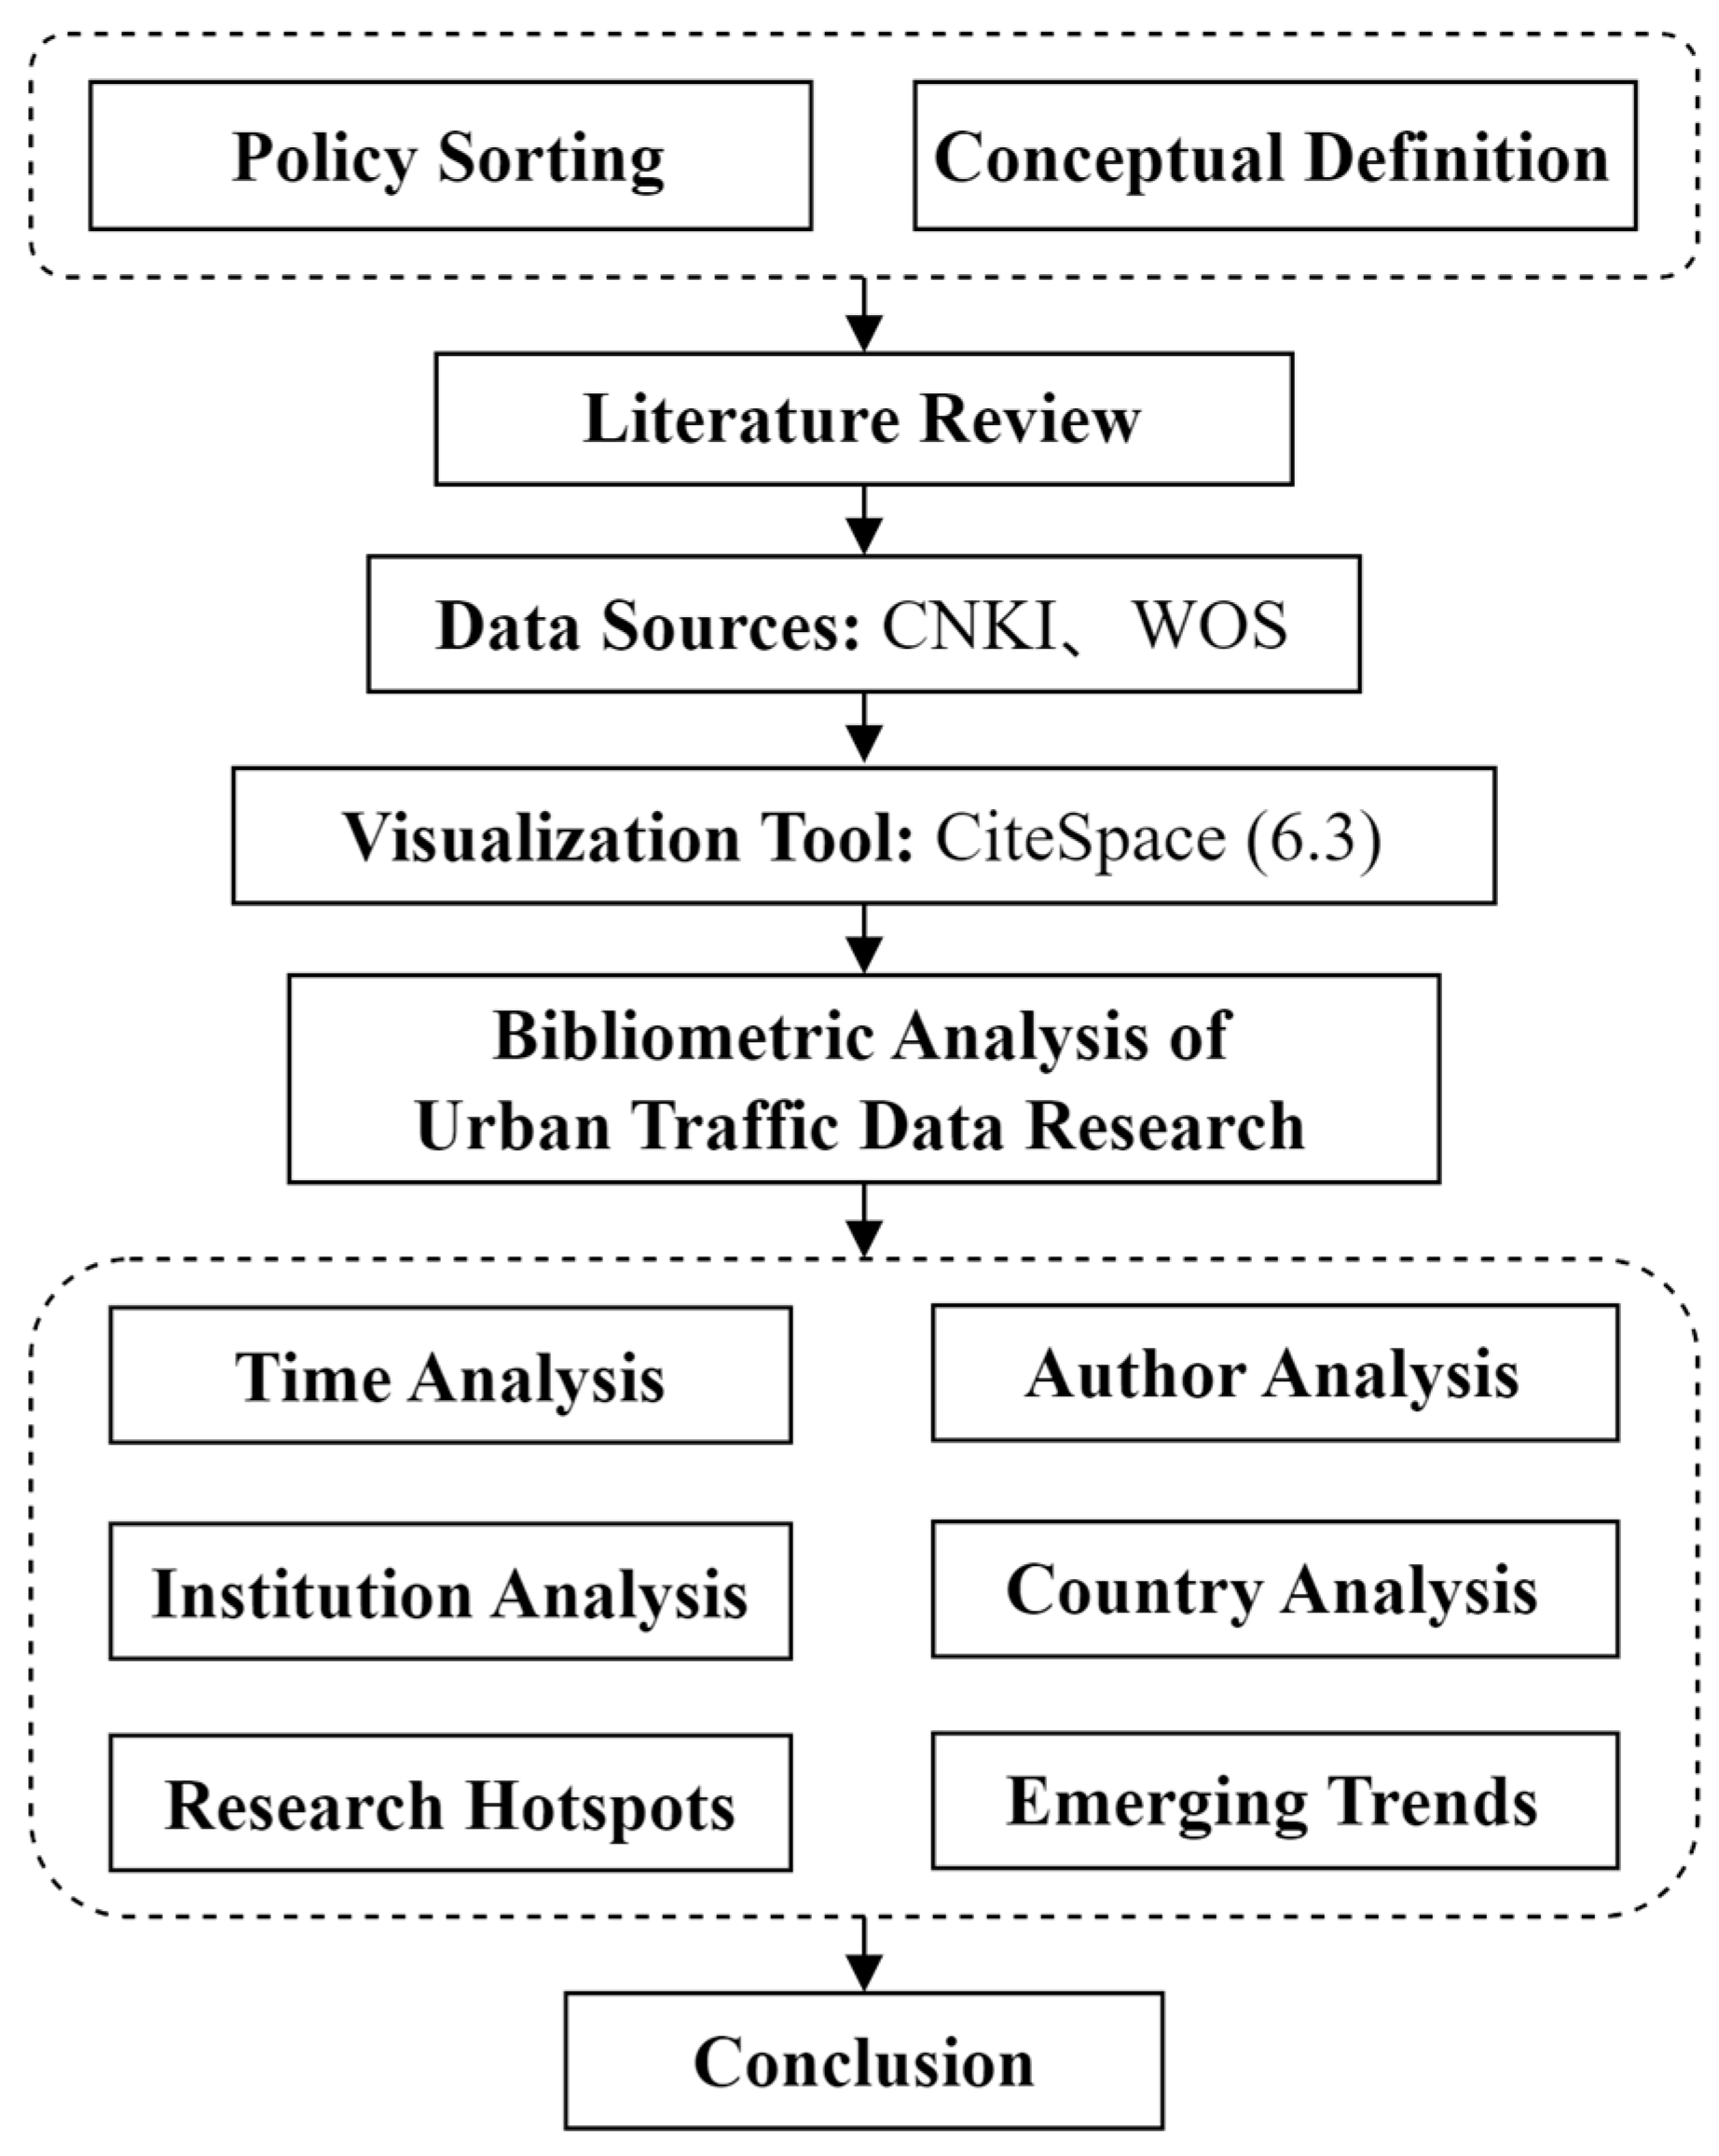
4. Research Methods and Data Sources

This paper primarily utilizes the relevant research literature from China National Knowledge Infrastructure (CNKI) and WOS. CNKI encompasses the core research literature from core Chinese journals and above, while WOS includes the core collections of the SCIE and SSCI research literature.

4.1. Research Method

CiteSpace, a scientific bibliometric software developed on the Java platform, is extensively utilized in the construction of knowledge graphs and visualization analysis within academic research domains. Through the meticulous mining and analysis of the literature data, it adeptly uncovers the research hotspots, frontier trends, and historical evolution trajectories of a given field, thereby facilitating a comprehensive understanding and grasp of the field’s development trajectory. Based on previous research, this paper uses CiteSpace (6.3) software to conduct basic data analysis, produce a visual presentation of the relevant literature in the CNKI and WOS databases, analyze its thematic evolution and research development trends, and help scholars systematically grasp the research progress and thematic evolution of urban transportation data. Figure 3 shows the research framework and main analysis content of this paper. To gain a deeper understanding of research trends and emerging frontiers in the academic community regarding urban transportation data, it conducts a quantitative analysis of the relevant literature. This analysis covers various aspects, including publication year, co-authorship, institutions, countries, research hotspots, and cutting-edge trends, which aim to offer valuable references and recommendations for future research in the field of urban transportation data.

4.2. Data Source

This paper builds basic analysis databases based on the research literature data of CNKI and WOS (the deadline is 30 June 2024) and compares and analyzes the research content and progress of urban transportation data in Chinese and international academic circles. (1) Utilizing advanced search functions in CNKI, set the search conditions to either the title or keyword “transportation data” with exact matching, and search the literature indexed in the SCI, EI, Peking University Core, and CSSCI journals. After the preliminary search, 126 items of authoritative literature on transportation data were obtained. In order to reduce the impact of research literature with low relevance, this paper screened the items one by one to eliminate the literature with low relevance to the topic and those that have not been officially published. Simultaneously, any items of literature in the field of non-urban transportation were eliminated. Finally, 119 valid items of literature on urban transportation data were obtained. (2) Select the core collection (SCI-EXPANDED and SSCI) on the WOS official website and choose the paper types as “Article” and “Review Article”. Use the advanced search function and set the search conditions to look for the two words “transportation” and “data” or the two words “traffic” and “data” appearing simultaneously in the title, abstract, or keywords. A total of 3884 pieces of literature related to transportation data were initially obtained. Following a thorough screening process to identify highly relevant studies, 1575 valid sources specifically focused on urban transportation data were selected.

5. Econometric Analysis of Urban Transportation Data Research
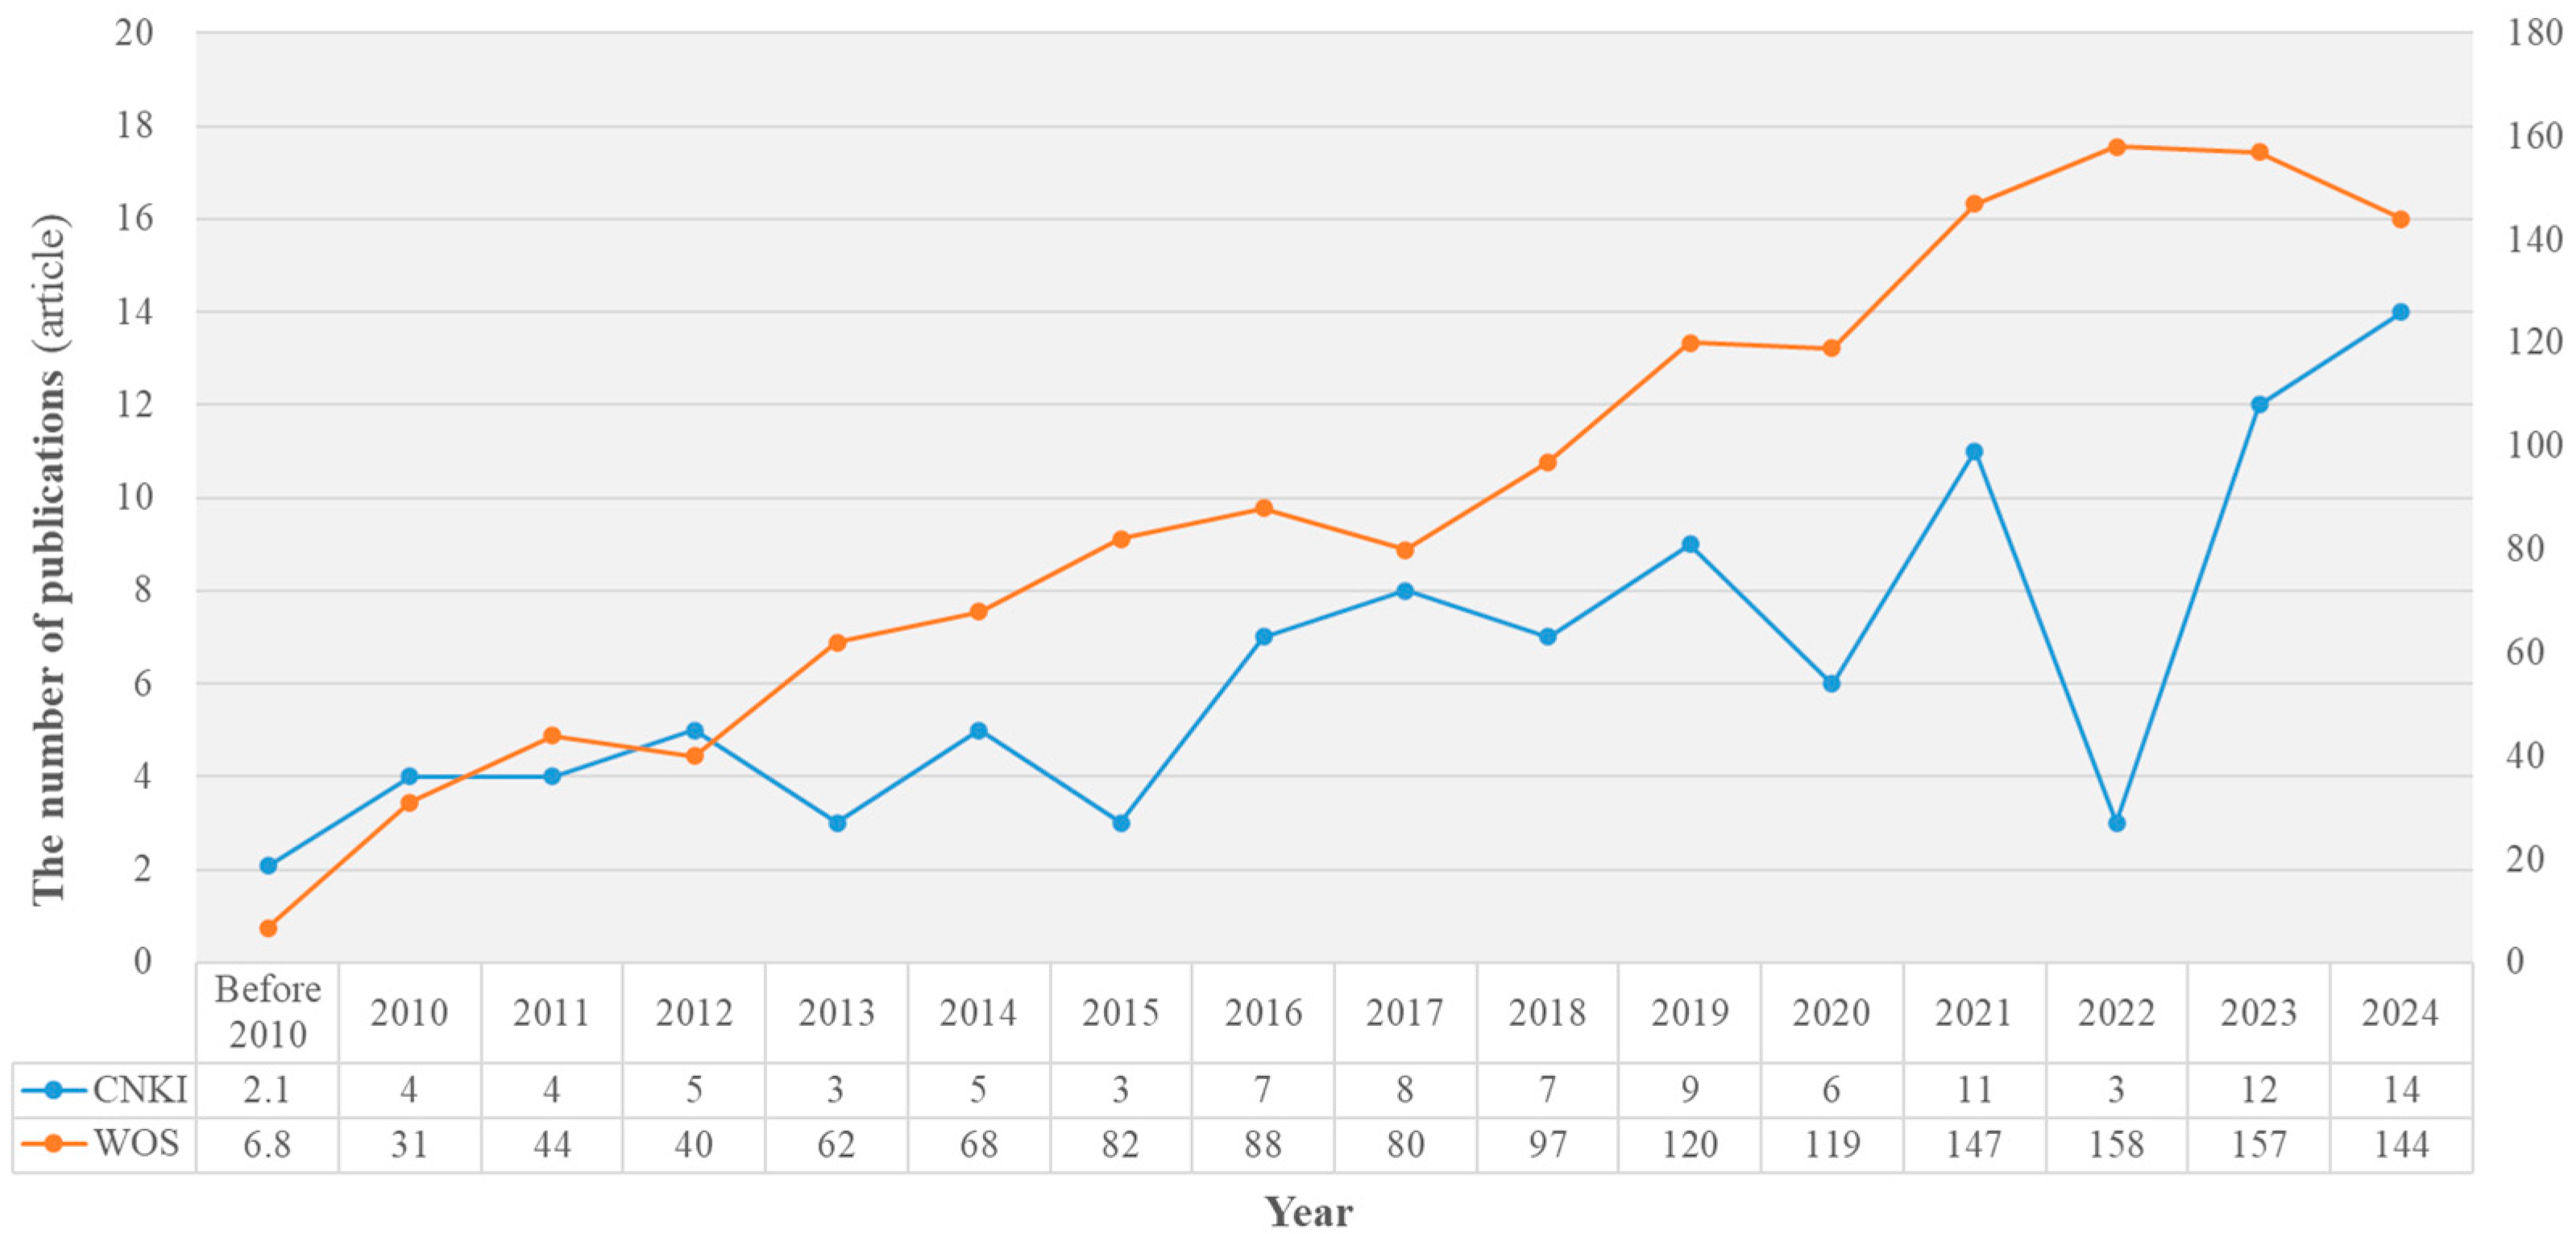
5.1. Time Analysis

The earliest published years of urban transportation data in the CNKI and WOS databases are 1998 and 1979, respectively. In Figure 4, it is evident that while research in the field of urban transportation data commenced prior to 2010, the number of published papers was limited, and growth was slow during that period. Since 2010, however, there has been a rapid increase in the number of publications in this field, particularly within the WOS database, indicating significant progress in research over the past decade. Concurrently, the volume of published papers in both the CNKI and WOS databases has been on the rise. Although there are discrepancies in quantity, this trend demonstrates that both domestic and international researchers are increasingly focusing on urban transportation data, contributing to the gradual formation of an active research community.

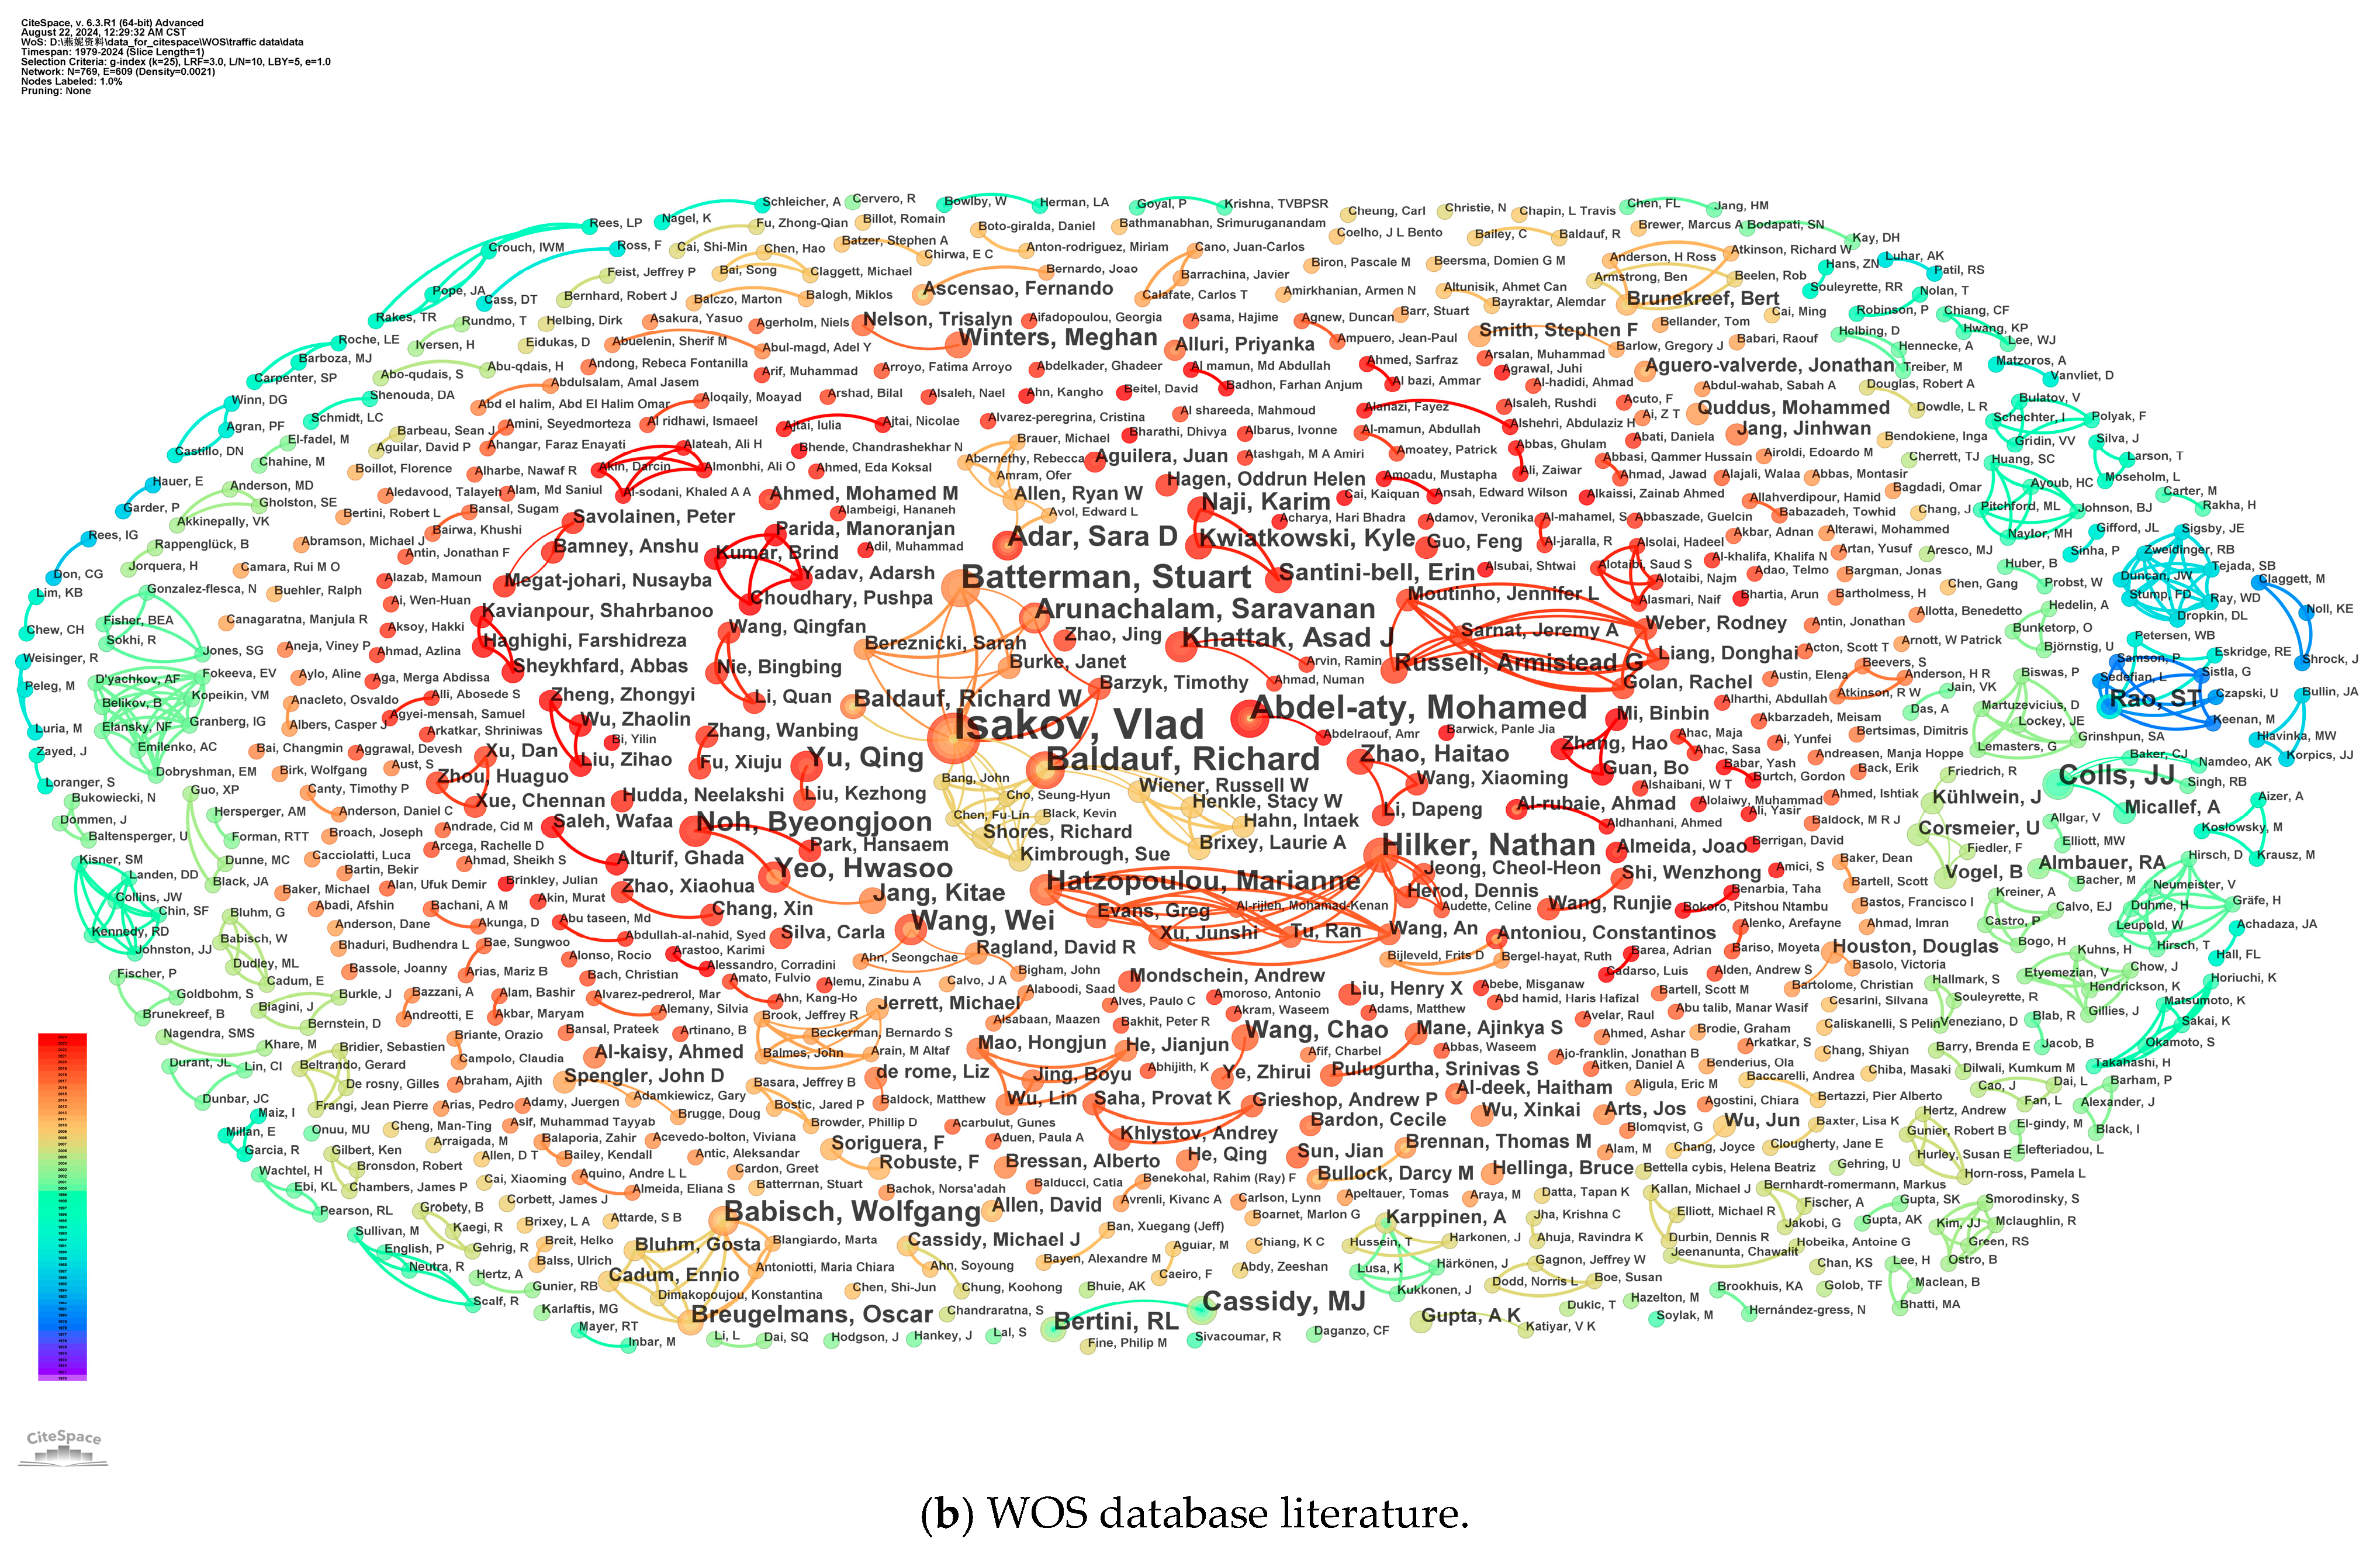
5.2. Author Analysis

Using “co-author” as the node type, select the time span according to the publication time of the literature and then run CiteSpace. The running results show that based on the urban transportation data-related literature samples in the CNKI database, a research author co-occurrence knowledge graph with a density of 0.0081, 331 nodes, and 441 connections was obtained (Figure A1a). It can be seen that there are many interconnections between the various author nodes, which indicates that there is a certain degree of cooperation and communication among authors in the field of urban transportation data research. Among them, the teams of Jinlong Li, Hongmei Zhang, and Aijun Feng have published more papers in recent years, and the multiple colors of the node circles of authors such as Guiyan Jiang and Shifeng Niu indicate that they have made continuous research contributions in this field. Figure A1b shows a research author co-occurrence knowledge graph with a density of 0.0021, 769 nodes, and 609 connections based on a sample of the literature related to urban transportation data in the WOS database. Less density and fewer connections indicate that authors do more independent research and less cross-team research. There are more warm color nodes, indicating that research in this field has been more active in recent years. Additionally, it can be noted that Vlad Isakov, Mohamed Abdel-aty, Nathan Hilker, Sara D Adar, and others have made continuous research contributions to this field.
The 119 CNKI literature samples selected for urban transportation data research encompass a total of 331 authors. Among these, two scholars have published more than two articles, while thirteen scholars have published more than one article. The remaining 316 scholars have each published only one article. In the WOS database, there are 1575 relevant research publications, involving a total of 769 authors. Notably, four scholars have published more than five articles. Additionally, there are one, 11, 12, and 115 scholars who have published five, four, three, and two articles, respectively. The remaining 626 scholars have each published only one article. Table 1 illustrates that while domestic research has established a foundational presence, the number of highly productive scholars remains limited, with only a few individuals achieving outstanding publication records. In contrast, the WOS database not only encompasses a substantial volume of literature but also includes numerous highly productive scholars whose publication output significantly exceeds that of their domestic counterparts. Notably, Vlad Isakov has published a total of 11 articles since 2008. This trend demonstrates the considerable attention and in-depth research by the international academic community in this field.

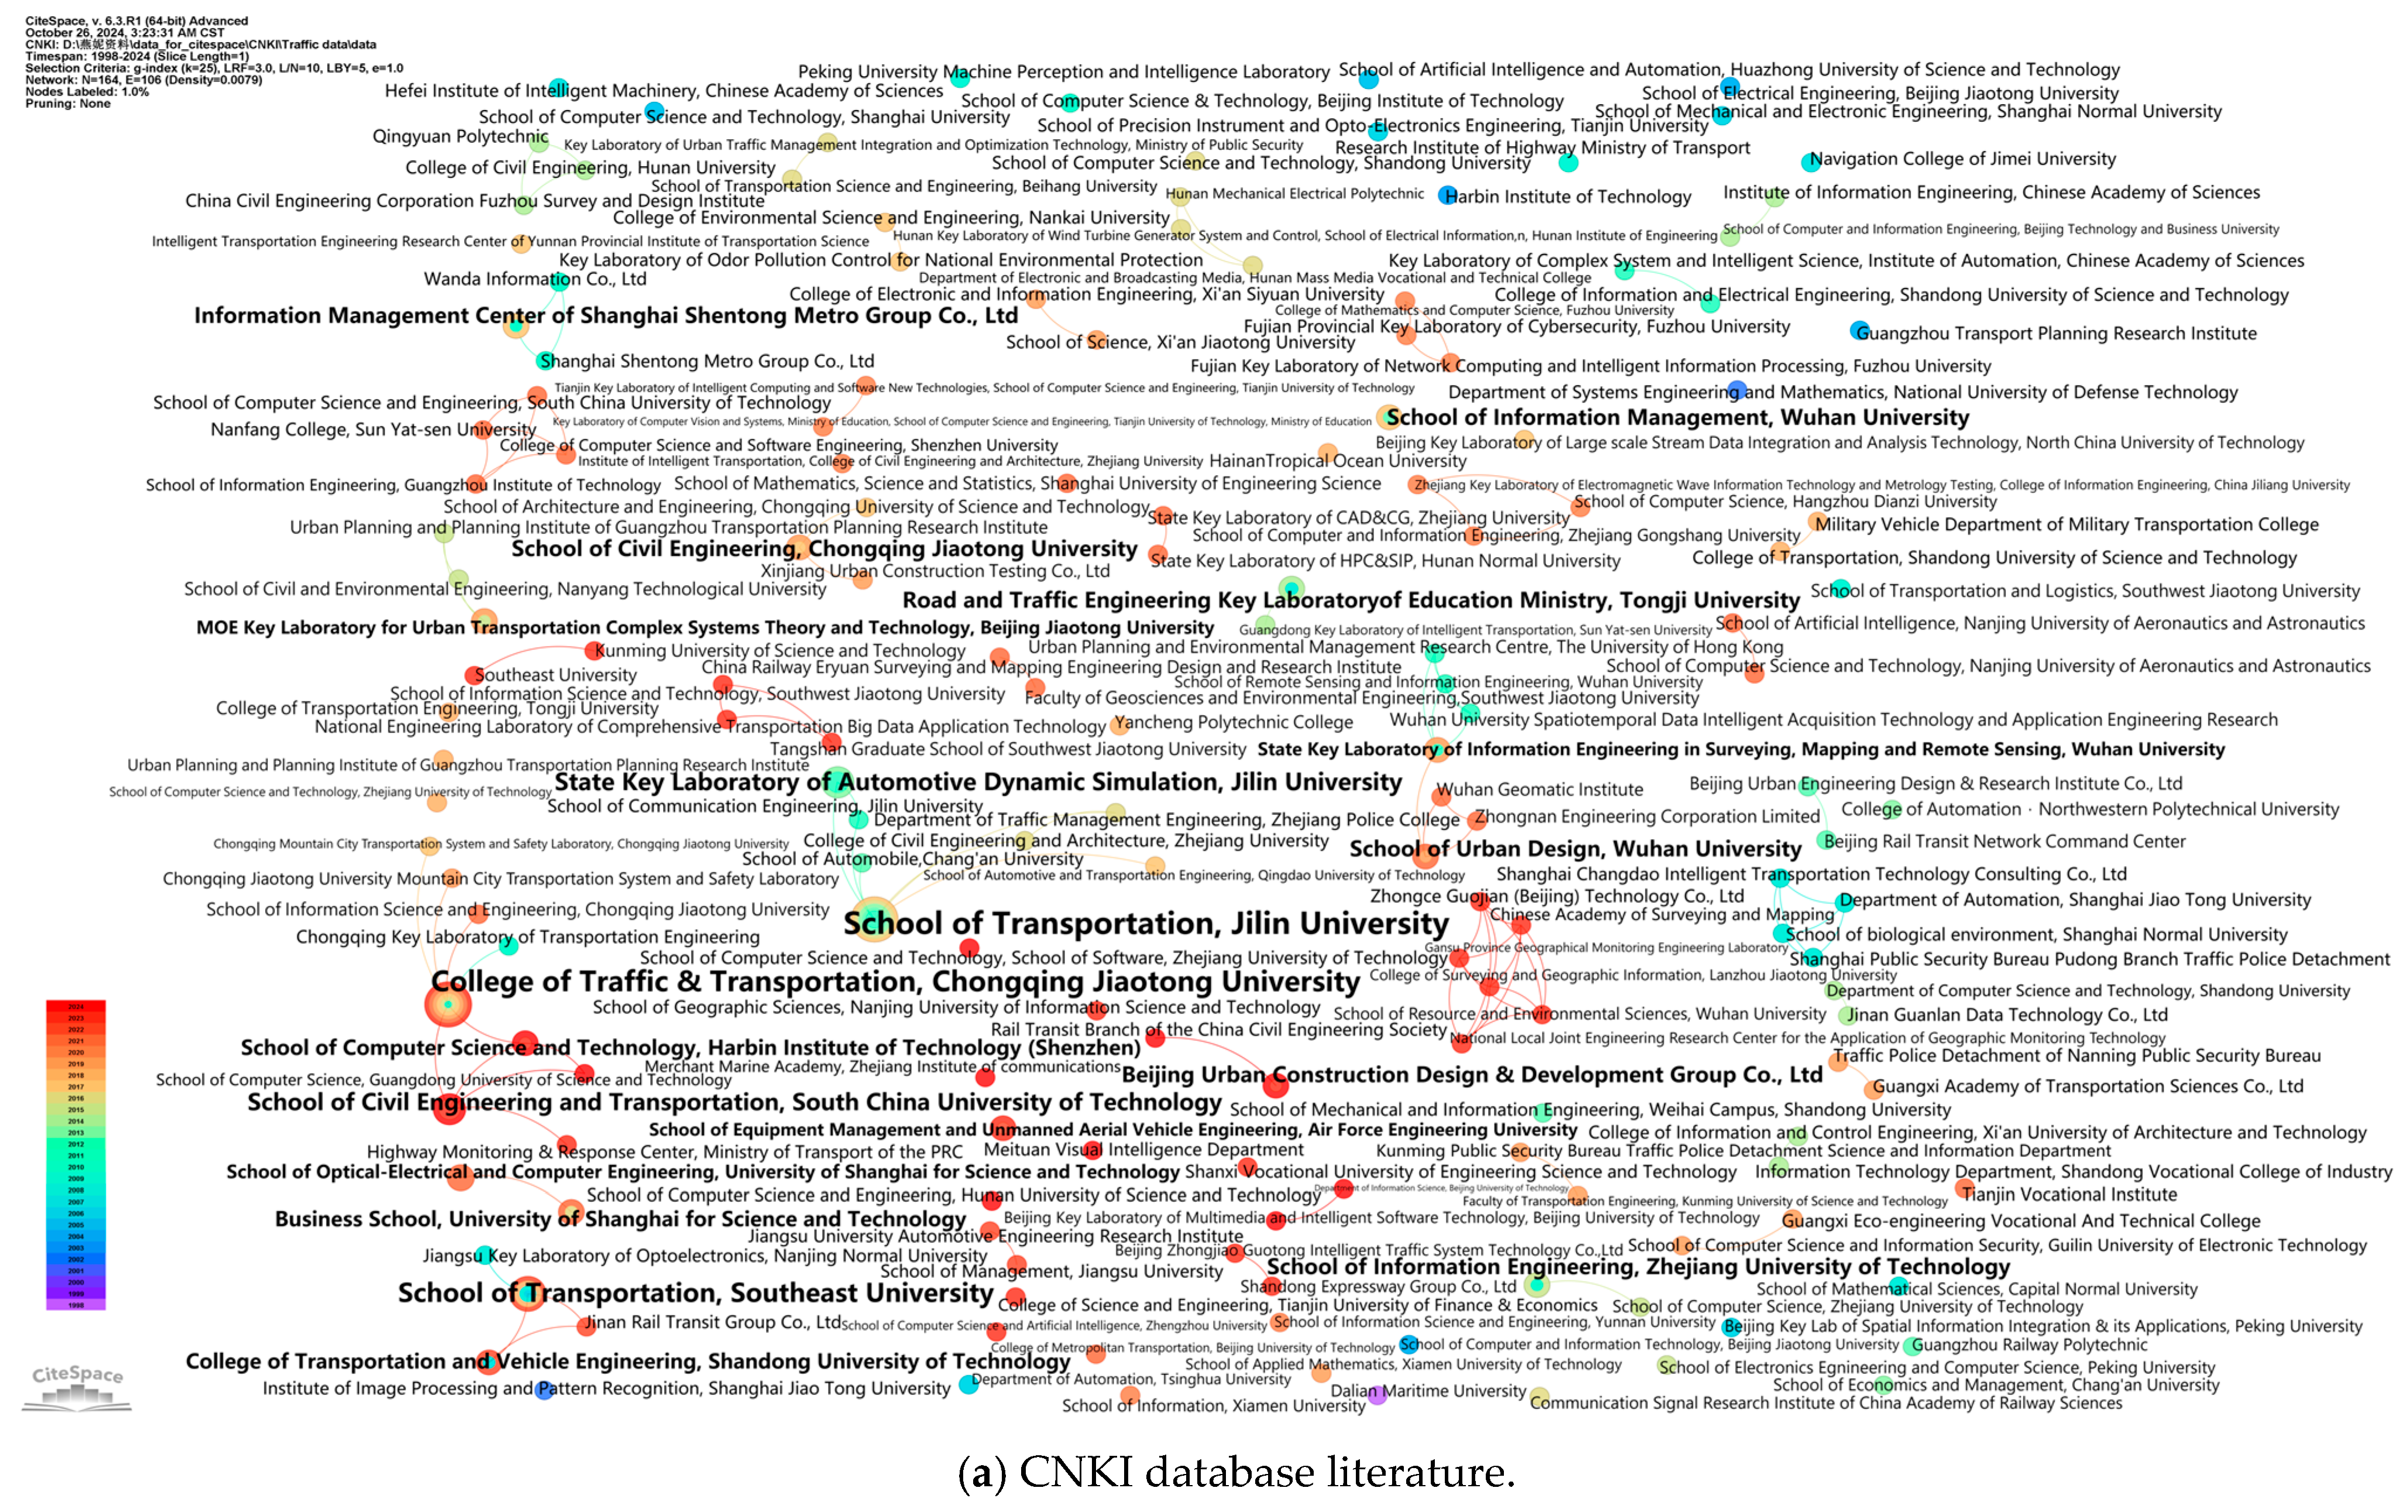
5.3. Institution Analysis

Set the node type to “institution” and obtain the co-occurrence knowledge graph of urban transportation data research institutions in the CNKI database (Figure A2a). The density is 0.0079 and the number of nodes and connecting lines are 164 and 106, respectively. There are few lines, which shows that there is relatively little cooperation between domestic institutions in this field, and most institutions tend to conduct independent research, including Tsinghua University, Nankai University, the Ministry of Communications, and other institutions. The multiple colors of the node rings of institutions such as Chongqing Jiaotong University, Southeast University, and Jilin University indicate that these institutions have continued to explore the field of data products. In the WOS database, the density of the co-occurrence knowledge map of urban transportation data research institutions (Figure A2b) is 0.0069, and the number of nodes and connecting lines are 488 and 819, respectively. Collaborative research with more interconnections is relatively frequent, and more obvious clusters are formed in cross-institutional research. This reflects the strong atmosphere of international collaborative research in this field, and the active knowledge sharing and collaborative innovation among institutions. There are more connections between warm-colored nodes, indicating that the research interest in this field has continued to increase in recent years, and new collaborations have continued to emerge.
The urban transportation data research CNKI literature samples involve a total of 164 research institutions. The College of Transportation of Jilin University, the College of Transportation of Chongqing Jiaotong University, and the College of Transportation of Southeast University have published more articles, with seven, six, and four, respectively, followed by the State Key Laboratory of Automobile Dynamic Simulation of Jilin University and the School of Civil Engineering and Transportation of South China University of Technology with three articles. The relevant research literature in the WOS database involves a total of 488 research institutions. Among the institutions, the University of California System has published the highest number of articles, totaling 73 since 1991. This is followed by the State University System of Florida, which has published 47 articles, and Tongji University, which has published 30 articles. Southeast University (China), the Chinese Academy of Sciences, and the United States Environmental Protection Agency each have published 27 articles, while the University of California, Berkeley has published 26 articles. Table 2 illustrates that there are active research institutions engaged in urban transportation data research both domestically and internationally. These institutions have established a multidisciplinary research framework, primarily driven by universities and research organizations, encompassing fields such as transportation engineering, civil engineering, and environmental science.

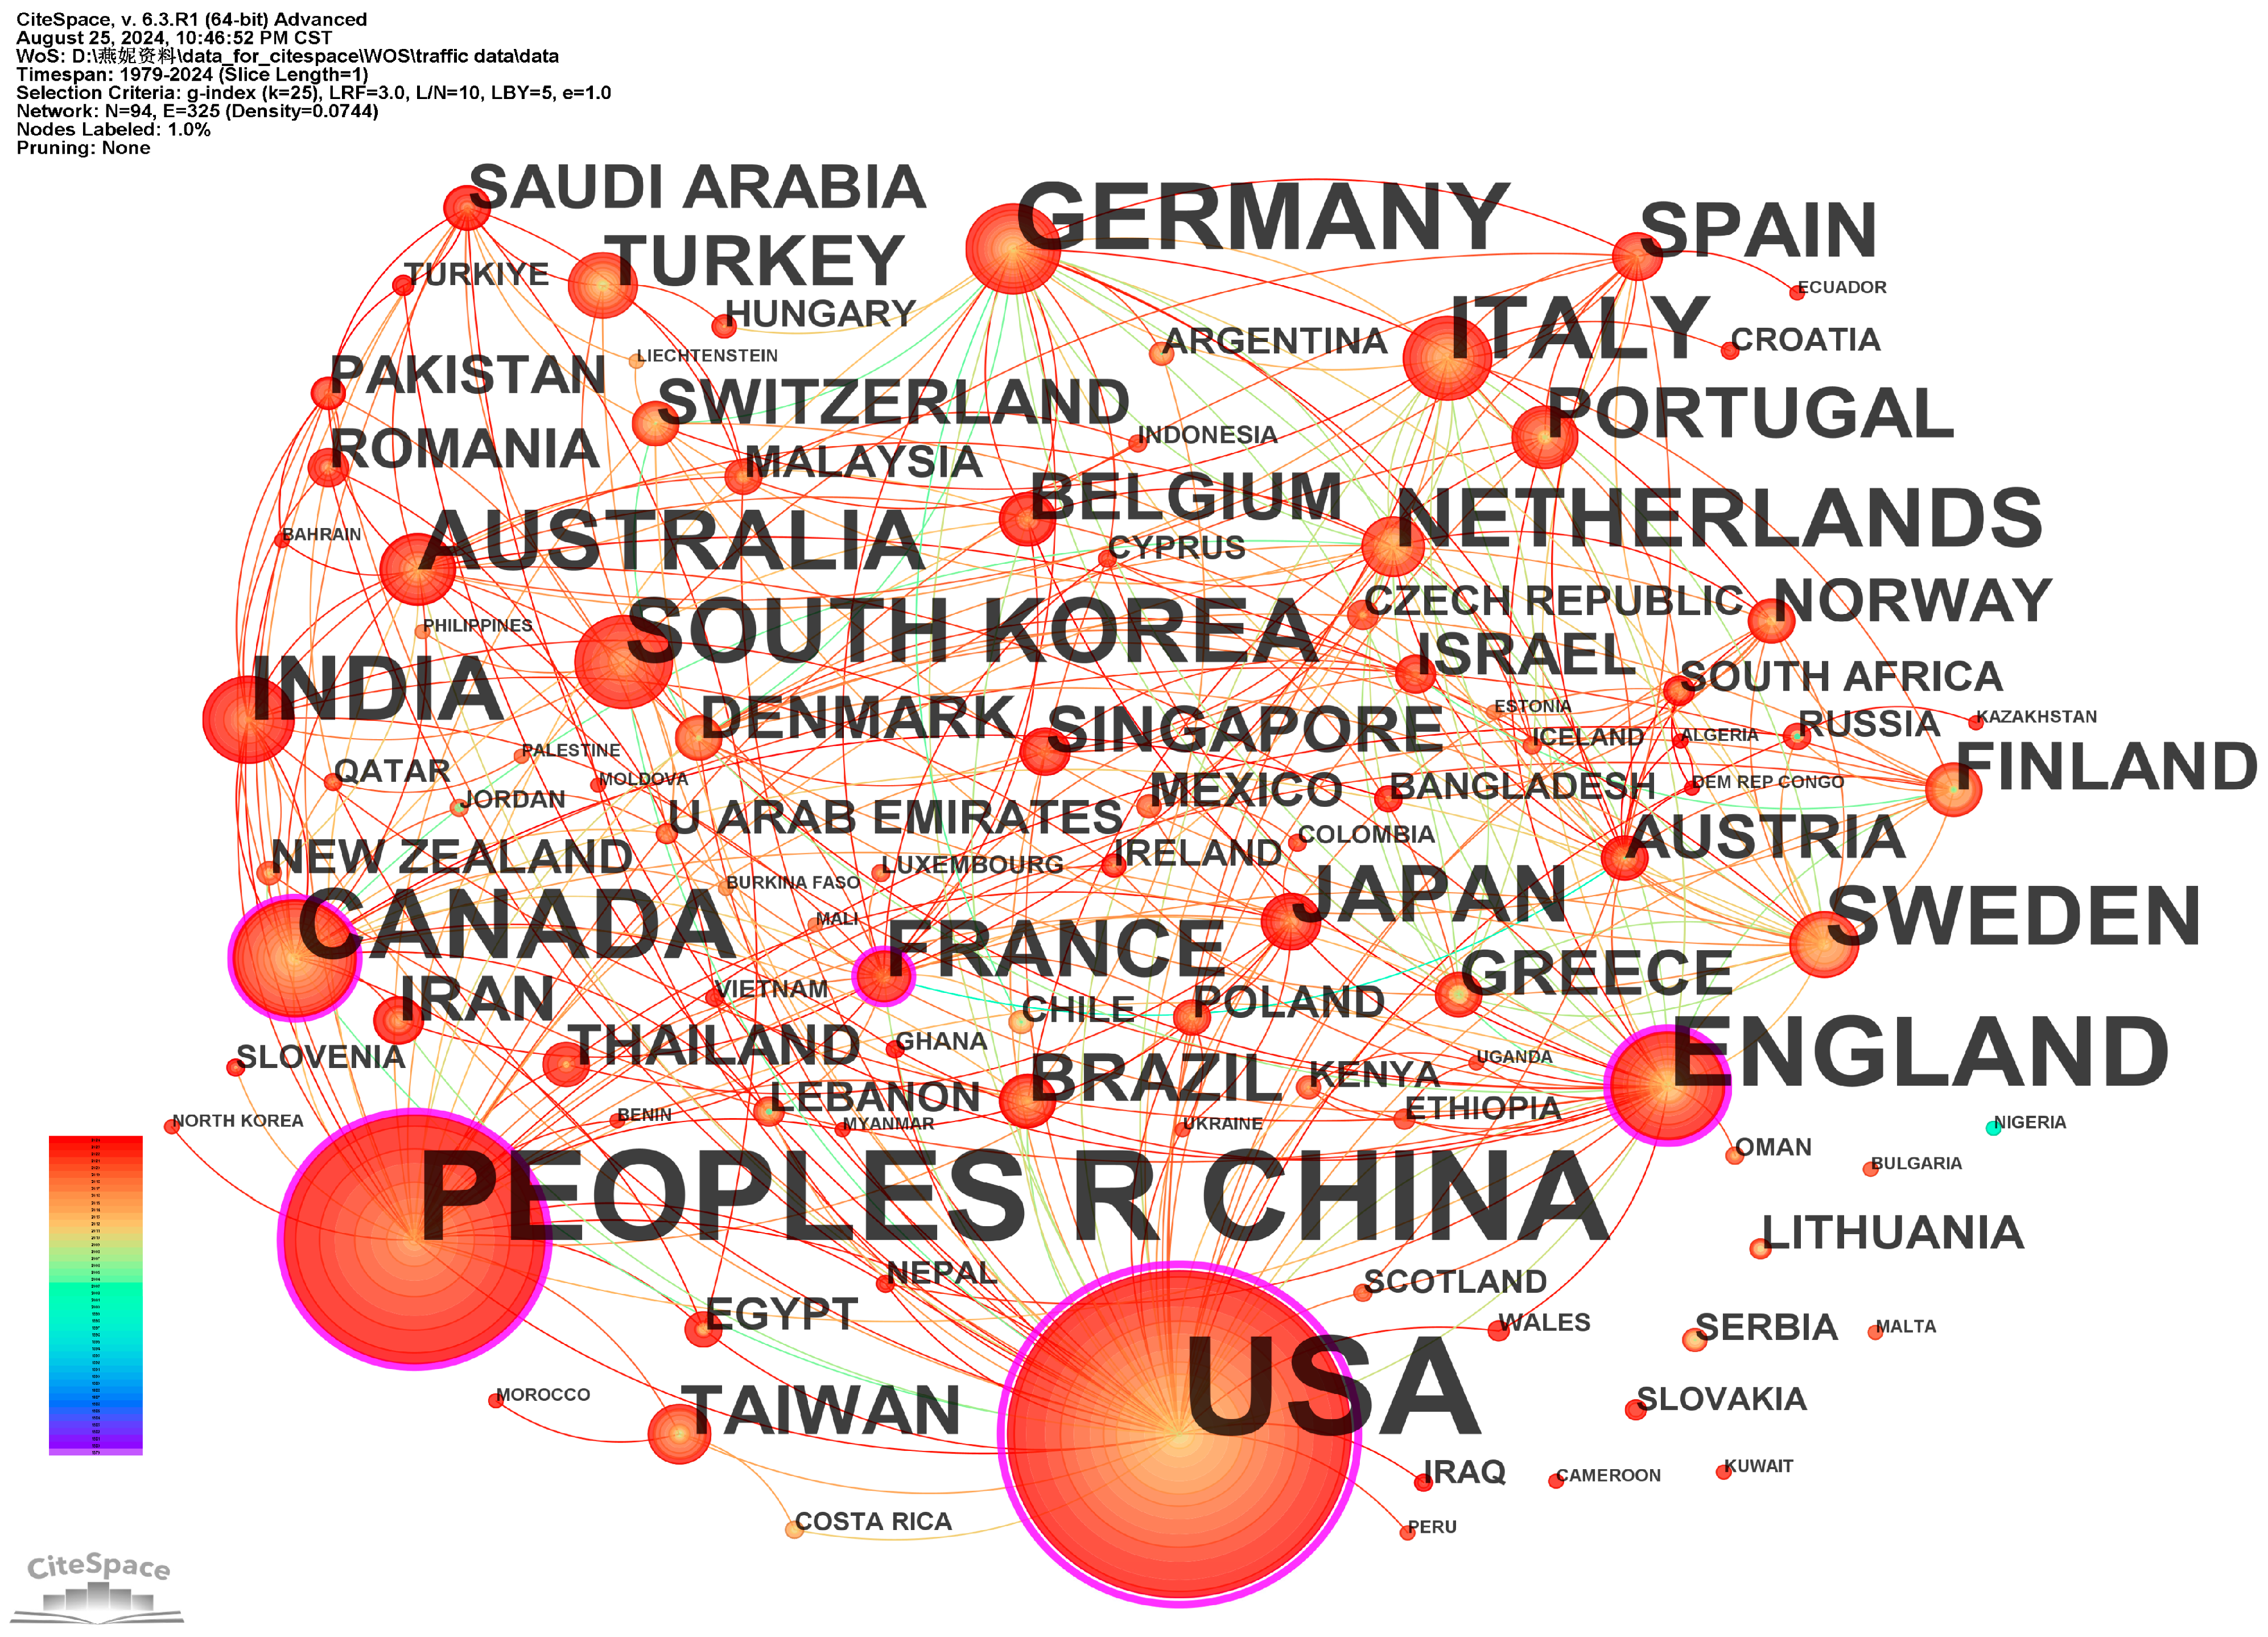
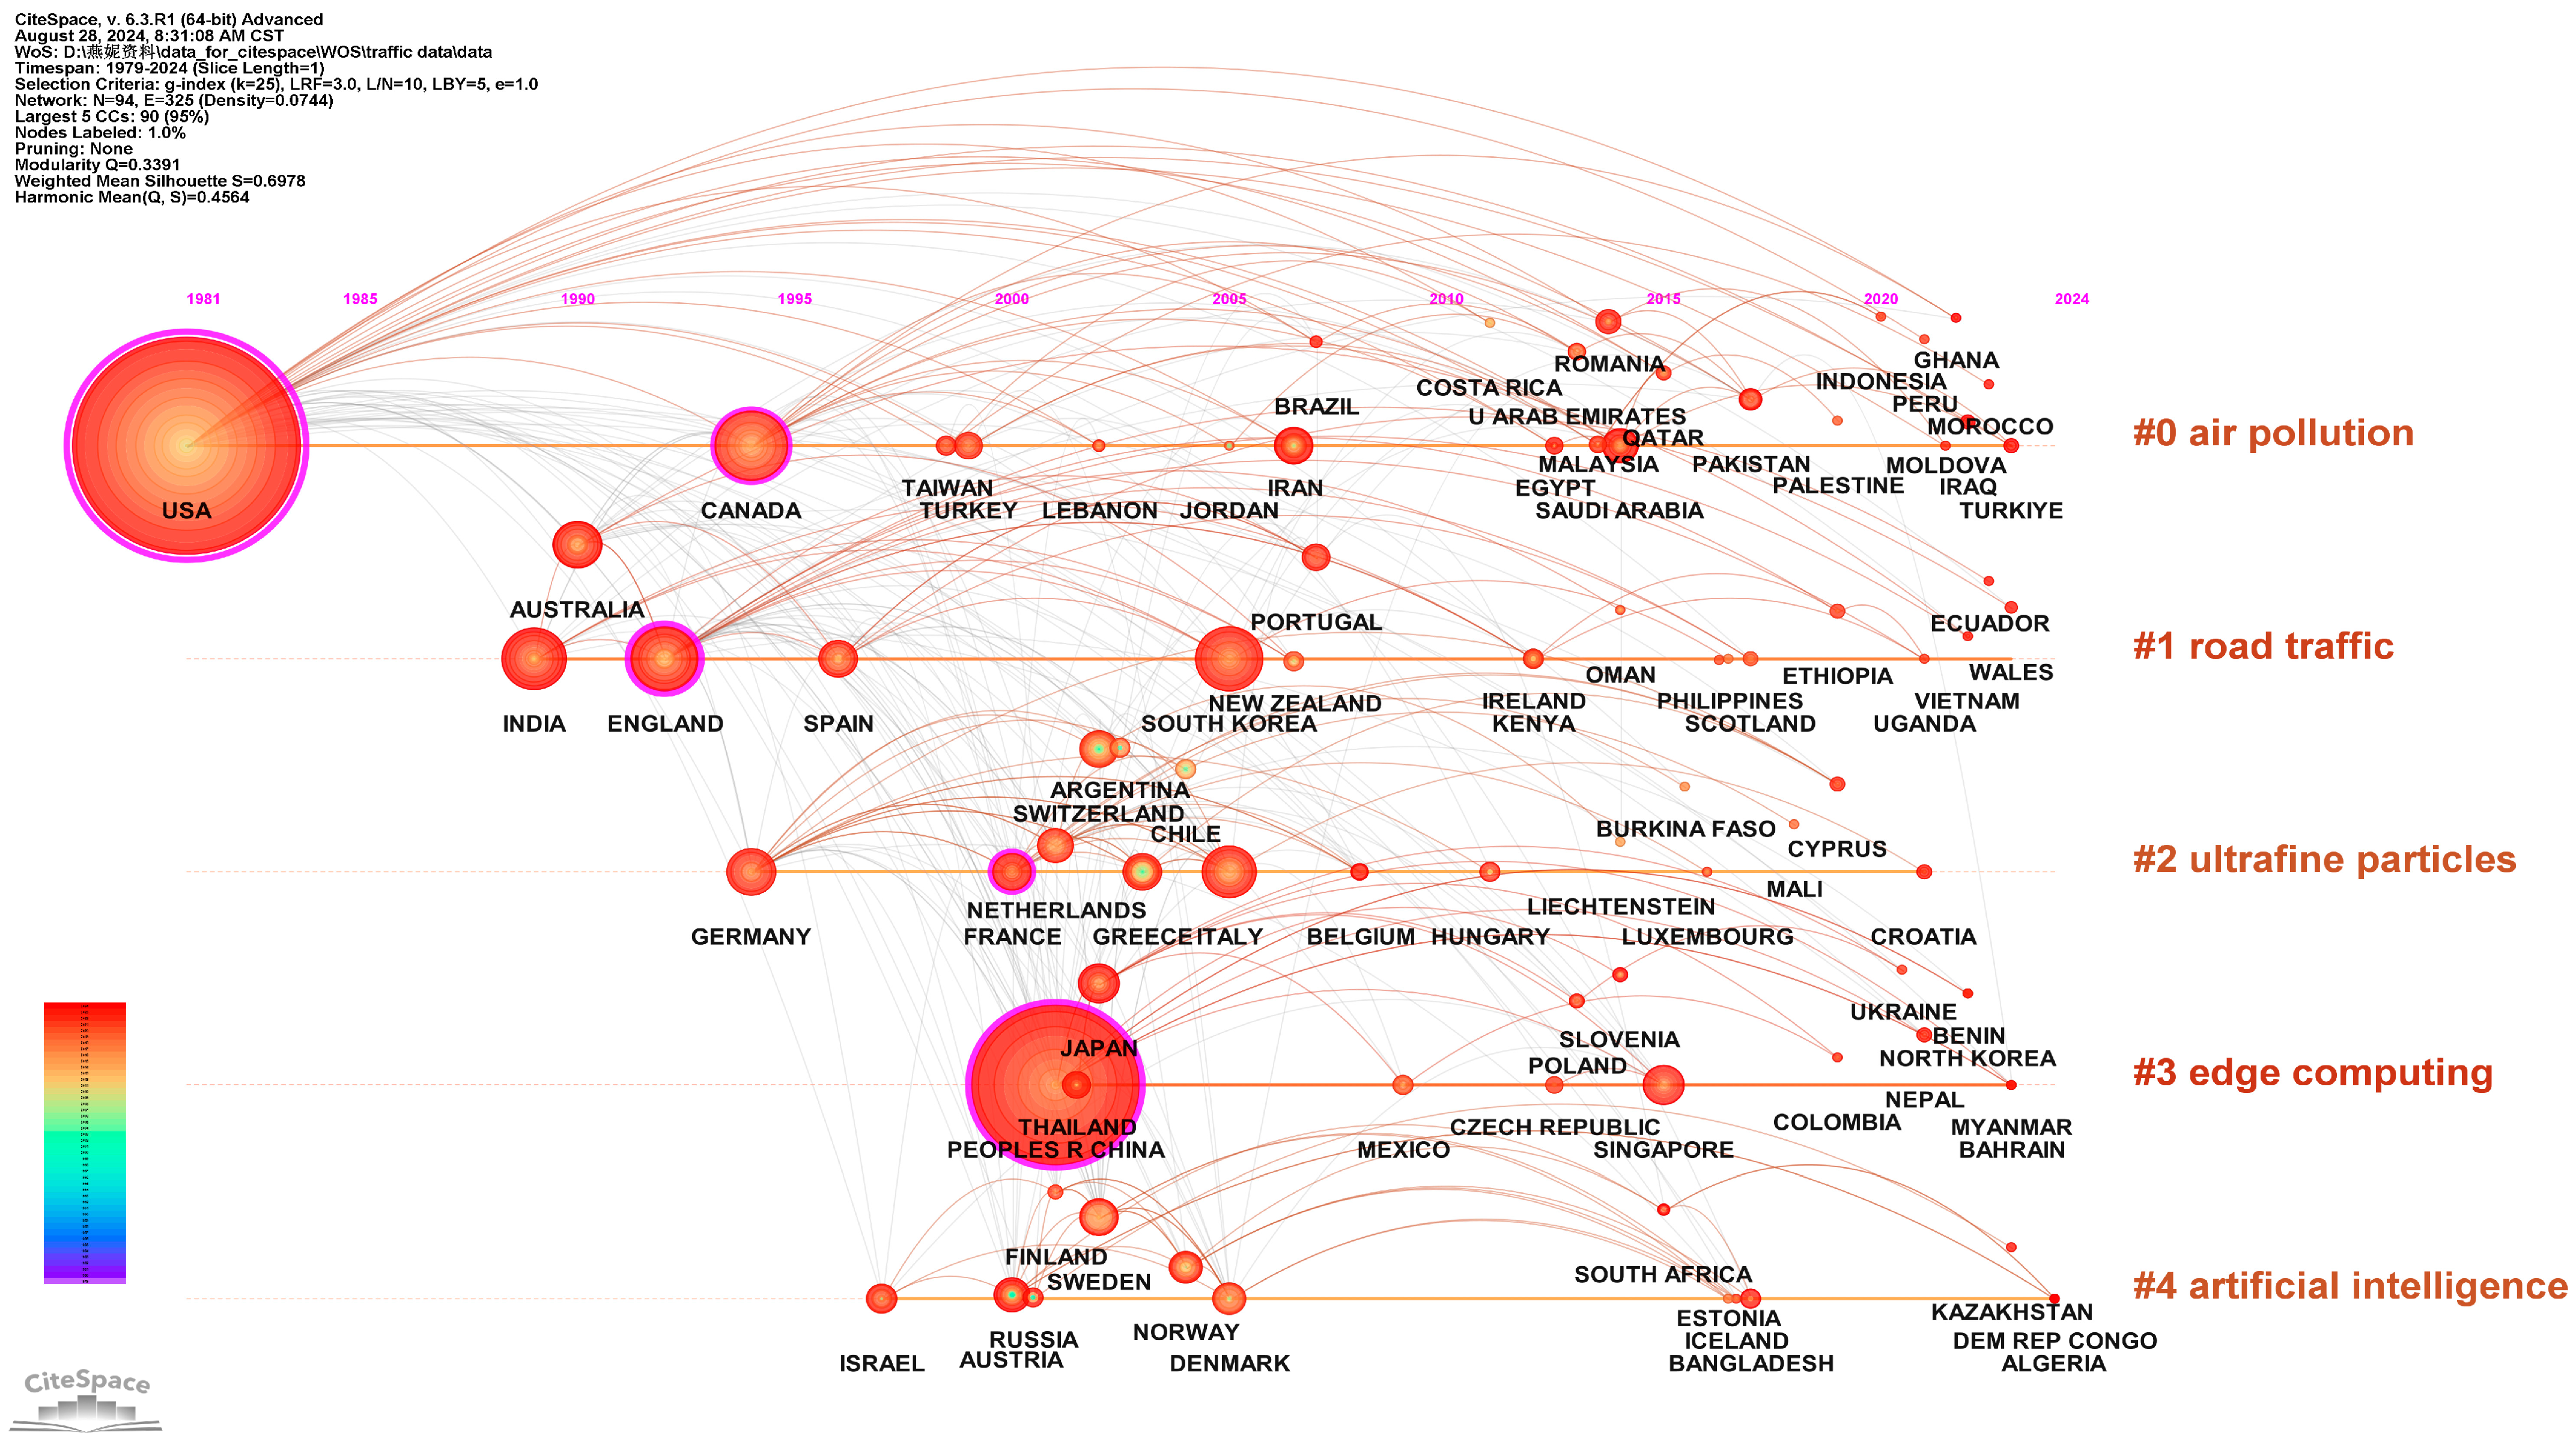
5.4. Country Analysis

It can be seen from Figure A3 that the co-occurrence knowledge graph density of countries (including regions) in WOS urban transportation data research is 0.0744, and the number of nodes and connecting lines is 94 and 325, respectively. It means that there are 94 countries (including regions) in this research direction, which reflects the global emphasis on and cooperation trends in urban transportation data research and the universality and in-depth nature of transnational joint research. The multiple colors of the node rings indicate that these countries have continued to explore the field of data products. The larger the node, the more literature the country has published. Countries such as the United States, the People’s Republic of China, Canada, and England are leading in the field of urban transportation data.
According to the statistical data presented in Table 3, the United States has published articles in the field of urban transportation data in the Web of Science (WOS) database since 1981. With a total of 651 articles, the U.S. not only has the earliest publications but also the highest volume, significantly surpassing the output of other countries. This further reinforces the United States’ leading position in global urban transportation data research. The People’s Republic of China followed, with 336 articles published, reflecting China’s rapid rise and significant contribution in this field. In addition, Canada, England, Germany, South Korea, India, and Italy all published more than 50 articles, indicating that these countries also play an important role in urban transportation data research and jointly promote global cooperation and development in this field.
Based on the literature data from the WOS database, it conducts a keyword clustering analysis, using countries as nodes with the assistance of CiteSpace, subsequently obtaining Table 4 and Figure A4. According to Table 4, it can be inferred that the prominent topics identified within the same keyword clusters are relevant to related research fields. The average year for cluster 0 is 2016, which reflects the application of urban transportation data in environmental protection and intelligent transportation systems. Cluster 1, with an average year of 2010, highlights the use of urban transportation data in environmental science and transportation planning. The average year for cluster 2 is 2015, demonstrating the role of urban transportation data in enhancing the urban environment and improving traffic efficiency. Cluster 3 has an average year of 2018, indicating that urban transportation data technology is progressing towards more real-time applications and greater efficiency. Finally, the average year for cluster 4 is 2017, showcasing the comprehensive application of urban transportation data in intelligent traffic management and environmental monitoring.
By selecting the “layout | Timezone View” option in the CiteSpace software, a country time zone map clustered by keywords is generated in Figure A4, which is used for the visual research in Table 4. Different countries under the same keyword cluster will be presented on the timeline according to the year they first appeared. The connection indicates that two countries appear in the same article or multiple articles. The greater the frequency of a country’s appearance, the larger the circle. Cluster 0 is dominated by developed countries such as the United States and Canada, involving many countries and regions, indicating that these countries are leading in the research and application of urban transportation data and intelligent transportation systems. Cluster 1 features India and countries such as Australia, highlighting the focus these regions place on traffic emissions and geographical data analysis. Cluster 2 is characterized by a mix of European countries and some developing nations, likely reflecting a heightened concern for noise and air quality issues arising from urbanization in these areas. Cluster 3 is dominated by Asian countries such as China and Thailand, indicating that these countries are more active in research and application of edge computing and real-time systems. Cluster 4 is dominated by European countries such as Israel and Austria, involving multiple countries, reflecting global research and application trends in intelligent transportation systems and noise monitoring technologies.

5.5. Research Hotspots

The keyword clustering knowledge graph outputs information such as frequency, centrality, and earliest appearance year of different keywords, as shown in Table 5. Transportation data have the highest frequency and centrality as a central word in the CNKI database, which is 16 times and 0.69, respectively, indicating that transportation data are the core of the urban transportation data research field and are important for urban traffic planning and management. Next is intelligent transportation, with a frequency of 13 times, indicating that the development and application of intelligent transportation systems is an important direction in current urban transportation data research, aiming to improve traffic efficiency and safety through technical means. Traffic engineering, data fusion, intelligent transportation systems, and traffic flow prediction followed, with a frequency of 6–8 times, showing that these fields are closely related to urban transportation data research and jointly promote the intelligent development of urban transportation systems. The frequency and centrality of air pollution in the WOS database are the largest, up to 143 times and 0.21, indicating that air pollution is an important issue in urban transportation data research and is closely related to traffic emissions, environmental quality, etc. Models followed closely, with a frequency of 121 times, indicating that model construction plays an important role in urban transportation data research, and traffic phenomena and problems can be deeply understood through model analysis. This is followed by exposure, impact, particulate matter, emissions, ultrafine particles, risk, safety, and models, with frequencies between 50–80 times, demonstrating that these keywords represent multiple important aspects in urban transportation data research, such as exposure level, impact assessment, particulate matter concentration, and emission control. Collectively, these elements constitute a comprehensive framework for investigating urban transportation data.
Further keyword clustering analysis was conducted through the generated keyword clustering knowledge graph, and labels with obvious clusters were selected. These clusters reflect the current status of hot issues in related research fields both domestically and internationally. Q > 0.3 indicates that the clustering structure is obvious, S > 0.5 indicates that the clustering is reasonable, and S > 0.7 indicates that the clustering is convincing. The clustering of keywords in the knowledge graph of urban transportation data research in Figure A5 meets the requirements. Considering the salience and visibility of the network, it shows the keyword clustering knowledge graph generated by setting “Show the Largest K Clusters” to 13 and 12 in the CNKI database and WOS database. Figure A5a illustrates that the CNKI database, in the realm of urban transportation data research, encompasses 13 clustering labels: intersections, intelligent transportation, transportation data, data preprocessing, data fusion, geographic information systems, intelligent transportation systems, deep learning, fault data, visual analysis, datasets, social welfare, and traffic flow. It reflects the diversification and depth of the field in China, covering data collection, processing, analysis, and application, focusing on cutting-edge technologies such as intelligent transportation and deep learning, and paying attention to the practical application of transportation data in improving traffic management and enhancing social welfare. Furthermore, it demonstrates the comprehensiveness and foresight of urban transportation data research. Figure A5b shows that WOS database urban transportation data research includes the following 12 cluster labels: air pollution, autonomous vehicles, deep learning, prediction, transit-oriented development, air pollution, model, pollutant dispersion, traffic intensity, ambient VOC, traffic modeling, and urban air pollution. These labels reflect the multidisciplinary nature of urban transportation data research, which requires experts from environmental science, computer science, urban planning, traffic engineering, and other fields to work together to deal with increasingly complex urban traffic challenges. Domestic and international urban transportation data research both focus on cutting-edge technologies such as intelligent transportation and deep learning. However, international research focuses more on multi-disciplinary intersections, involving environmental science, urban planning, and other fields, while domestic research pays greater attention to the role of transportation data in improving traffic management and enhancing practical applications for social welfare.
Further select “Summary Table | Whitelists” in the “Cluster” menu bar to obtain specific keyword co-occurrence network clustering table information, which can determine hot topic words in related research fields in recent years. The average clustering silhouette value is greater than 0.5, and the clustering is reasonable. When it is greater than 0.7, it means that the clustering is efficient and convincing. The average year is the result of averaging the year when the hot words in each cluster first appeared. Therefore, the clustering shown in Table A7 is reasonable and valid. Based on Figure A5 and Table A7, a deeper analysis is conducted to examine the specific content of each cluster within the research domain of urban transportation data.

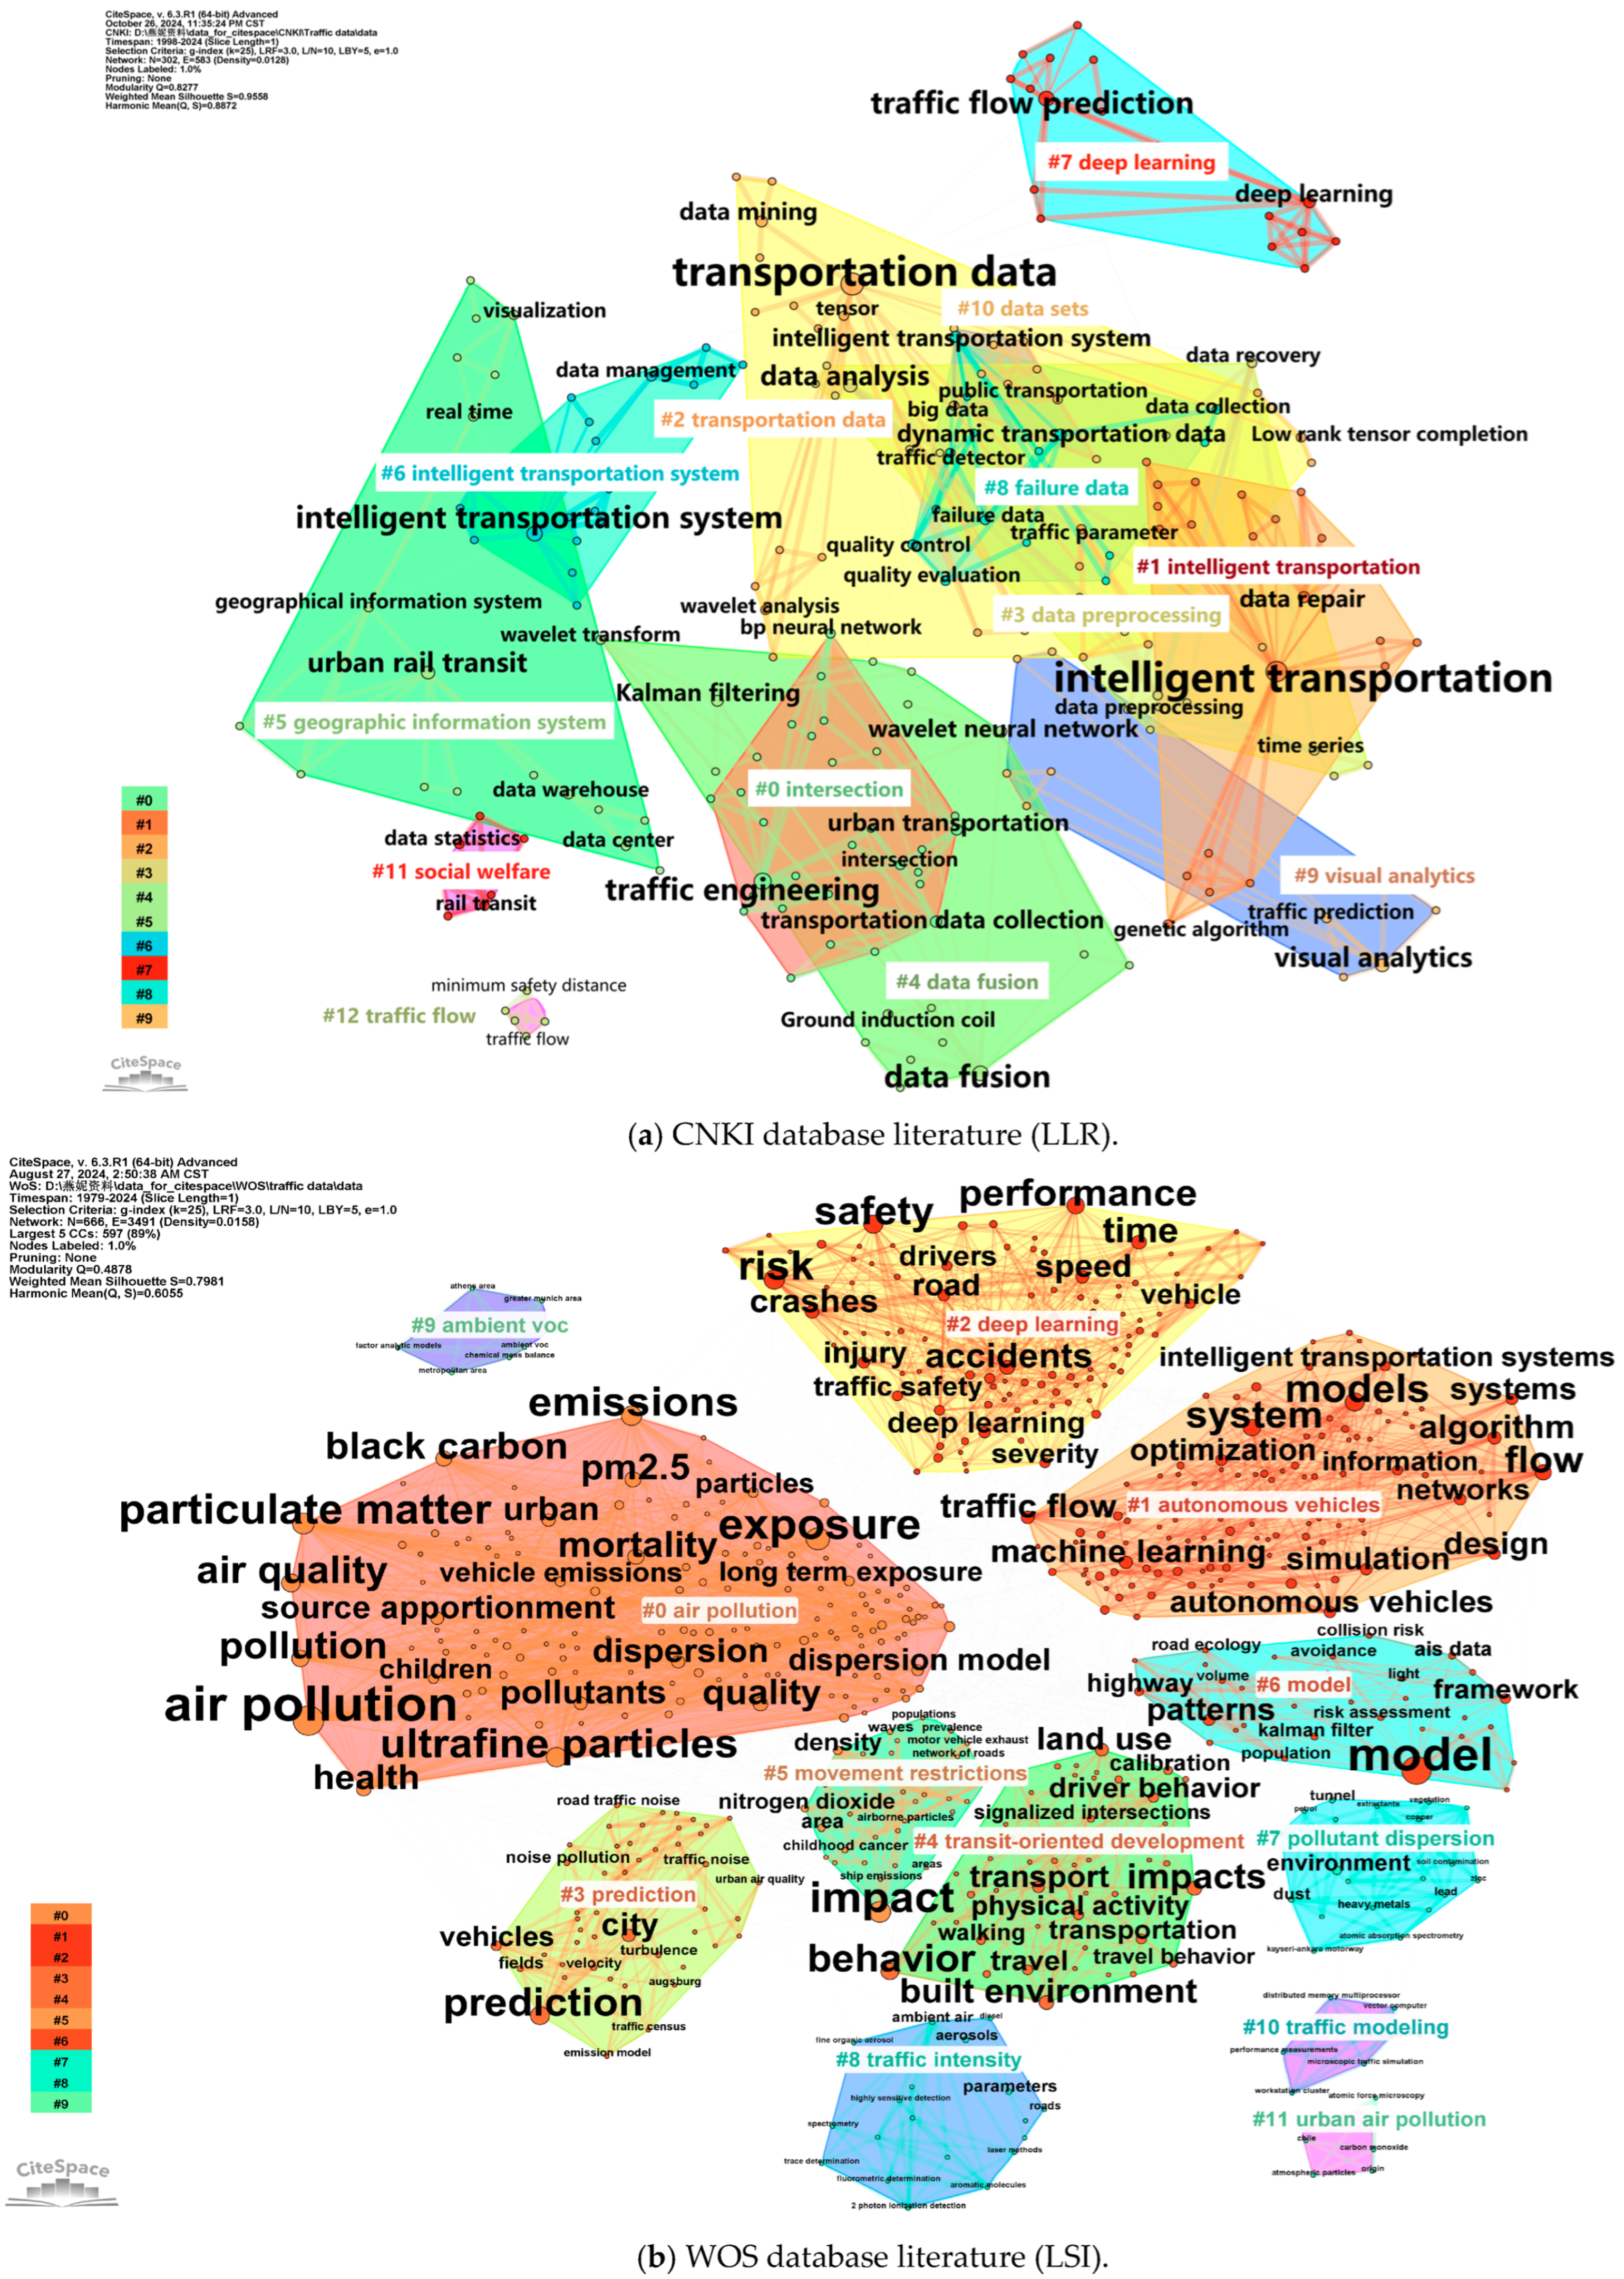
5.5.1. CNKI Database Keyword Clustering Analysis

Cluster 0, transportation data collection and engineering technology, with an average year of 2012: focuses on transportation data collection technology and its application in traffic engineering, such as intersection data collection, traffic engineering design, and optimization, reflecting the importance of transportation data infrastructure construction and technology application. Cluster 1, intelligent transportation and data security, with an average year of 2018: focuses on the development of intelligent transportation systems, especially data diagnosis, privacy protection, and other technologies, which reflects the importance of data security and privacy protection in the field of intelligent transportation. Cluster 2, transportation data analysis and fusion, with an average year of 2014: focuses on in-depth analysis and fusion methods of transportation data, such as support vector machines, data missing processing, etc., aiming to improve the accuracy and efficiency of data analysis. Cluster 3, data preprocessing and quality control, with an average year of 2012: discusses the data preprocessing steps, including spatiotemporal correlation analysis, multivariate quality control, etc., to ensure the accuracy and reliability of subsequent data analysis. Cluster 4, multi-source data fusion technology, with an average year of 2010: researches multi-source transportation data fusion technology, such as wavelet transform, evidence theory, etc., aiming to improve the accuracy and real-time performance of data fusion and provide support for traffic management and decision-making. Cluster 5, geographic information systems and data centers, with an average year of 2011: emphasizes the role of geographic information systems in transportation data management and the importance of data center construction for real-time data processing, thereby promoting the process of traffic informatization. Cluster 6, intelligent transportation systems and data repair, with an average year of 2008: focused early on the development of intelligent transportation systems and data repair technologies, such as the application of generative adversarial networks in transportation data repair, demonstrating the continuous progress of intelligent transportation technology. Cluster 7, the application of deep learning in traffic prediction, with an average year of 2022: represents the latest research trend, which is to use deep learning, graph neural networks, and other technologies for traffic flow prediction, showing the broad application prospects of artificial intelligence technology in the transportation field. Cluster 8, fault data identification and quality control, with an average year of 2006: focused early on the identification and quality control of traffic system fault data, ensuring the accuracy and reliability of transportation data through structural analysis and other methods. Cluster 9, visual analysis in urban traffic management application, with an average year of 2017: improves the efficiency and effectiveness of urban traffic management through visual analysis technology, such as traffic event analysis and traffic flow analysis, providing a powerful tool for urban traffic management. Cluster 10, data sets and open interfaces, with an average year of 2015: focuses on the construction of transportation data sets and the design of open interfaces, which promote the sharing and utilization of transportation data and facilitate the construction of a transportation data ecosystem. Cluster 11, social welfare and rail transit optimization, with an average year of 2011: studies the optimization issues of rail transit systems from the perspective of social welfare, such as operator profits, departure intervals, etc., reflecting the comprehensiveness and social nature of transportation research. Cluster 12, traffic flow characteristics and planning, with an average year of 2015: focuses on traffic flow characteristics and their application in traffic planning, such as congestion state prediction and minimum safety distance setting, providing a scientific basis for urban traffic planning. Cluster 13, spatiotemporal feature analysis and congestion pattern identification, with an average year of 2020: uses spatiotemporal feature analysis technology to identify traffic congestion patterns, providing new ideas and methods for alleviating urban traffic congestion problems. Cluster 14, ship transportation data management and evaluation, with an average year of 2024: indicates that future research will focus on the real-time transmission and evaluation system of ship transportation data, as well as reliability guarantees, to ensure the safety and efficiency of water transportation. Cluster 15, traffic control strategy and optimization, with an average year of 2016: researches traffic control strategies and optimization methods, such as multi-period control and timing analysis, aiming to improve the overall performance of the urban transportation system. Cluster 21, bridge engineering and transportation data analysis, with an average year of 2017: combines transportation data analysis with bridge engineering practice, such as research on multi-lane lateral reduction coefficients, reflecting the interdisciplinary research characteristics of the field of traffic engineering. These clusters highlight the central role of urban transportation data in driving traffic management optimization, improving transportation efficiency, and promoting interdisciplinary integration.

5.5.2. WOS Database Keyword Clustering Analysis

Cluster 0, urban traffic air pollution and health effects, with an average year of 2010: emphasizes the monitoring of urban traffic air pollution (such as PM2.5, black carbon, etc.) and its impact on public health. Special attention is given to street canyons and the exposure of roadside pedestrians, as well as the application of monitoring network design in health research. Cluster 1, intelligent transportation systems and autonomous driving, with an average year of 2015: explores autonomous vehicles, real-time systems, and related technologies (such as traffic forecasting and data science), highlighting their role in enhancing traffic management efficiency and safety. Cluster 2, the application of deep learning in intelligent transportation, with an average year of 2014: investigates how deep learning is applied in intelligent transportation systems, including autonomous driving and traffic flow prediction, and how these technologies can boost the safety and operational efficiency of urban transportation. Cluster 3, traffic flow prediction and emission assessment, with an average year of 2007: initially focused on traffic flow prediction, speed field analysis, and traffic emission assessment, providing a foundation for urban transportation planning and environmental protection policy formulation. Cluster 4, transit-oriented development and urban planning, with an average year of 2012: examines the influence of transit-oriented development on urban living, travel patterns, energy consumption, and the application of geographic information systems, analyzing driving behavior and travel patterns across different traffic modes. Cluster 5, air pollution and traffic restrictions, with an average year of 2005: investigates air pollution, traffic restriction measures, and their time series analysis in evaluating the environmental impact of ship emissions, port area pollution, and the COVID-19 pandemic. Cluster 6, traffic flow models and ecological protection, with an average year of 2011: analyzes traffic flow models and their application in ecological protection, road ecology, genetic protection, and habitat fragmentation research, exploring the impact of human activities on the natural environment. Cluster 7, pollutant diffusion and numerical simulation, with an average year of 1997: involves early research that used numerical simulation techniques (such as RANS and LES) to analyze the diffusion of urban traffic pollutants, focusing on urban ventilation, heavy metal pollution, and soil analysis. Cluster 8, traffic intensity monitoring technology, with an average year of 1999: covers research on early traffic intensity monitoring technology (such as video detectors, ring detectors, etc.) and its application in real-time traffic monitoring, urban atmospheric environment analysis, and traffic flow analysis. Cluster 9, volatile organic compound source analysis, with an average year of 2004: focuses on the source analysis of volatile organic compounds, using the receptor model and methods such as positive matrix factorization to identify the main sources of volatile organic compounds and provide a basis for air quality management. Cluster 10, traffic modeling and simulation performance, with an average year of 1994: involves early work focused on the performance evaluation of traffic modeling and microscopic traffic simulation, using technologies such as distributed memory multi-processors and vector computers to improve simulation efficiency and accuracy. Cluster 11, urban air pollution and microscopic analysis, with an average year of 2003: studies the microscopic characteristics of urban air pollution and atmospheric particulate matter, using atomic force microscopy and other technologies to analyze the form and structure of pollutants and provide technical support for pollution control. Cluster 12, dynamic weighing system technology, with an average year of 2000: explores the technological development of dynamic weighing systems, including sensor arrays, portable dynamic weighing systems, and weighing tests for traffic management and law enforcement. Cluster 13, impact of road salt on vegetation, with an average year of 2006: studies the impact of road salt on forest vegetation and the nitrogen cycle, evaluates the long-term effects of road maintenance measures on the ecological environment, and provides a reference for sustainable transportation development. Cluster 14, complex terrain air quality models, with an average year of 1998: focuses on the development and verification of complex terrain air quality models, simulating pollutant diffusion and transmission processes in specific environments such as tunnel entrances. Cluster 15, air pollutant emission inventory, with an average year of 2002: compiles emission inventories of various air pollutants (such as PM10, NO2, SO2, etc.) to provide data support for regional air quality management and policy formulation. Cluster 16, traffic flow forecasting methods, with an average year of 2006: involves early research on the application of various statistical and machine learning methods (such as ARIMA and neural networks) in annual traffic flow forecasting to improve forecasting accuracy and reliability, providing a basis for transportation planning and decision-making. These clusters demonstrate the basic and important role of urban transportation data in improving traffic management efficiency, optimizing urban planning, and protecting public health. In-depth related research can promote the development of urban transportation data applications.
It is noteworthy that, despite the frequent occurrence of keywords such as intelligent transportation, autonomous driving, and deep learning, which underscores the intense research activity in these domains, the clustering of keywords pertaining to the safety evaluation and regulatory framework establishment for autonomous driving technology is not prominently evident. Likewise, there is an absence of discernible clustering of keywords associated with the design of privacy protection mechanisms and the formulation of ethical standards for urban transportation data. This observation suggests that research endeavors in these particular areas require further augmentation.

5.6. Emerging Trends

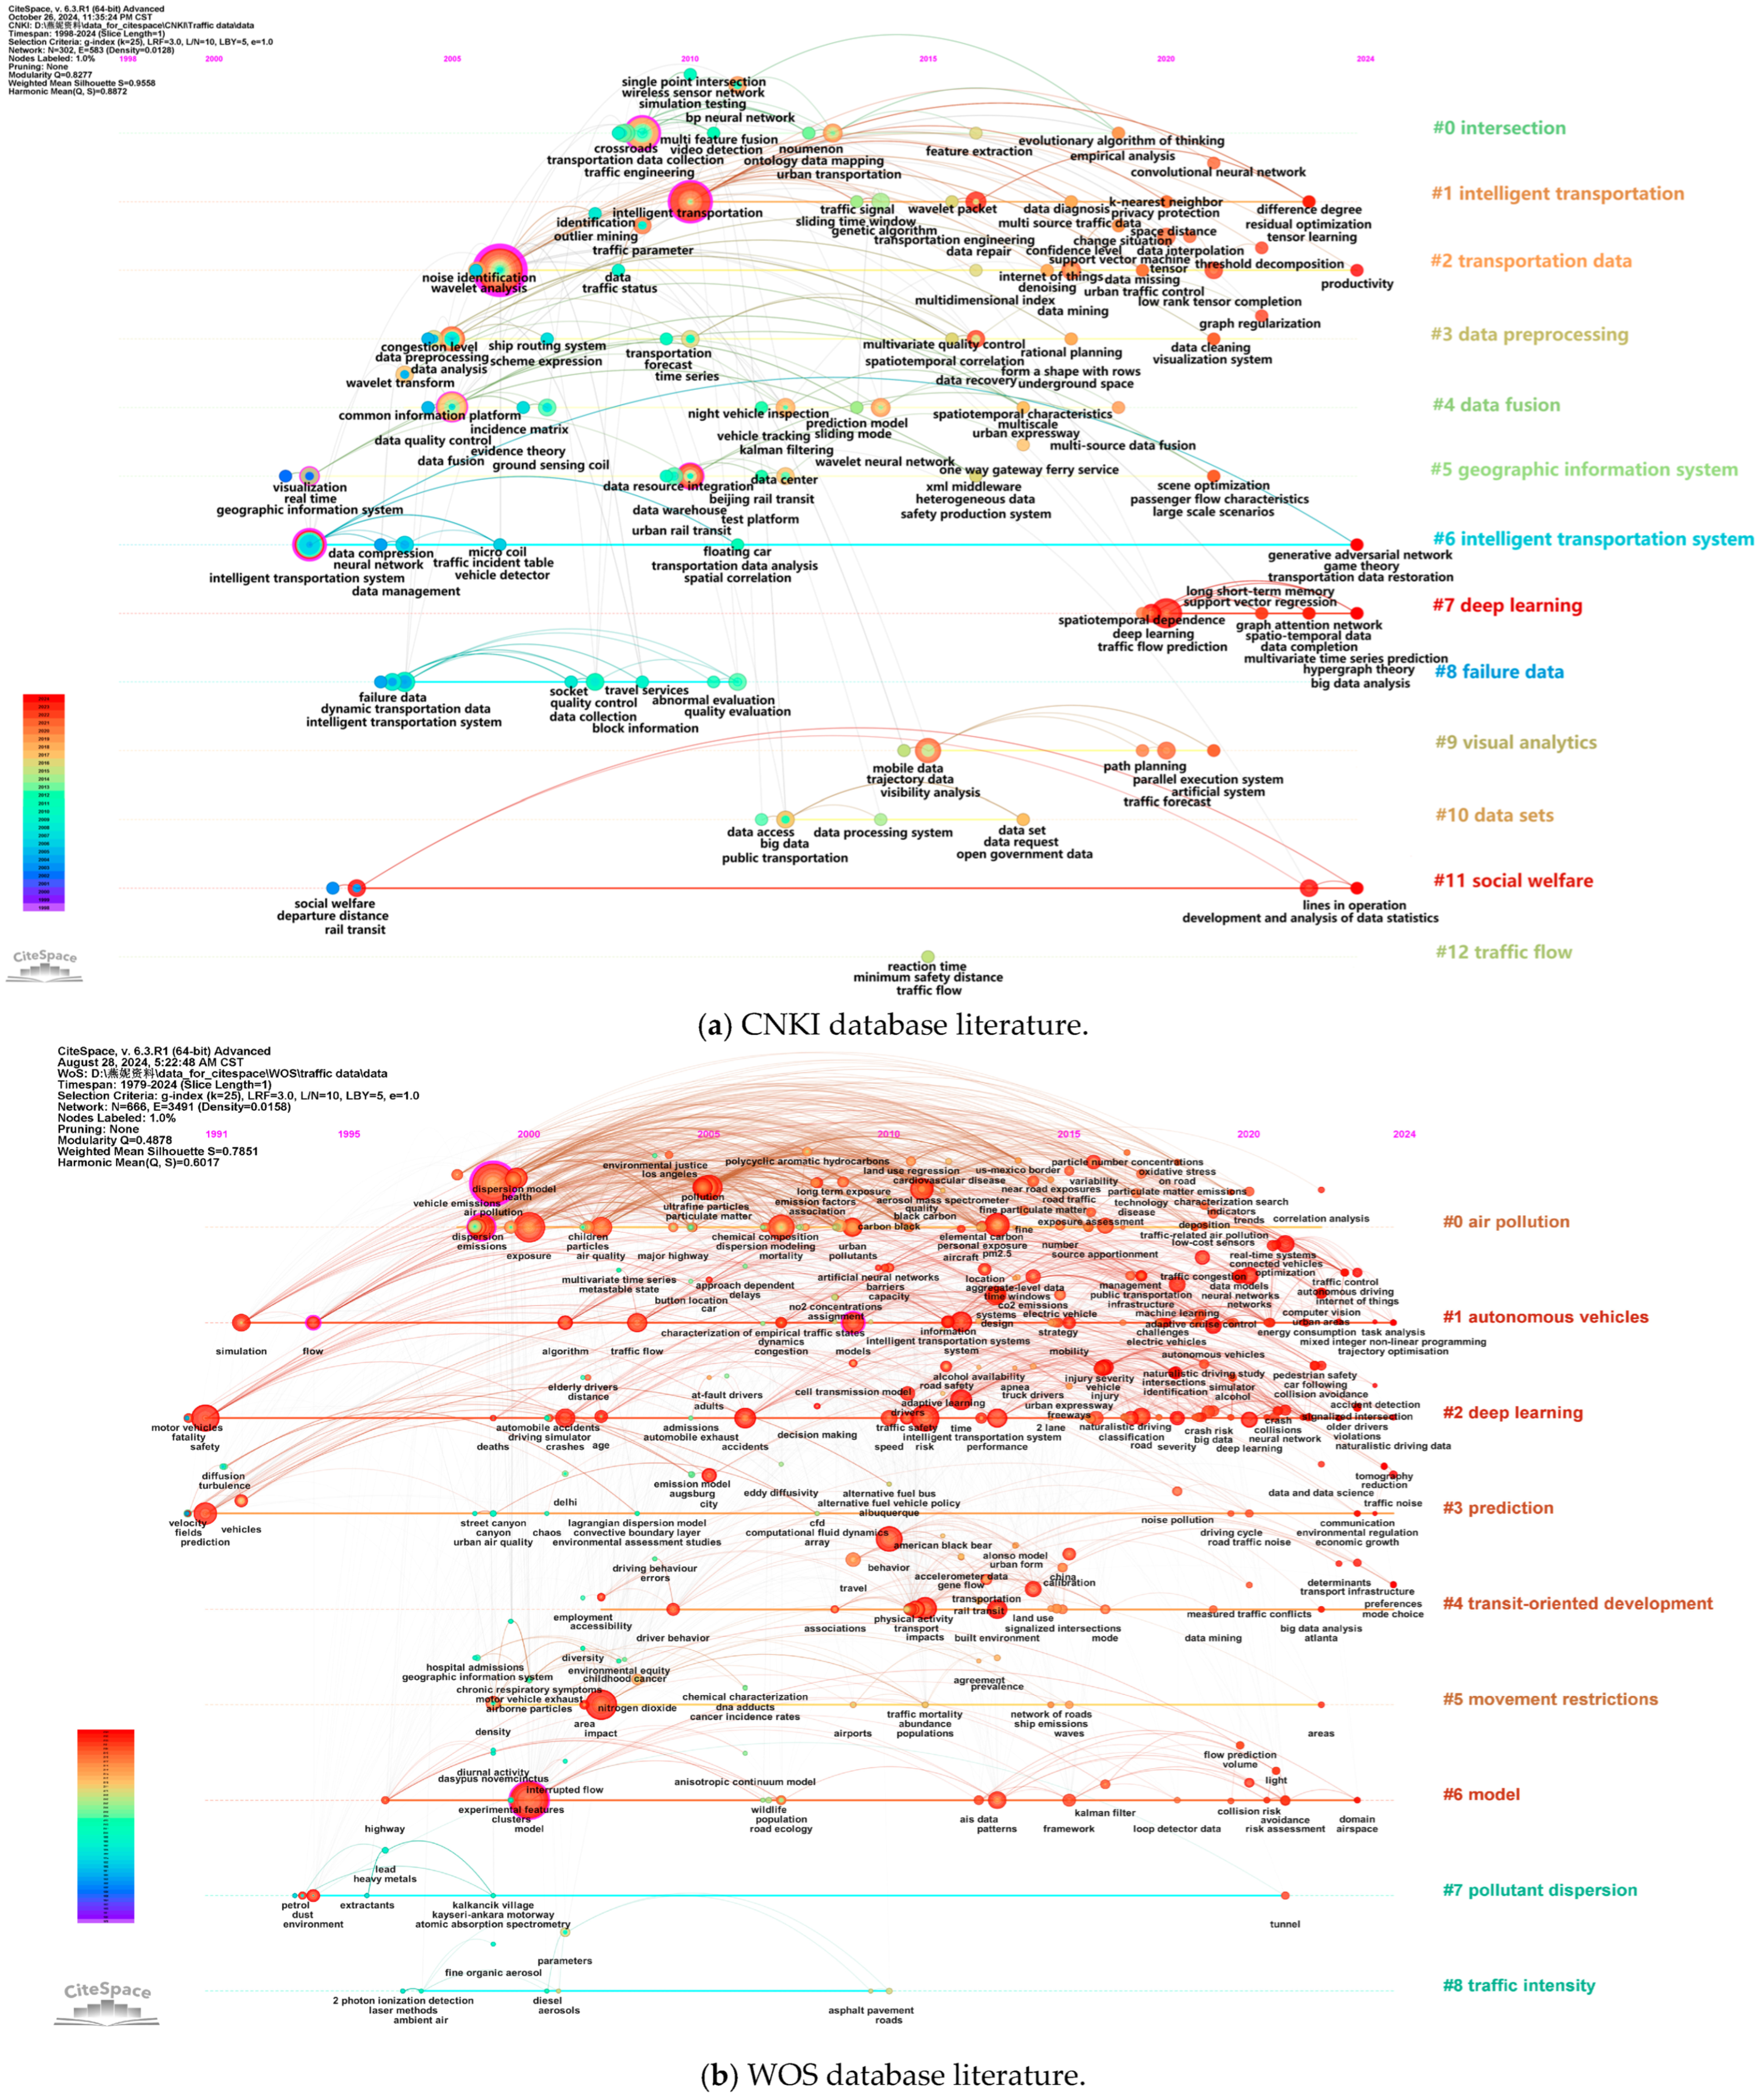
5.6.1. Keyword Time Zone Map Analysis

Research trends can be deeply analyzed and judged through keyword time zone charts and emergent words. Generate a keyword time zone map by selecting the “layout | Timezone View” option in the CiteSpace software. The same clustered keywords will be presented on the timeline according to the year they first appeared. A line indicates that two keywords appear in the same article or multiple articles. The greater the frequency of the keyword, the larger the circle. Figure A6 is a time zone diagram of urban transportation data research keywords.
  • CNKI Database Keyword Co-occurrence Timeline
The #0 Intersection timeline shows that research in this field has gradually evolved from focusing on the basic concepts of intersections to emphasizing technical applications such as transportation data collection, traffic engineering, and wireless sensor networks, as well as the feature extraction and empirical analysis of traffic status. The #1 Intelligent transportation timeline indicates that research in the field of intelligent transportation has gradually shifted its focus to technologies such as traffic signal control, multi-source transportation data processing, and privacy protection. It also involves the application of other methods, such as genetic algorithms and convolutional neural networks. The #2 Transportation data timeline reveals that research on transportation data encompasses various aspects, including noise identification, outlier data mining, and the application of Internet of Things technology, while also addressing practical issues such as urban traffic control and data interpolation. The #3 Data preprocessing timeline highlights the significant role of data preprocessing in urban transportation data research, which involves congestion analysis, multivariate quality control, spatiotemporal correlation, and other research contents, as well as the application of data cleaning and visualization systems. The #4 Data fusion timeline demonstrates that data fusion technology has gradually become a crucial direction in urban transportation data research, encompassing multiple levels such as shared information platforms, data quality control, and wavelet transformation, while also focusing on practical applications such as multi-source data fusion and vehicle tracking. The #5 Geographic information system timeline illustrates that geographic information systems play a vital role in urban transportation data research, involving data resource integration, real-time visualization, urban rail transit, and other aspects, while also emphasizing the construction of test platforms and data centers. The #6 Intelligent transportation system timeline indicates that research on intelligent transportation systems is gradually shifting its focus to specific applications, such as data compression, neural networks, and traffic event tables. Additionally, it involves cutting-edge topics such as floating car data and transportation data analysis. The #7 Deep learning timeline shows that deep learning technology is gradually emerging in the field of urban transportation data research. It involves spatiotemporal dependence, traffic flow prediction, and other directions, with a focus on the application of models such as long short-term memory and graph attention networks. The #8 Fault data timeline indicates that research on fault data is gradually gaining attention in the field of urban transportation. It involves multiple levels, such as dynamic transportation data and intelligent transportation systems, while also addressing practical issues such as quality control and data collection. The #9 Visual analysis timeline reveals that visual analysis technology has gradually become an important tool in urban transportation data research. It encompasses many aspects, such as mobility data and trajectory data, with a focus on practical applications such as path planning and traffic prediction. The #10 Dataset timeline indicates that the management and application of datasets play a crucial role in urban transportation data research, which involves various aspects such as data access and big data processing. Additionally, it emphasizes the importance of developing both public transportation systems and efficient data processing systems. The #11 Social welfare timeline shows that research on urban transportation data is gradually focusing on social welfare issues, which involves multiple aspects, such as departure distance and rail transit services, while also emphasizing data statistics and the optimization of operating routes. The #12 Traffic flow timeline demonstrates that research on traffic flow continues to be a significant area in urban transportation data research. It involves issues such as reaction time and minimum safety distance, while also focusing on the characteristics and optimization of traffic flow strategies.
2.
WOS Database Keyword Co-occurrence Timeline
The #0 Air pollution timeline shows that research in this field has gradually developed from focusing on the basic issues of air pollution to paying attention to traffic emissions, particulate matter, air quality, and their impact on health, particularly the risks for children and the effects of long-term exposure. The #1 Autonomous vehicles timeline shows that research on autonomous vehicles increasingly focuses on technology applications such as simulation, traffic flow, algorithms, artificial neural networks, etc., while also involving electric vehicles, traffic management, and infrastructure challenges. Within this timeline, the research nodes related to the safety assessment and regulatory framework for autonomous driving technology are not significantly prominent, indicating that further research efforts in this area are essential. The #2 Deep learning timeline shows that deep learning technology is gradually emerging in urban transportation data research, involving traffic accidents, safety, driving behavior, and other areas, while also focusing on collision detection, pedestrian safety, and naturalistic driving research. The #3 Prediction timeline shows that research on prediction technology in the field of urban transportation has gradually developed, involving topics such as specific relevant topics related to urban transportation predictions while focusing on urban air quality assessment and case studies in specific cities. The #4 Transit-oriented development timeline shows that, with transportation as the focus of oriented development research, the focus gradually shifts to the impact of employment, accessibility, and driving behavior on transportation and the environment, while involving big data analysis and transportation infrastructure preferences. The #5 Movement restrictions timeline indicates that research on urban transportation data is gradually focusing on the impact of movement restrictions on hospital admission rates, air pollution, and other factors, while also addressing issues related to geographic information systems and (possibly) environmental justice/equity. The #6 Model timeline shows that (specific types of) models occupy an important position in urban transportation data research, involving highways, wildlife, road ecology science, and other aspects, while also focusing on collision risk and traffic prediction. The #7 Pollutant dispersion timeline shows that research on pollutant dispersion has gradually received attention in the field of urban transportation, involving the analysis of pollutants such as gasoline, dust, heavy metals, etc. The #8 Traffic intensity timeline shows that research on urban transportation data gradually focuses on traffic intensity, involving (specific methods related to) laser measurements, ambient air quality, diesel particulate matter, and other issues, while also paying attention to the characteristics/conditions of roads and asphalt pavements.
In general, literature clustering within the CNKI database primarily emphasizes the technical applications and practical problem-solving aspects of urban transportation data, such as data collection and intelligent transportation systems. This focus aligns closely with the needs of domestic urban transportation development. Conversely, literature clustering in the WOS database tends to prioritize the environmental impacts and interdisciplinary applications of urban transportation data, addressing issues such as air pollution and autonomous driving, which reflect an international research perspective. Both databases underscore the breadth and significance of urban transportation data research, which is closely linked to traffic management, policy formulation, and other related areas. However, within the scope of these studies, there is a comparatively limited discourse on data privacy protection and ethical norms, and a distinct research trend has yet to materialize. This indicates deficiencies in research within this domain, which suggests that further exploration and development are required.

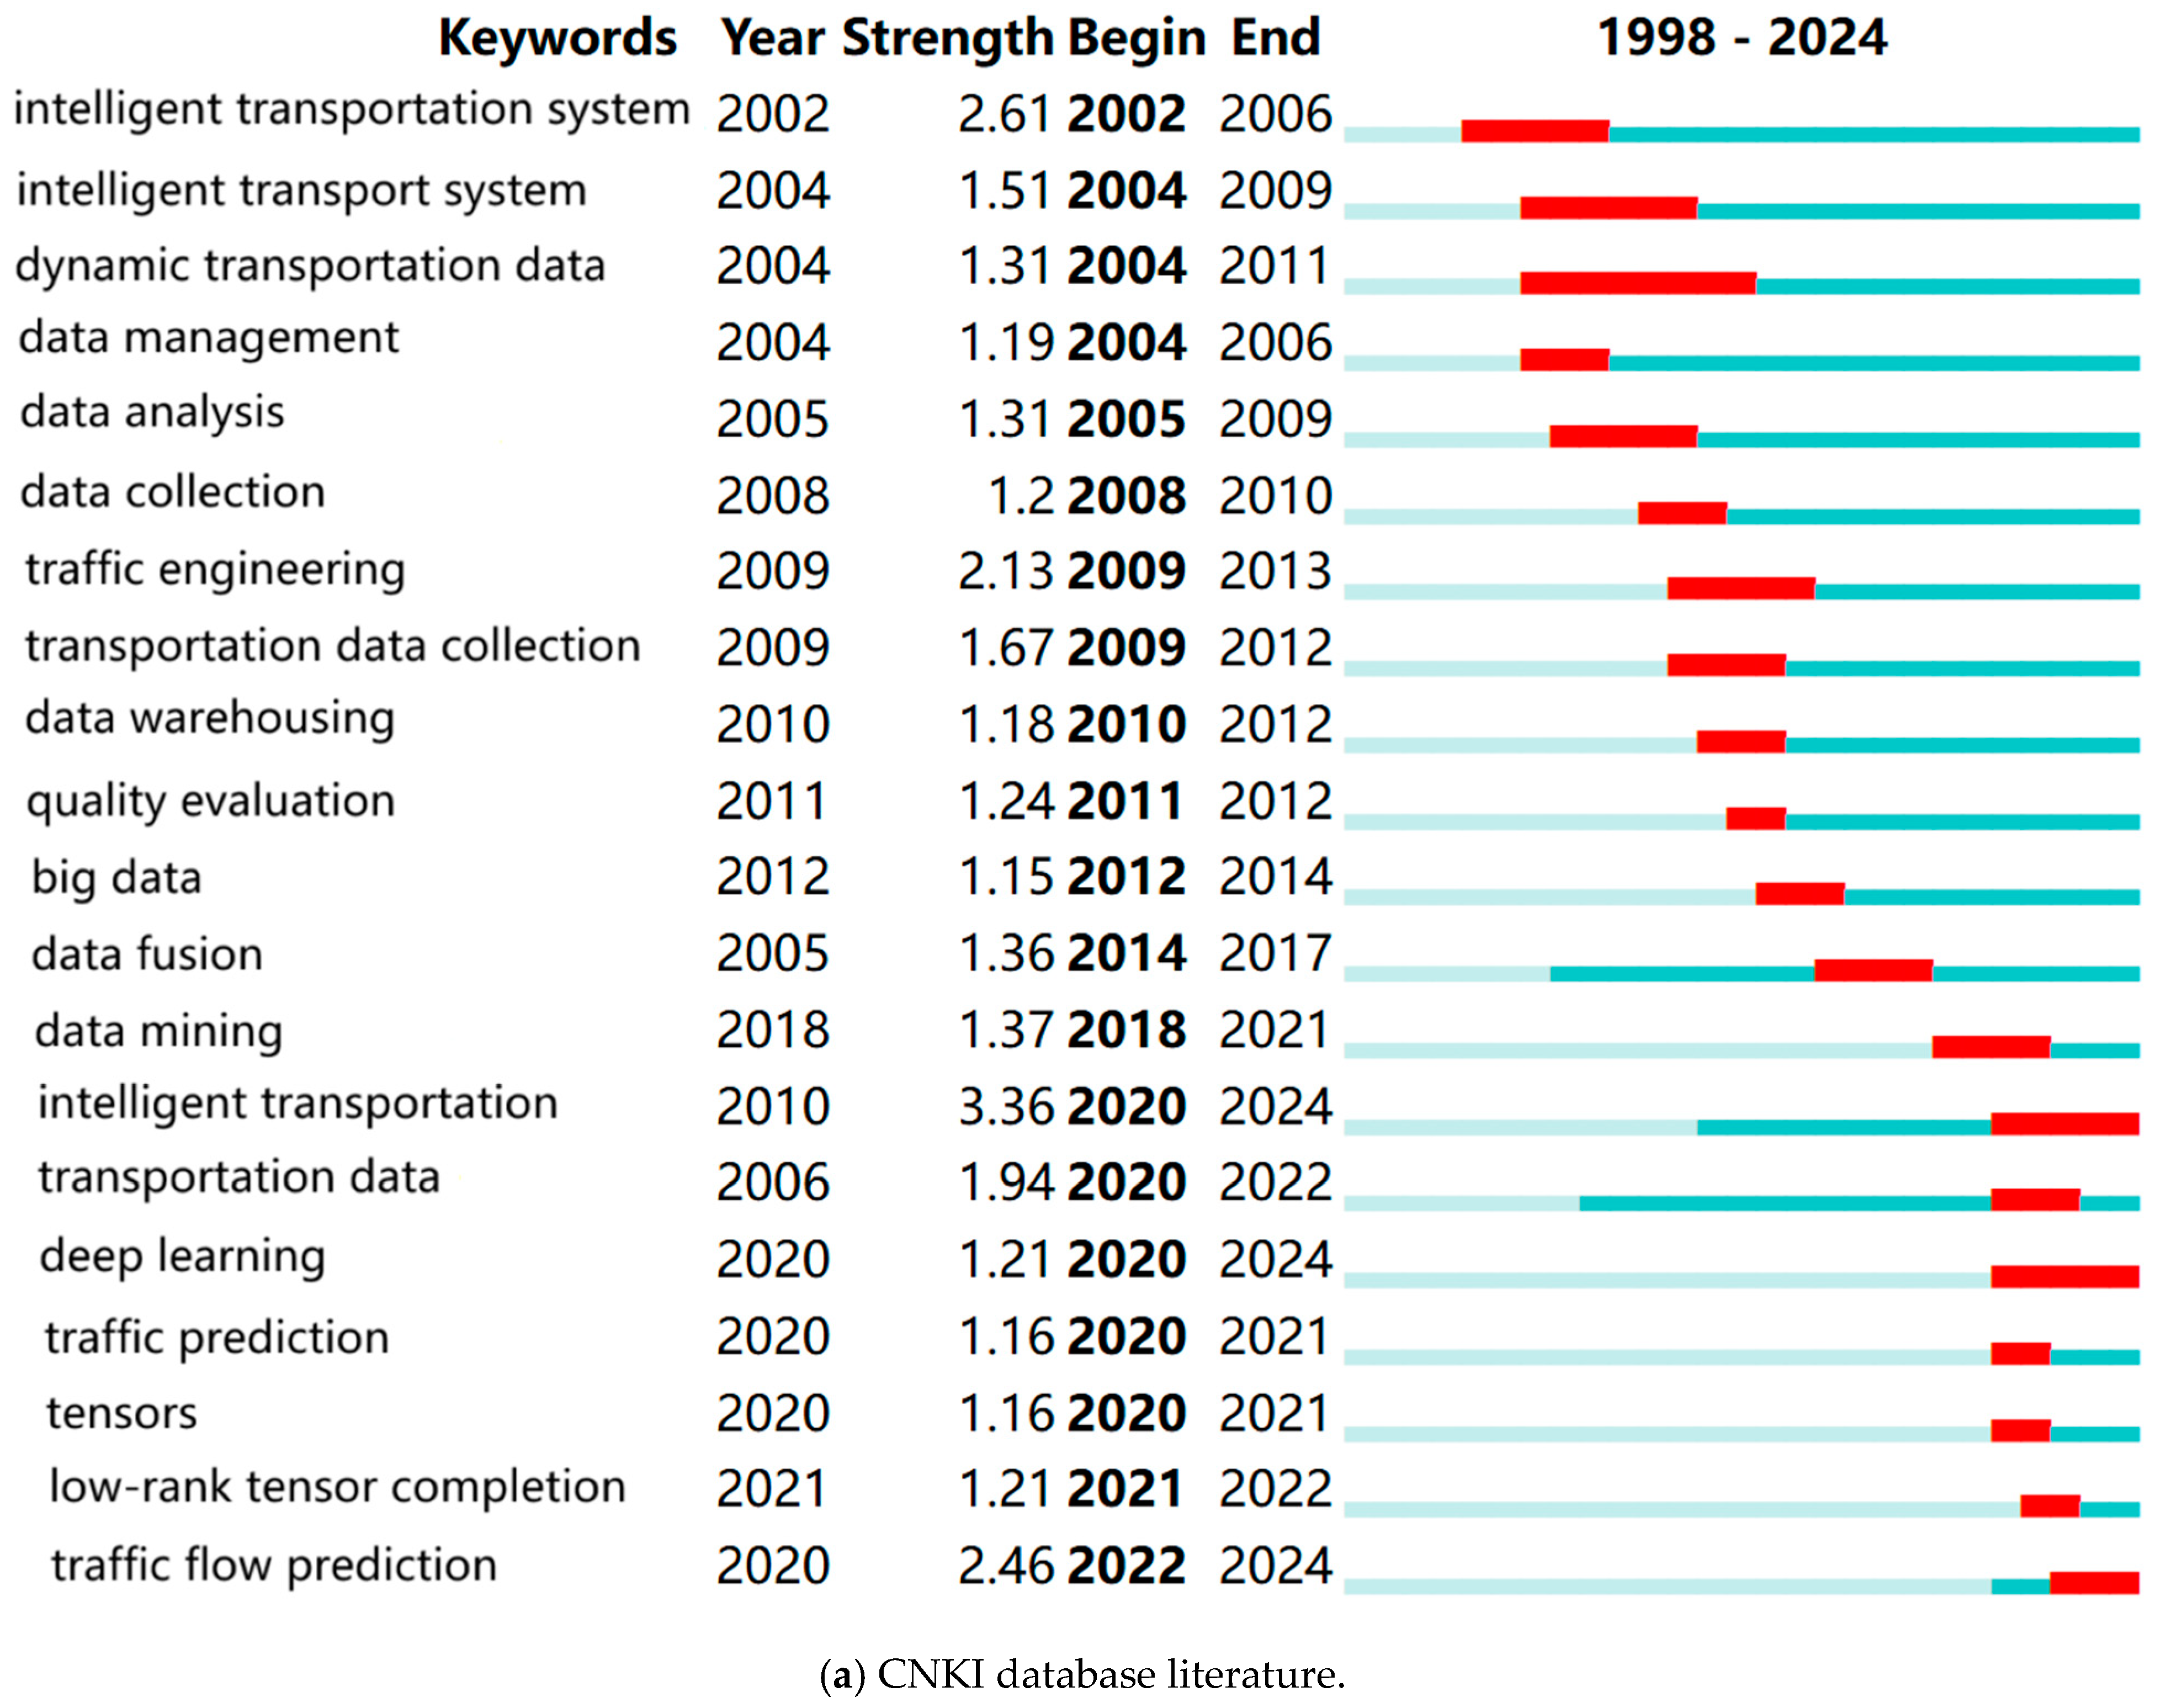
5.6.2. Emergent Node Vocabulary Diagram Analysis

Figure A7 shows the node words with high emergent value in the research literature related to urban transportation data in the CNKI and WOS databases. (1) According to the CNKI database data source, 20 node words with high emergent values are obtained. In the early frontier (2002 to 2009), research mainly focused on intelligent transportation system, intelligent transport systems, dynamic transportation data, data management, data analysis, and data collection. This reflected the researchers’ focus on the intelligence of transportation systems during this period. Automation and transportation data collection, management, and analysis technology received great attention, promoting the infrastructure construction of intelligent transportation systems and the initial formation of data management systems. In the mid-term frontier (2009 to 2020), research shifted its focus to traffic engineering, transportation data collection, data warehousing, quality evaluation, big data, data fusion, and data mining. This indicated that researchers were beginning to turn their attention to the practical application of traffic systems and optimization. Through big data technology and data mining methods, they explored the potential value of transportation data in detail, providing strong support for the design, implementation, and evaluation of traffic projects. Regarding the latest research frontiers of urban transportation data (2020 to 2024), the research topics have focused on intelligent transportation, transportation data, deep learning, traffic prediction, tensors, low-rank tensor completion, and traffic flow prediction. This shows that, with the rapid development of artificial intelligence technology, researchers have begun to use advanced technologies such as deep learning to analyze and predict traffic behavior. Especially through complex data structures such as tensors, they process and analyze large-scale transportation data to improve the intelligence and operational efficiency of traffic systems, providing precise and scientific guidance for urban traffic management and planning. (2) According to the Web of Science (WOS) database, 29 node words with high mutation values were identified. In the early frontier period from 1999 to 2011, researchers primarily concentrated on fundamental areas such as childhood asthma, ultrafine particles, dispersion, mortality, polluters, travel, exposure, and proximity. This focus reflects a significant concern regarding environmental pollution and its health impacts during this stage. Transitioning to the mid-term frontier from 2011 to 2020, the research emphasis shifted towards land use regression, physical activity, health, air quality, transportation, PM2.5, source adaptation, machine learning, traffic flow, performance, models, quality, and big data. This shift indicates that researchers began to explore data-driven methods to optimize urban planning and traffic management while prioritizing residents’ health and quality of life. In the latest research frontiers from 2020 to 2024, the focus has evolved to encompass safety, crashes, time, deep learning, networks, frameworks, optimizations, and systems. This evolution signifies that urban transportation research has progressed into intelligent transportation systems, accident prevention, and efficient management, leveraging advanced technologies to enhance the overall efficiency and safety of transportation systems. (3) The theme of CNKI’s urban transportation data research has gradually evolved from intelligent transportation systems and data management to the application of big data and deep learning technologies for traffic prediction and optimization. This shift reflects the close relationship between technological advancements and data application research. In contrast, the research focus of WOS urban transportation data has transitioned from an emphasis on environmental pollution and health impacts to data-driven urban planning and traffic management, and subsequently to intelligent transportation systems and accident prevention. This trajectory demonstrates the integration of interdisciplinary research with data technology. Consequently, it is evident that CNKI prioritizes the intelligent processing and predictive analysis of transportation data, while WOS integrates urban transportation data research with cross-disciplinary issues such as environmental pollution and public health, highlighting distinct research focuses and interests. Despite ‘safety’ being a prominent term that reflects researchers’ focus on traffic safety, there has been a noticeable absence of prominent terms related to safety assessments and specific regulatory system construction for autonomous driving technology, as well as the design of data privacy protection mechanisms and ethical standards. This observation further underscores the inadequacy of research in these critical areas.

6. Smart City Transportation Data Applications and Privacy and Security Challenges

Urban transportation data have attracted significant attention not only in academic research but also in the development of smart cities, where they play a crucial role. Concurrently, issues related to data privacy and security have emerged as pressing academic and societal concerns. Therefore, it is essential to thoroughly explore the specific applications of urban transportation data in smart city traffic management, along with the challenges they present to data privacy and security, to promote the sustainable development of smart cities.

6.1. Application Cases of Urban Transportation Data in Smart Cities

With the ongoing development of the smart city concept, urban transportation data are becoming increasingly vital for enhancing urban management efficiency and improving residents’ quality of life. The following two specific cases illustrate the practical applications of urban transportation data in smart transportation management.

6.1.1. The City Brain Project for Traffic Management in Hangzhou, China

As a pioneer in the smart city movement in China, Hangzhou’s City Brain project has achieved remarkable success in traffic management [95]. By integrating diverse data sources, such as traffic monitoring videos, GPS positioning data, and public transportation card swipe records, the City Brain can analyze traffic flow in real-time, predict congestion trends, and automatically adjust traffic signal control strategies. For instance, during peak hours in the morning and evening, the system can intelligently identify congested road segments, adjust traffic light timings, effectively alleviate traffic congestion, and enhance overall road traffic efficiency. Furthermore, the City Brain has optimized the layout and operational schedules of bus routes through the analysis of public transportation data, thereby improving the convenience and comfort of public transit services.

6.1.2. The Intelligent Transport System of the Land Transport Authority in Singapore

The intelligent transportation system developed by the Land Transport Authority of Singapore utilizes a range of technological tools [96], including integrated traffic monitoring cameras, traffic signal control systems, and electronic toll collection systems, to achieve the comprehensive surveillance and management of urban traffic. By leveraging big data analytics, the system delves deeply into real-time transportation data, providing a scientific basis for transportation planning, policy formulation, and emergency response. In the event of special weather conditions or large-scale gatherings, the system is capable of forecasting traffic flow alterations in advance, devising corresponding traffic diversion strategies, and ensuring the seamless operation of urban traffic.

6.2. Privacy Protection and Security Challenges of Urban Transportation Data

While the application of urban transportation data has introduced numerous conveniences for urban management, the associated challenges related to privacy protection cannot be ignored. The collection, storage, analysis, and application of transportation data in smart cities frequently involve personal privacy information, such as individual travel trajectories and vehicle location data. During the processes of data collection, storage management, and analytical applications, there exist risks of privacy breaches, security vulnerabilities, and privacy misuse, all of which pose significant threats to personal privacy and the security of urban traffic management. In 2023, several incidents of automotive information security breaches occurred [97], notably involving NIO, which faced ransom attacks resulting in the theft of millions of data records. This data breach garnered widespread attention and discussion, highlighting the vulnerabilities in data security for intelligent connected vehicles. Furthermore, Yanfeng Automobile and Tesla have also reported data breaches, further emphasizing the critical importance of automotive information security in the development of smart cities. These incidents illustrate that as automotive intelligence and networking technologies advance, the risk of data leakage has escalated, presenting serious challenges to the security of automobile manufacturers, users, and related industry chains.
To mitigate the risk of urban transportation data leakage, it is essential to implement robust encryption methods and anonymous technologies. Encryption technology secures sensitive data during both transmission and storage by rendering it unreadable to unauthorized parties. Consequently, even if data are illicitly accessed, they remain challenging to decrypt and exploit. Simultaneously, anonymous technologies effectively obscure the true source and identity of the data, thereby safeguarding personal privacy. For instance, advanced encryption techniques such as differential privacy and homomorphic encryption, along with anonymization strategies such as data anonymization and data perturbation, can provide substantial security assurances for urban transportation data. The integration of these technologies facilitates the legitimate use and sharing of data while preserving privacy, thereby providing critical support for the sustainable development of smart cities.

7. Conclusions

This paper comprehensively utilizes methods such as policy sorting, a literature review, concept definition, and bibliometric analysis to conduct a systematic and in-depth study of urban transportation data. A quantitative analysis of the pertinent domestic and international literature was conducted using CiteSpace software, revealing research hotspots, emerging trends, and historical evolution pathways in this field. The following significant findings and conclusions were derived. (1) Urban transportation data refers to the collective term for all types of data generated by activities such as public travel, passenger, and freight transportation within the urban transportation system. It covers everything from infrastructure status to real-time traffic monitoring, from policy planning to environmental impact assessment, and more. Its data sources, application scenarios, and user base are extensive, making it a key component in smart city traffic management. (2) In the field of urban transportation data research, numerous prolific authors and active research institutions, both domestically and internationally, have consistently contributed to the body of knowledge. An analysis of the earliest publication years and the volume of publications indicates that the international academic community has demonstrated significant interest and conducted extensive research in this area. (3) The United States, China, Canada, and the United Kingdom dominate research in urban transportation data, indicating a significant level of international collaboration in this field. Research across various countries on intelligent transportation, air pollution, transportation planning, and related topics has led to the formation of multiple research clusters, which reflects the universality and depth of transnational joint research efforts. (4) Research on urban transportation data, both domestically and internationally, encompasses areas such as intelligent transportation, traffic flow prediction, data fusion, and deep learning. Domestic studies tend to emphasize the practical application of intelligent transportation systems and traffic management, whereas international research places greater emphasis on interdisciplinary cross-applications, including fields such as environmental science and urban planning. (5) From the perspective of timeline analysis, the application of intelligent transportation systems and big data technology in urban transportation data research has gradually deepened. Early research mainly focused on basic data collection and management, while in recent years, it has gradually shifted to deep learning, spatiotemporal data analysis, and other advanced technological applications. With the rapid development of autonomous driving and intelligent transportation systems, there has been a surge in related research. However, research remains inadequate regarding the safety assessment and regulatory framework development for autonomous driving technology, as well as the design of privacy safeguarding mechanisms and the establishment of ethical guidelines for urban transportation data. Based on the above research results and conclusions, the following research recommendations on urban transportation data can be drawn.
(1) Deepen data integration and collaborative analysis in intelligent transportation systems. The development of intelligent transportation systems relies heavily on the fusion and collaborative analysis of multi-source data. To enhance the efficiency of these systems and the safety of autonomous driving technology, it is essential to advance research on the integration and collaborative analysis technologies related to multi-source urban transportation data. By concentrating on the research and development of efficient data fusion algorithms and models, seamless integration of data from diverse sources can be achieved, thereby facilitating real-time monitoring and prediction of dynamic traffic conditions. Ultimately, this can optimize critical functions such as traffic flow management and signal control and provide comprehensive and accurate data support for the safety assessment of autonomous driving technology.
(2) Improve the privacy protection and security management mechanisms of urban transportation data. Urban transportation data are sourced from a diverse array of applications and encompasses a significant amount of personal privacy information. Therefore, it is essential to establish a comprehensive data privacy protection and security management mechanism. This includes formulating stringent data access control policies, employing advanced encryption technologies, and utilizing anonymization processing methods to ensure effective protection of data throughout its entire lifecycle, including collection, transmission, storage, and processing. Additionally, strengthening the formulation of ethical norms to clarify the ethical boundaries of data use, and reinforcing the development of pertinent laws and regulations to clearly delineate the boundaries of data usage, are critical measures to prevent data abuse and leakage, thereby ensuring the security of urban transportation data.
(3) Promote the in-depth application of big data and artificial intelligence technologies in traffic prediction and management. Big data and artificial intelligence technologies hold significant potential for traffic prediction and management, and it is advisable to actively promote their application within the realm of urban transportation. By developing advanced algorithms, such as deep learning models and graph neural networks, the accuracy and timeliness of traffic flow predictions, congestion identification, accident warnings, and other related functions can be enhanced. Concurrently, utilizing intelligent analytical technologies to optimize decision-making processes such as traffic signal control and route planning will further enhance the overall operational efficiency of urban transportation systems. In the course of the application process, meticulous attention must be devoted to regulatory and ethical prerequisites, to guarantee both the legality and legitimacy of the technological implementation.
(4) Use urban transportation data to scientifically guide policy formulation and planning optimization. Through comprehensive mining and analysis of urban transportation data, we can assess the impacts of various traffic policies and planning programs, thereby providing a scientific foundation for government decision-making. Additionally, employing simulation models and data visualization technologies to illustrate changes in traffic conditions before and after policy implementation can enhance the transparency and credibility of the decision-making process. In the formulation of policies and plans, it is imperative to comprehensively consider both the evolutionary trend of autonomous driving technology and the imperative for privacy protection to ensure the forward-looking nature and practical feasibility of the policies devised.
(5) Actively explore the integration paths between emerging transportation modes and existing systems. With the rise of emerging transportation modes such as autonomous vehicles and shared travel, urban transportation systems are facing profound changes. It is recommended to actively explore the integration paths of emerging transportation modes and existing urban transportation systems. Establishing a comprehensive transportation information platform, optimizing the allocation of transportation resources, and formulating collaborative management strategies can promote the complementarity and synergy between emerging transportation modes and existing modes, such as public transportation and private transportation, and facilitate the development of urban transportation systems in a more intelligent, green, and efficient direction. Simultaneously, emphasis should be placed on the establishment of regulatory frameworks and ethical standards to guarantee the lawful, secure, and methodical advancement of emerging transportation modes.
The conceptual definition of urban transportation data in this paper primarily reflects a Chinese academic perspective, which may limit its comprehensiveness. Given the international variations in policies, regulations, technical standards, cultural contexts, and transportation infrastructures, the understanding and application of urban transportation data differ significantly across regions. Future research should broaden the international perspective and compare the practices of various countries and regions regarding data definition, classification, application, and management. This approach will facilitate a more comprehensive and nuanced understanding of global developments in this field.

Author Contributions

Conceptualization, Y.L. and J.Y.; methodology, Y.L.; software, Y.L. and R.W.; formal Analysis, Y.L.; investigation, B.Q. and S.H.; data curation, Y.L. and J.Y.; writing—original draft preparation, Y.L.; writing—review and editing, Y.L., J.Y. and R.W.; visualization, Y.L.; supervision, J.Y. and Y.L. All authors have read and agreed to the published version of the manuscript.

Funding

This research was funded by the Guangxi Philosophy and Social Sciences Research Project (Grant No. 23CYJ022), the Scientific Research Basic Ability Enhancement Project for Young and Middle-aged Teachers in Guangxi Universities (Grant No. 2023KY0421), and the Scientific Research Initiation Project for Beibu Gulf University Introducing High-Level Talents (Grant No. 2022KYQD07).

Institutional Review Board Statement

Not applicable.

Informed Consent Statement

Not applicable.

Data Availability Statement

Data will be made available upon request.

Acknowledgments

The authors also thank the editor and the anonymous reviewers for their valuable comments.

Conflicts of Interest

Author Ran Wang was employed by the State Cloud Technology Company. The remaining authors declare that the research was conducted in the absence of any commercial or financial relationships that could be construed as a potential conflict of interest.

Appendix A

Table A1. Policies related to transportation data issued by China in recent years.
Release TimeIssuing AgencyPolicy NameRelated Content
4 July 2015The State Council of the People’s Republic of ChinaGuiding Opinions on Actively Promoting the “Internet +” Action [98]Enhance operational status and traffic information collection using the Internet of Things and mobile Internet for transportation networks.
31 August 2015The State Council of the People’s Republic of ChinaAction Plan to Promote the Development of Big Data [99]Establish a comprehensive transportation service big data platform for collaborative management and public service enhancement.
30 July 2016National Development and Reform Commission, Ministry of Transport of the People’s Republic of ChinaImplementation Plan for Promoting ‘Internet +’ Convenient Transportation to Advance the Development of Intelligent Transportation [3]Develop transportation big data enterprises, improve data processing, and innovate data products for operational support and decision-making.
19 April 2016Ministry of Transport of the People’s Republic of ChinaTransportation Informatization “13th Five-Year” Development Plan [100]Strengthen data collection from transportation enterprises to establish a comprehensive big data system for monitoring and decision-making.
25 August 2016Ministry of Transport of the People’s Republic of ChinaImplementation Opinions on Promoting Open Sharing of Data Resources in the Transportation Industry [101]Tap into the value of data resources, utilize data for decision-making, management, and innovation, improve governance and service levels, and encourage enterprises and social institutions to innovate.
3 February 2017The State Council of the People’s Republic of ChinaNotice on the “Thirteenth Five-Year” Development Plan of Modern Comprehensive Transportation System [102]Make full use of the data and information resources of the government and enterprises to explore and analyze population migration, travel patterns, and vehicle movement to strengthen transportation development decision-making.
19 September 2019Central Committee of the Communist Party of China, the State Council of the People’s Republic of ChinaOutline for Building a Powerful Transportation Country [103]Promote data resources to empower transportation development and accelerate the integrated development of infrastructure and information networks.
16 December 2019Ministry of Transport of the People’s Republic of ChinaAction Outline for Promoting the Development of Big Data in Comprehensive Transportation (2020-2025) [4]Implement “five major actions” for integrated transportation big data development and build a comprehensive transportation big data center system.
7 April 2020National Development and Reform Commission, Office of the Central Cyberspace Affairs CommissionImplementation Plan on Promoting the Action of “Moving to the Cloud and Empowering Intelligence with Data” to Cultivate New Economic Development [104]Promote digitization of supply chain elements and support the creation of a digital industrial chain.
3 August 2020Ministry of Transport of the People’s Republic of ChinaGuidance on Promoting the Construction of New Infrastructure in the Field of Transportation [105]Promote open access to comprehensive transportation public information resources and deepen big data application in the industry.
February 2021Central Committee of the Communist Party of China, the State Council of the People’s Republic of ChinaNational Comprehensive Three-dimensional Transportation Network Planning Outline [106]Strengthen preventive maintenance and safety assessment of transportation infrastructures and promote coordinated development of intelligent connected cars and smart cities.
10 June 2021The 29th Meeting of the Standing Committee of the 13th National People’s CongressData Security Law of the People’s Republic of China [107]The competent departments of industry, telecommunications, transportation, finance, natural resources, health, education, and science and technology shall bear the responsibility for data security supervision in their own industries and fields.
22 December 2021Ministry of Transport of the People’s Republic of ChinaDigital Transportation “14th Five-Year” Development Plan [108]Promote the comprehensive application of urban traffic big data for integrated information integration and services, as well as the joint development and utilization of resources by government and enterprises.
6 January 2022General Office of the State Council of the People’s Republic of ChinaOverall Plan for Comprehensive Reform Pilot of Factor Market-oriented Allocation [109]Priority will be given to promoting the opening of high-value data sets such as enterprise registration and supervision, health, transportation, and meteorology to the public.
18 January 2022The State Council of the People’s Republic of China“14th Five-Year” Modern Comprehensive Transportation System Development Plan [110]Further improve the open sharing mechanism and exchange channels of transportation data resources, formulate data resource open system specifications, and promote the compliant opening and shared utilization of mature data resources.
27 February 2023The State Council of the People’s Republic of ChinaOverall Layout Plan for Digital China Construction [111]Promote the deep integration of digital technology and the real economy and accelerate the innovative application of digital technology in key areas such as agriculture, industry, finance, education, medical care, transportation, and energy.
29 March 2023Ministry of Transport of the People’s Republic of China, etc.Five-year Action Plan to Accelerate the Construction of a Strong Transportation Country (2023-2027) [112]Accelerate technological innovation-driven development, establish a national comprehensive transportation information platform, and enhance data aggregation.
20 April 2023Eight departments including Ministry of Industry and Information Technology of the People’s Republic of ChinaImplementation Opinions on Promoting IPv6 Technology Evolution and Application Innovation Development [113]Support digitalization and intelligent transformation of transportation infrastructure and promote smart highway–vehicle collaborative networks.
20 September 2023Ministry of Transport of the People’s Republic of ChinaOpinions on Promoting the Digital Transformation of Highways and Accelerating the Construction and Development of Smart Highways [114]By 2027, make significant progress in highway digital transformation, integrate market data resources, and improve data openness and sharing mechanisms.
8 October 2023Ministry of Transport of the People’s Republic of China, etc.Several Opinions on Promoting the Healthy and Sustainable Development of Urban Public Transportation [115]Optimize urban public transportation networks and improve operational efficiency through big data applications.
24 November 2023Ministry of Transport of the People’s Republic of ChinaOpinions on Accelerating the Construction of Smart Ports and Smart Waterways [116]Improve the level of industry data sharing, promote the construction of a “data brain”, strengthen data resource management, and strengthen data security protection.
31 December 2023National Data Administration and other departments“Data Elements ×” Three-Year Action Plan (2024-2026) [117]Support leading transportation companies in promoting high-quality data set construction and reuse and promote integration and application of multi-source data.
1 May 2024Ministry of Finance of the People’s Republic of China, Ministry of Transport of the People’s Republic of ChinaNotice on Supporting and Guiding the Digital Transformation and Upgrading of Highway and Waterway Transportation Infrastructure [118]Promote large-scale implementation of innovative application scenarios in highways and waterways, as well as the intelligent expansion of transportation infrastructure.
Table A2. Definition of transportation data in Chinese academic circles.
AuthorDate of PublicationFirst AffiliationDefinition
Zhang et al. [119]August 2020Beihang UniversityVehicle trajectory data is fundamentally different from loop detector data. The latter includes all vehicles detected at the location where the loop detector is installed, while the former includes only a portion of the traffic volume collected at consecutive locations along the route in the road network.
Xu et al. [120]1 November 2002National University of Defense TechnologyTraffic management data is highly complex, encompassing general geographical elements (such as residential areas, vegetation, and boundaries) and traffic-specific elements (urban roads, centerlines, and facilities). These traffic elements involve both static geo-objects with real-time data and dynamic geo-objects.
Zhang et al. [121]11 April 2004Beijing Jiaotong UniversityTransportation system data come from a wide range of sources, with many types and greatly different forms of expression. The data also have high degrees of sharing, high standardization requirements, and spatiotemporal, structural, transmission, and quality characteristics. The data can be classified according to data type, storage type, the relationship between data and time, system composition, etc.
Xu et al. [122]1 October 2005Shanghai UniversityAn important feature of urban road transportation data is reproducibility, including the reproducibility of daily transportation data and the reproducibility of weekly transportation data. Transportation data characteristics are primarily location-, date-, and time-dependent.
Wang and Wang [123]28 October 2005Huazhong University of Science and TechnologyTransportation data in intelligent transportation systems have the characteristics of wide and diverse sources, different expression methods, large amounts of information, wide distribution ranges, and strong spatiotemporal and thematic relevance, but high requirements for sharing and standardization. It can be divided into five levels of data: collection, fusion, decision-making, collaboration, and service.
Miao and Yan [124]30 March 2006 Peking UniversityIntelligent transportation systems manage geospatial data, including positioning, graphics, remote sensing images, and attributes. Core data comprise road network-based geographical information integrated with socioeconomic and traffic details (both static and dynamic). These data uniquely feature rich content, spatiotemporal aspects, and multi-scale spatial characteristics.
Zhang et al. [125]30 January 2006Tsinghua UniversityThe transportation data of intelligent transportation systems have the characteristics of distribution, heterogeneity, autonomy, massive, dynamic, and evolution.
Li et al. [126]15 March 2009Southwest Jiaotong UniversityTransportation data are categorized into static and dynamic types. Static data, sourced directly from business units, include road network details, geometry, lane count, intersection parameters, traffic signs, bus stops, parking lots, and key institution/site information. Dynamic data mainly comprise traffic flow, density, timing plans, road occupancy, congested sections, and intersection queues.
Guo et al. [127]15 October 2010Wonders Information Company LimitedRail transit data can be classified in three ways. (1) By Organizational Level: Spatial basic data, business operation data, business management data, and decision support data. (2) By Business Management Field: Engineering construction, operation management, maintenance, and public application data. (3) By Time Dimension: Static data, dynamic data, and public basic data.
Jiang et al. [128]15 April 2013Jilin UniversityIn a specific area, the transportation data sequence is the result of the joint action of factors such as the socioeconomic status, road network, vehicle ownership, driver characteristics, traffic control measures, and traffic environment in the area, and has the characteristics of randomness and similarity.
Li and Wang [129]15 September 2013Chang’an UniversityUrban expressway network traffic information data have heterogeneous characteristics such as diverse content and different characteristics, widely dispersed sources, different formats or data standards, content differences, and the impact of legacy systems.
Wu et al. [130]16 April 2014Beijing Technology and Business UniversityOriginal transportation data have the characteristics of being large-scale, sequential, periodic, and random in nature.
Dong et al. [131]15 December 2014Shandong UniversityThe transportation data (including text records and images) are characterized by being huge in quantity and with rapid generation and strong heterogeneity.
Wang and Yuan [132]15 January 2015Peking UniversityTrajectory data describe changes in the spatial location and attributes of objects over time. This is often found in fields such as transportation, meteorology, ecology, and mobile services.
Liu et al. [133]20 April 2016Hunan Institute of EngineeringWith the development of intelligent transportation and the Internet of Things, transportation data have the characteristics of being massive and multi-dimensional, with frequent updates, and the spatial distribution changes over time.
Fang et al. [134]10 February 2017North China University of TechnologyTransportation data are a typical type of spatiotemporal data.
Lu et al. [135]23 January 2018Hainan Tropical Ocean UniversityThe characteristics of ship transportation data are non-stationary and random, including traffic flow data, ship travel time, driving frequency, and other data.
Xu et al. [136]10 May 2018Zhejiang University of TechnologyUrban transportation data have the characteristics of wide variety, uneven quality, non-standard output format, continuity, and regularity.
Lu et al. [137]3 September 2018Chongqing Jiaotong UniversityThere are a large amount of transportation data in the urban transportation system, which usually include static data and dynamic data. Dynamic transportation data will have different characteristics and properties depending on the collection time, location, and acquisition method.
Liu et al. [138]13 December 2018Shandong University of Science and TechnologyThe main data source of the intelligent transportation system is road section transportation data (traffic flow, travel speed, occupancy, etc.). This traffic information is the basis for traffic control and management.
Wang et al. [56]15 June 2020Zhejiang UniversityTransportation data collection is the initial link of the traffic control system, providing basic data for control strategies and control algorithms. Common data collection methods include coils, microwaves, ultrasonics, videos, vehicle-mounted GPS, electronic tags, etc. The collected data mainly include traffic flow, saturation flow rate, time occupancy, speed, travel time, etc.
Zhang and Feng [139]17 September 2020Nanjing University of Aeronautics and AstronauticsTraffic flow prediction is an important part of intelligent transportation. The transportation data to be processed have the characteristics of nonlinearity, periodicity, and randomness.
Zhan et al. [54]10 January 2021Wuhan UniversityInternet traffic data have the advantages of high integrity and reliability due to their crowdsourced collection and verification, direct provision of cost and route information without the need for complex modeling, detailed insights such as stop times and vehicle types for refined construction, and the ability to accurately reflect actual passenger behavior through real-world application impact.
Cao et al. [50]18 April 2021Beijing University of TechnologyIn the rail transit operation data, card swiping data record the user’s entry and exit time and site information. The data have the characteristics of continuous time, wide coverage, and large amounts of data. This provides a real and accurate source of passenger flow data and facilitates passenger flow information statistics and travel characteristics research.
Wu et al. [140]20 December 2021Air Force Engineering UniversityThe traffic information collection system obtains comprehensive, rich, and real-time traffic information through sensors. The records of spatiotemporal transportation data come from time-stamped traffic status (such as flow and speed, etc.) in different locations. Transportation data are not completely linear data.
Wu et al. [141]26 May 2023Air Force Engineering UniversityThe traffic information collection system obtains comprehensive, rich, and real-time spatiotemporal traffic information through a large number of road sensors, coil detectors, cameras, operating vehicles, and other sources, and forms a multi-modal urban transportation data set.
Xu and Xu [142]29 June 2024Guangdong University of Science and TechnologyIn the urban road network environment, a large number of distributed sensors have collected massive spatiotemporal data on traffic operation status. These data provide reliable support for revealing the hidden activity patterns of urban residents and the spatiotemporal characteristics of traffic flow.
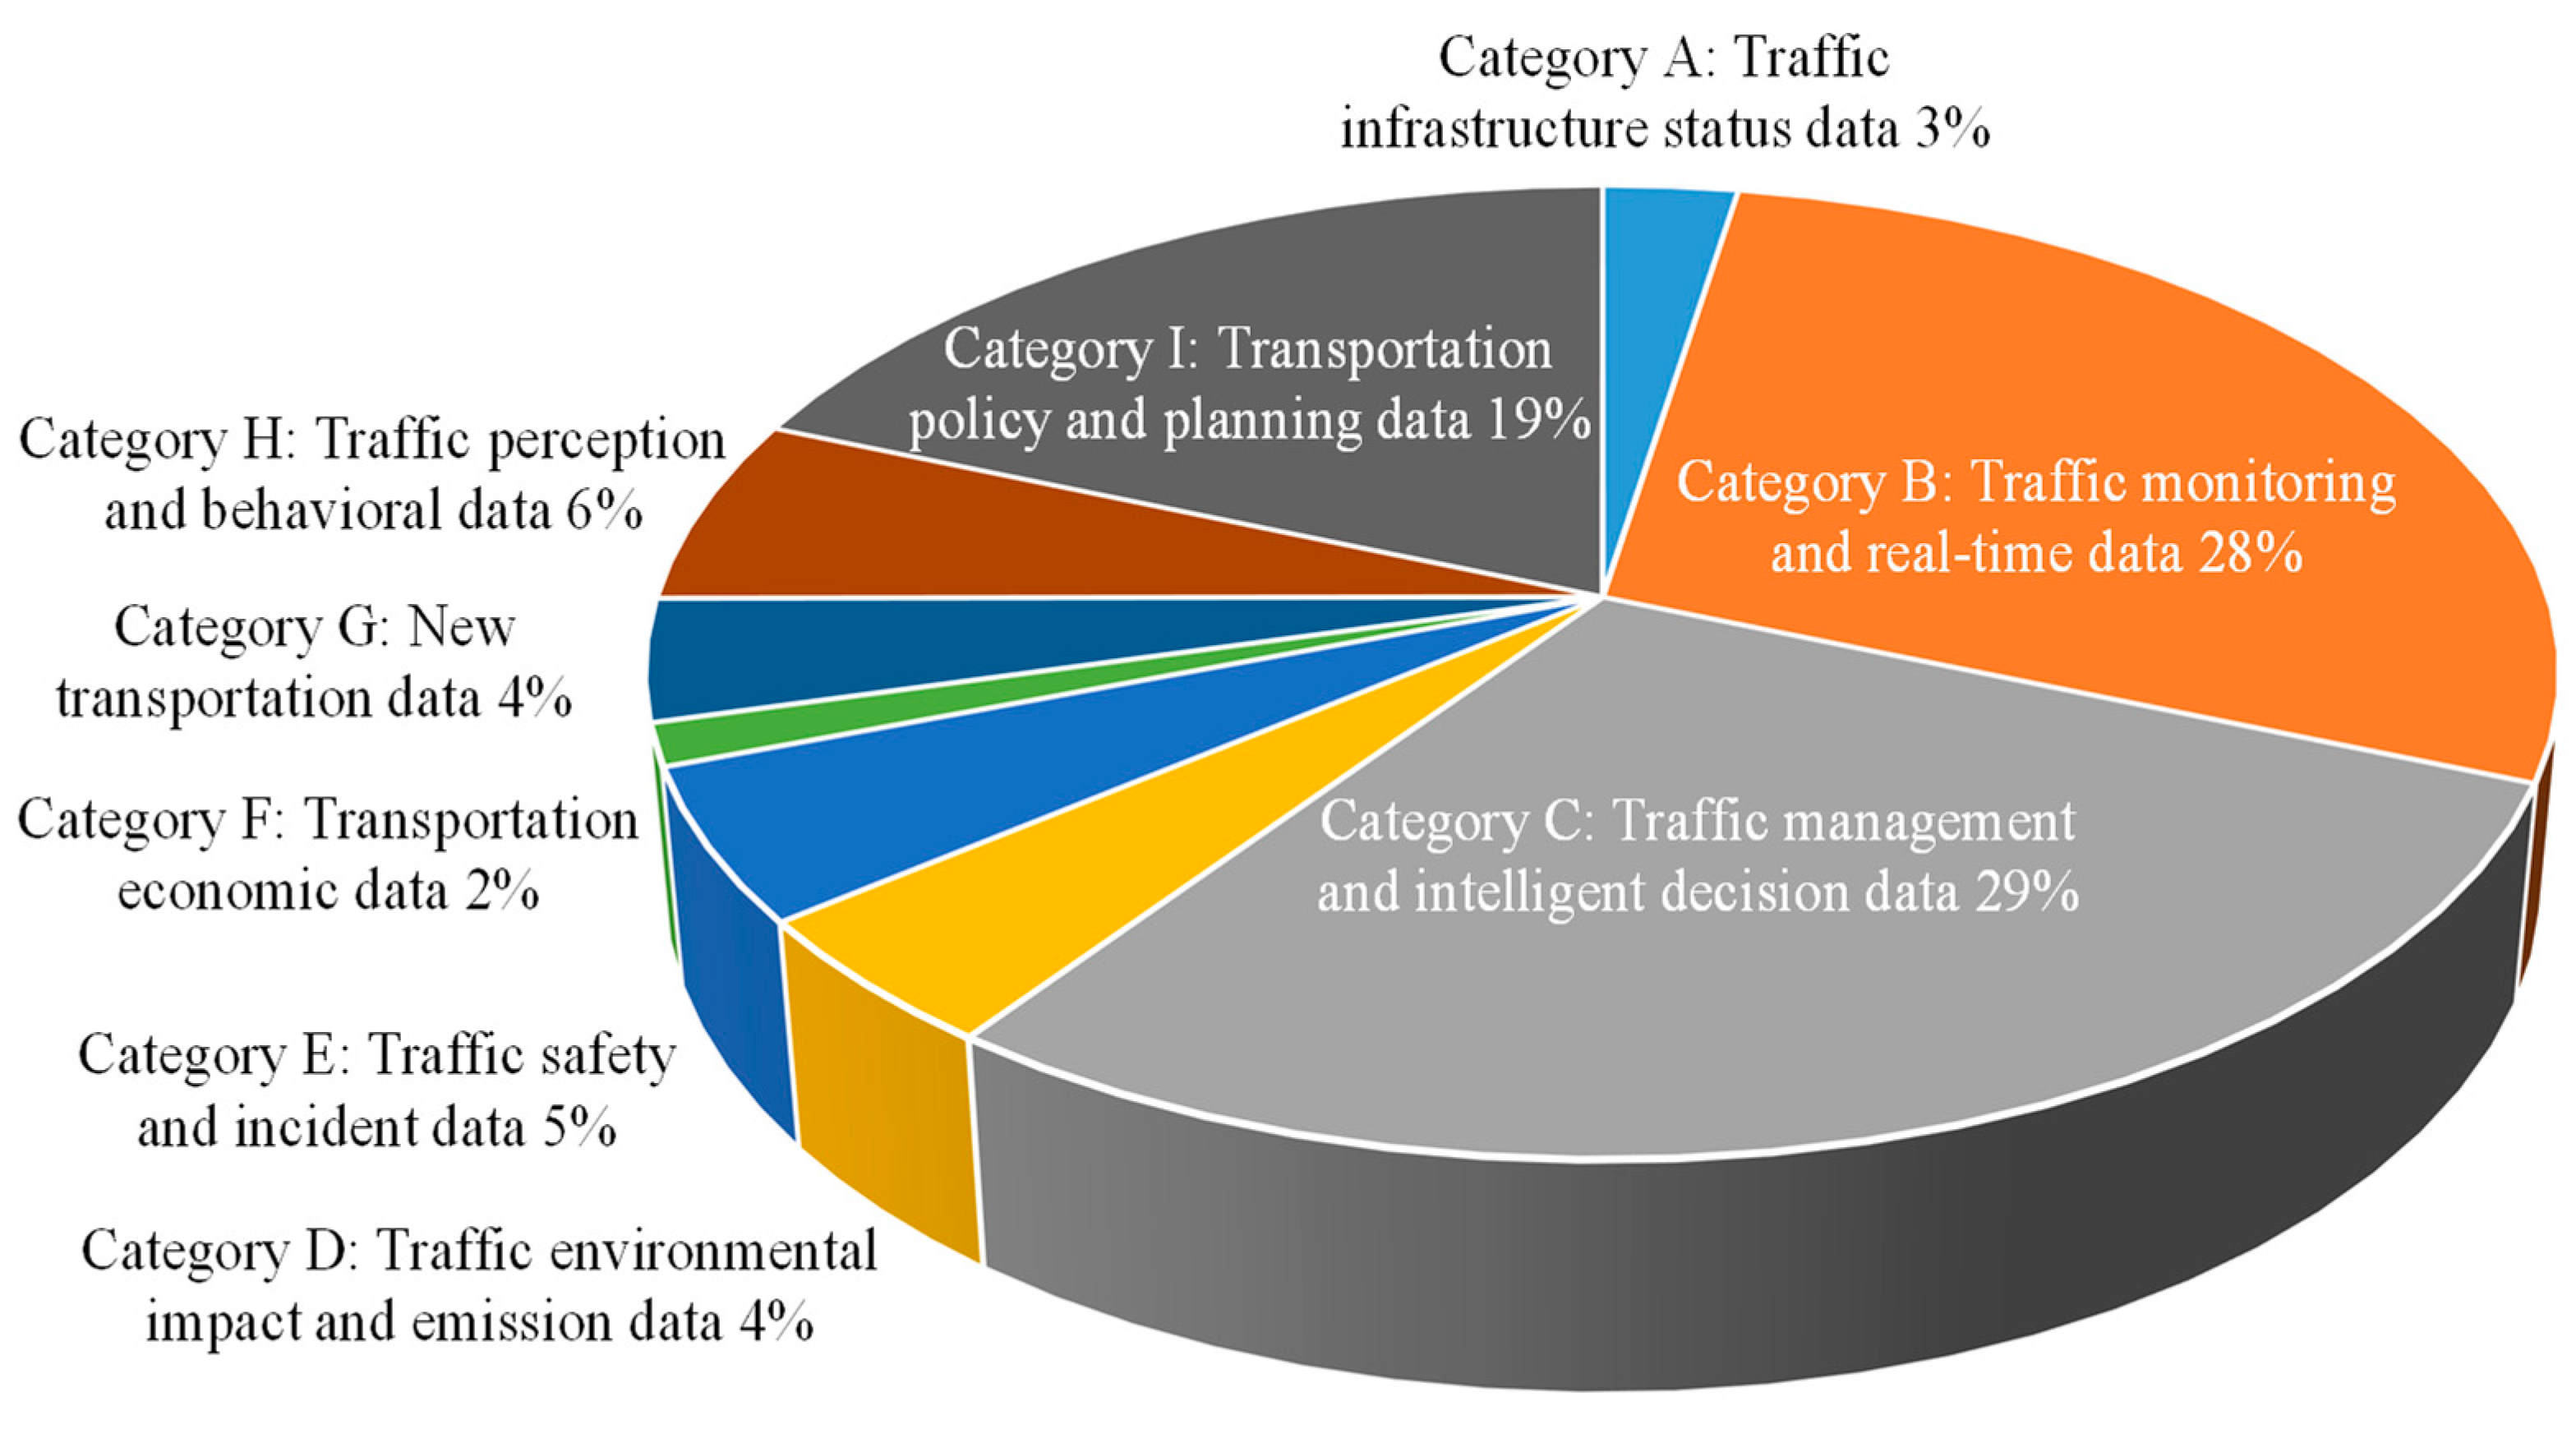
Note: The above table includes relevant research literature published in core Chinese journals and higher; Given the extensive number of studies concerning transportation data, this analysis only considers pertinent definitions from Chinese research institutions; Additionally, Web of Science (WOS) only counts journal papers from the first area of the Chinese Academy of Sciences.
Table A3. Classifies the types of urban transportation data based on relevant research in Chinese academic circles.
Data TypeClassification DescriptionNumber of Related Literature
Category A: Traffic infrastructure status dataCovers the construction, use, and operation status of transportation infrastructure, as well as health monitoring information. Specifically, it encompasses the construction details of transportation infrastructure such as roads, bridges, and parking lots; Data on the frequency of use and operating status of these facilities; As well as structural status, health assessment, and monitoring data of key infrastructure such as bridges and tunnels.15
Category B: Traffic monitoring and real-time dataInvolving real-time traffic monitoring information, including vehicle traffic records, real-time images, etc.; Traffic flow data, such as vehicle throughput; Traffic speed data, such as average speed; Lane occupancy data, reflecting the proportion of vehicles in the lane; Traffic density data, representing the number of vehicles within the unit length; And vehicle trajectory data, recording the GPS location information of buses, subways, taxis, private cars, and other vehicles.161
Category C: Traffic management and intelligent decision dataContains the control schemes and logic of traffic signs, signals, and related digital images; Data from specific traffic control systems (such as Sydney Coordinated Adaptive Traffic System); Ship traffic management information related to water traffic safety and transport efficiency; Air traffic management data; Intelligent transportation systems and Various types of data generated by the Internet of Vehicles; And data on vehicle energy networks, including energy transmission and storage.164
Category D: Traffic environmental impact and emission dataInvolving traffic environment monitoring results, such as atmospheric particulate matter concentration; Traffic noise data, such as noise equivalent sound pressure level; Traffic emission information, including tail gas emissions; And assessment data of the impact of traffic on the environment and socioeconomics.25
Category E: Traffic safety and incident dataContains information related to traffic safety, such as traffic accident data, cause analysis, risk assessment, etc.; Traffic incident data, recording traffic congestion, special traffic conditions, traffic control, and other situations; And traffic conflict data, describing specific traffic conflict scenarios such as two-wheelers and cars.29
Category F: Transportation economic dataThis type of data involves transportation cost information, such as travel time costs, economic costs, etc.; And transportation operation income data, such as the operating income of taxi drivers.8
Category G: New transportation dataContains traffic information related to drones and autonomous vehicles. Specifically, it includes data on the application of drones in the transportation field, as well as data on the research and development, testing, and operation of autonomous vehicles.23
Category H: Traffic perception and behavioral dataThis type of data involves behavioral information of traffic participants, such as drivers’ acceleration, deceleration, steering, etc.; Physiological response data of traffic participants, such as changes in pupils, heart rate, etc.; Transportation demand data, reflecting passengers’ travel needs; And transportation mode selection data, including attitude surveys, rail transit usage, etc.35
Category I: Transportation policy and planning dataContains transportation policy information, such as policy formulation and implementation; And transportation planning data, involving long-term and short-term transportation development planning.107
Category J: Other urban transportation dataContains other data related to the transportation field that does not fall into the above Categories A to I. These data may relate to various aspects of the transportation sector but do not fall into clearly defined data categories./
Note: Since a single item of literature may involve multiple types of urban transportation data, there will be an overlap in the numbers of relevant literature.
Table A4. Compilation of main data sources of urban transportation data based on relevant research in Chinese academic circles.
Data SourceDescription
Official documents and statisticsIncluding approval documents from the National Development and Reform Commission, official plans and policy documents issued by the Urban Rail Transit Association, and other official transportation-related statistical data.
Basic transportation data setWidely recognized public data sets in the transportation field, such as METR-LA, PEMS-BAY, etc., as well as basic transportation data sets released by governments or official agencies.
Real-time traffic monitoring technologyIt covers real-time monitoring systems such as traffic signal automatic control systems, monitoring systems, and police response systems, which are used to monitor traffic conditions in real time.
Traffic detection technologyIncluding toroidal coils, microwave detectors, infrared detectors, coil detectors, geomagnetic sensors and other equipment used to collect traffic flow, speed, and other data in real time.
Intelligent transportation system and vehicle technologyIntelligent transportation system platform and data center, including intelligent transportation system information platform, traffic management center, SQL Server and other databases, used for data exchange, storage, processing and release; on-board technology and identification, on-board unit, Global Positioning System, Automatic license plate recognition systems (high-definition cameras and RFID technology), etc., support information exchange, location tracking, and vehicle identification between vehicles.
Urban traffic management and survey dataTraffic police data is data generated through the detection and operation of equipment such as video bayonet, microwave, coil, and signal machines; urban traffic survey data is traffic volume data in different time periods and road sections obtained through urban traffic surveys.
Area-specific transportation dataIncluding water transportation data (such as vessel traffic management system data, water monitoring data, ship database, etc.), air transportation data, rail transportation data and other traffic information in specific fields.
Simulation and simulated dataTraffic scenarios and data simulated using simulation software (such as Paramics, VISSIM, etc.) are used to evaluate, predict, and optimize the traffic system.
Urban infrastructure and road network dataIncluding urban expressway network data (road network topology, spatial geography, dynamic information, etc.), national road network data and other infrastructure-related transportation data.
Multi-source fusion of transportation dataTransportation data obtained through comprehensive analysis combined with mobile phone network signals, social media data, questionnaires and other multi-source data provide a more comprehensive insight into traffic conditions.
Table A5. A summary of the main application scenarios of urban transportation data based on relevant research in Chinese academic circles.
Application ScenarioSpecific Application ScenarioDescription
Urban transportation planning and construction managementUrban transportation network planning and designDesign the urban road network and optimize the layout of public transportation lines.
Transportation infrastructure layout optimizationEvaluate existing infrastructure and propose optimization plans to improve traffic efficiency.
Traffic flow forecastBuild traffic flow prediction models to provide decision support for planning and management.
Traffic simulationUse simulation technology to simulate traffic flow in different scenarios and evaluate the effectiveness of management strategies.
Traffic congestion relief strategyAnalyze the causes of congestion and formulate and implement traffic management strategies to alleviate congestion.
Pavement maintenance and management Regularly check road conditions and promptly repair damaged road sections to ensure driving safety.
Transportation policy and regulation developmentTraffic law enactment Develop and improve traffic regulations based on transportation data and analysis results.
Transport demand management policy Reasonably guide traffic demand through measures such as toll collection and traffic restrictions.
Sustainable transport policyDevelop transportation policies that encourage low-carbon, environmentally friendly transportation and promote the sustainable development of the transportation system.
Academic research in the field of transportation Traffic flow theory researchBased on empirical data, explore the underlying mechanisms of traffic flow formation and evolution.
Traffic pattern recognitionUse methods such as machine learning to automatically identify different traffic modes and their characteristics.
Transportation system simulation modelingEstablish high-precision transportation system simulation models for academic research and teaching.
Transportation industry trend analysisMarket trend forecastAnalyze changing trends such as market size and competition landscape in the transportation industry.
Technology Development ForecastPay attention to the application and development trends of new technologies and new materials in the transportation field.
Industry chain analysisSort out each link of the transportation industry chain and analyze upstream and downstream relationships and market opportunities.
Intelligent transportation system construction and operationIntelligent monitoring system deploymentDeploy intelligent monitoring equipment on key urban road sections to monitor traffic conditions in real time.
Traffic signal optimization controlUtilize intelligent transportation systems to optimize traffic signal timing and improve road traffic capacity.
Multi-source data fusion applicationIntegrate transportation data from different sources to provide comprehensive traffic information services.
Urban traffic operation managementReal-time traffic monitoringReal-time monitoring of urban traffic conditions around the clock.
emergency responseRespond quickly and take measures in response to emergencies such as traffic accidents and severe weather.
Rail transit operations managementCarry out daily operation management and maintenance of rail transit systems such as subways and light rails.
Transportation data management and quality improvementData collection and processingEstablish an efficient data collection system to ensure the accuracy and completeness of data.
Data quality controlDevelop data quality control tools to automatically detect and correct abnormal data.
Data security and privacy protectionStrengthen transportation data security management and protect personal privacy and corporate trade secrets.
Traffic safety monitoring and information serviceVehicle safety monitoringConduct real-time monitoring of key vehicles to prevent traffic accidents.
Travel information serviceProvides travel information services such as real-time traffic conditions, bus routes, parking lot locations, etc.
Accident warning and responseEstablish an accident early warning system to improve accident prevention and emergency response capabilities.
Carbon emission reduction and environmental protectionTransportation carbon footprint analysisAssessing the carbon emissions and sources of urban transportation systems.
Promotion of low-carbon transportation technologyPromote the use of low-carbon vehicles such as electric vehicles and hydrogen vehicles.
Emissions control and air quality monitoringImplement strict emission control measures to monitor and improve air quality.
Ecological transportation planningIntegrate ecological protection concepts into transportation planning to reduce the impact on the environment.
Transportation special technology and applicationTraffic engineering designIncluding the design and construction of bridges, tunnels, and other transportation facilities.
Motor vehicle emission testing and analysisDetect and analyze motor vehicle emissions and formulate emission reduction measures.
Air traffic managementOptimize flight scheduling and air traffic flow management to improve air transportation efficiency.
Table A6. Compilation of main users of urban transportation data based on relevant research in Chinese academic circles.
Data UserDescription
Intelligent transportation system developerDirectly utilizing transportation data for the design and optimization of intelligent transportation systems, including the development of core applications, has the highest degree of reliance and use of data.
Information system and intelligent transportation system developer and maintainerResponsible for the integration, system development, and optimization of transportation data, ensuring effective data utilization and normal system operation. In addition, possesses deep expertise in data processing and utilization.
Data analystFocus on in-depth mining and analysis of transportation data, extract valuable information, and provide key data support for traffic management and planning.
Transportation engineer and researcherUsing transportation data to build traffic models, analyze traffic conditions, and formulate and optimize traffic control strategies relies heavily on data.
Traffic management department and personnelApplying transportation data for daily traffic monitoring and rapid response in emergencies requires high real-time performance of the data.
Urban planner and managerTransportation data are widely used in urban traffic planning, infrastructure construction layout, and urban event management.
Maritime administration and navigation managerUtilizing transportation data for real-time monitoring and management of ship traffic to ensure navigation safety requires high real-time and accuracy of data.
Nautical Institute researcher and ship traffic management expertIn-depth analysis of ship transportation data provides scientific basis for ship routing plan design and traffic management.
Industry AnalystAssess market trends in transportation data, provide data support for investment decisions, and rely heavily on macro analysis of data.
Academic researcherExploring the interrelationship between urban transportation, the economy, and the environment; although using data, it focuses more on theoretical analysis and model construction.
Government departments and transportation planning and management agencyUsing transportation data for long-term traffic planning and policy formulation relies on data more stably but may not be as high as real-time monitoring.
Transportation infrastructure maintenance and operations managerUtilize transportation data to assess the condition of roads and rail transit and develop maintenance plans, with moderate reliance on data.
PublicBy understanding and analyzing transportation data to make more reasonable travel choices, the use of transportation data is relatively indirect and superficial.
Table A7. Keyword co-occurrence network clustering table for urban transportation data research.
DatabaseCluster NumberCluster SizeCluster Average Silhouette ValueAverage YearIdentifier Word
CNKI02612012intersection (9.15, 0.005); transportation data collection (9.15, 0.005); traffic engineering (9.15, 0.005); ontology data mapping (4.52, 0.05); virtual coil (4.52, 0.05)
1250.9722018intelligent transportation (18.7, 1.0 × 10⁻⁴); data diagnosis (4.52, 0.05); alternating multiplier method (4.52, 0.05); fuzzy logic (4.52, 0.05); privacy protection (4.52, 0.05)
2250.8992014transportation data (15.15, 1.0 × 10⁻⁴); support vector machine (3.7, 0.1); fusion (3.7, 0.1); missing data (3.7, 0.1); random sampling (3.7, 0.1)
3210.9682012data preprocessing (10.99, 0.001); spatiotemporal correlation (5.41, 0.05); multivariate quality control (5.41, 0.05); data screening (5.41, 0.05); time series (5.41, 0.05)
4210.9032010data fusion (15.33, 1.0 × 10⁻⁴); wavelet transform (4.98, 0.05); evidence theory (4.98, 0.05); multi-scale (4.98, 0.05); least squares support vector machine (4.98, 0.05)
5200.9672011geographic information system (5.26, 0.05); data warehouse (5.26, 0.05); real time (5.26, 0.05); urban rail transit (5.26, 0.05); data center (5.26, 0.05)
6180.9332008intelligent transportation system (11.72, 0.001); floating car (5.76, 0.05); dynamic adaptive mechanism (5.76, 0.05); generative adversarial network (5.76, 0.05); transportation data repair (5.76, 0.05)
7170.982022deep learning (5.96, 0.05); graph neural network (5.96, 0.05); big data analysis (5.96, 0.05); traffic flow prediction (5.96, 0.05); multivariate time series prediction (5.96, 0.05)
8150.9252006failure data (12.14, 0.001); quality control (5.96, 0.05); identification and repair (5.96, 0.05); structural analysis (5.96, 0.05); intelligent transportation system (5.96, 0.05)
9100.9532017visual analytics (12.61, 0.001); urban traffic problems (6.19, 0.05); traffic incident analysis (6.19, 0.05); predictive visual analytics (6.19, 0.05); traffic flow analysis (6.19, 0.05)
1090.9472015data sets (7.06, 0.01); public transportation (7.06, 0.01); data requests (7.06, 0.01); open programs (7.06, 0.01); application programming interfaces (7.06, 0.01)
1170.9832011social welfare (7.97, 0.005); rail transit (7.97, 0.005); operator profit (7.97, 0.005); heading distance (7.97, 0.005); intelligent transportation (0.17, 1.0)
12512015traffic flow (7.06, 0.01); congestion status (7.06, 0.01); minimum safety distance (7.06, 0.01); traffic planning (7.06, 0.01); response time (7.06, 0.01)
13412020spatiotemporal juxtaposition fuzzy congestion pattern (7.46, 0.01); spatiotemporal characteristics (7.46, 0.01); spatial data mining (7.46, 0.01); information processing (7.46, 0.01); fuzzy participation (7.46, 0.01)
14412024ship transportation data (7.97, 0.005); evaluation indicator system (7.97, 0.005); real-time transmission (7.97, 0.005); reliability (7.97, 0.005); intelligent transportation (0.17, 1.0)
15412016traffic control (7.46, 0.01); multi-time period (7.46, 0.01); hybrid clustering (7.46, 0.01); temporality (7.46, 0.01); silhouette indicator (7.46, 0.01)
2140.9912017bridge engineering (7.46, 0.01); probabilistic algorithm (7.46, 0.01); multi-lane lateral reduction coefficient (7.46, 0.01); reliability theory (7.46, 0.01); measured transportation data (7.46, 0.01)
WOS01490.7472010air pollution; road traffic; monitoring network design; health studies; pm2.5 | ultrafine particles; black carbon; urban transport; roadside pedestrian; street canyon
11090.6962015autonomous vehicles; real-time systems; connected vehicles; mathematical model; vehicle dynamics | intelligent transportation systems; traffic prediction; data science; advanced traffic management systems; traveler information systems
21000.7152014deep learning; autonomous driving; smart cities; intelligent transportation system; traffic flow prediction | traffic safety; of-day control; double-order optimization; autonomous vehicles; human behavior modeling
3480.8632007prediction; fields; wake; velocity; merging speed | traffic census; particulate matter; real-world traffic emissions; evaluation strategy; emission calculation model
4460.8652012transit-oriented development; rail transit; residential location; shopping trips; pm2.5 | energy consumption; geographic information systems; global positioning systems; driving behavior; travel patterns
5360.8942005air pollution; movement restrictions; particle number concentration; time series analysis; covid pandemic | impact; ship emissions; pollution; harbor; area
6340.8862011model; flow; experimental features; jams; clusters | road ecology; conservation genetics; habitat fragmentation; anthropogenic barriers; genetta genetta
7200.9871997pollutant dispersion; moving traffic; vehicle-induced turbulence; reynolds-averaged navier-stokes; urban ventilation | heavy metals; factor analysis; soil contamination; dtpa extraction; large-eddy simulation
8190.9811999traffic intensity; video detector; loop detector; visual method; tube detector | real-time monitoring; photoelectric aerosol sensor; urban atmospheres; motor vehicle traffic; traffic intensity
9612004ambient voc; receptor models; positive matrix factorization (pmf); unmix; voc source apportionment
1060.9911994traffic modeling; microscopic traffic simulation; distributed memory multiprocessor; vector computer; transputer; workstation cluster; performance measurements
11512003urban air pollution; atmospheric particles; carbon monoxide; atomic force microscopy; pixe
12412000capacitive mat; ms-wim system; multiple sensor array; portable wim system; weigh-in-motion (wim); weight; wim sensors; wim trials
1340.9942006forest floor vegetation; nitrophytes; nitrogen; base-saturation; road salt
1440.9981998air quality model; complex terrain; diffusion; numerical model; tunnel portal
15412002emission inventory; fugitive emissions; nitrogen dioxide emissions; pm10 emissions; sulfur dioxide emissions; tsp
16312006annual traffic census; auto-regressive integrated moving average; gaussian maximum likelihood; neural network; non-parametric regression
Note: The CNKI database literature uses the LLR clustering algorithm, and the WOS database literature uses the LSI clustering algorithm.
Figure A1. Co-occurrence map of authors in urban transportation data research.
Sustainability 16 09615 g0a1aSustainability 16 09615 g0a1b
Figure A2. Co-occurrence map of urban transportation data research institutions.
Sustainability 16 09615 g0a2aSustainability 16 09615 g0a2b
Figure A3. Co-occurrence map of countries (including regions) in WOS database.
Sustainability 16 09615 g0a3
Figure A4. Country (including region) time zone map in WOS database (LSI).
Sustainability 16 09615 g0a4
Figure A5. Urban transportation data research keyword clustering knowledge graph. Note: The dot represents the keyword, with its size indicating the frequency of the keyword’s appearance; The line represents the co-occurrence relationship between keywords, with the thickness of the line indicating the strength of their co-occurrence; Nodes and line colors represent different time slices; The block color signifies the distinction between different clusters.
Sustainability 16 09615 g0a5
Figure A6. Keyword time zone map of urban transportation data research.
Sustainability 16 09615 g0a6
Figure A7. Emergent node vocabulary diagram of urban transportation data research. Note: The change in color from blue to red represents the evolution of time from early to recent, used to identify the emergence of a keyword in different time periods.
Sustainability 16 09615 g0a7aSustainability 16 09615 g0a7b

References

  1. SOHU. 2023 Transportation Public Data Open Utilization Report. Available online: https://www.sohu.com/a/679031117_121394207 (accessed on 20 October 2024).
  2. ChinaIRN com. Analysis Report on the Current Status and Future Development Trends of the Smart Transportation Industry from 2024 to 2029. Available online: https://www.chinairn.com/news/20241009/153019447.shtml (accessed on 20 October 2024).
  3. National Development and Reform Commission. Implementation Plan for Promoting ‘Internet +’ Convenient Transportation to Advance the Development of Intelligent Transportation. Available online: https://www.ndrc.gov.cn/fzggw/jgsj/zcs/sjdt/201608/t20160805_1145508.html (accessed on 30 July 2024).
  4. Ministry of Transport of the People’s Republic of China. Action Outline for Promoting the Development of Big Data in Comprehensive Transportation (2020–2025). Available online: https://www.mot.gov.cn/zhengcejiedu/ytddxsqtdzhjtysdsjfz/xiangguanzhengce/201912/t20191213_3430331.html (accessed on 16 August 2024).
  5. Macioszek, E.; Grana, A.; Fernandes, P.; Coelho, M.C. New Perspectives and Challenges in Traffic and Transportation Engineering Supporting Energy Saving in Smart Cities—A Multidisciplinary Approach to a Global Problem. Energies 2022, 15, 4191. [Google Scholar] [CrossRef]
  6. Chen, X. Practice of Intelligent Transportation Data Management Guided by New Quality Productivity. Lib. Inf. 2024, 44, 6–8. [Google Scholar]
  7. Fu, Q.; Ba, B.; Huang, C.; Jiang, Y. Dynamic Spatiotemporal Graph Convolutional Networks for Short-term Traffic Flow Prediction. J. Hunan Univ. Sci. Technol. (Nat. Sci. Ed.) 2024, 39, 70–79. [Google Scholar]
  8. Li, S.; Yang, L.; Zhao, X. Prediction Algorithm of Short-term Traffic Congestion in Urban Area based on Deep Learning. Sci. Technol. Eng. 2023, 23, 10866–10878. [Google Scholar]
  9. Zhi, Y.; Zhao, J.; Li, X.; Han, G.; Kong, W.; Pan, C. Traffic Flow Prediction based on Deep Learning Combined Mode. J. Guangxi Univ. (Nat. Sci. Ed.) 2023, 23, 10866–10878. [Google Scholar]
  10. Yang, J.; Yu, C.; Li, R.; Du, L.; Jiang, S.; Wang, D. Traffic Network Speed Prediction via Multi-periodic-component Spatial-temporal Neural Network. J. Transp. Syst. Eng. Inf. Technol. 2021, 21, 112–119+139. [Google Scholar]
  11. Bai, R. Research on the Construction of Rail Transit Data Security Based on Legal Supervision. Urban Mass Trans. 2023, 26, 276–277. [Google Scholar]
  12. Li, J.; Guo, W.; Li, X.; Liu, X. Privacy-preserving Real-time Road Conditions Monitoring Scheme based on Intelligent Traffic. J. Commun. 2020, 41, 73–83. [Google Scholar]
  13. Patel, A.S.; Tiwari, V.; Ojha, M.; Vyas, O.P. Ontology-based Detection and Identification of Complex Event of Illegal Parking Using SPARQL and Description Logic Queries. Chaos Solitons Fractals 2023, 174, 113774. [Google Scholar] [CrossRef]
  14. Sun, Y.; Mallick, T.; Balaprakash, P.; Macfarlane, J. A Data-centric Weak Supervised Learning for Highway Traffic Incident Detection. Accid. Anal. Prev. 2022, 176, 106779. [Google Scholar] [CrossRef]
  15. Chen, E.; Ye, Z.; Wang, C.; Xu, M. Subway Passenger Flow Prediction for Special Events Using Smart Card Data. IEEE Trans. Intell. Transp. Syst. 2019, 21, 1109–1120. [Google Scholar] [CrossRef]
  16. Abdel-Aty, M.; Wang, Z.; Zheng, O.; Abdelraouf, A. Advances and Applications of Computer Vision Techniques in Vehicle Trajectory Generation and Surrogate Traffic Safety Indicators. Accid. Anal. Prev. 2023, 191, 107191. [Google Scholar] [CrossRef] [PubMed]
  17. Ke, R.; Cui, Z.; Chen, Y.; Zhu, M.; Yang, H.; Zhuang, Y.; Wang, Y. Lightweight Edge Intelligence Empowered Near-crash Detection Towards Real-time Vehicle Event Logging. IEEE Trans. Intell. Veh. 2023, 8, 2737–2747. [Google Scholar] [CrossRef]
  18. Shi, L.; Qian, C.; Guo, F. Real-time Driving Risk Assessment Using Deep Learning with XGBoost. Accid. Anal. Prev. 2022, 178, 106836. [Google Scholar] [CrossRef]
  19. Wu, Y.; Chen, H. Optimizing Block Morphology for Reducing Traffic Pollutant Concentration in Adjacent External Spaces of Street Canyons: A Machine Learning Approach. Build. Environ. 2023, 242, 110587. [Google Scholar] [CrossRef]
  20. Kim, N.G.; Bin Jeong, S.; Jin, H.C.; Lee, J.; Kim, K.H.; Kim, S.; Park, Y.; Choi, W.; Kwak, K.H.; Lee, H.; et al. Spatial and PMF Analysis of Particle Size Distributions Simultaneously Measured at Four Locations at the Roadside of Highways. Sci. Total Environ. 2023, 893, 164892. [Google Scholar] [CrossRef]
  21. Fernandes, P.; Tomás, R.; Acuto, F.; Pascale, A.; Bahmankhah, B.; Guarnaccia, C.; Granà, A.; Coelho, M.C. Impacts of Roundabouts in Suburban Areas on Congestion-specific Vehicle Speed Profiles, Pollutant and Noise Emissions: An Empirical Analysis. Sustain. Cities Soc. 2020, 62, 102386. [Google Scholar] [CrossRef]
  22. Park, H.; Kim, M.; Lee, S. Spatial Characteristics of Wildlife-vehicle Collisions of Water Deer in Korea Expressway. Sustainability 2021, 13, 13523. [Google Scholar] [CrossRef]
  23. Novak, H.; Bronić, F.; Kolak, A.; Lešić, V. Data-driven Modeling of Urban Traffic Travel Times for Short-and Long-term Forecasting. IEEE Trans. Intell. Transp. Syst. 2023, 24, 11198–11209. [Google Scholar] [CrossRef]
  24. Islam, Z.; Abdel-Aty, M. Traffic Conflict Prediction Using Connected Vehicle Data. Anal. Meth. Accid. Res. 2023, 39, 100275. [Google Scholar] [CrossRef]
  25. van den Ende, M.; Ferrari, A.; Sladen, A.; Richard, C. Deep Deconvolution for Traffic Analysis with Distributed Acoustic Sensing Data. IEEE Trans. Intell. Transp. Syst. 2022, 24, 2947–2962. [Google Scholar] [CrossRef]
  26. Chai, H.; Zhang, Z.; Hu, H.; Dai, L.; Bian, Z. Trajectory-based Conflict Investigations Involving Two-wheelers and Cars at Non-signalized Intersections with Computer Vision. Expert Syst. Appl. 2023, 230, 120590. [Google Scholar] [CrossRef]
  27. Xin, X.; Yang, Z.; Liu, K.; Zhang, J.; Wu, X. Multi-stage and Multi-topology Analysis of Ship Traffic Complexity for Probabilistic Collision Detection. Expert Syst. Appl. 2023, 213, 118890. [Google Scholar] [CrossRef]
  28. Moallemi, A.; Burrello, A.; Brunelli, D.; Benini, L. Exploring Scalable, Distributed Real-time Anomaly Detection for Bridge Health Monitoring. IEEE Internet Things J. 2022, 9, 17660–17674. [Google Scholar] [CrossRef]
  29. Shekhar, S.; Ghosh, J. A Metamodeling based Seismic Life-cycle Cost Assessment Framework for Highway Bridge Structures. Reliab. Eng. Syst. Saf. 2020, 195, 106724. [Google Scholar] [CrossRef]
  30. Shokravi, H.; Vafaei, M.; Samali, B.; Bakhary, N. In-fleet Structural Health Monitoring of Roadway Bridges Using Connected and Autonomous Vehicles’ Data. Comput. Civ. Infrastruct. Eng. 2024, 39, 2122–2139. [Google Scholar] [CrossRef]
  31. Yu, R.; Han, L.; Zhang, H. Trajectory Data based Freeway High-risk Events Prediction and its Influencing Factors Analyses. Accid. Anal. Prev. 2021, 154, 106085. [Google Scholar] [CrossRef]
  32. Katrakazas, C.; Theofilatos, A.; Islam, M.A.; Papadimitriou, E.; Dimitriou, L.; Antoniou, C. Prediction of Rear-end Conflict Frequency Using Multiple-location Traffic Parameters. Accid. Anal. Prev. 2021, 152, 106007. [Google Scholar] [CrossRef] [PubMed]
  33. Wang, X.; Liu, Q.; Guo, F.; Xu, X.; Chen, X. Causation Analysis of Crashes and Near Crashes Using Naturalistic Driving Data. Accid. Anal. Prev. 2022, 177, 106821. [Google Scholar] [CrossRef]
  34. Jiang, S.; Jafari, M.; Kharbeche, M.; Jalayer, M.; Al-Khalifa, K.N. Safe Route Mapping of Roadways Using Multiple Sourced Data. IEEE Trans. Intell. Transp. Syst. 2020, 23, 3169–3179. [Google Scholar] [CrossRef]
  35. Wu, K.; Wang, L. Exploring the Combined Effects of Driving Situations on Freeway Rear-end Crash Risk Using Naturalistic Driving Study Data. Accid. Anal. Prev. 2021, 150, 105866. [Google Scholar] [CrossRef] [PubMed]
  36. Paul, M.; Ghosh, I.; Haque, M.M. The Effects of Green Signal Countdown Timer and Retiming of Signal Intervals on Dilemma Zone Related Crash Risk at Signalized Intersections under Heterogeneous Traffic Conditions. Saf. Sci. 2022, 154, 105862. [Google Scholar] [CrossRef]
  37. Nasernejad, P.; Sayed, T.; Alsaleh, R. Modeling Pedestrian Behavior in Pedestrian-vehicle near Misses: A Continuous Gaussian Process Inverse Reinforcement Learning (GP-IRL) Approach. Accid. Anal. Prev. 2021, 161, 106355. [Google Scholar] [CrossRef] [PubMed]
  38. Liu, Q.; Li, F.; Ng, K.K.H. Unveiling the Determinants of Injury Severities across Age Groups and Time: A Deep Dive into the Unobserved Heterogeneity among Pedestrian Crashes. Anal. Methods Accid. Res. 2024, 43, 100336. [Google Scholar] [CrossRef]
  39. Xue, J.; Jiao, X.; Yu, D.; Zhang, Y. Predictive Hierarchical Eco-driving Control Involving Speed Planning and Energy Management for Connected Plug-in Hybrid Electric Vehicles. Energy 2023, 283, 129058. [Google Scholar] [CrossRef]
  40. Houshmand, A.; Cassandras, C.G.; Zhou, N.; Hashemi, N.; Li, B.; Peng, H. Combined Eco-routing and Power-train Control of Plug-in Hybrid Electric Vehicles in Transportation Networks. IEEE Trans. Intell. Transp. Syst. 2021, 23, 11287–11300. [Google Scholar] [CrossRef]
  41. Li, J.; Yu, C.; Shen, Z.; Su, Z.; Ma, W. A Survey on Urban Traffic Control under Mixed Traffic Environment with Connected Automated Vehicles. Transp. Res. Part C Emerg. Technol. 2023, 154, 104258. [Google Scholar] [CrossRef]
  42. Amini, M.R.; Hu, Q.; Wiese, A.; Kolmanovsky, I.; Seeds, J.B.; Sun, J. A Data-driven Spatio-temporal Speed Prediction Framework for Energy Management of Connected Vehicles. IEEE Trans. Intell. Transp. Syst. 2022, 24, 291–303. [Google Scholar] [CrossRef]
  43. Huang, M.; Jiang, Z.P.; Ozbay, K. Learning-based Adaptive Optimal Control for Connected Vehicles in Mixed Traffic: Robustness to Driver Reaction Time. IEEE Trans. Cybern. 2020, 52, 5267–5277. [Google Scholar] [CrossRef]
  44. Komnos, D.; Tsiakmakis, S.; Pavlovic, J.; Ntziachristos, L.; Fontaras, G. Analysing the Real-world Fuel and Energy Consumption of Conventional and Electric Cars in Europe. Energy Convers. Manag. 2022, 270, 116161. [Google Scholar] [CrossRef]
  45. Huber, D.; Viere, T.; Nemoto, E.H.; Jaroudi, I.; Korbee, D.; Fournier, G. Climate and Environmental Impacts of Automated Minibuses in Future Public Transportation. Transp. Res. Part D Transp. Environ. 2022, 102, 103160. [Google Scholar] [CrossRef]
  46. Yang, D.; Gu, J.; Zhang, S.; Zhang, M.; Wu, Y. High-resolution Mapping of Regional Traffic Emissions Using Land-use Machine Learning Models. Atmos. Chem. Phys. 2022, 22, 1939–1950. [Google Scholar]
  47. Wang, X.; Yang, Z.; Xu, X.; Wang, X.; Li, Y. Expressway Carbon Emission Estimation based on Multi-source Traffic Data. J. Highway Transp. Res. Dev. 2023, 40, 466–475. [Google Scholar]
  48. Zhang, L.; Bi, S.; Liu, S.; Wang, L.; Yuan, C. Accessibility and Supply-demand Relationship for Elderly Care Institutions Based on Transportation Data: A Case Study of Beijing. Geogr. Geogr. Inf. Sci. 2023, 39, 81–88. [Google Scholar]
  49. Xu, H.; Qiao, Q.; Li, Y.; Chen, G.; Liu, J.; Gan, L. Analysis on Spatio-temporal Accessibility of Medical Services Supported by Real-time Traffic Data. Bull. Surv. Mapp. 2023, 0, 113–119. [Google Scholar] [CrossRef]
  50. Cao, J.; Xu, Y.; Sun, L.; Zhao, S.; Wang, Y. Passenger Flow Characteristics and Analysis of Urban Functional Structure based on Rail Transit Data. Urban Rapid Rail Transit 2021, 34, 71–78. [Google Scholar]
  51. Zhu, J.; Wu, S.; Guo, Y.; Zhang, Y.; Chen, Y.; Huang, H.; Li, W. Lightweight Web Visualization of Massive Road Traffic Data. J. Southwest Jiaotong Univ. 2021, 56, 905–912. [Google Scholar]
  52. Cao, H.; Cheng, H.; Liu, Y.; Chen, F.; Zhan, X. Visualization and Case Study of Urban Rail Data Based on Cloud Computing. Comput. Appl. Soft 2021, 38, 33–36+49. [Google Scholar]
  53. Zhan, Z.; Guo, Y.; Noland, R.B.; He, S.Y.; Wang, Y. Analysis of Links between Dockless Bikeshare and Metro Trips in Beijing. Transp. Res. Part A Policy Pract. 2023, 175, 103784. [Google Scholar] [CrossRef]
  54. Zhan, Q.; Fan, Y.; Zhang, H.; Xiao, K. Supporting Epidemic Control with Regional Population Flow Data and Nova Transportation Data. Geom. Inf. Sci. Wuhan Univ. 2021, 46, 143–149+202. [Google Scholar]
  55. Yao, J.; Sun, D. Ship Traffic Data Mining Technology based on Wireless Network. Ship Sci. Technol. 2021, 43, 55–57. [Google Scholar]
  56. Wang, D.; Cai, Z.; Zeng, J.; Zhang, G.; Guo, J. Review of Traffic Data Collection Research on Urban Traffic Control. J. Transp. Syst. Eng. Inf. Technol. 2020, 20, 95–102. [Google Scholar] [CrossRef]
  57. Ištoka Otković, I.; Deluka-Tibljaš, A.; Šurdonja, S.; Campisi, T. Development of Models for Children-pedestrian Crossing Speed at Signalized Crosswalks. Sustainability 2021, 13, 777. [Google Scholar] [CrossRef]
  58. Sasaki, Y.; Fujiwara, K.; Mitobe, K. Risks that Induce Bicycle Accidents: Measurement and Analysis of Bicyclist Behavior while Going Straight and Turning Right Using a Bicycle Simulator. Accid. Anal. Prev. 2024, 194, 107338. [Google Scholar] [CrossRef]
  59. Nelson, T.; Ferster, C.; Laberee, K.; Fuller, D.; Winters, M. Crowdsourced Data for Bicycling Research and Practice. Transp. Rev. 2021, 41, 97–114. [Google Scholar] [CrossRef]
  60. Hu, S.; Tong, W.; Jia, Z.; Zou, J. Study on the Spatial and Temporal Distribution and Traffic Flow Parameters of Non-motorized Vehicles on Highway Segments Crossing Small Towns. Sustainability 2023, 15, 1261. [Google Scholar] [CrossRef]
  61. Bharadwaj, N.; Edara, P.; Sun, C. Sleep Disorders and Risk of Traffic Crashes: A Naturalistic Driving Study Analysis. Saf. Sci. 2021, 140, 105295. [Google Scholar] [CrossRef]
  62. Zhao, Y.; Miyahara, T.; Mizuno, K.; Ito, D.; Han, Y. Analysis of Car Driver Responses to Avoid Car-to-cyclist Perpendicular Collisions based on Drive Recorder Data and Driving Simulator Experiments. Accid. Anal. Prev. 2021, 150, 105862. [Google Scholar] [CrossRef]
  63. Wu, X.; Xu, D.; Wu, X.; Jin, J. A Predictive Visual Analytics Method for Taxi Routines. J. Comput.-Aided Des. Comput. Graph. 2020, 32, 520–530. [Google Scholar]
  64. Rong, S.; Zhong, W.; Huang, X.; Kang, J.; Xie, S.; Yuen, C. Joint Path Selection, Energy Trading and Task Offloading in Electric Vehicle Charging and Computing Network. IEEE Internet Things J. 2024, 11, 17067–17081. [Google Scholar] [CrossRef]
  65. Guo, Z.; Wang, Y. Anticipatory Planning for Equitable and Productive Curbside Electric Vehicle Charging Stations. Sustain. Cities Soc. 2023, 99, 104962. [Google Scholar] [CrossRef]
  66. Liang, Y.; Ding, Z.; Ding, T.; Lee, W.J. Mobility-aware Charging Scheduling for Shared on-demand Electric Vehicle Fleet Using Deep Reinforcement Learning. IEEE Trans. Smart Grid 2020, 12, 1380–1393. [Google Scholar] [CrossRef]
  67. Isukapati, I.K.; Igoe, C.; Bronstein, E.; Parimi, V.; Smith, S.F. Hierarchical Bayesian Framework for Bus Dwell Time Prediction. IEEE Trans. Intell. Transp. Syst. 2020, 22, 3068–3077. [Google Scholar] [CrossRef]
  68. Sanaullah, I.; Alsaleh, N.; Djavadian, S.; Farooq, B. Spatio-temporal Analysis of on-demand Transit: A Case Study of Belleville, Canada. Transp. Res. Part A Policy Pract. 2021, 145, 284–301. [Google Scholar] [CrossRef]
  69. Min, R.; Chen, Y.; Wang, H.; Chen, Y. DAS Vehicle Signal Extraction Using Machine Learning in Urban Traffic Monitoring. IEEE Trans. Geosci. Remote Sens. 2024, 62, 5908510. [Google Scholar] [CrossRef]
  70. Wan, L.; Ma, W.; Lo, H.K.; Yu, C. Signal Optimization at an Isolated Intersection under Cyclic Vehicle Arrivals Using Spatially Sparse Trajectory Data. Transp. Res. Part C Emerg. Technol. 2024, 163, 104643. [Google Scholar] [CrossRef]
  71. Sobrie, L.; Verschelde, M. Real-time Decision Support for Human–machine Interaction in Digital Railway Control Rooms. Decis. Support Syst. 2024, 181, 114216. [Google Scholar] [CrossRef]
  72. Yang, W.; He, J.; He, C.; Cai, M. Evaluation of Urban Traffic Noise Pollution based on Noise Maps. Transp. Res. Part D Transp. Environ. 2020, 87, 102516. [Google Scholar] [CrossRef]
  73. Yang, J.; Shi, L.; Lee, J.; Ryu, I. Spatiotemporal Prediction of Particulate Matter Concentration based on Traffic and Meteorological Data. Transp. Res. Part D 2024, 127, 104070. [Google Scholar] [CrossRef]
  74. Zheng, X.; Yang, J. CFD Simulations of Wind Flow and Pollutant Dispersion in a Street Canyon with Traffic Flow: Comparison between RANS and LES. Sustain. Cities Soc. 2021, 75, 103307. [Google Scholar] [CrossRef]
  75. Hashad, K.; Gu, J.; Yang, B.; Rong, M.; Chen, E.; Ma, X.; Zhang, K.M. Designing Roadside Green Infrastructure to Mitigate Traffic-related Air Pollution Using Machine Learning. Sci. Total Environ. 2021, 773, 144760. [Google Scholar] [CrossRef] [PubMed]
  76. Feng, H.; Ning, E.; Yu, L.; Wang, X.; Vladimir, Z. The Spatial and Temporal Disaggregation Models of High-accuracy Vehicle Emission Inventory. Environ. Int. 2023, 181, 108287. [Google Scholar] [CrossRef] [PubMed]
  77. Perera, L.; Thompson, R.G.; Wu, W. A Multi-class Toll-based Approach to Reduce Total Emissions on Roads for Sustainable Urban Transportation. Sustain. Cities Soc. 2020, 63, 102435. [Google Scholar] [CrossRef]
  78. Hai, D.; Xu, J.; Duan, Z.; Chen, C. Effects of Underground Logistics System on Urban Freight Traffic: A Case Study in Shanghai, China. J. Clean. Prod. 2020, 260, 121019. [Google Scholar] [CrossRef]
  79. Hu, Z.; Chen, H.; Lyons, E.; Solak, S.; Zink, M. Towards Sustainable UAV Operations: Balancing Economic Optimization with Environmental and Social Considerations in Path Planning. Transp. Res. Part E Logist. Transp. Rev. 2024, 181, 103314. [Google Scholar] [CrossRef]
  80. Zeng, T.; Semiari, O.; Chen, M.; Saad, W.; Bennis, M. Federated Learning on the Road Autonomous Controller Design for Connected and Autonomous Vehicles. IEEE Trans. Wirel. Commun. 2022, 21, 10407–10423. [Google Scholar] [CrossRef]
  81. Wang, C.; Xie, Y.; Huang, H.; Liu, P. A Review of Surrogate Safety Measures and their Applications in Connected and Automated Vehicles Safety Modeling. Accid. Anal. Prev. 2021, 157, 106157. [Google Scholar] [CrossRef]
  82. Tang, W.; Yu, W.; Feng, C.; Mei, Z. Assessment of Future Parking Systems with Autonomous Vehicles through Agent-based Simulation: A Case Study of Hangzhou, China. Sustain. Cities Soc. 2024, 100, 105016. [Google Scholar] [CrossRef]
  83. Lu, Y.; Wang, W.; Bai, R.; Zhou, S.; Garg, L.; Bashir, A.K.; Jiang, W.; Hu, X. Hyper-relational Interaction Modeling in Multi-modal Trajectory Prediction for Intelligent Connected Vehicles in Smart Cites. Inf. Fusion 2025, 114, 102682. [Google Scholar] [CrossRef]
  84. Ali, A.; Ullah, I.; Shabaz, M.; Sharafian, A.; Khan, M.A.; Bai, X.; Qiu, L. A Resource-Aware Multi-Graph Neural Network for Urban Traffic Flow Prediction in Multi-Access Edge Computing Systems. IEEE Trans. Consum. Electron. 2024, 1–15. [Google Scholar] [CrossRef]
  85. Wang, H.; Xie, J.; Muslam, M.M.A. FAIR: Towards Impartial Resource Allocation for Intelligent Vehicles with Automotive Edge Computing. IEEE Trans. Intell. Veh. 2023, 8, 1971–1982. [Google Scholar] [CrossRef]
  86. Gao, A.; Liu, X.; Miao, Y. LSH-based Missing Value Prediction for Abnormal Traffic Sensors with Privacy Protection in Edge Computing. Complex Intell. Syst. 2023, 9, 5081–5091. [Google Scholar] [CrossRef]
  87. Cui, Y.; Lei, D. Optimizing Internet of Things-Based Intelligent Transportation System’s Information Acquisition Using Deep Learning. IEEE Access 2023, 11, 11804–11810. [Google Scholar] [CrossRef]
  88. Li, T.; Xiong, X.; Zheng, G.; Li, Y.; Tolba, A. A Blockchain-Based Shared Bus Service Scheduling and Management System. Sustainability 2023, 15, 12516. [Google Scholar] [CrossRef]
  89. Zhang, H.; Zhang, X.; Zhang, Y.; Wang, X.; Liu, Q. Blockchain-Based Proxy-Oriented Data Integrity Checking Mechanism in Cloud-Assisted Intelligent Transportation Systems. IEEE Trans. Intell. Transp. Syst. 2024, 1–16. [Google Scholar] [CrossRef]
  90. Zhang, J.; Fang, H.; Zhong, H.; Cui, J.; He, D. Blockchain-Assisted Privacy-Preserving Traffic Route Management Scheme for Fog-Based Vehicular Ad-Hoc Networks. IEEE Trans. Netw. Serv. Manag. 2023, 20, 2854–2868. [Google Scholar] [CrossRef]
  91. Liu, R.W.; Nie, J.; Garg, S.; Xiong, Z.; Zhang, Y.; Hossain, M.S. Data-Driven Trajectory Quality Improvement for Promoting Intelligent Vessel Traffic Services in 6G-Enabled Maritime IoT Systems. IEEE Internet Things J. 2021, 8, 5374–5385. [Google Scholar] [CrossRef]
  92. Hu, P.; Chu, X.; Zuo, K.; Ni, T.; Xie, D.; Shen, Z.; Chen, F.; Luo, Y. Security-Enhanced Data Sharing Scheme with Location Privacy Preservation for Internet of Vehicles. IEEE Trans. Veh. Technol. 2024, 73, 13751–13764. [Google Scholar] [CrossRef]
  93. Chen, Y.; Qiu, Y.; Tang, Z.; Long, S.; Zhao, L.; Tang, Z. Exploring the Synergy of Blockchain, IoT, and Edge Computing in Smart Traffic Management across Urban Landscapes. J. Grid Comput. 2024, 22, 45. [Google Scholar] [CrossRef]
  94. Xu, H.; Yuan, J.; Berres, A.; Shao, Y.; Wang, C.; Li, W.; LaClair, T.J.; Sanyal, J.; Wang, H. A Mobile Edge Computing Framework for Traffic Optimization at Urban Intersections Through Cyber-Physical Integration. IEEE Trans. Intell. Veh. 2024, 9, 1131–1145. [Google Scholar] [CrossRef]
  95. ZhongGuanCun Smarter City Information Industry Alliance. Typical Practice and Experience Enlightenment of “Urban Brain” Construction. Available online: https://mp.weixin.qq.com/s?__biz=MzAwNDUzMjYzMQ==&mid=2650163276&idx=1&sn=dbd3480a748d395d78241b712ffb2b68&chksm=826fa93b1db97ed253b92d05035a91305177a92826016112282f27613fe7996fb64857e736bf&scene=27 (accessed on 20 October 2024).
  96. SOHU. Why Is Singapore the World’s Leading Smart City. Available online: https://www.sohu.com/a/426028754_120529115 (accessed on 20 October 2024).
  97. SOHU. Review of Major Automotive Information Security Incidents in 2023. Available online: http://news.sohu.com/a/772589857_121738491 (accessed on 20 October 2024).
  98. The Central People’s Government of the People’s Republic of China. Guiding Opinions on Actively Promoting the “Internet +” Action. Available online: https://www.gov.cn/zhengce/content/2015-07/04/content_10002.htm (accessed on 4 July 2024).
  99. The Central People’s Government of the People’s Republic of China. Action Plan to Promote the Development of Big Data. Available online: https://www.gov.cn/gongbao/content/2015/content_2929345.htm (accessed on 31 August 2024).
  100. Ministry of Transport of the People’s Republic of China. Notice on Transportation Informatization “13th Five-Year” Development Plan. Available online: https://xxgk.mot.gov.cn/2020/jigou/zhghs/202006/t20200630_3319675.html (accessed on 19 July 2024).
  101. Ministry of Transport of the People’s Republic of China. Implementation Opinions on Promoting Open Sharing of Data Resources in the Transportation Industry. Available online: https://xxgk.mot.gov.cn/2020/jigou/kjs/202006/t20200623_3317029.html (accessed on 25 August 2024).
  102. The Central People’s Government of the People’s Republic of China. Notice on the “Thirteenth Five-Year” Development Plan of Modern Comprehensive Transportation System. Available online: https://www.gov.cn/gongbao/content/2017/content_5178189.htm (accessed on 3 August 2024).
  103. The Central People’s Government of the People’s Republic of China. Outline for Building a Powerful Transportation Country. Available online: https://www.gov.cn/gongbao/content/2019/content_5437132.htm (accessed on 19 August 2024).
  104. National Development and Reform Commission. Implementation Plan on Promoting the Action of “Moving to the Cloud and Empowering Intelligence with Data” to Cultivate New Economic Development. Available online: https://www.ndrc.gov.cn/xwdt/ztzl/szhzxhbxd/xdcy/202006/t20200605_1230419.html (accessed on 7 August 2024).
  105. Ministry of Transport of the People’s Republic of China. Guidance on Promoting the Construction of New Infrastructure in the Field of Transportation. Available online: https://xxgk.mot.gov.cn/2020/jigou/zhghs/202008/t20200806_3448021.html (accessed on 3 August 2024).
  106. The Central People’s Government of the People’s Republic of China. National Comprehensive Three-Dimensional Transportation Network Planning Outline. Available online: https://www.gov.cn/gongbao/content/2021/content_5593440.htm (accessed on 5 August 2024).
  107. Cyberspace Administration of China. Data Security Law of the People’s Republic of China. Available online: https://www.cac.gov.cn/2021-06/11/c_1624994566919140.htm (accessed on 10 July 2024).
  108. Ministry of Transport of the People’s Republic of China. Digital Transportation “14th Five-Year” Development Plan. Available online: https://xxgk.mot.gov.cn/2020/jigou/zhghs/202112/t20211222_3632469.html (accessed on 22 August 2024).
  109. The Central People’s Government of the People’s Republic of China. Overall Plan for Comprehensive Reform Pilot of Factor Market-Oriented Allocation. Available online: https://www.gov.cn/gongbao/content/2022/content_5669421.htm (accessed on 6 August 2024).
  110. The Central People’s Government of the People’s Republic of China. “14th Five-Year” Modern Comprehensive Transportation System Development Plan. Available online: https://www.gov.cn/gongbao/content/2022/content_5672664.htm (accessed on 18 July 2024).
  111. The Central People’s Government of the People’s Republic of China. Overall Layout Plan for Digital China Construction. Available online: https://www.gov.cn/xinwen/2023-02/27/content_5743484.htm (accessed on 27 July 2024).
  112. Ministry of Transport of the People’s Republic of China. Five-Year Action Plan to Accelerate the Construction of a Strong Transportation Country (2023-2027). Available online: https://www.mot.gov.cn/jiaotongyaowen/202303/t20230331_3784979.html (accessed on 29 July 2024).
  113. The Central People’s Government of the People’s Republic of China. Implementation Opinions on Promoting IPv6 Technology Evolution and Application Innovation Development. Available online: https://www.gov.cn/zhengce/zhengceku/2023-04/23/content_5752858.htm (accessed on 20 July 2024).
  114. Ministry of Transport of the People’s Republic of China. Opinions on Promoting the Digital Transformation of Highways and Accelerating the Construction and Development of Smart Highways. Available online: https://xxgk.mot.gov.cn/2020/jigou/glj/202309/t20230920_3922478.html (accessed on 20 July 2024).
  115. The Central People’s Government of the People’s Republic of China. Several Opinions on Promoting the Healthy and Sustainable Development of Urban Public Transportation. Available online: https://www.gov.cn/zhengce/zhengceku/202310/content_6907977.htm (accessed on 8 August 2024).
  116. The Central People’s Government of the People’s Republic of China. Opinions on Accelerating the Construction of Smart Ports and Smart Waterways. Available online: https://www.gov.cn/zhengce/zhengceku/202312/content_6918874.htm (accessed on 24 July 2024).
  117. Cyberspace Administration of China. “Data Elements ×” Three-Year Action Plan (2024–2026). Available online: https://www.cac.gov.cn/2024-01/05/c_1706119078060945.htm (accessed on 31 July 2024).
  118. The Central People’s Government of the People’s Republic of China. Notice on Supporting and Guiding the Digital Transformation and Upgrading of Highway and Waterway Transportation Infrastructure. Available online: https://www.gov.cn/zhengce/zhengceku/202405/content_6948771.htm (accessed on 1 August 2024).
  119. Zhang, H.; Liu, H.X.; Chen, P.; Yu, G.; Wang, Y. Cycle-based end of Queue Estimation at Signalized Intersections Using Low-penetration-rate Vehicle Trajectories. IEEE Trans. Intell. Transp. Syst. 2019, 21, 3257–3272. [Google Scholar] [CrossRef]
  120. Xu, Y.; Lao, S.; Hu, A.; Jiang, J. An Inter-operable System for the Integration of Real-time Traffic Data within GIS. Comput. Eng. Appl. 2002, 236–238. [Google Scholar]
  121. Zhang, H.; Zhang, Y.; Hu, D. Study on the Architecture and Methods for Large Amount of Data Management. Comput. Eng. Appl. 2004, 26–29+131. [Google Scholar]
  122. Xu, C.; Ouyang, W.; Gou, H.; Wu, S. Design and Implementation of Data Analysis System for Intelligent Transportation. Comput. Eng. Appl. 2005, 207–210. [Google Scholar]
  123. Wang, W.; Wang, B. Research Method of Data Management for its Commom Information Platform. Comput. Eng. Des. 2005, 26, 2698–2701+2712. [Google Scholar]
  124. Miao, L.; Yan, L. Design Method and Implementation of ITS Traffic Data Management. J. Highway Transp. Res. Dev. 2006, 117–120. [Google Scholar] [CrossRef]
  125. Zhang, H.; Zhang, Y.; Yao, D.; Hu, D. Study on Methods for Traffic Data Management under Network Environment. J. Highw. Transp. Res. Dev. 2006, 96–100+104. [Google Scholar]
  126. Li, J.; Luo, X.; Yao, C. Research on Traffic Status Determination Based on Multi Source Data. Rail. Transp. Econ. 2009, 31, 77–80. [Google Scholar]
  127. Guo, P.; Chen, C.; Ren, H. Application of Data Warehouse in the Integration of Rail Transit Data Resources. Urban Mass Trans. 2010, 13, 48–52. [Google Scholar]
  128. Jiang, G.; Li, Q.; Dong, S. Travel Time Estimation Method Using SCATS Traffic Data Based on k-NN Algorithm. J. Southwest Jiaotong Univ. 2013, 48, 343–349. [Google Scholar]
  129. Li, W.; Wang, J. Ontology-based Transportation Data Integration and Application for Urban Fast Road Networks. J. Chang’an Univ. (Nat. Sci. Ed.) 2013, 33, 93–100. [Google Scholar]
  130. Wu, Z.; Yu, C.; Sun, L. Method of Prediction on Driving Track of Specific Vehicles in Potential Group. Appl. Res. Comput. 2014, 31, 1951–1955. [Google Scholar]
  131. Dong, Z.; Yu, X.; Cui, X. GrandLand Traffic Data Processing Platform. J. Comput. Res. Dev. 2014, 51, 129–133. [Google Scholar]
  132. Wang, Z.; Yuan, X. Visual Analysis of Trajectory Data. J. Comput.-Aided Des. Comput. Graph. 2015, 27, 9–25. [Google Scholar]
  133. Liu, X.; Luo, X.; Yang, H. Querying Research on Efficient Traffic Data Cloud-Indexing Technology Based on HBase. Control Eng. China 2016, 23, 560–564. [Google Scholar]
  134. Fang, J.; Li, D.; Guo, H.; Wang, J. Spatio-temporal Index for Massive Traffic Data based on HBase. J. Comput. Appl. 2017, 37, 311–315. [Google Scholar]
  135. Lu, X.; Zhao, Z.; Shi, Y. Characteristics Analysis of Ship and Ship Traffic Data based on Modern Statistical Theory. Ship Sci. Technol. 2018, 40, 31–33. [Google Scholar]
  136. Xu, W.; Zhu, X.; Liu, Z. Research on the Key Technology of Urban Multi-source Traffic Data Analysis and Processing. J. Zhejiang Univ. Technol. 2018, 46, 305–309+315. [Google Scholar]
  137. Lu, B.; Shu, Q.; Ma, G. Short-Term Traffic Flow Forecasting Based on Multi-source Traffic Data Fusion. J. Chongqing Jiaotong Univ. (Nat. Sci.) 2019, 38, 13–19+56. [Google Scholar]
  138. Liu, Z.; Li, Q.; Wang, C.; Xu, Y. Research of Highway Traffic Data Fusion De-noising Algorithm based on Wavelet-kalman Filter. Highw. Eng. 2018, 43, 91–96. [Google Scholar]
  139. Zhang, X.; Feng, A. Short-term Traffic Flow Prediction based on Empirical Mode Decomposition and Long Short-term Memory Neural Network. J. Comput. Appl. 2021, 41, 225–230. [Google Scholar]
  140. Wu, J.; Zhang, H.; Zhao, Y.; Zeng, H. Data reconstruction method based on tensor singular value theory. Appl. Res. Comput. 2022, 39, 1449–1453+1459. [Google Scholar]
  141. Wu, J.; Zhang, H.; Zhao, Y.; Zeng, H.; Hu, G. Traffic Data Restoration Method based on Tensor Weighting and Truncated Nuclear Norm. Appl. Res. Comput. 2023, 50, 45–51. [Google Scholar]
  142. Li, R.; Qin, Y.; Wang, J.; Wang, H. AMGB: Trajectory prediction using attention-based mechanism GCN-BiLSTM in IOV. Pattern Recognit. Lett. 2023, 169, 17–27. [Google Scholar] [CrossRef]
Figure 1. Percentage distribution of the literature numbers of various types of urban transportation data.
Sustainability 16 09615 g001
Figure 2. Diagram of urban transportation data types, data sources, application scenarios, and user relationships. Note: The solid arrow represents the correspondence between data types, data sources, application scenarios, and user; The dotted arrow indicates that a data source may indirectly provide relevant information for a certain data type.
Sustainability 16 09615 g002
Figure 3. Research framework diagram.
Sustainability 16 09615 g003
Figure 4. Number of publications on urban transportation data research. Note: The data for Before 2010 is the annual average number of publications from the earliest publication year to 2009, the number of publications in 2024 is estimated based on twice the number in the first half of the year, and WOS corresponds to the sub-coordinate data.
Sustainability 16 09615 g004
Table 1. Domestic and foreign authors who have published a large number of articles.
DatabaseScholarYear of Earliest PublicationNumber of Publications
CNKIJiang, Guiyan20045
Niu, Shifeng20113
WOSIsakov, Vlad200811
Abdel-aty, Mohamed20086
Baldauf, Richard20086
Batterman, Stuart20136
Hilker, Nathan20185
Table 2. Domestic and foreign institutions with more publications.
DatabaseInstitution NameEarliest Publication YearNumber of Publications
CNKISchool of Transportation, Jilin University20047
School of Transportation, Chongqing Jiaotong University20106
School of Transportation, Southeast University20064
State Key Laboratory of Automotive Dynamic Simulation, Jilin University20113
School of Civil Engineering and Transportation, South China University of Technology20233
WOSUniversity of California System199173
State University System of Florida200547
Tongji University200130
Southeast University—China201227
Chinese Academy of Sciences200727
United States Environmental Protection Agency199127
University of California Berkeley199926
Table 3. Countries that have published more than 20 WOS articles.
CountryYear of Earliest PublicationNumber of Publications
USA1981651
People’s Republic of China2001336
Canada199490
England199286
Germany199469
South Korea200560
India198959
Italy200551
Table 4. Country (including region) node keyword co-occurrence network clustering table in the WOS database (LSI).
Cluster NumberCluster SizeAverage Cluster Silhouette ValueAverage YearIdentifier WordResearch Country (Including Region)
0240.7162011air pollution; natural experiment; emissions reduction impact; pm 2.5; collision warning systems | autonomous vehicles; connected vehicles; wireless communication; transportation industry; sea ice modelingUSA, Canada, Taiwan, Turkey, Lebanon, Jordan, Iran, Brazil, Costa Rica, Egypt, United Arab Emirates, Malaysia, Romania, Saudi Arabia, Qatar, Pakistan, Palestine, Indonesia, Peru, Moldova, Ghana, Iraq, Morocco, Turkiye
1170.7682009road traffic; particle matter; carbon monoxide; emissions inventory; rail transit | air pollution; rail transit; geospatial data; binary logit model; artificial intelligenceIndia, Australia, England, Spain, South Korea, New Zealand, Portugal, Ireland, Kenya, Oman, Philippines, Scotland, Ethiopia, Uganda, Vietnam, Ecuador, Wales
2160.7522008road traffic; ultrafine particles; air pollution; low-frequency noise; driving measures | artificial intelligence; urban areas; intelligent vehicles; noise measurement; monitoring systemGermany, France, Netherlands, Switzerland, Argentina, Greece, Chile, Italy, Belgium, Hungary, Liechtenstein, Burkina Faso, Luxembourg, Mali, Cyprus, Croatia
3150.5662014edge computing; autonomous driving; event detection; real-time system; streaming media | road traffic; intelligent transportation systems; traffic congestion; parking spaces; cruising trajectory lengthPeople’s Republic of China, Thailand, Japan, Mexico, Czech Republic, Poland, Slovenia, Singapore, Colombia, Ukraine, Nepal, Benin, North Korea, Myanmar, Bahrain
4140.8572010artificial intelligence; noise measurement; monitoring system; climate change; intelligent transportation systems | air pollution; sound sources; multi-source data; noise measurement; traffic exposureIsrael, Austria, Russia, Finland, Sweden, Norway, Denmark, South Africa, Estonia, Iceland, Bangladesh, Kazakhstan, DEM REP CONGE, Algeria
Note: Based on the country (including region) time zone map information in Figure A4, research countries (including regions) have been sorted and arranged in chronological order; if the average contour values of the clusters are all greater than 0.5, it indicates that the clustering is reasonable. The average year is the average year when the hot words first appear in each cluster.
Table 5. Analysis of keywords with high frequencies.
DatabaseFrequencyCentralityYearKeywords
CNKI160.692006transportation data
130.282010intelligent transportation
80.232009traffic engineering
70.132005data fusion
70.352002intelligent transportation system
60.082020traffic flow prediction
WOS1430.211999air pollution
1210.112000model
790.082000exposure
720.082002impact
680.072005particulate matter
610.131999emissions
570.062005ultrafine particles
570.072011risk
520.011991safety
510.112009models
Disclaimer/Publisher’s Note: The statements, opinions and data contained in all publications are solely those of the individual author(s) and contributor(s) and not of MDPI and/or the editor(s). MDPI and/or the editor(s) disclaim responsibility for any injury to people or property resulting from any ideas, methods, instructions or products referred to in the content.

