1. Introduction
In contrast with conventional internal combustion engines and secondary batteries, PEMFCs can directly transform chemical energy into electrical energy, offering greater energy conversion efficiency and reduced emissions, which is highly beneficial for the sustainable advancement of energy. Not only that, PEMFCs offer benefits such as a high power density and rapid startup at low temperatures, and are considered as an ideal scheme of car power supply in the future [
1,
2,
3]. In order to ensure that fuel cells can run efficiently for a long time, optimizing fuel cell energy management is a crucial task. At present, the degradation-adaptive energy management strategy for fuel cell hybrid electric vehicles (FCHEVs) based on the Rule-DDPG approach assumes a crucial role in curbing hydrogen consumption, augmenting the driving range, and extending the service life of the battery [
4]. However, to guarantee that the fuel cell stack provides adequate operational power and to prevent any decline in its performance, an excess of hydrogen is typically supplied to the PEMFC [
5]. If the unreacted residual hydrogen is not treated, hydrogen energy will be wasted, which is detrimental to the long-term efficient operation of fuel cells and will reduce the energy utilization efficiency. Therefore, it is necessary to use hydrogen recycling devices to recover and utilize unreacted hydrogen for improving fuel cell performance and ensuring sustainable energy development.
The hydrogen supply cycle system is essential for enhancing the hydrogen utilization efficiency of PEMFCs and ensuring the wettability of the fuel cell stack. The traditional hydrogen cycling method is to recycle the unreacted hydrogen flowing through the fuel cell stack through a recirculation pump or a compressor, but this process not only consumes part of the fuel cell power, but also causes vibration and noise [
6,
7,
8,
9]. Using an ejector to circulate hydrogen can prevent the above problems. The ejector does not require additional power and can cycle hydrogen by using the pressure difference between the two strands of hydrogen. At the same time, owing to its benefits of light weight, low cost and stable structure, it is well suited as hydrogen cycling equipment [
10,
11].
At present, research on improving the efficiency of ejectors mainly relies on a combination of simulation and experimentation [
12,
13,
14]. Maghsoodi et al. [
15], based on the CFD model, obtained the relationship between ejector structural parameters and ejector ratio by using an artificial neural network, and then obtained the maximum ejector ratio using the genetic algorithm. Pei et al. [
16] studied the influence of nozzle and mixing chamber dimensions on the ejection performance and applicability of the ejector by combining CFD models with pressure drop models. Yang et al. [
17] established an effective anode pressure drop model to study the influences of nozzle outlet diameter, nozzle outlet position, and other parameters on the ejector performance. Owing to the great impact of structure size on ejector performance, domestic and foreign researchers have conducted much research to optimize the ejector’s structural parameters [
18,
19,
20]. Through their investigation of the nozzle diameter, Wang et al. [
21] discovered that the size of the nozzle diameter would affect the fluid velocity at the exit. When the nozzle diameter increased from small to large, the flow velocity of the expelled fluid would also increase. However, when the nozzle diameter is too large, the fluid will produce shock waves and the ejection performance will begin to decrease. Salehi et al. [
22] found that a mixing chamber with a large diameter separated the boundary layer of the mixed fluid and affected the ejection performance. However, a smaller diameter made the outlet flow rate faster, being more conducive to fluid mixing. Hou et al. [
23] researched the effect of ejector structural parameters on the ejector performance and obtained design methods and standards for improving the ejector ratio.
The area of the ejector nozzle serves as a critical structure for the first intersection of the working fluid and the ejector fluid, but the existing ejector optimization methods rarely optimize the nozzle profile and lack the corresponding test data. Therefore, an ejector optimization method including the optimization of nozzle contour curvature is proposed in this paper. Through the three-dimensional fluid simulation analysis of the hydrogen ejector, the relationship between the nozzle exit distance, mixing chamber length–diameter ratio, nozzle profile shape, and ejector performance was investigated under different working fluid pressures, and the ideal structural dimensions of the ejector were determined. Finally, the results of the optimization were validated through experiments, offering a valuable reference for the optimization of ejectors.
2. Design of the Structural Parameters of the Ejector
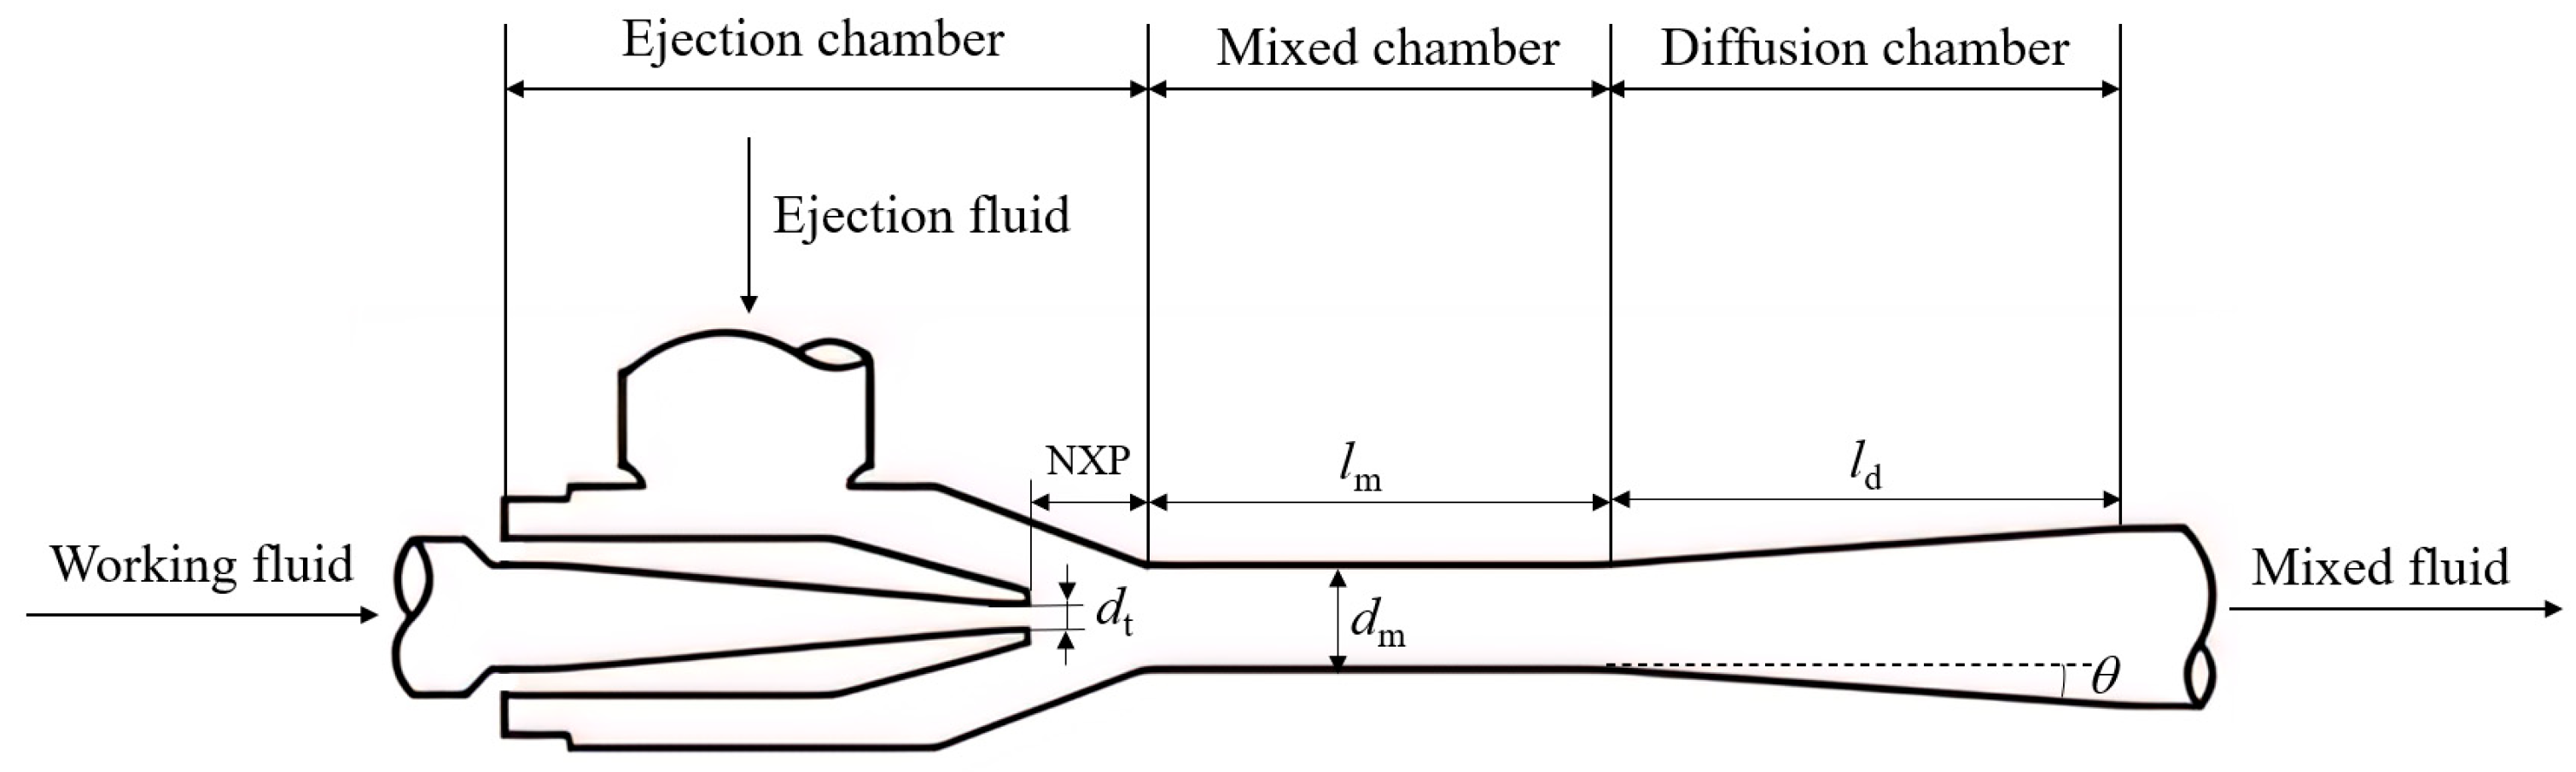
The ejector mainly consists of a nozzle, a receiving chamber, a mixing chamber, and a diffusion chamber.
Figure 1 illustrates the geometric structure of the ejector. The important geometric parameters include the nozzle diameter (
dt), nozzle exit position (NXP), mixing chamber diameter (
dm), mixing chamber length (
lm), diffusion chamber length (
ld), and diffusion chamber angle (
θ). During operation, high-pressure working fluid enters the receiving chamber together with low-pressure ejector fluid. When the working fluid enters the receiving chamber at high velocity from the nozzle, there will be a pressure difference between the working fluid and the ejector fluid in the low-pressure area. As a result of the pressure difference, the ejector fluid will be absorbed and enter the mixing chamber together for uniform mixing. Finally, the mixed fluid will flow out after the deceleration and pressurization in the diffusion chamber.
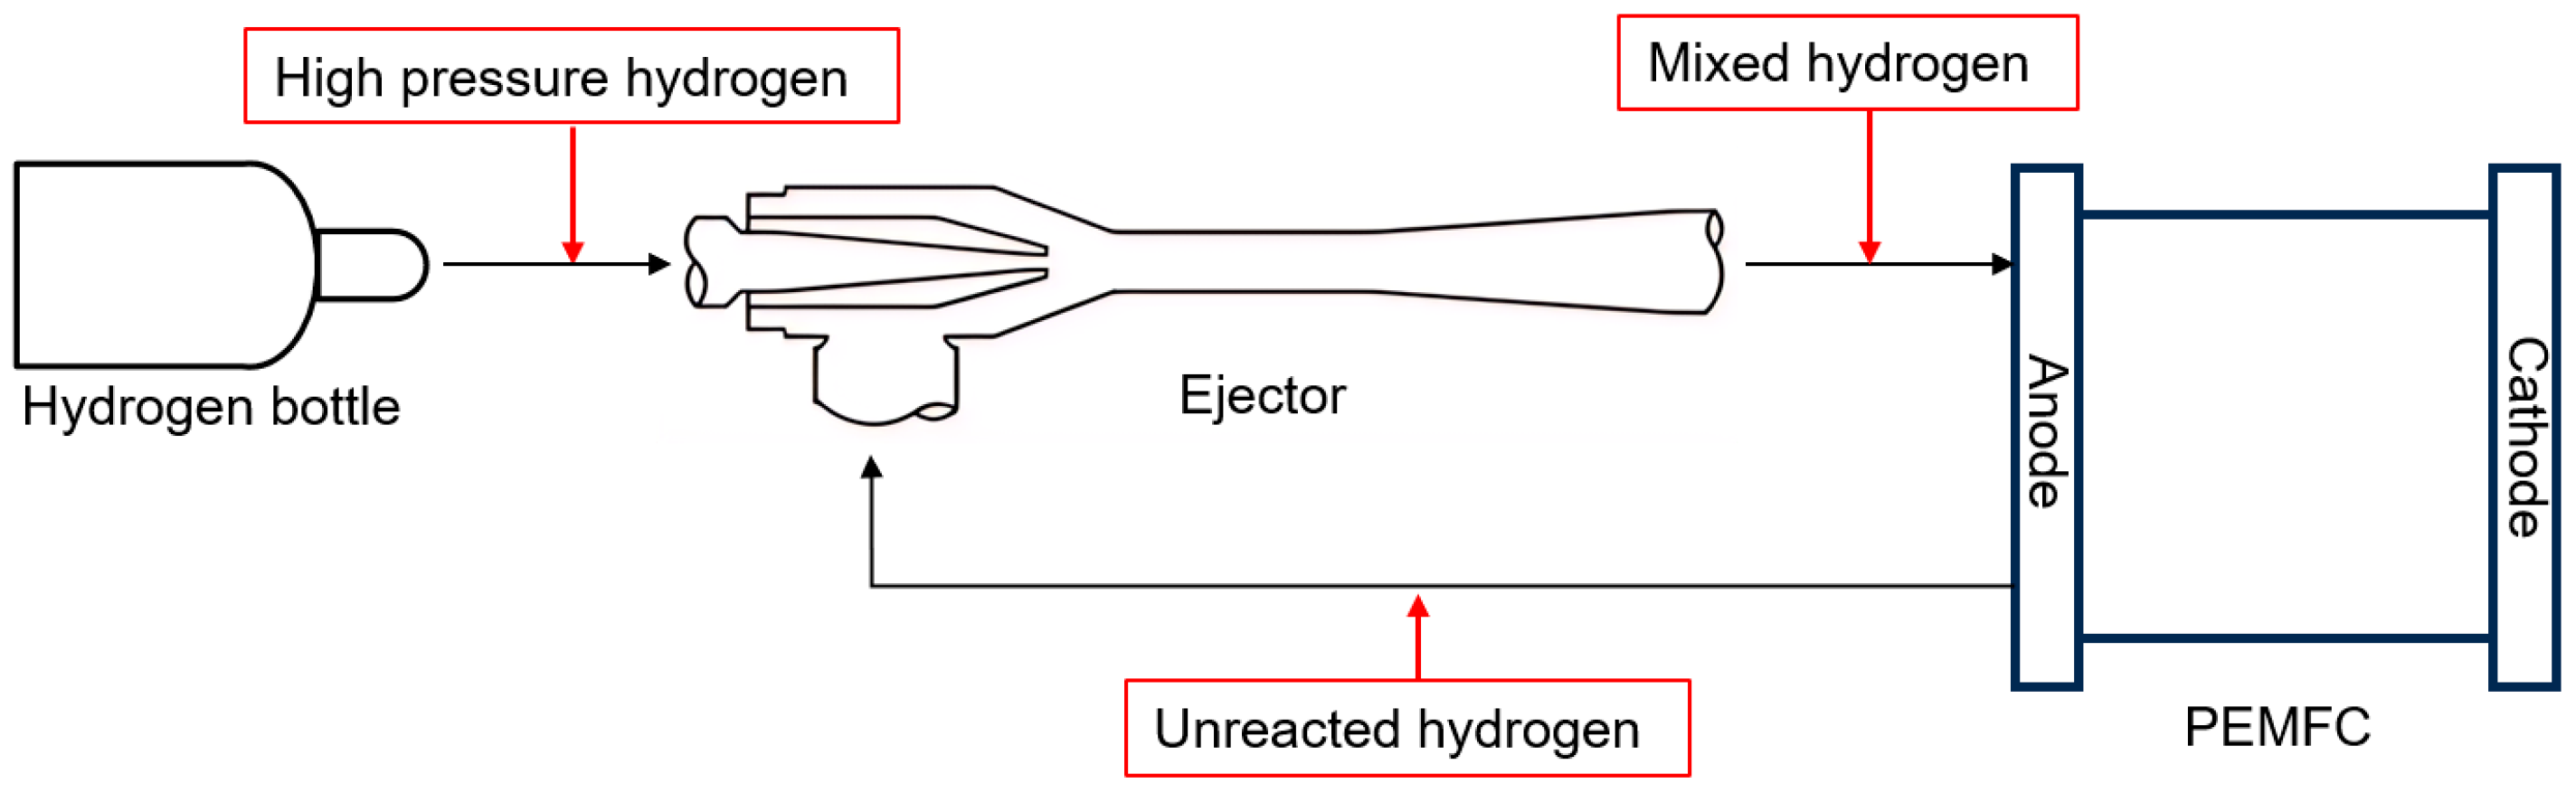
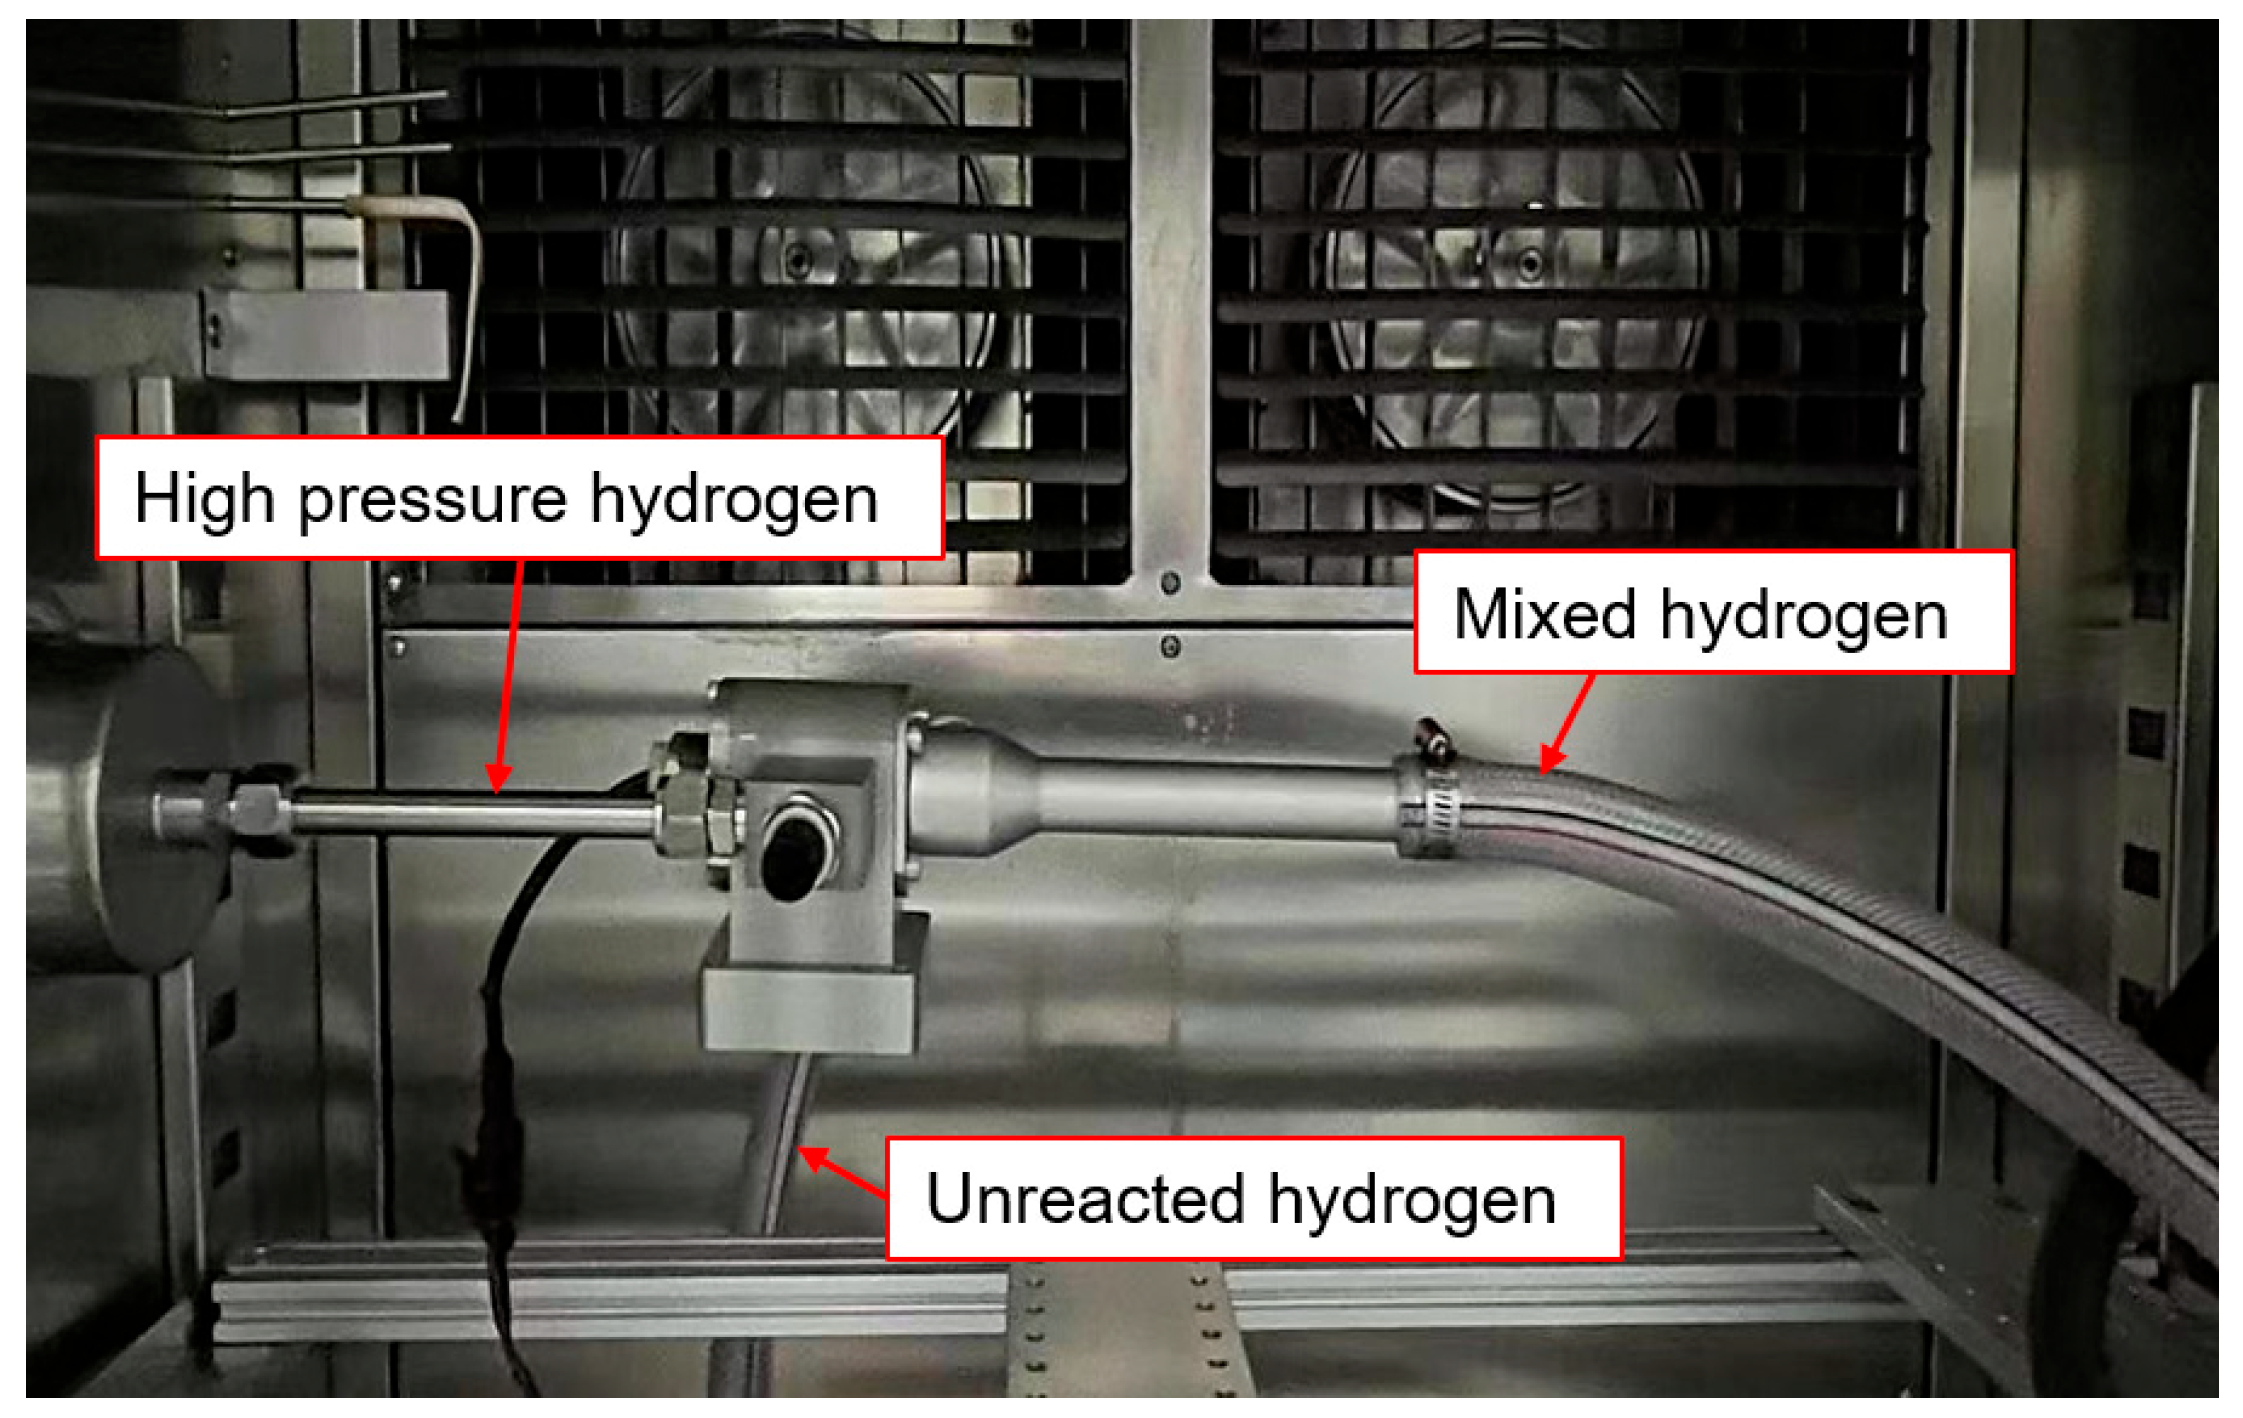
Figure 2 shows a flow chart of hydrogen circulation system with the ejector. The high-pressure hydrogen emitted by the hydrogen source flows into the ejector as the working fluid, and the unreacted hydrogen in the fuel cell stack as low-pressure fluid flows into the ejector fluid inlet. After the two streams of fluid are completely mixed in the ejector, they flow from the ejector exit to the stack’s anode entrance. As a result, the hydrogen cycle is completed.
The ejector ratio is usually used as the index to evaluate the working performance of the ejector. It is the ratio of the ejector fluid mass flow rate to the working fluid mass flow rate during the working process of the ejector. The larger the ejector ratio, the better the ejector performance. The ejector ratio is written as:
where
Gh is the mass flow rate of the ejector fluid and
Gp is the mass flow rate of the working fluid.
The key parameters of a PEMFC stack are shown in
Table 1.
The working fluid’s mass flow rate G
p under the conditions of ejector design can be calculated according to the stack parameters [
24].
where
Ncell is the number of batteries in the stack,
MH2 is the molar mass of hydrogen,
F is Faraday’s constant,
I is the working current,
i is the working current density, and
A is the activation area of the fuel cell stack.
This study employs the Sokolov calculation method to determine the geometrical parameters of an 80 kW PEMFC hydrogen ejector [
25]. The design parameters of the ejector are as follows. The working fluid pressure is 1 MPa, the temperature is 298 K, the ejection fluid pressure is 0.231 MPa, the temperature is 318 K, and the mixed fluid pressure is 0.254 MPa.
After obtaining the mass flow rate G
p of the working fluid, geometric parameters such as the nozzle diameter, mixing chamber diameter, and mixing chamber length were calculated using the method described in reference [
26]. The specific structural parameters of the ejector are shown in
Table 2.
4. Results and Discussion
4.1. Effect of NXP on Ejection Ratio
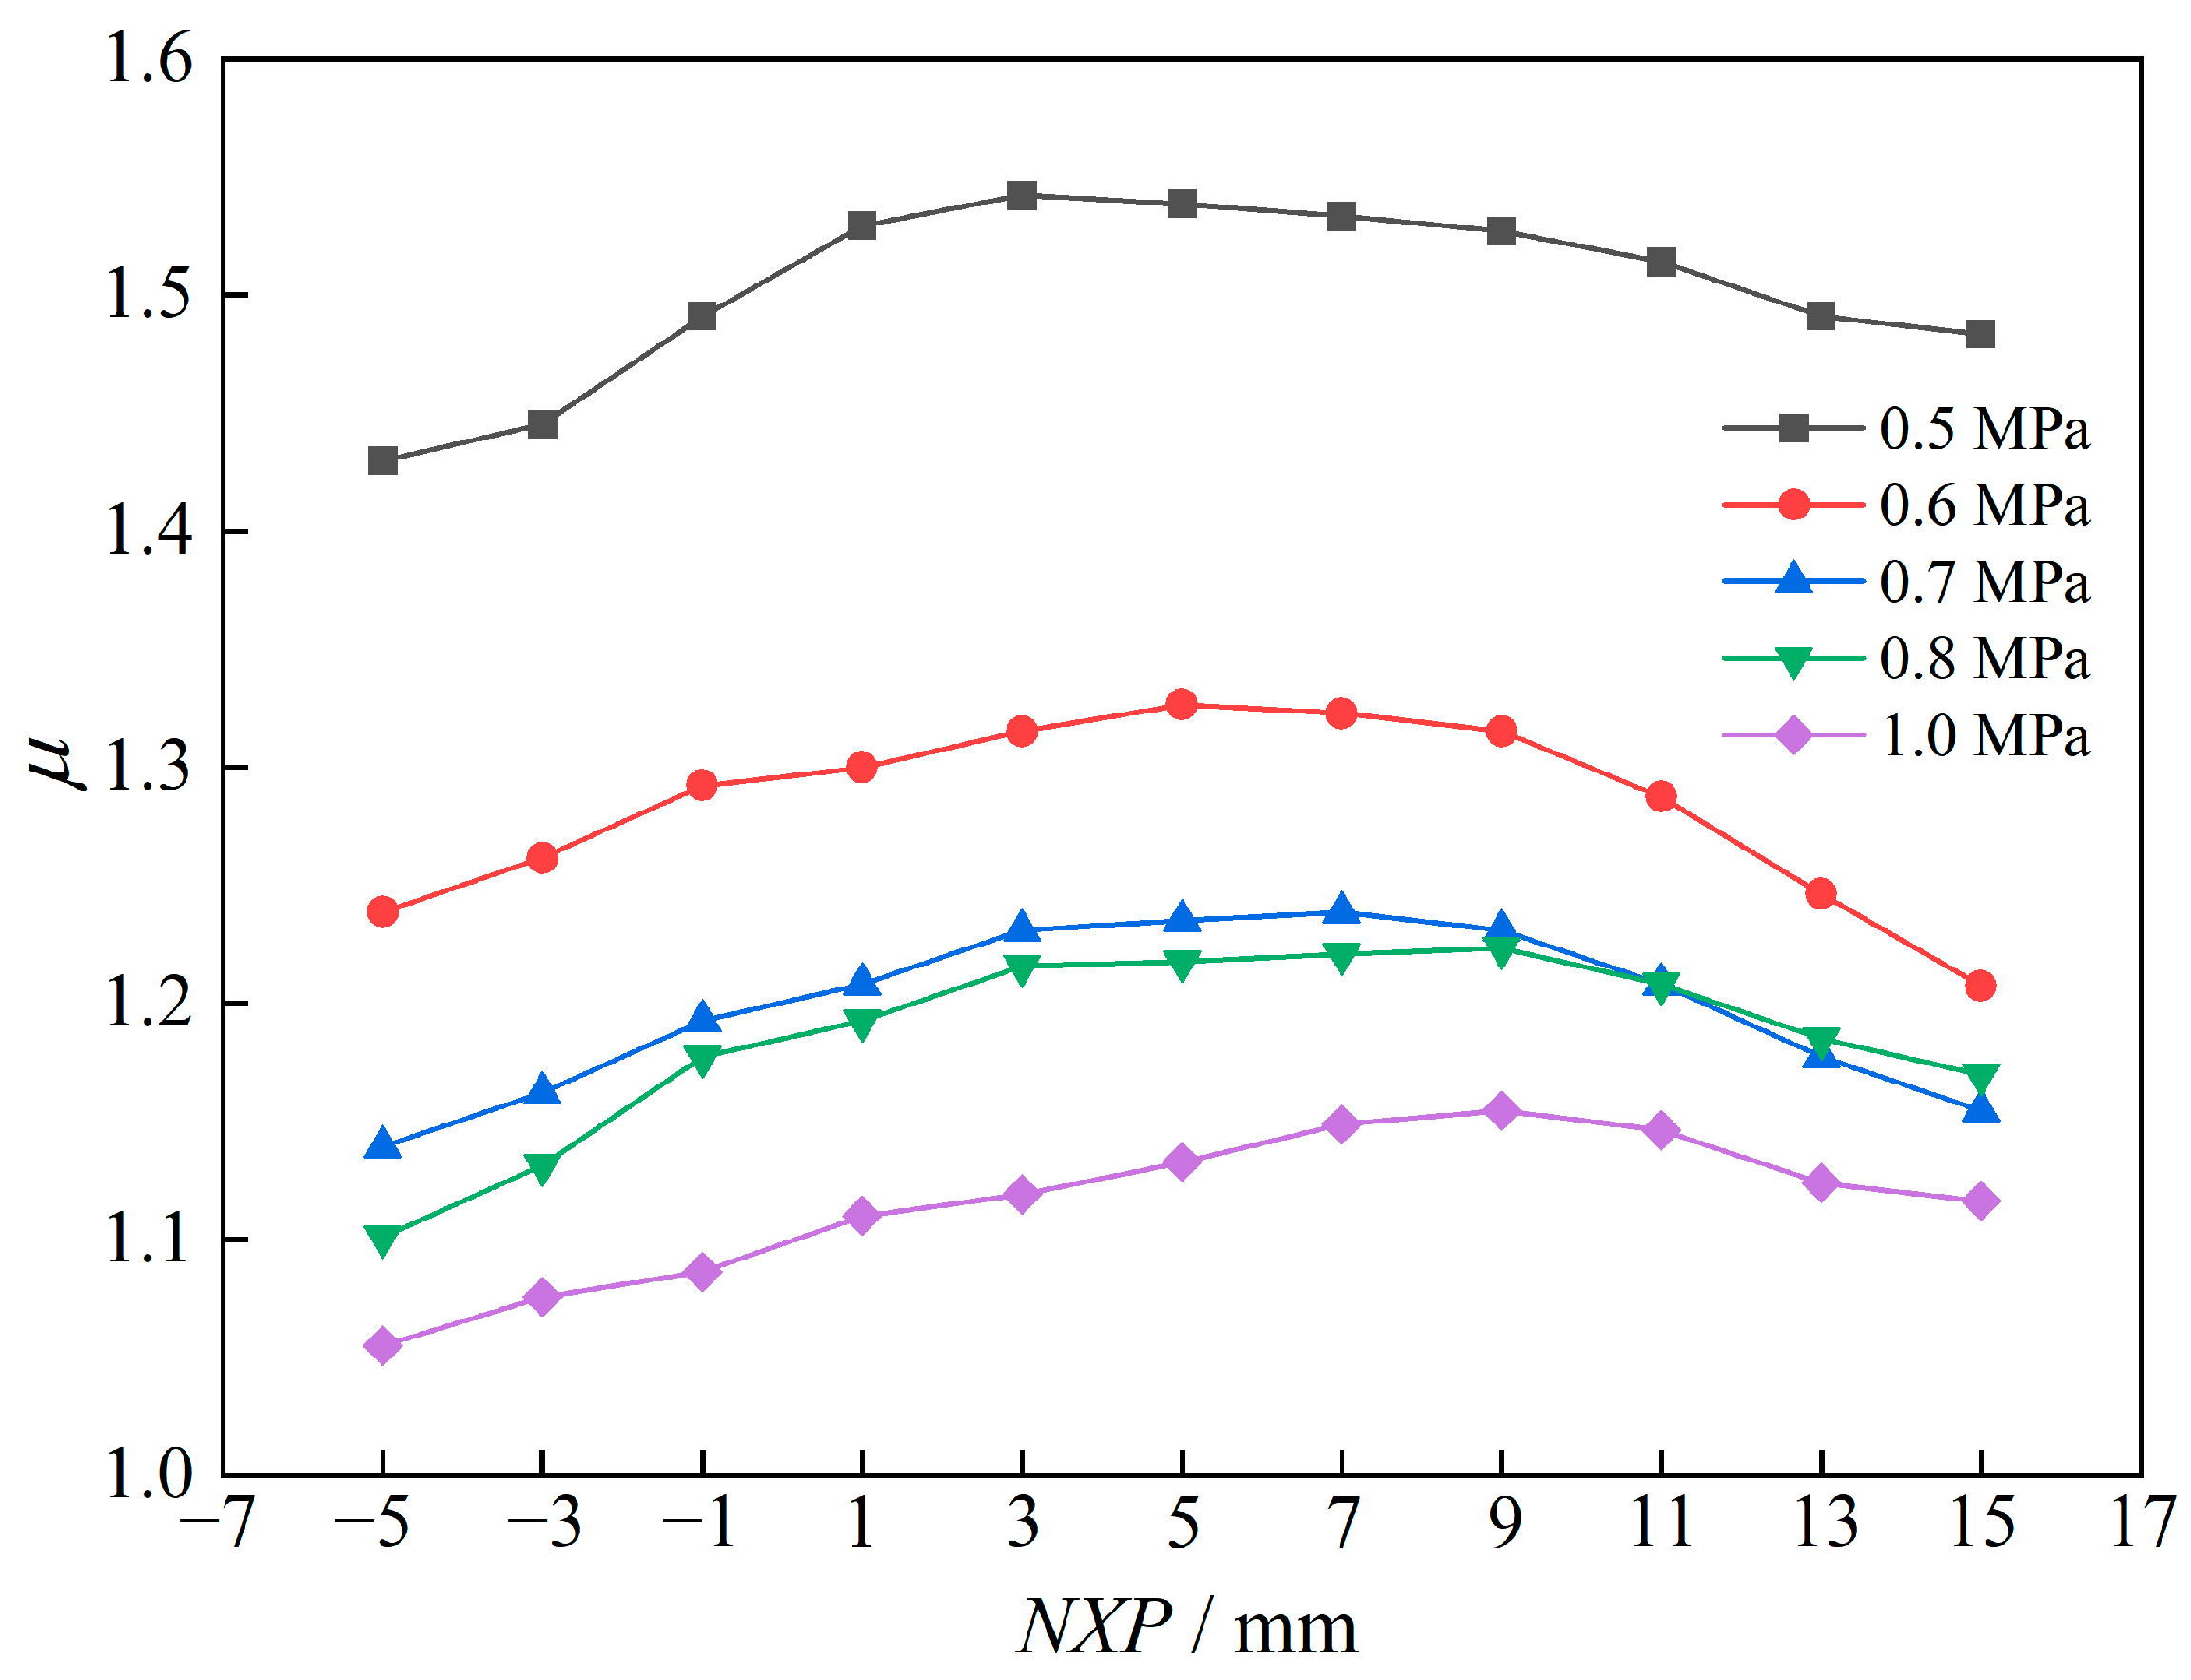
NXP is characterized as the distance from the nozzle exit to the inlet of the mixing chamber. It is a vital parameter that affects the ejection performance. The NXP value was set as a single variable for the simulation study to obtain the maximum ejection ratio. During the optimization process, the NXP varied from −5 mm to 15 mm with a step size of 2 mm, while the other dimensions remained unchanged. A negative NXP value means the nozzle extends into the mixing chamber, while a positive NXP value indicates that the nozzle is outside the mixing chamber.
Figure 6 presents the impact of various NXP values on the ejection ratio. It is evident that the ejection ratios under all working conditions initially increased and subsequently decreased with the increase in NXP. The optimal NXP also gradually increased from 3 mm to 9 mm during the process of increasing from low power to rated power.
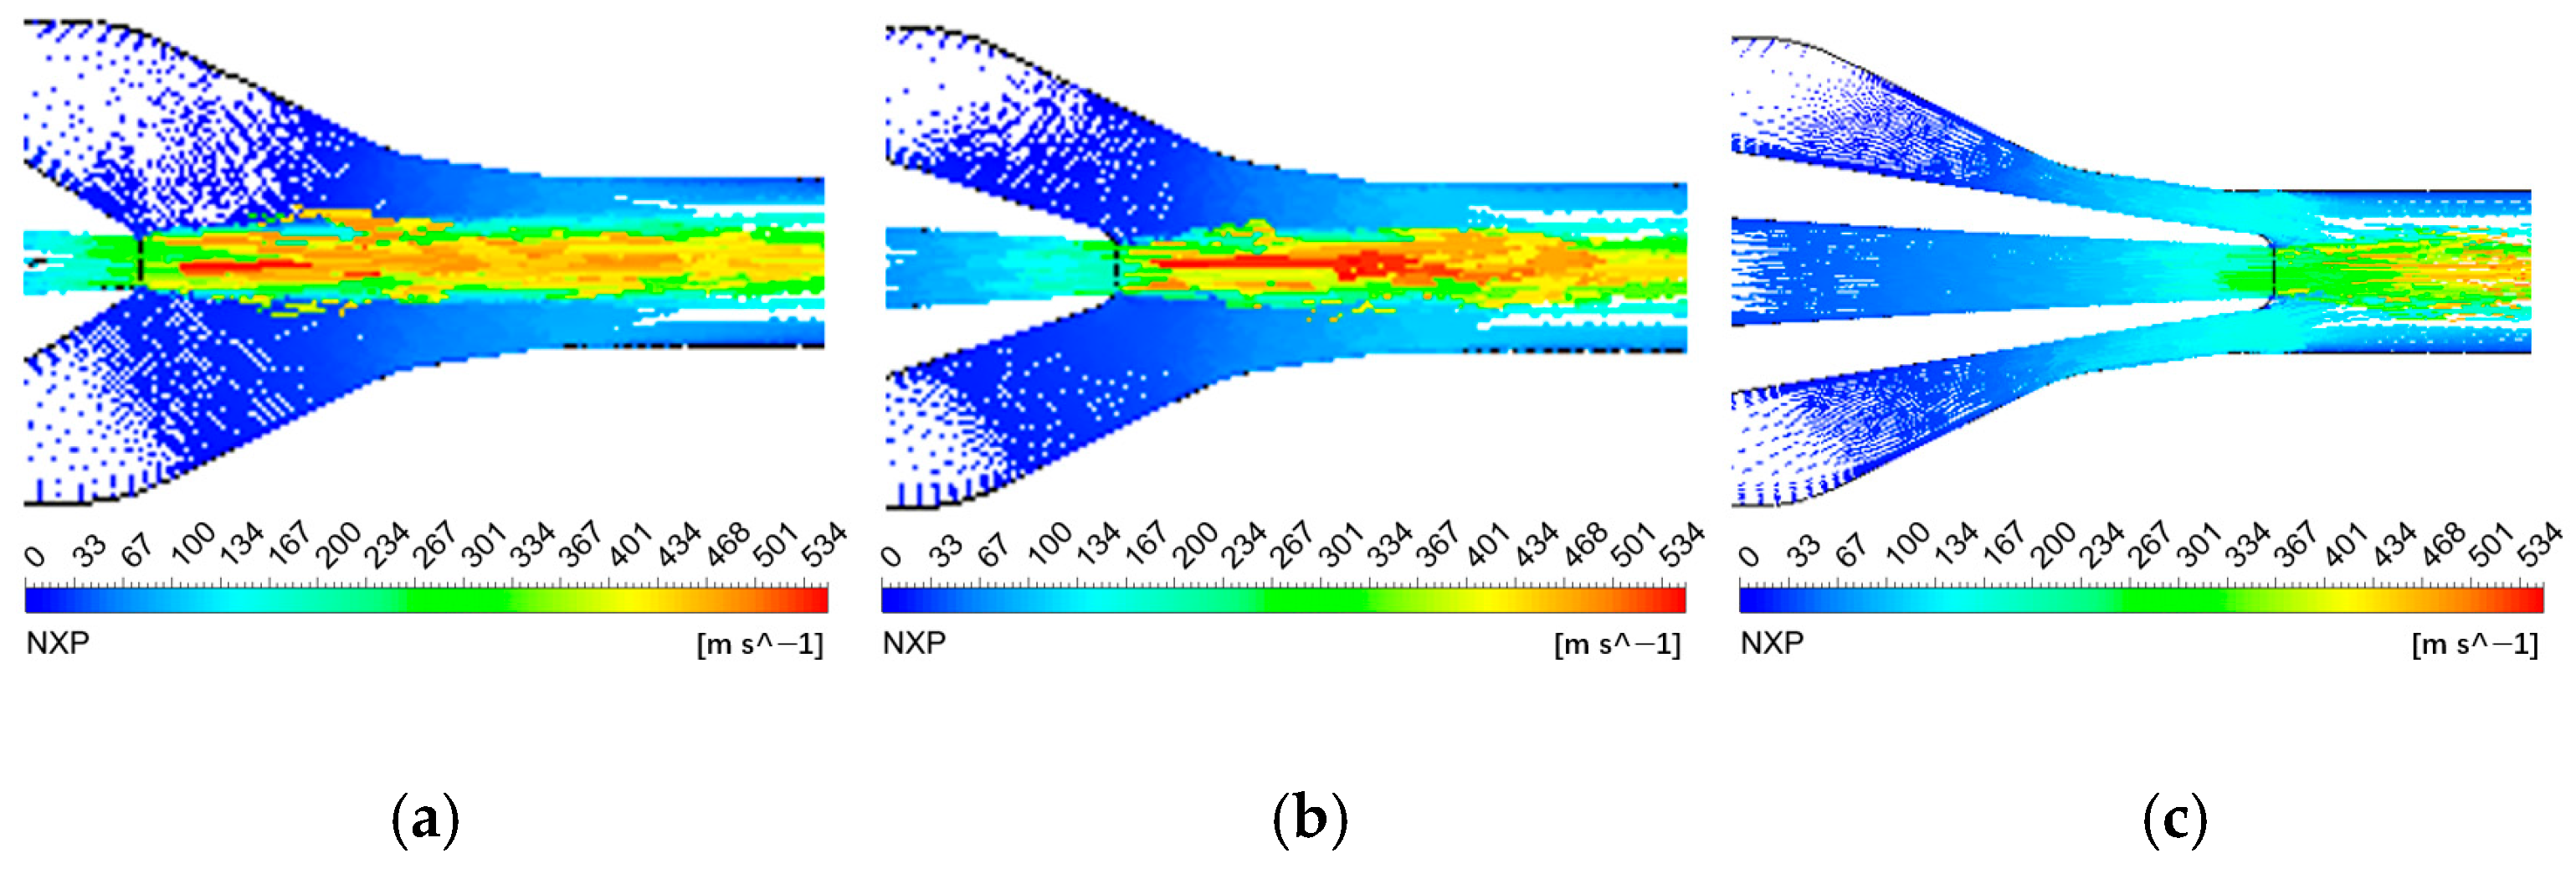
Figure 7 shows the nozzle outlet velocity field at different nozzle distances as the working fluid pressure increased from low to high. It can be found that the mixing flow of the working fluid and the ejector fluid at high NXP exhibited much momentum loss, causing the ejector ratio to decrease, as shown in
Figure 7a. As the distance decreased, the loss along the path decreased and the ejection ratio increased, as shown in
Figure 7b. When the NXP continued to decrease, the space of the receiving chamber also decreased with the NXP. A receiving chamber that is too small causes the working fluid to not have enough space to roll the incoming fluid, and the ejection ratio decreases, as shown in
Figure 7c.
The effect of NXP on the ejection ratio at low and medium power as similar to that at the rated power. However, the ideal value of NXP also decreased with the decrease in the working fluid pressure. This means that the position of the nozzle exit was closer to the inlet of the mixing chamber. Considering that the kinetic energy of the working fluid was low at low power, the large kinetic energy loss at a long NXP reduced the enrolling capacity of the working fluid, thereby reducing the ejection ratio. Before optimization, the NXP was 1 mm, and the ejection ratio at rated power was 1.1. The ejection ratio at rated power reached the maximum value of 1.14 at the NXP of 9 mm. At this point, good ejection performance could also be achieved at low and medium power.
4.2. Effect of Mixing Chamber Diameter on Ejection Ratio
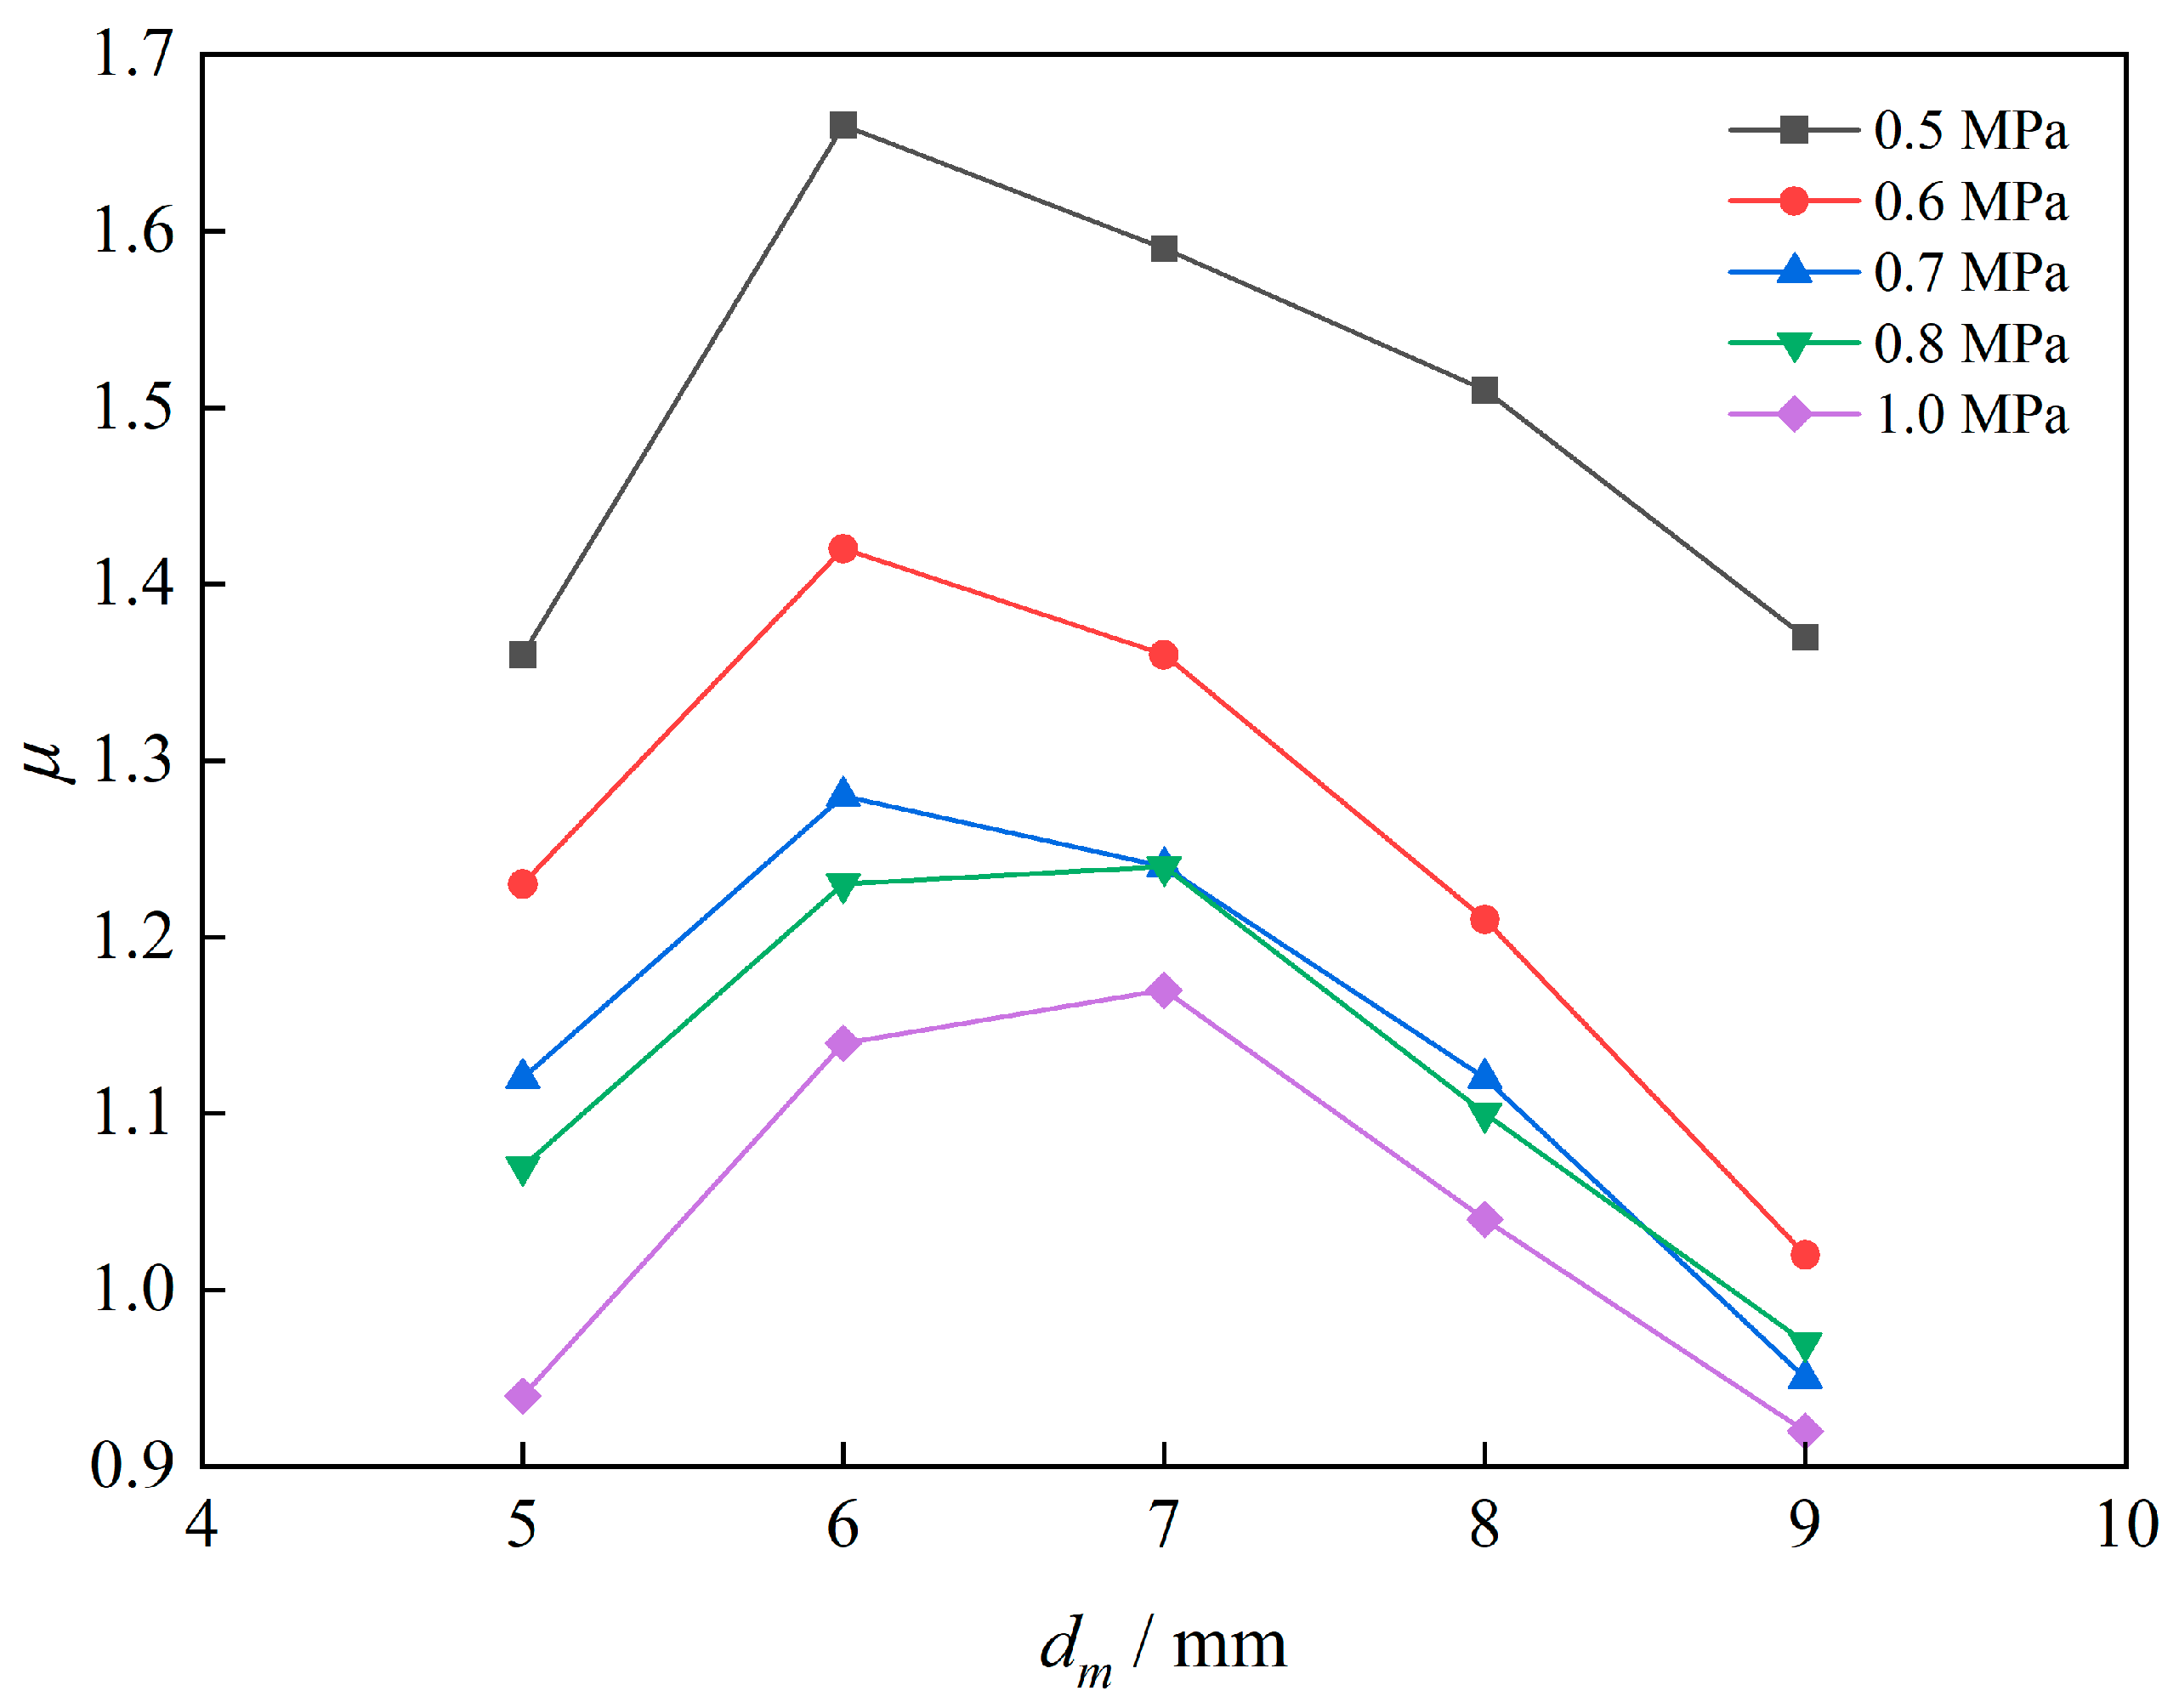
As the mixing chamber is an important place for the mixing of working fluid and ejector fluid, it is essential to optimize it to obtain the maximum ejector ratio. The effect of mixing chamber diameter on ejection performance is shown in
Figure 8 at different working pressures. It was discovered that the ejection ratio initially increased and then decreased with an increase in the mixing chamber diameter. The maximum ejection ratio could be achieved when the optimal mixing chamber diameters were 6 mm at low and medium power and 7 mm at rated power.
Figure 9 illustrates the velocity field of various mixing chamber diameters as the working fluid pressure increases from low to high. Although it has a high velocity distribution under small diameters, the fluid does not have enough distribution space, resulting in a low ejection ratio, as shown in
Figure 9a. With the gradual increase in the diameter of the mixing chamber, the entrainment space gradually increased, and the ejection ratio gradually attained the maximum value, as shown in
Figure 9b. At this point, the toolarge mixing chamber diameter greatly reduced the flow rate. Accordingly, the pressure in the receiving chamber increased. At the same time, the pressure difference between the receiving chamber and the ejecting fluid decreased, and the ejecting performance also decreased, as shown in
Figure 9c.
As the fluid pressure in the working fluid increased, the mixing space required by the fluid increased. Therefore, the optimal diameter of the mixing chamber at high power was larger than those at low and medium power. The maximum ejection ratio of 1.17 can be obtained with a diameter of the mixing chamber of 7 mm at the rated power. At the same time, satisfactory ejection performance can be achieved at medium and low power.
4.3. Effect of the Length to Diameter Ratio on Ejection Ratio
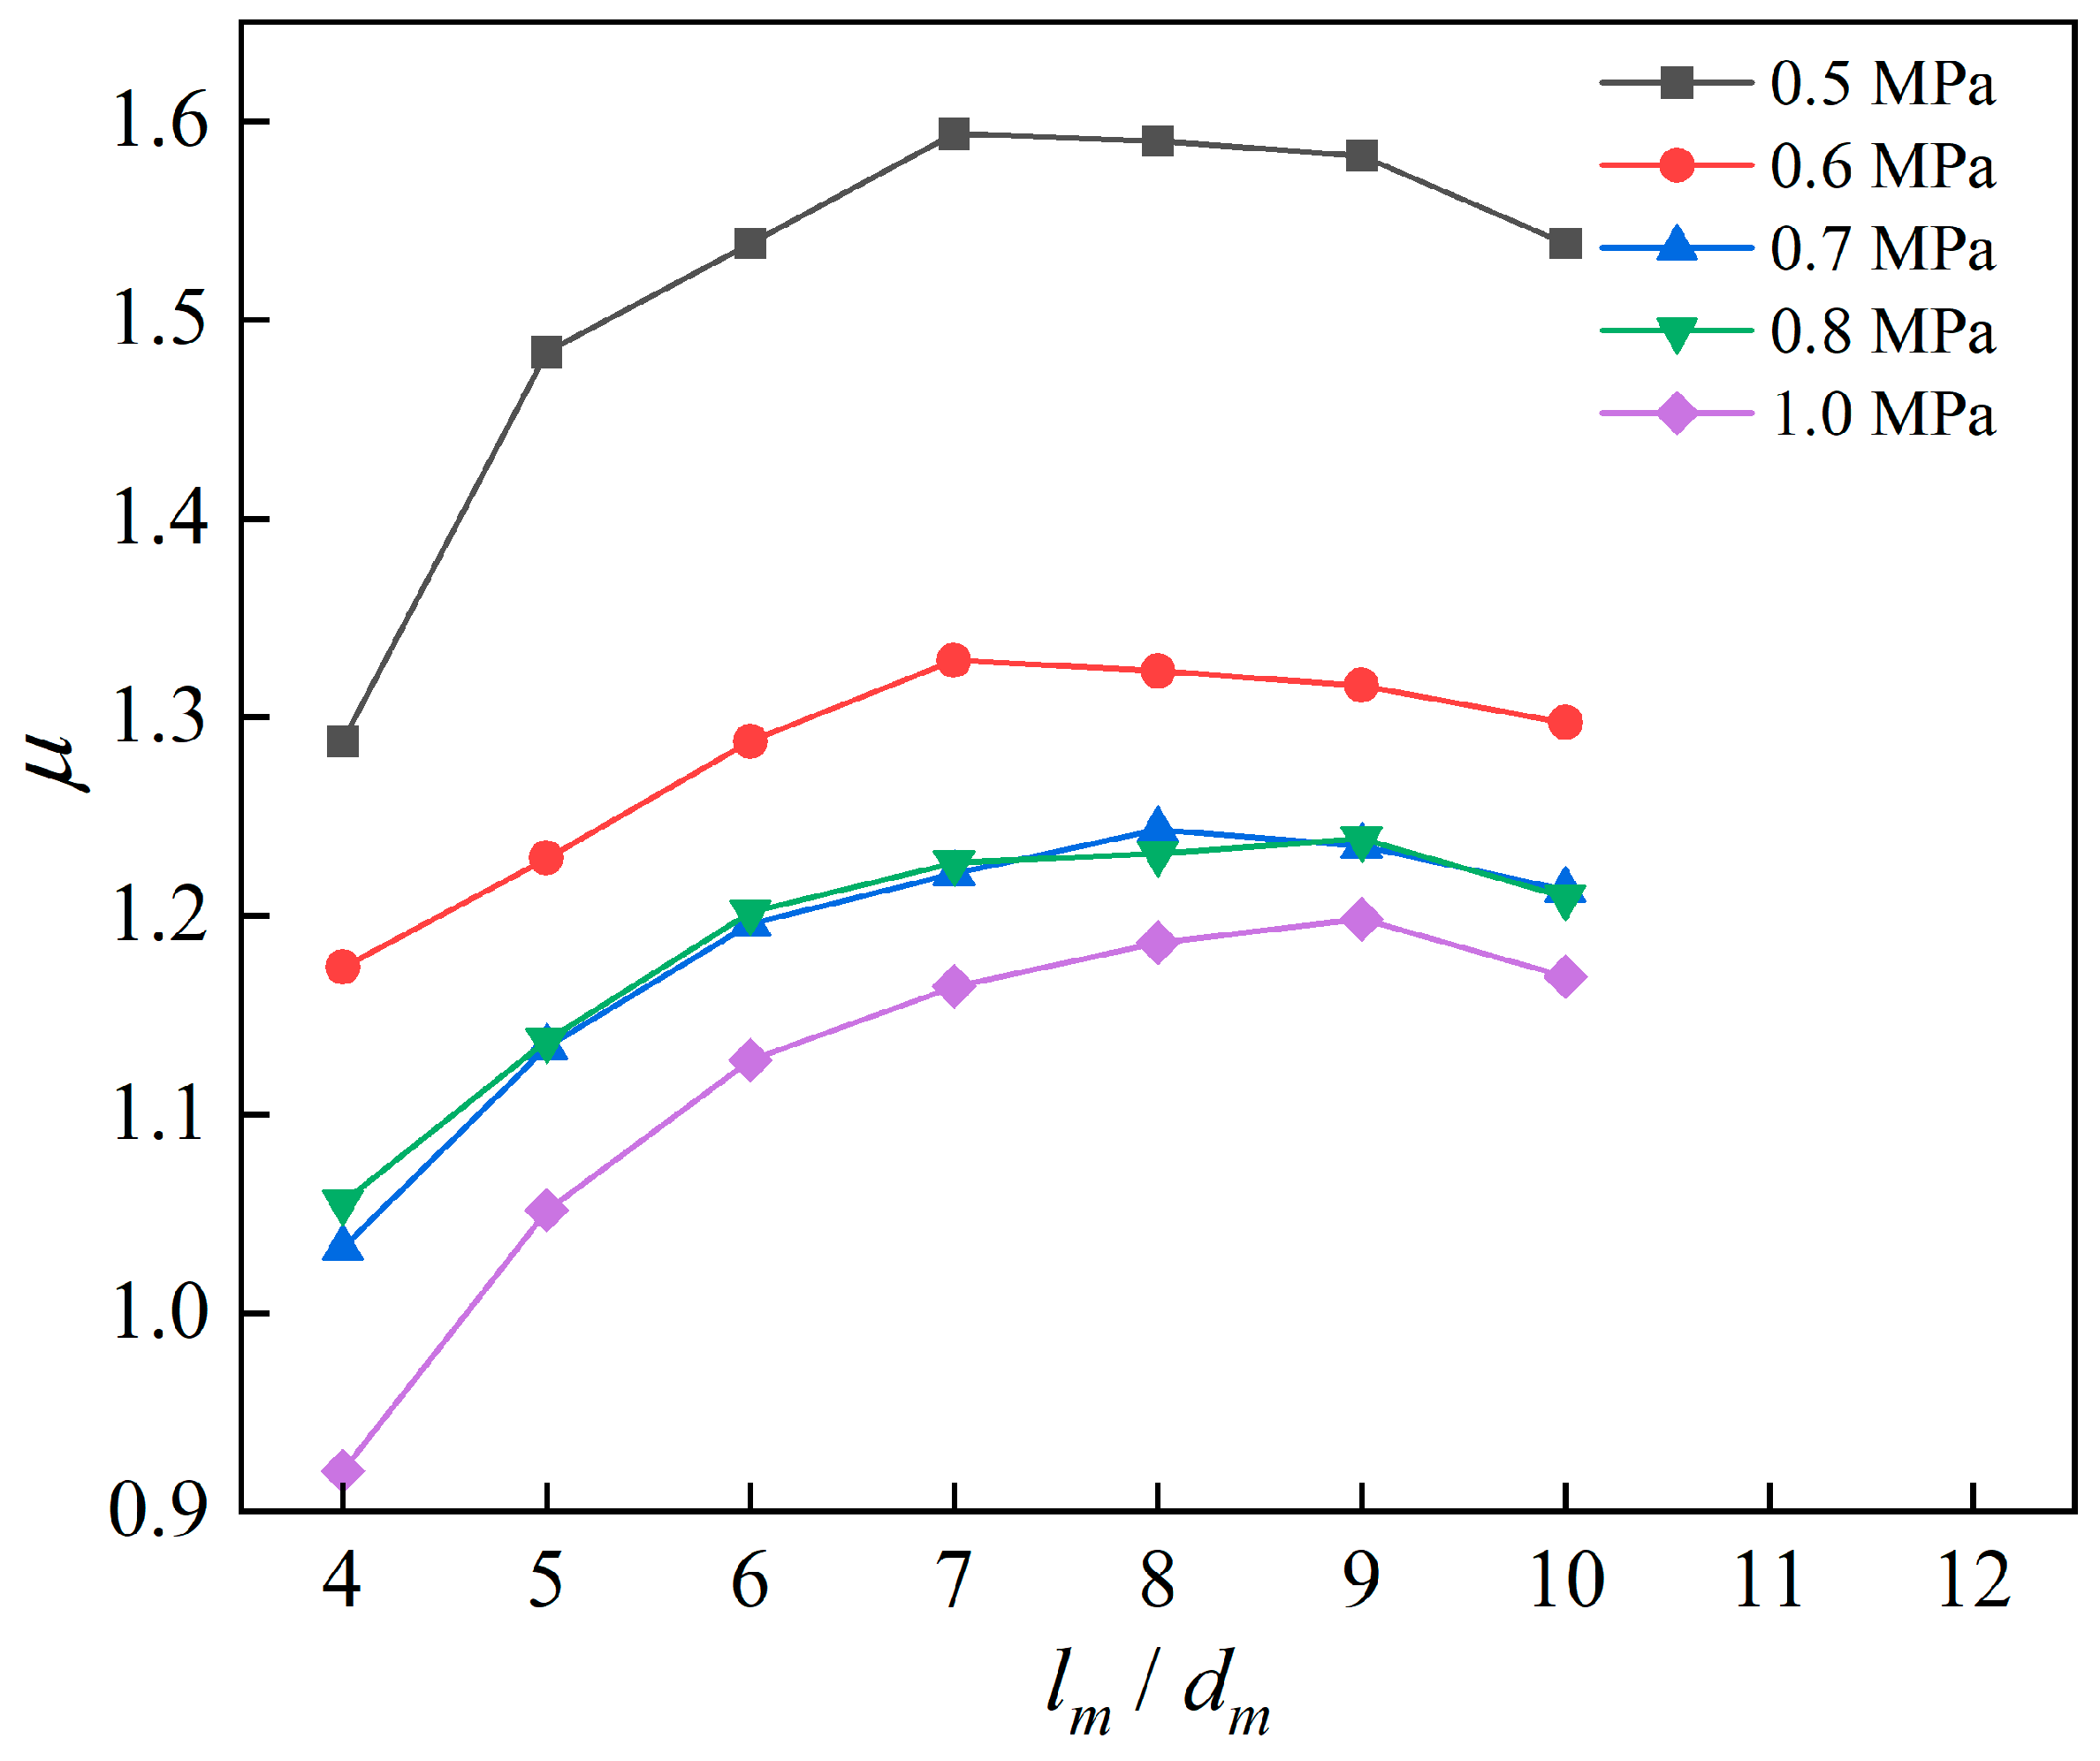
The influence of the mixing chamber length–diameter ratio on ejection performance is shown in
Figure 10 at different working pressures. As the length–diameter ratio increased from 4 to 10, the ejection ratio firstly increased and then decreased under all working conditions. The optimal aspect ratio at low power was lower than that at high power, and the optimal value increased from 7 at low power to 9 at rated power.
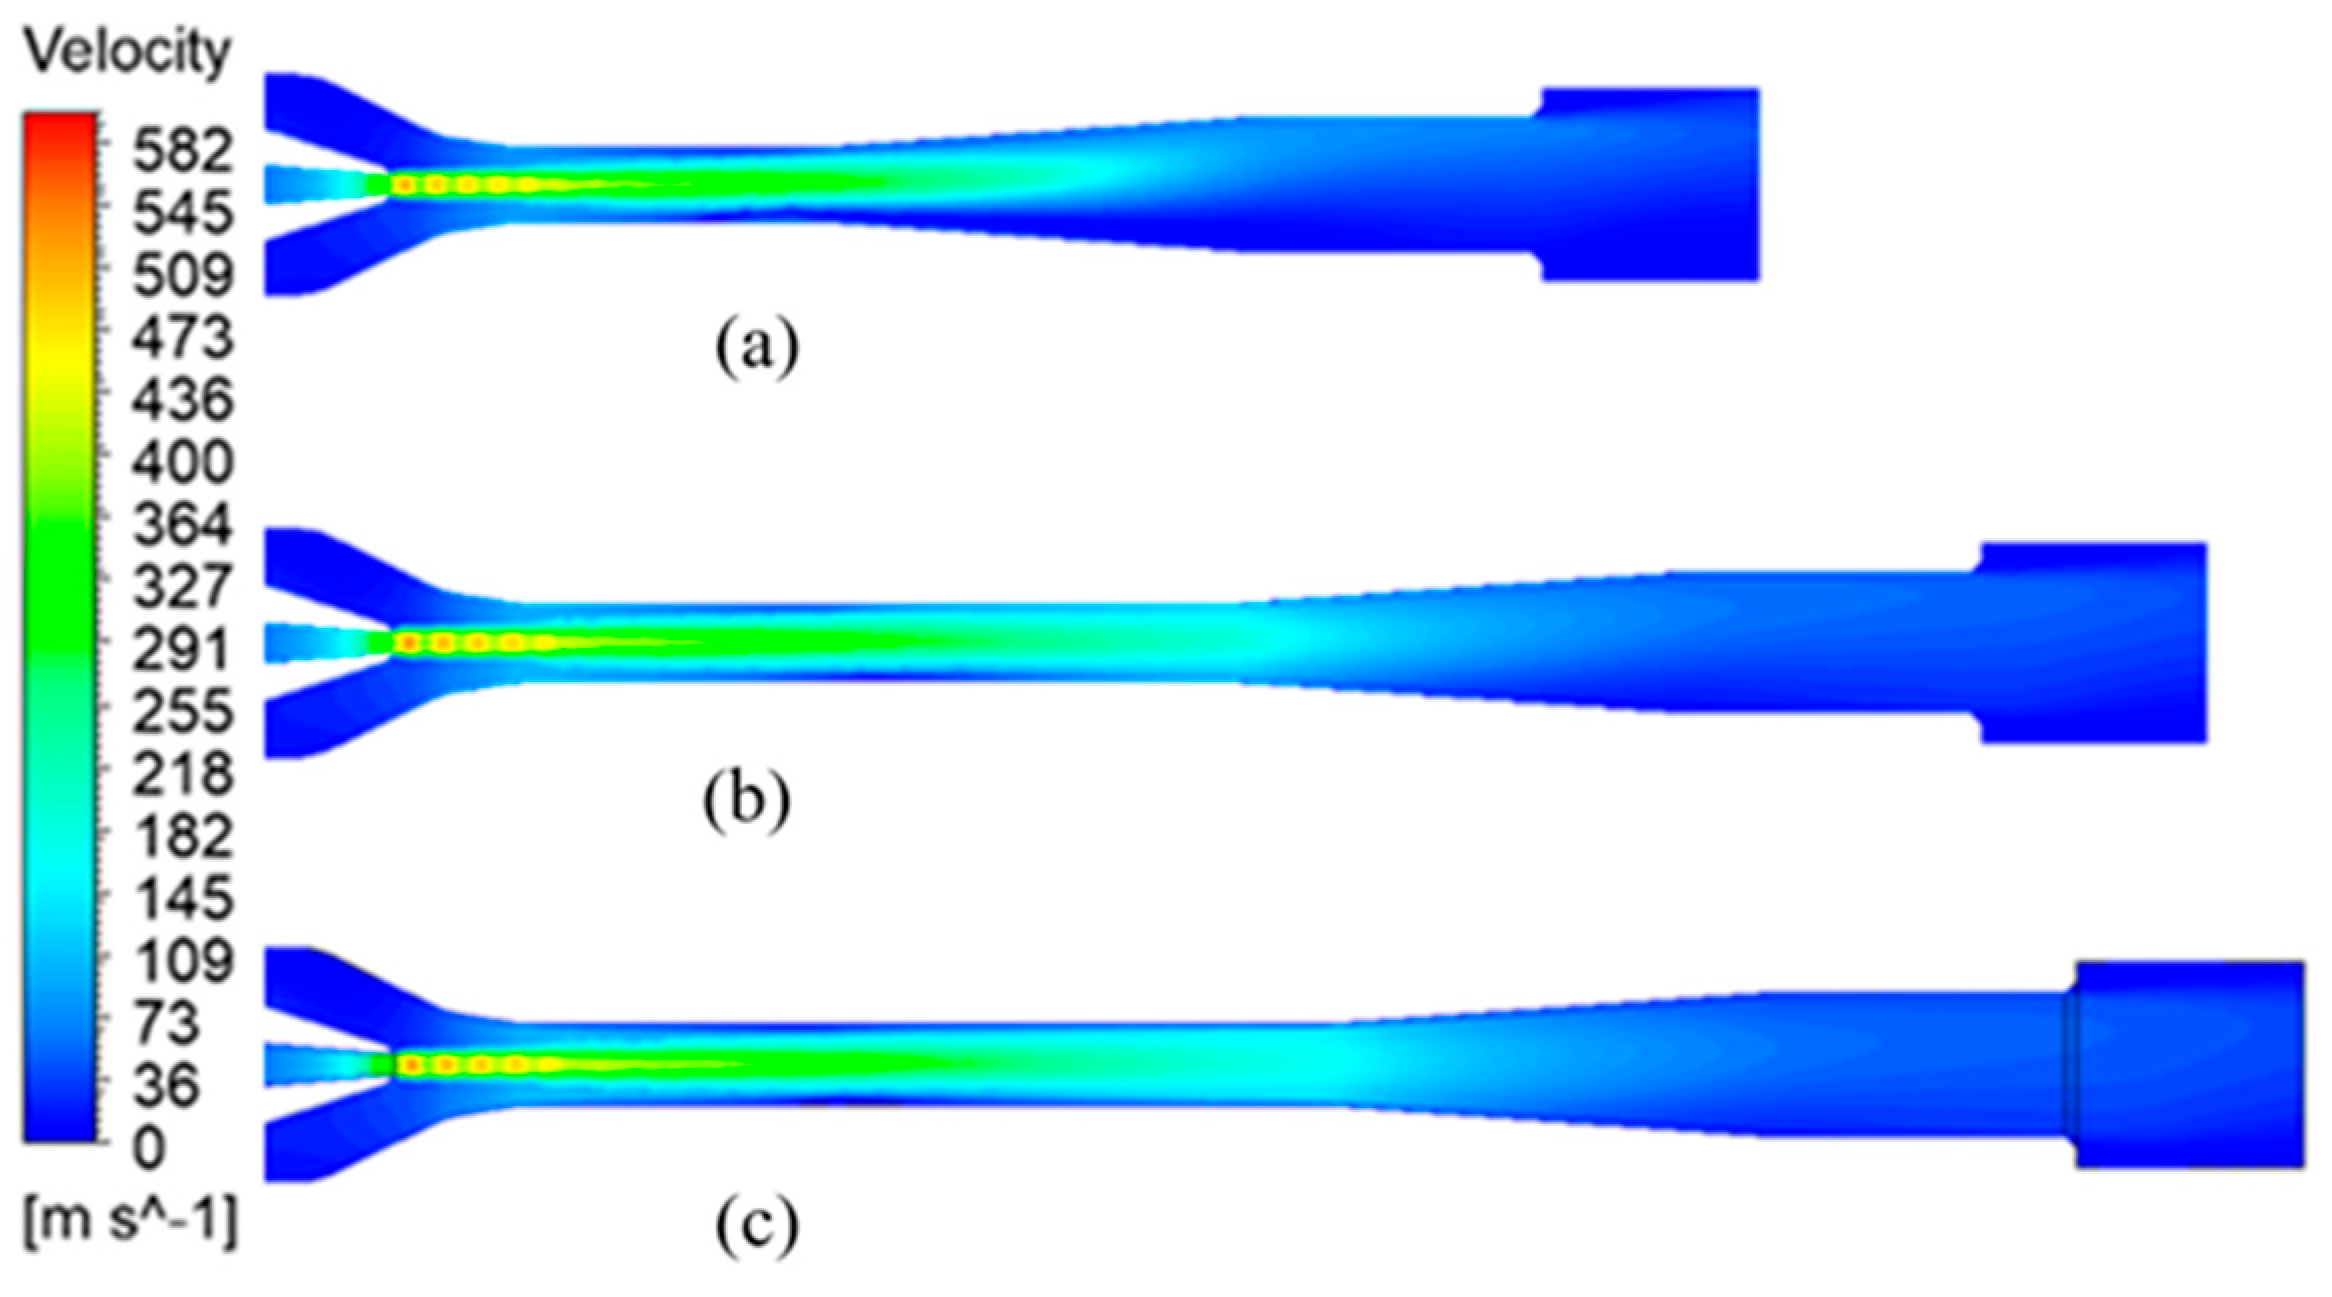
Figure 11 shows the velocity field of the working fluid with different aspect ratios from low pressure to high pressure. It is found from
Figure 11a that the working fluid and ejector fluid were not fully mixed at low length–diameter ratios, resulting in poor ejector performance. As the length of the mixing chamber increased, a complete mixing of the working fluid and the ejector fluid ensued. The distribution of velocity within the mixed fluid approached uniformity, and the ejector ratio increased, as shown in
Figure 11b. However, a mixing chamber that is too long will increase the flow resistance, reducing the ejection ratio, as shown in
Figure 11c.
Therefore, there exists an optimal aspect ratio under all operating conditions. Compared with the rated power, the working fluid pressure at low power was lower, and the mixing chamber length required for uniform mixing was slightly shorter, so the optimal aspect ratio was also smaller than that at high power. At rated power, a maximum ejection ratio of 1.20 can be achieved when the length–diameter ratio of the mixing chamber is set to 9. At the same time, a satisfactory ejection ratio can also be obtained at low to medium power.
4.4. Effect of Nozzle Contour Curvature on Ejection Ratio
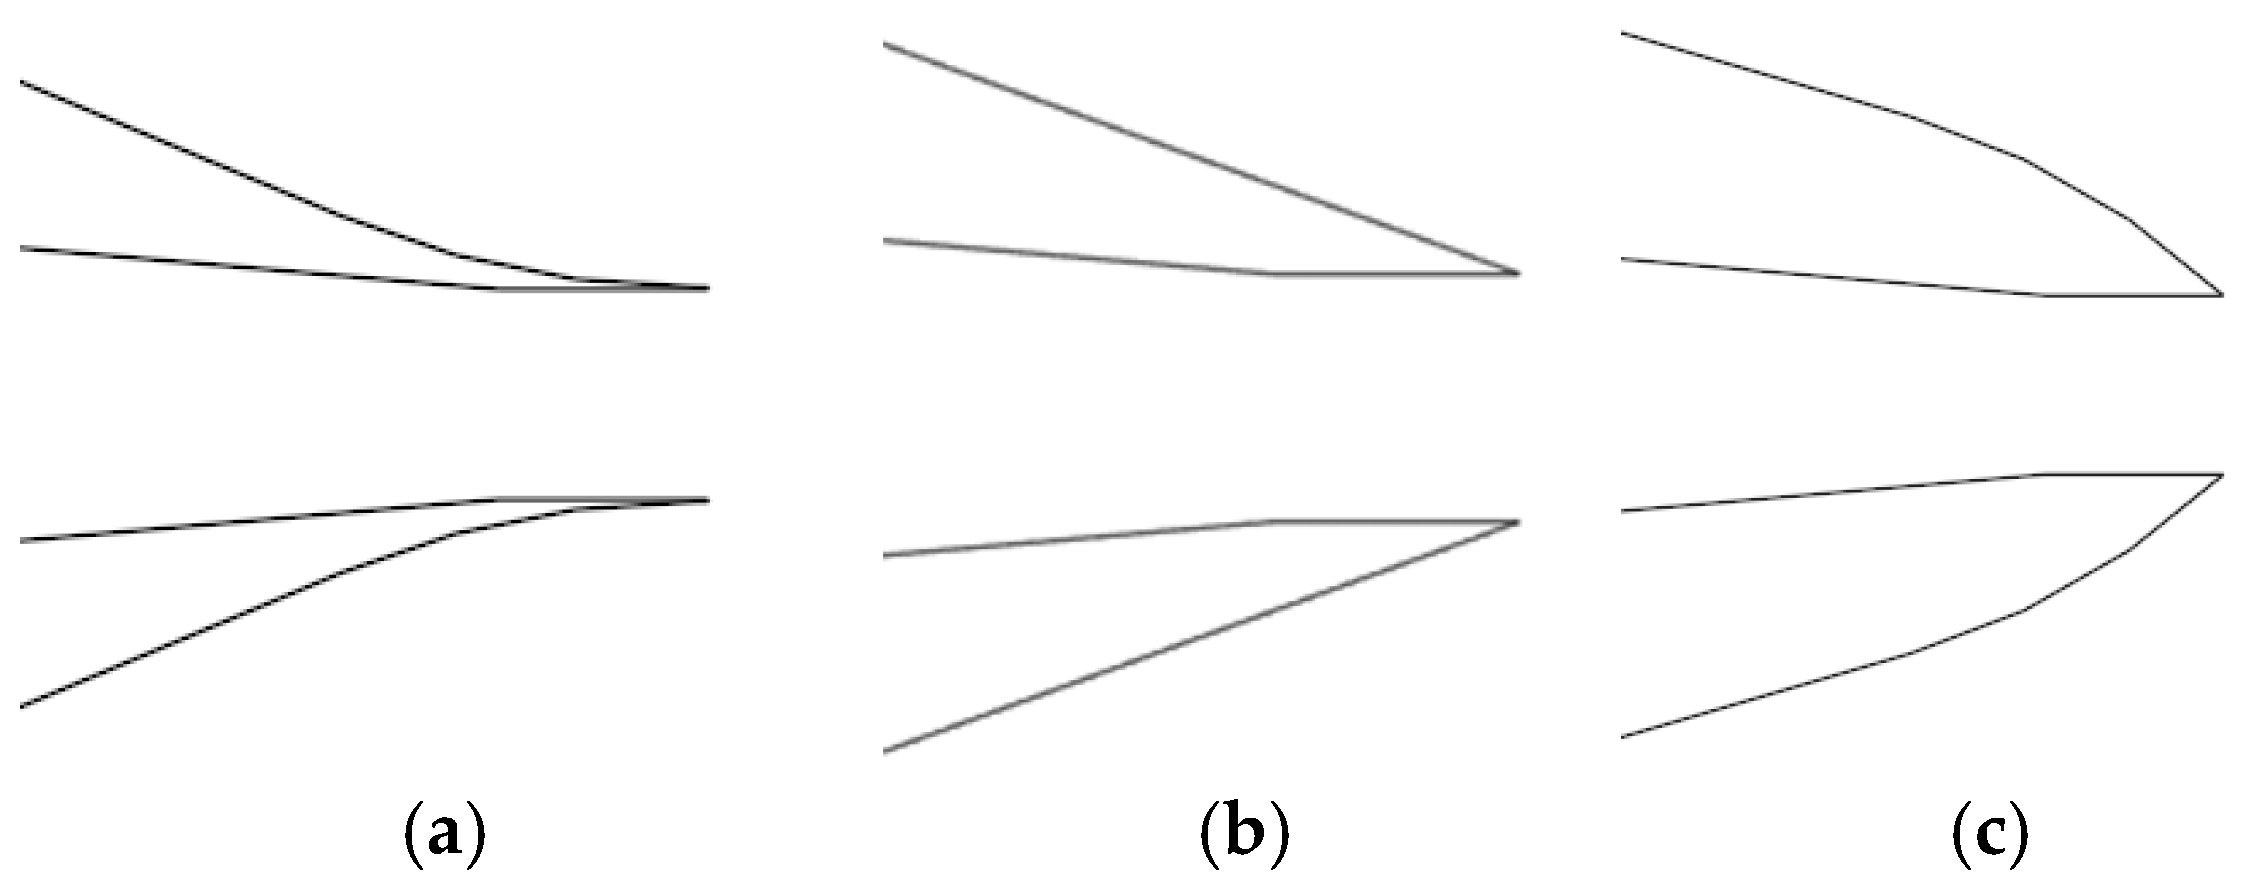
The nozzle is the first place where the working fluid of the ejector mixes with the ejector fluid, and its geometric configuration significantly affects the performance of the ejector. After the nozzle diameter is determined by the Sokolov design method, it is necessary to further optimize the flow field near the nozzle. As shown in
Figure 12, nozzles are divided into convex, concave, and linear shapes according to their different external profiles. The optimal nozzle structure is determined by changing the curvature (
K) of the concave and convex surfaces. At 9 mm for NXP, 7 mm for d
m, and 9 for
lm/
dm, seven nozzle profiles with different curvatures were selected for simulation analysis, in which negative curvature represented a concave shape, positive curvature represented a convex shape, and curvature of 0 represented a straight line shape.
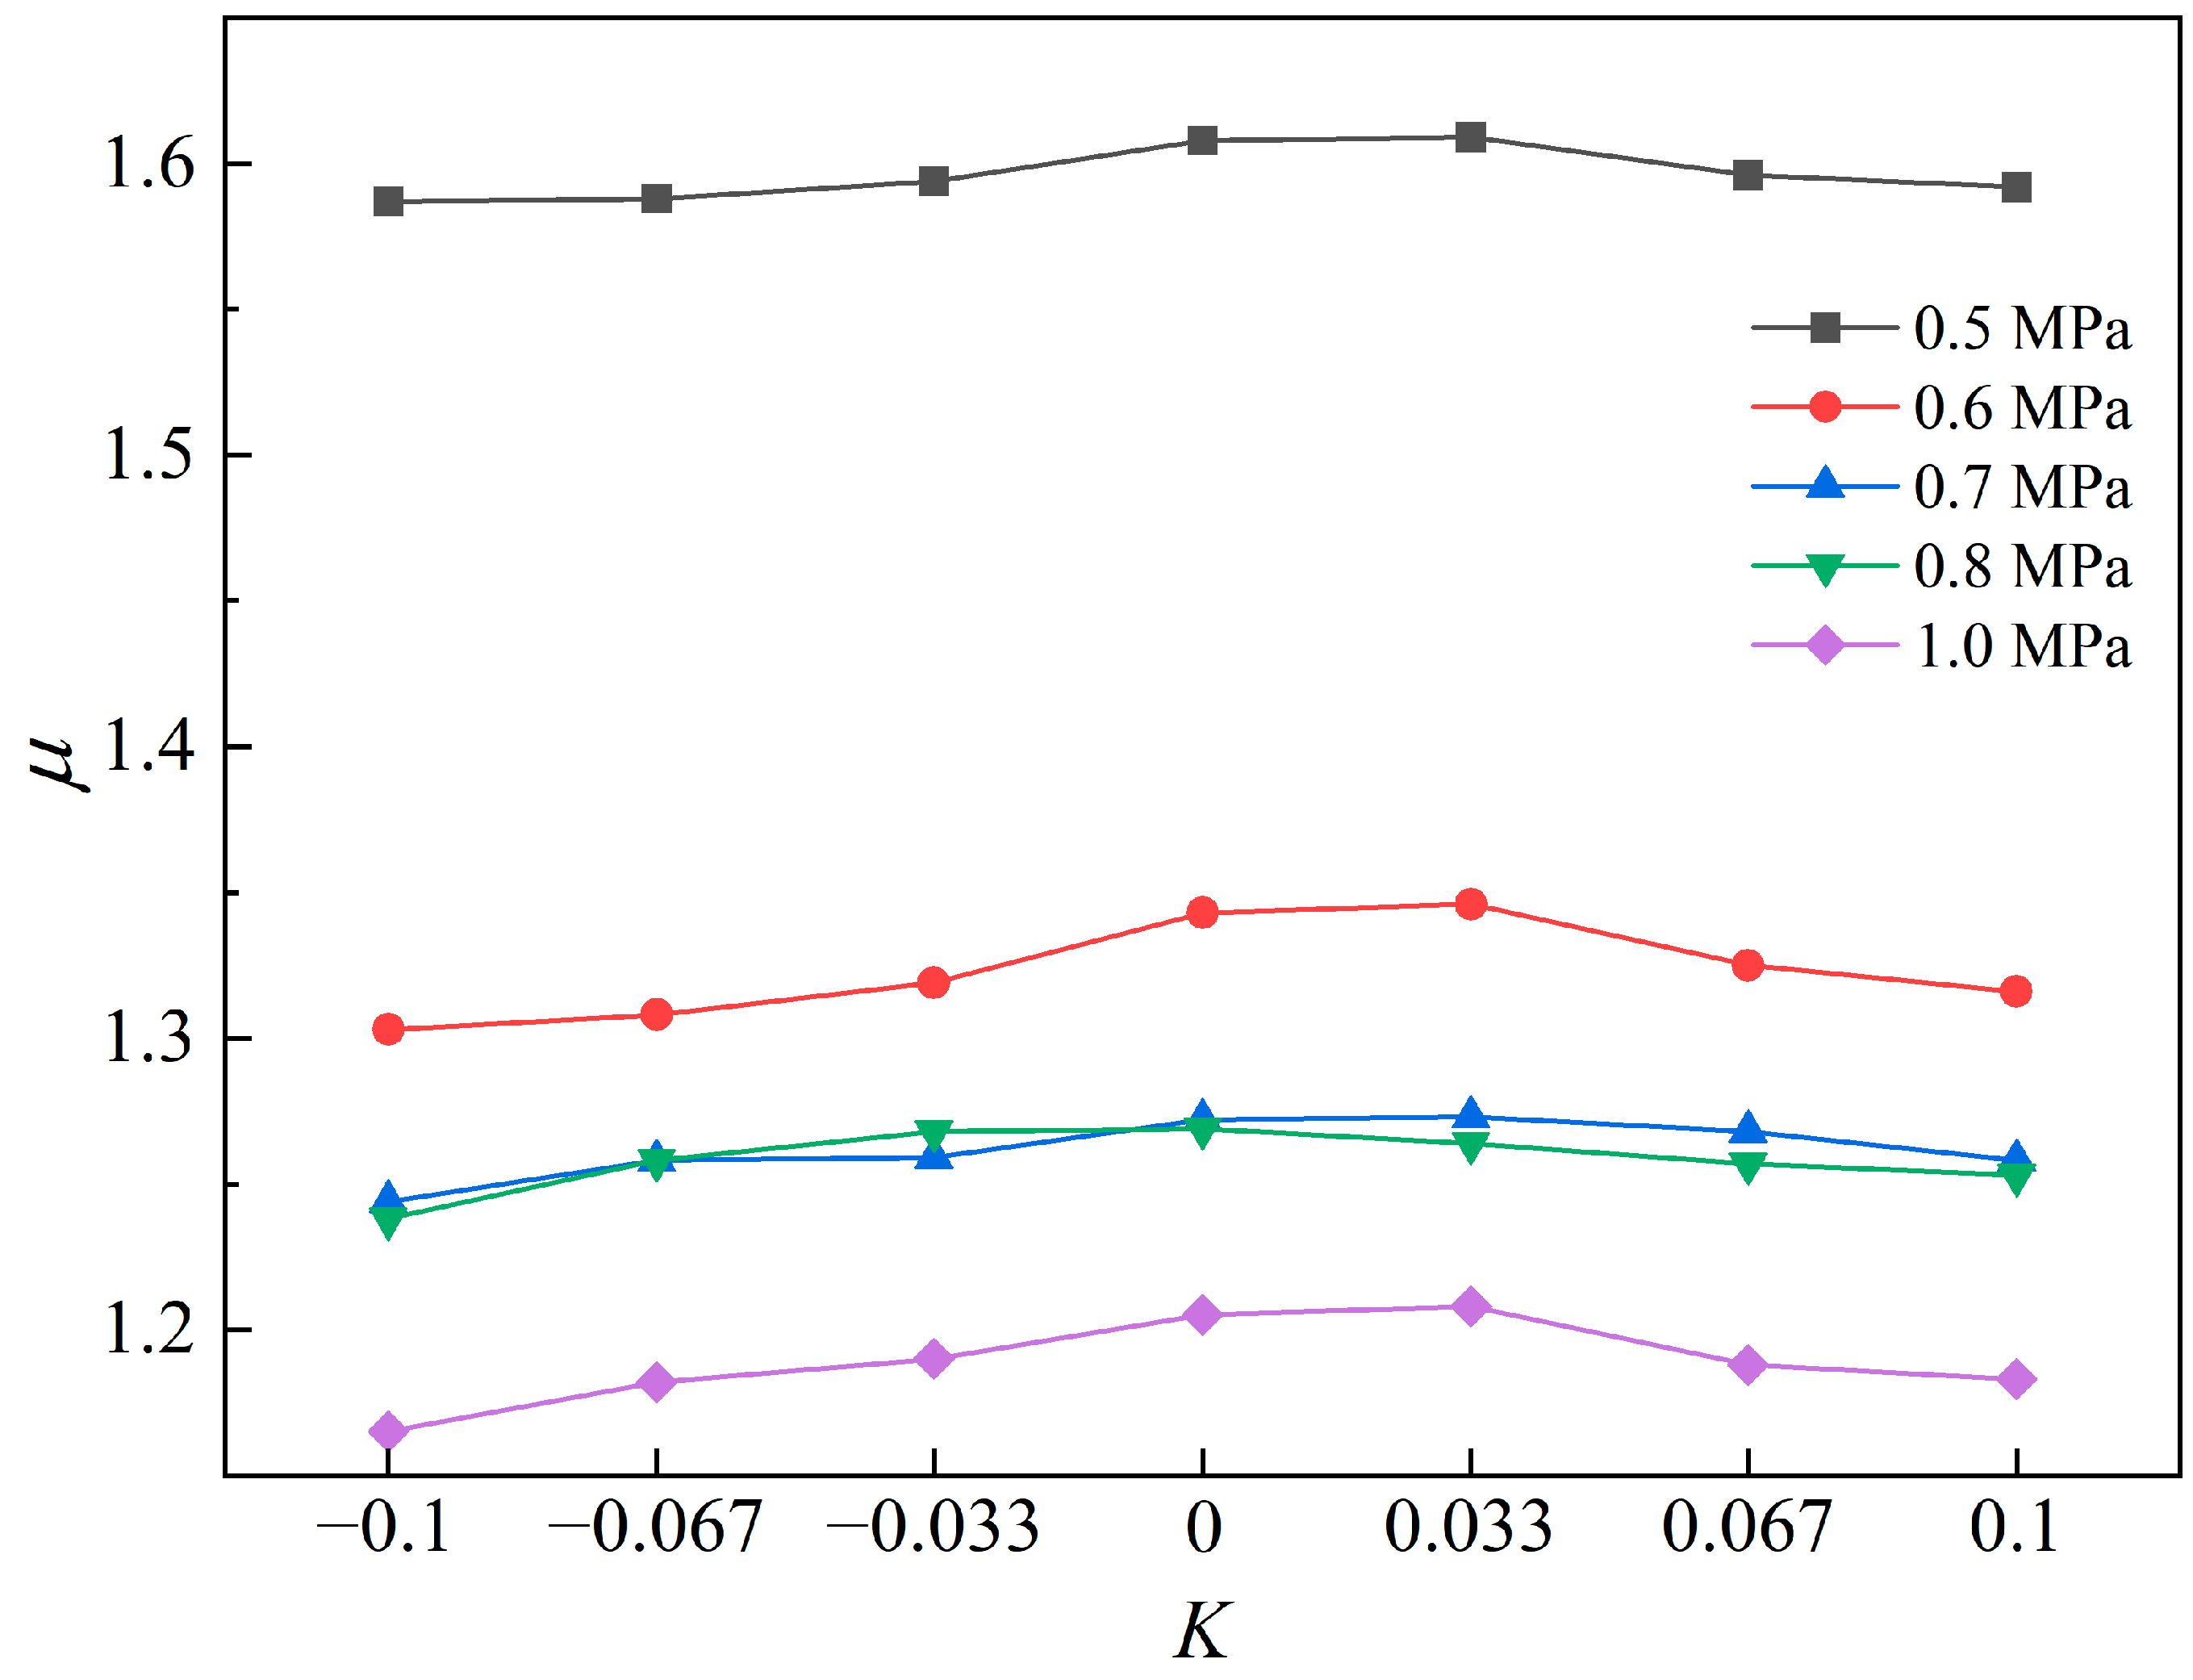
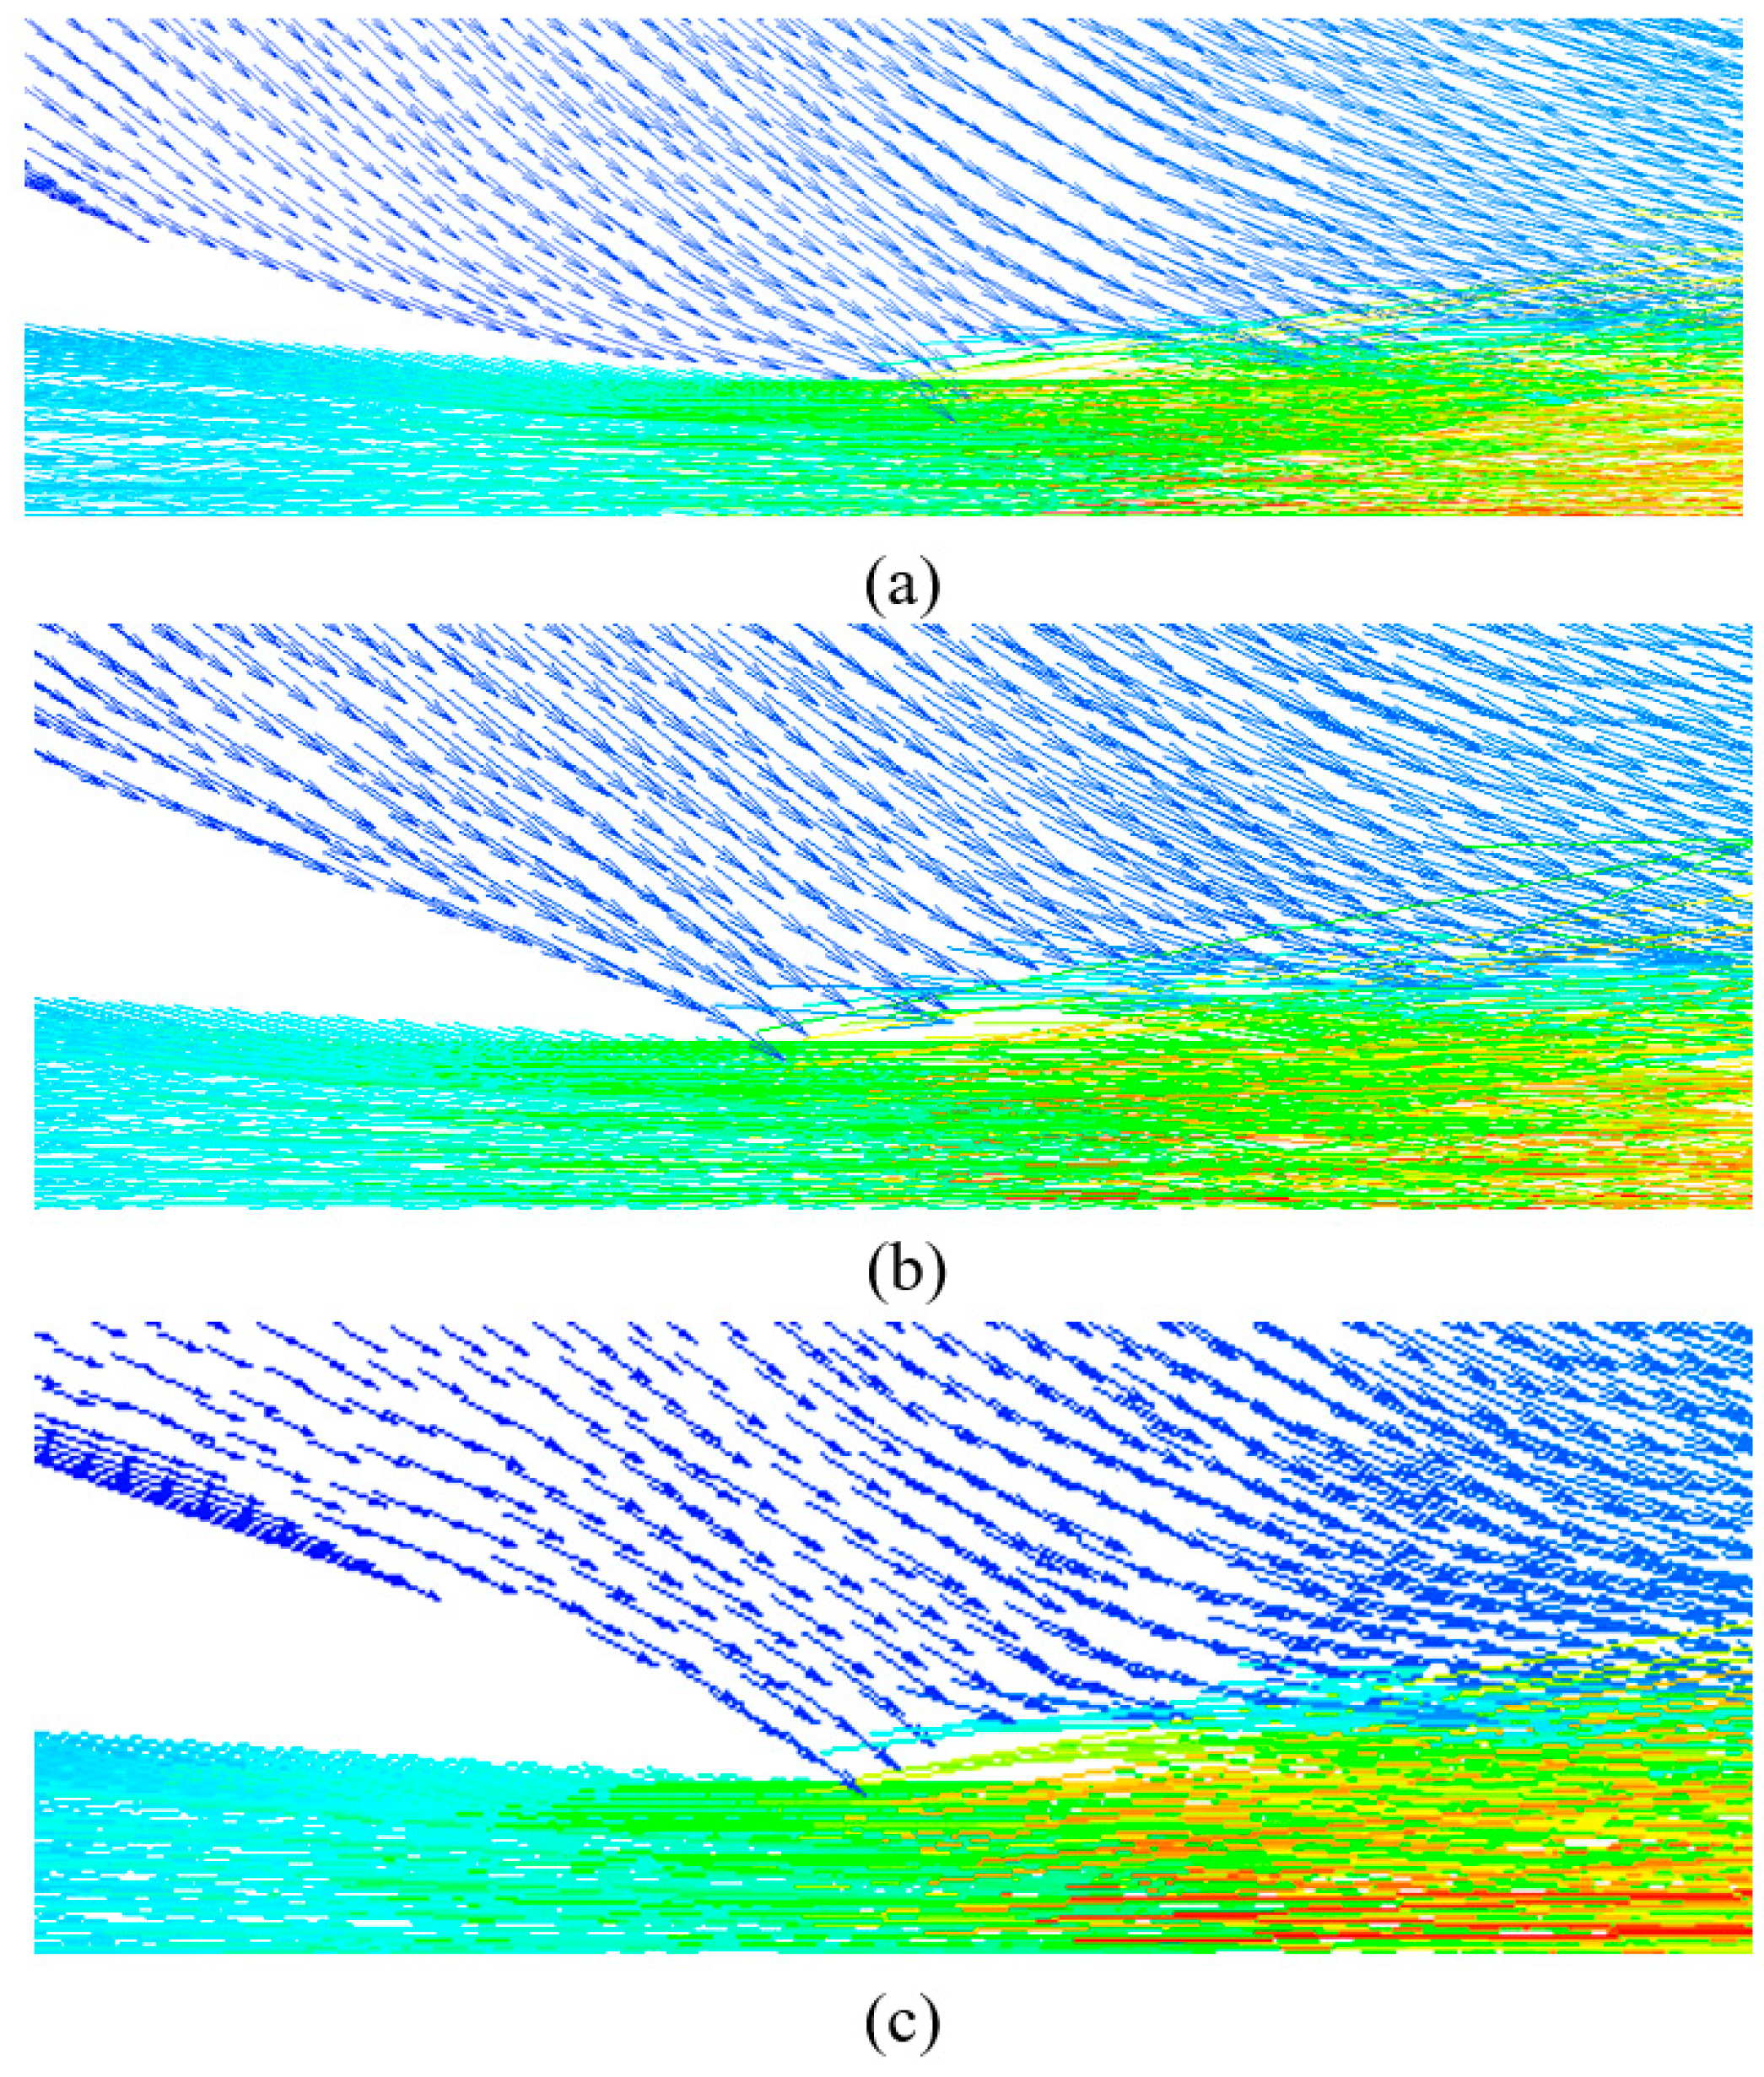
The influence of nozzle outer profile curvature on the ejection ratio under different working conditions is illustrated in
Figure 13. It is found that, from concave to convex profile, the ejection ratio initially ascended and then descended, and the maximum ejection ratio was reached near 0 curvature. As can be seen from
Figure 14, the shape of the outside profile of the nozzle could affect the flow angle of the ejecting fluid at the exit of the nozzle. As a result, the change in the flow field near the nozzle affected the mixing effect of the initial contact between the working fluid and the ejector fluid.
According to the relationship between ejection ratio and curvature in
Figure 13, it can be observed that the change in ejection ratio was not significant when the curvature changed from 0 to 0.033. The reason for this phenomenon was that the peak value of the ejection ratio existed between curvature 0 and 0.033. In order to further explore the relationship between curvature and ejection ratio and determine the optimal nozzle profile curvature, the method of fitting simulation data was used to obtain the expression of nozzle profile curvature and ejection ratio at rated power. Then, the optimal curvature from the expression could be calculated. When the curvature
K under the rated power was between −0.1 and 0.1, the simulation data could be fitted through Origin to obtain the expression of the ejection ratio
μ relative to the curvature
K of the outside profile of the nozzle:
According to Equation (3), it can be further determined that the ejection ratio reached the maximum of 1.21 at the optimal curvature of 0.02.
4.5. Comparison of Optimization Results of Ejector Structure
A comparison of the structural parameters and the ejection ratio of the ejector before and after optimization is presented in
Table 3.
The optimized ejection ratio at rated operating conditions reached 1.21, which was 9% higher than that before optimization. Compared with other optimization schemes, this scheme achieved an ejection ratio of 1.21 after optimizing the structural parameters, which was higher than the 0.9 ejection ratio of the scheme in reference [
12] after optimizing the structural parameters. Therefore, the optimization scheme of the ejector in this article can significantly improve the utilization rate of unreacted hydrogen gas.
5. Experimental Verification
Based on theoretical calculations and simulation optimization of the ejector structure parameters, the actual ejector was machined, as shown in
Figure 15. This was made of AL6061 material (Produced by Wuxi Jiahang Technology Co., Ltd. in Wuxi, China) with good formability and moderate strength, which could meet the working conditions of the ejector.
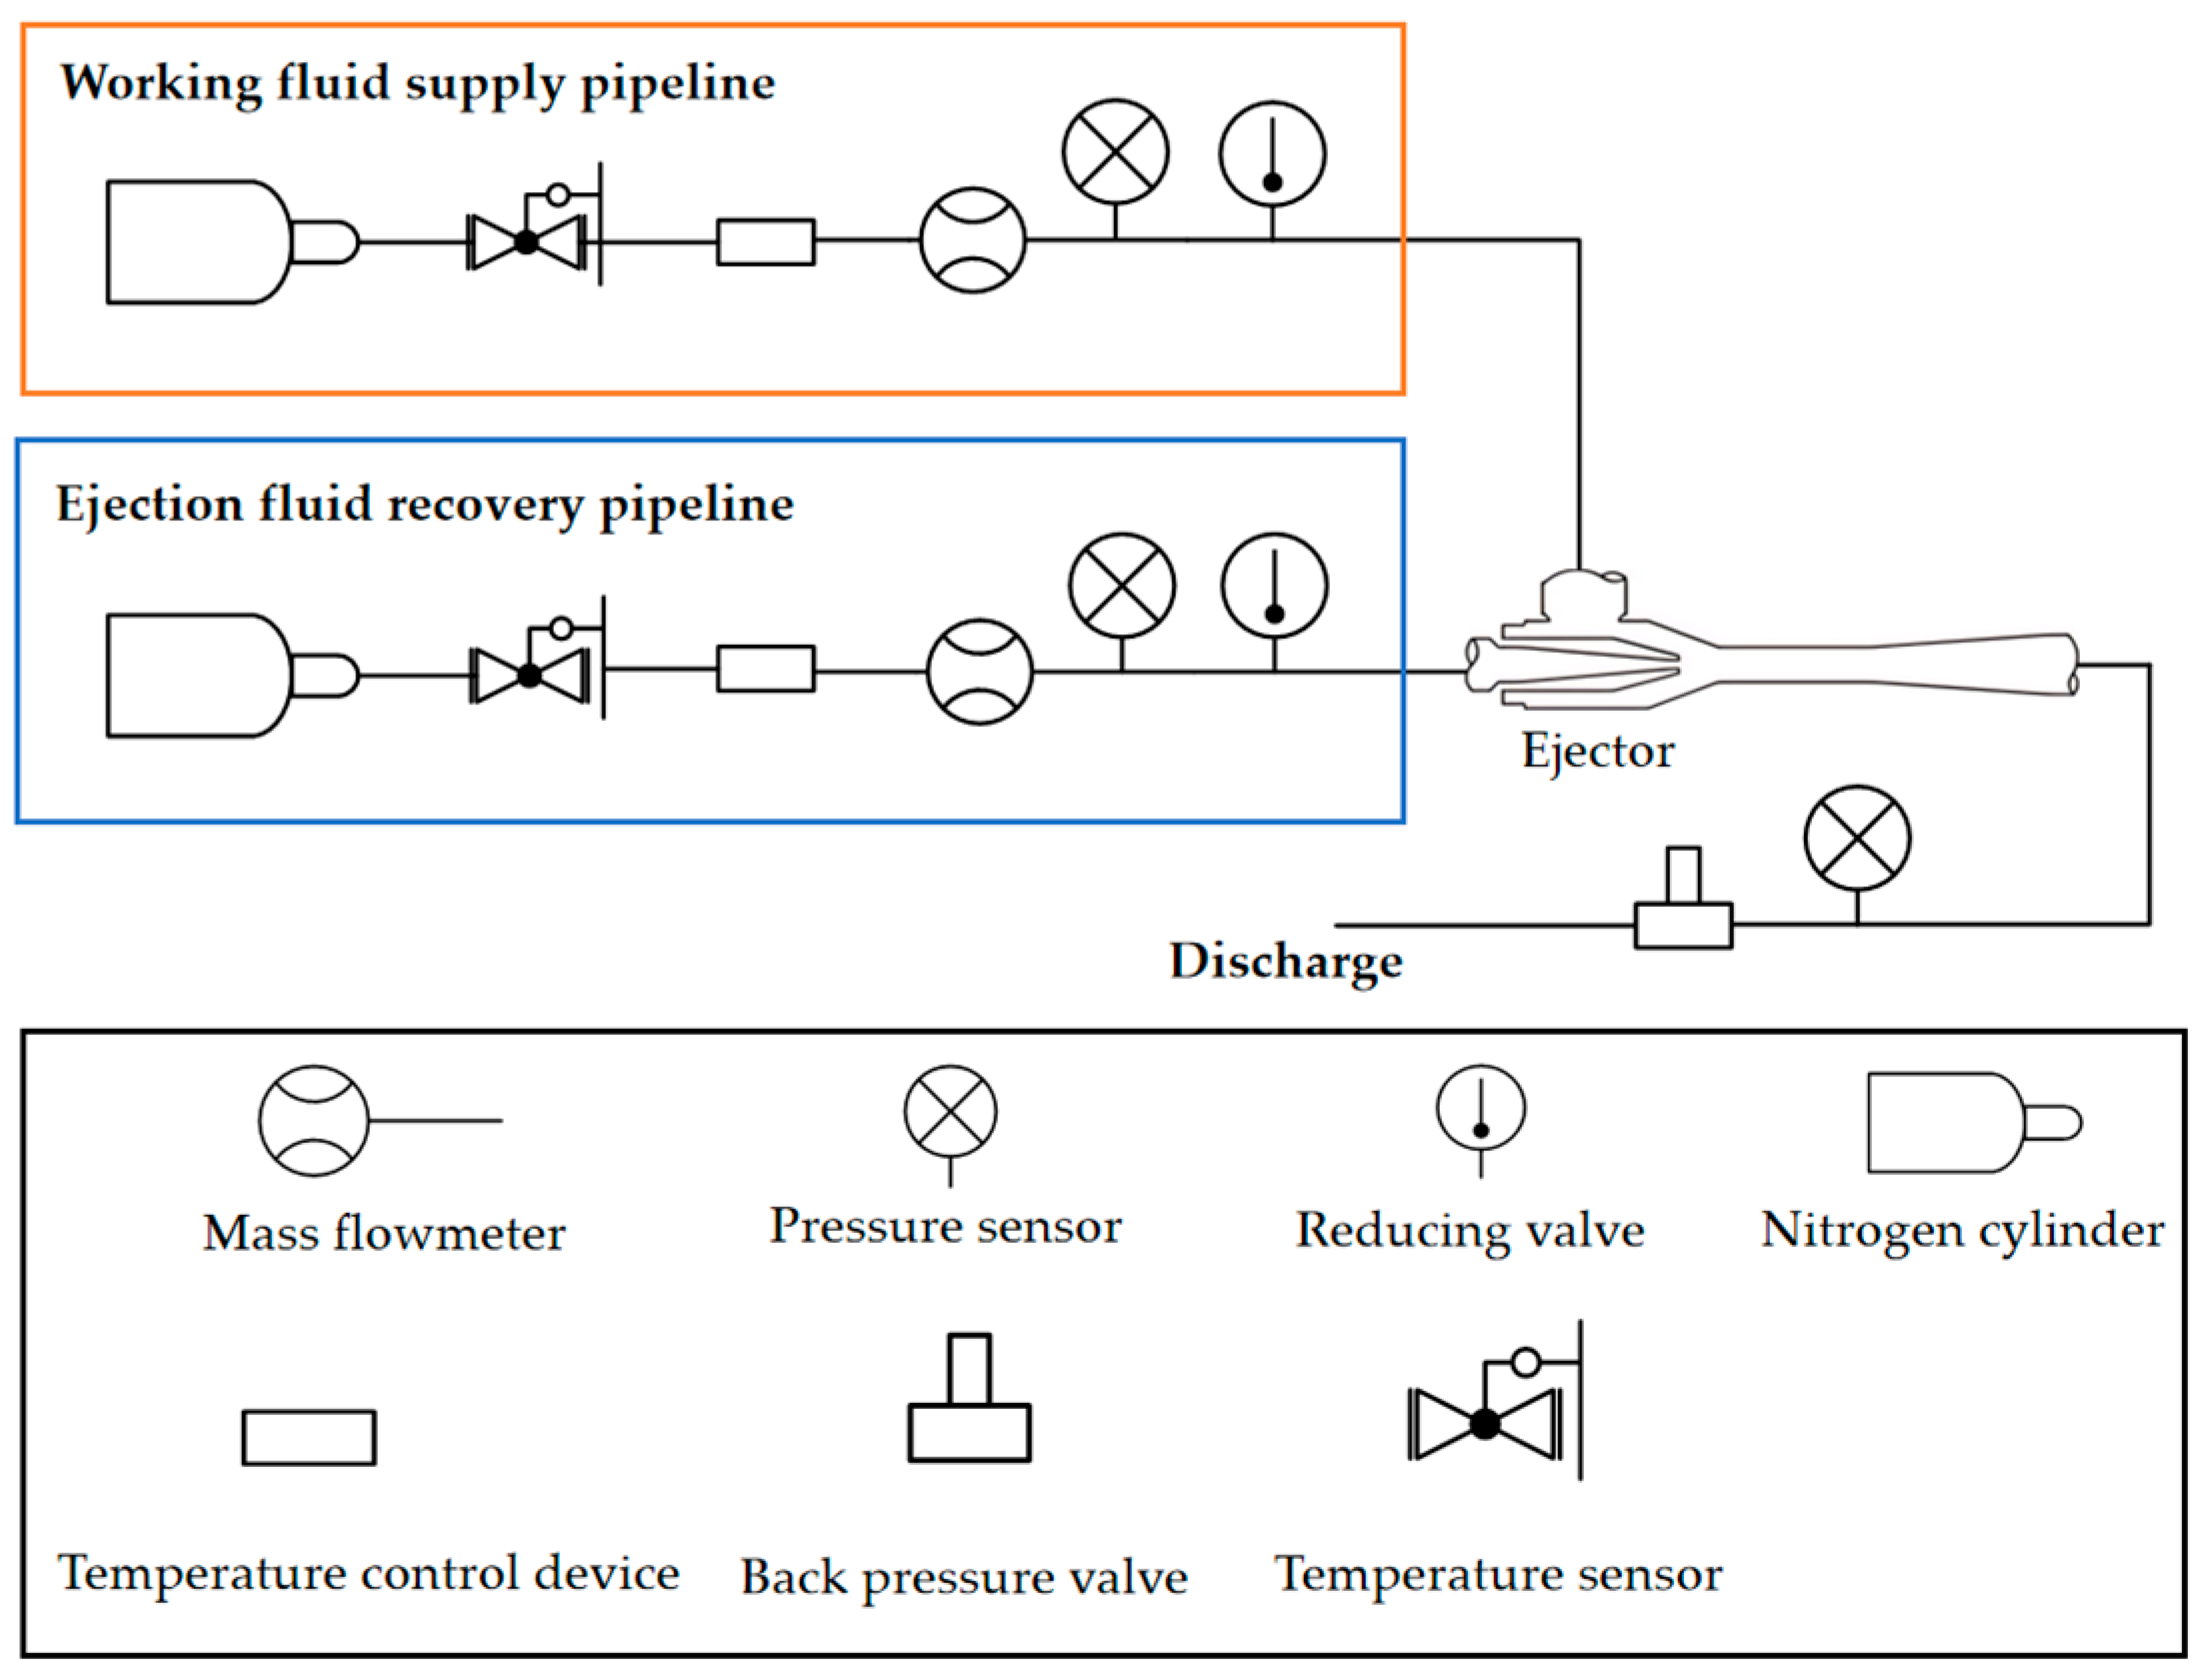
After machining the actual ejector, a test bench was built as shown in
Figure 16 for ejector performance testing. In order to ensure the safety of the experiment, nitrogen was used throughout the experiment. The high-pressure nitrogen gas in the nitrogen cylinder flowed into the working fluid inlet after passing through the pressure-reducing valve, temperature-regulating device, pressure sensor, mass flow meter, and temperature sensor. This simulated the hydrogen supply pipeline of the PEMFC anode inlet working fluid. The high-pressure nitrogen gas in another nitrogen cylinder also flowed into the ejection fluid inlet after passing through the pressure-reducing valve, temperature-regulating device, pressure sensor, mass flow meter, and temperature sensor. This simulated the recovery pipeline of residual hydrogen gas at the anode outlet of PEMFC. Two fluids were mixed in the ejector and flowed out from the mixed fluid outlet of the ejector, and then discharged through the back pressure valve.
To obtain the required pressure, the pressure of the working fluid and ejection fluid was controlled by adjusting the pressure-reducing valves in the hydrogen supply and recovery pipelines during the experiment, and the pressure of the mixed fluid was controlled by adjusting the back pressure valve. At the same time, both the hydrogen supply pipeline and the recovery pipeline would flow through the temperature-regulating device, and the required fluid temperature could be obtained through the action of the high-temperature medium or cooling water circuit inside the device. The pressure value was collected and transmitted through pressure sensors, the flow rate was collected and transmitted through mass flow meters, and the temperature was collected and transmitted through temperature sensors. The pressure sensor selected in the experiment had a measurement range of 0–5 MPa and an accuracy of ±0.25%. The measurement range of the mass flowmeter was 10-1000 SLPM (Standard Liter Per Minute), with an error of less than 0.8% RD ± 0.2% FS. The measurement range of the temperature sensor was −50 °C to 150 °C, with an accuracy of ±0.3 °C. The ejector test bench is shown in
Figure 17.
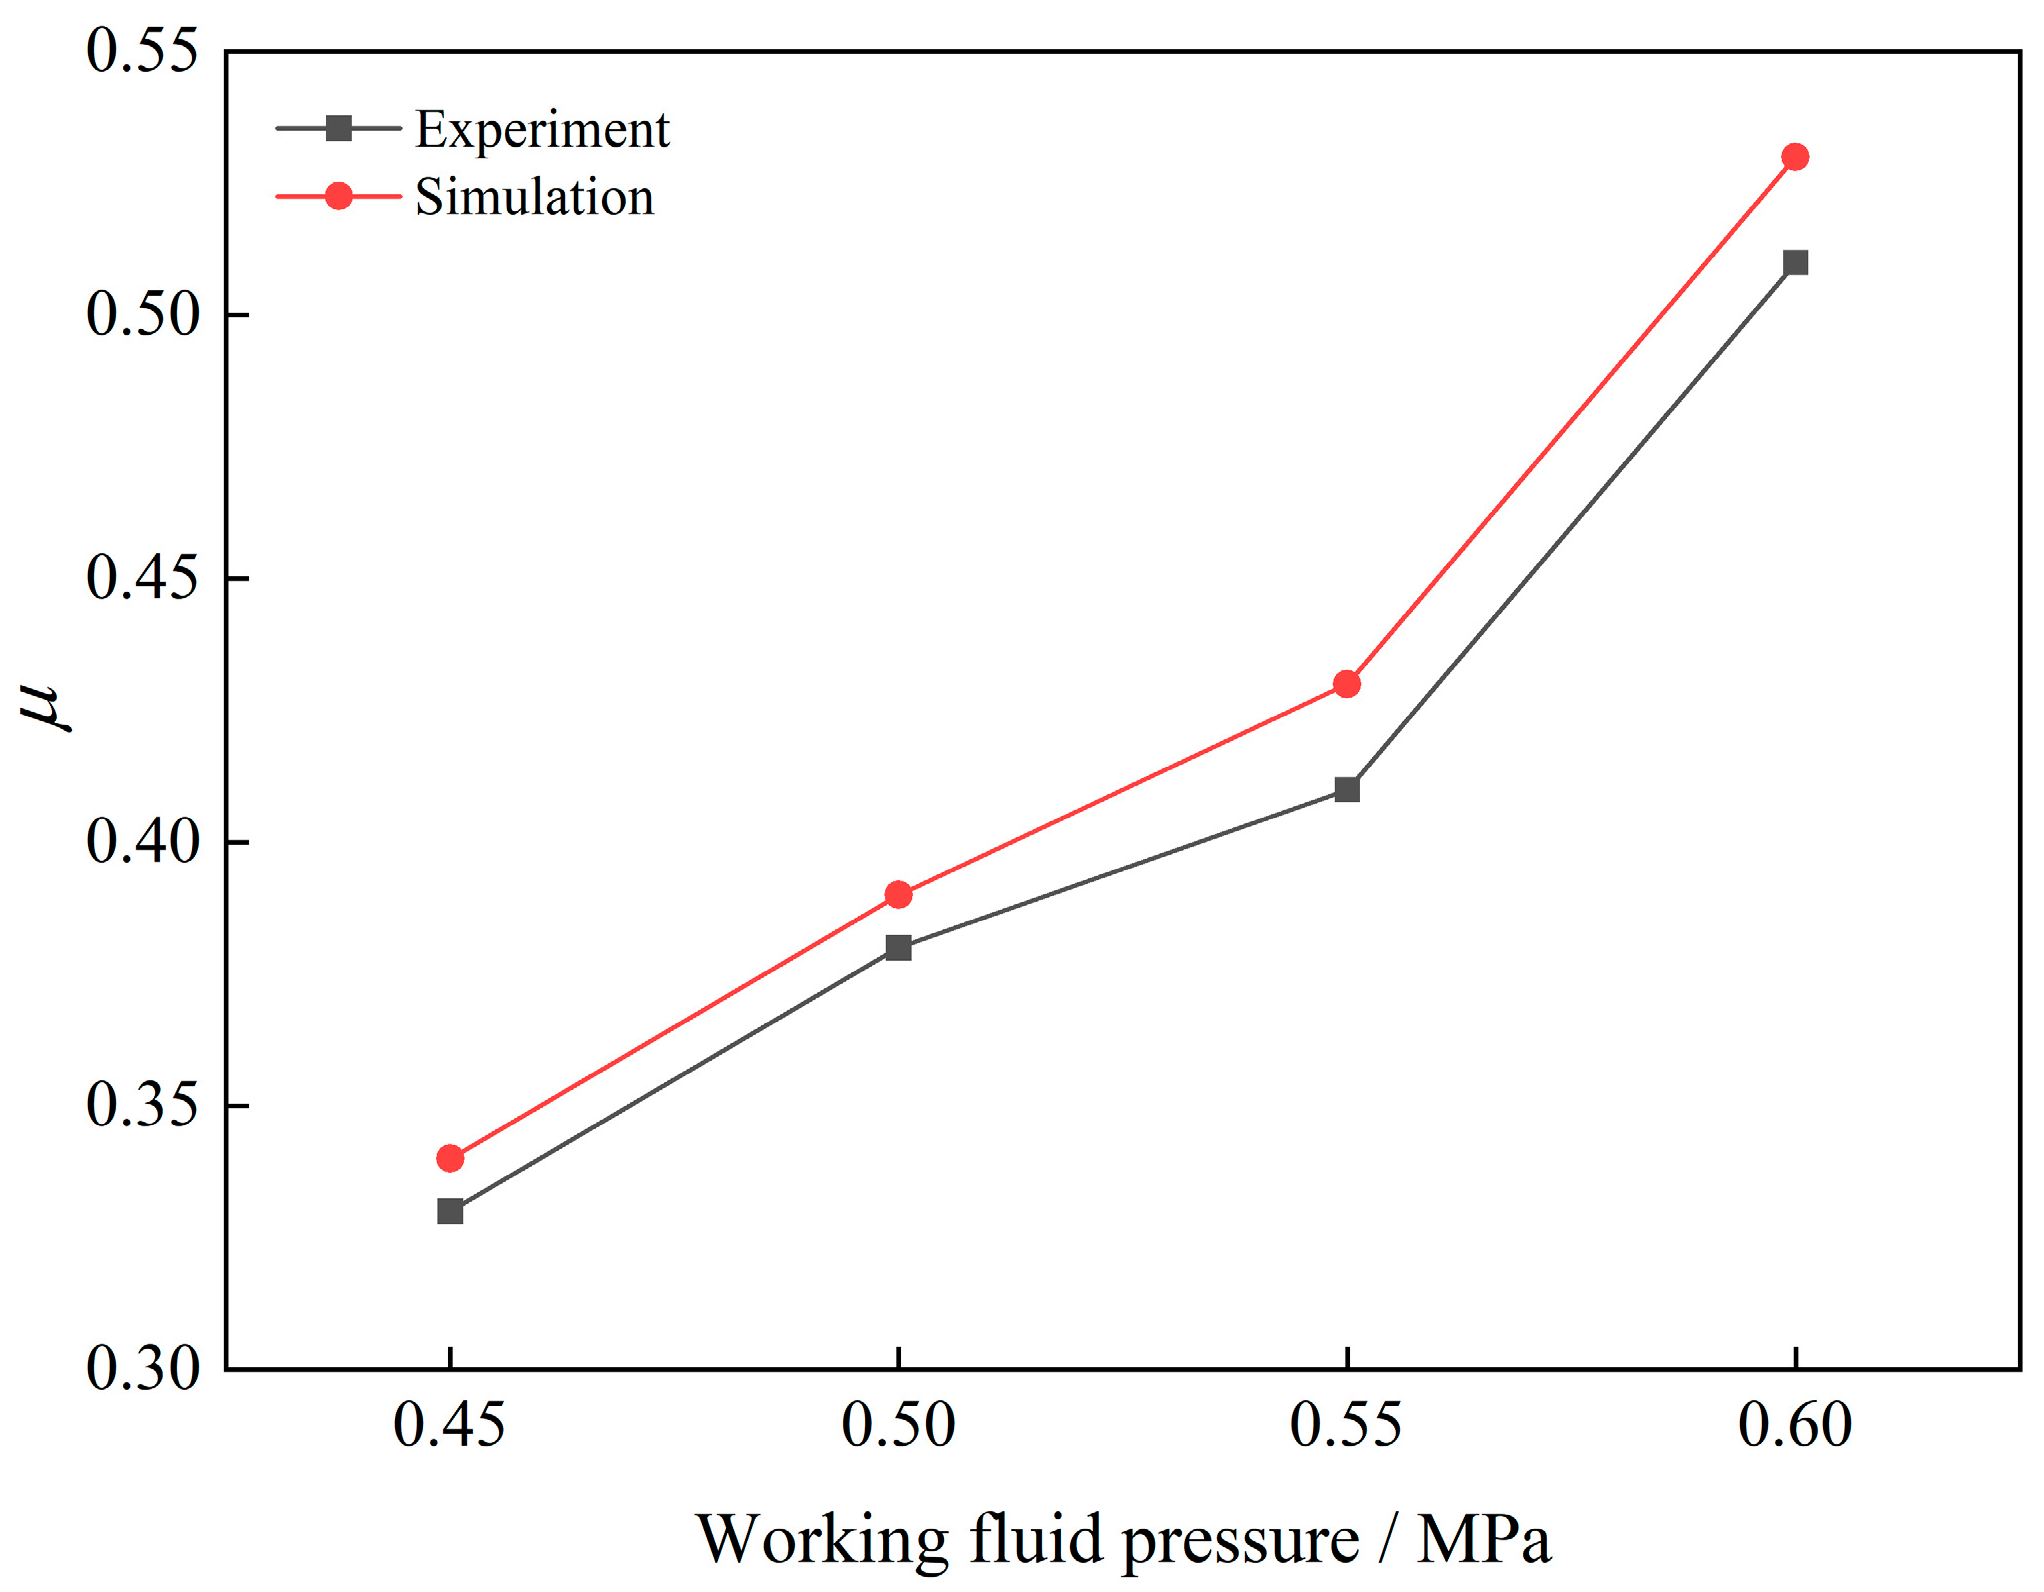
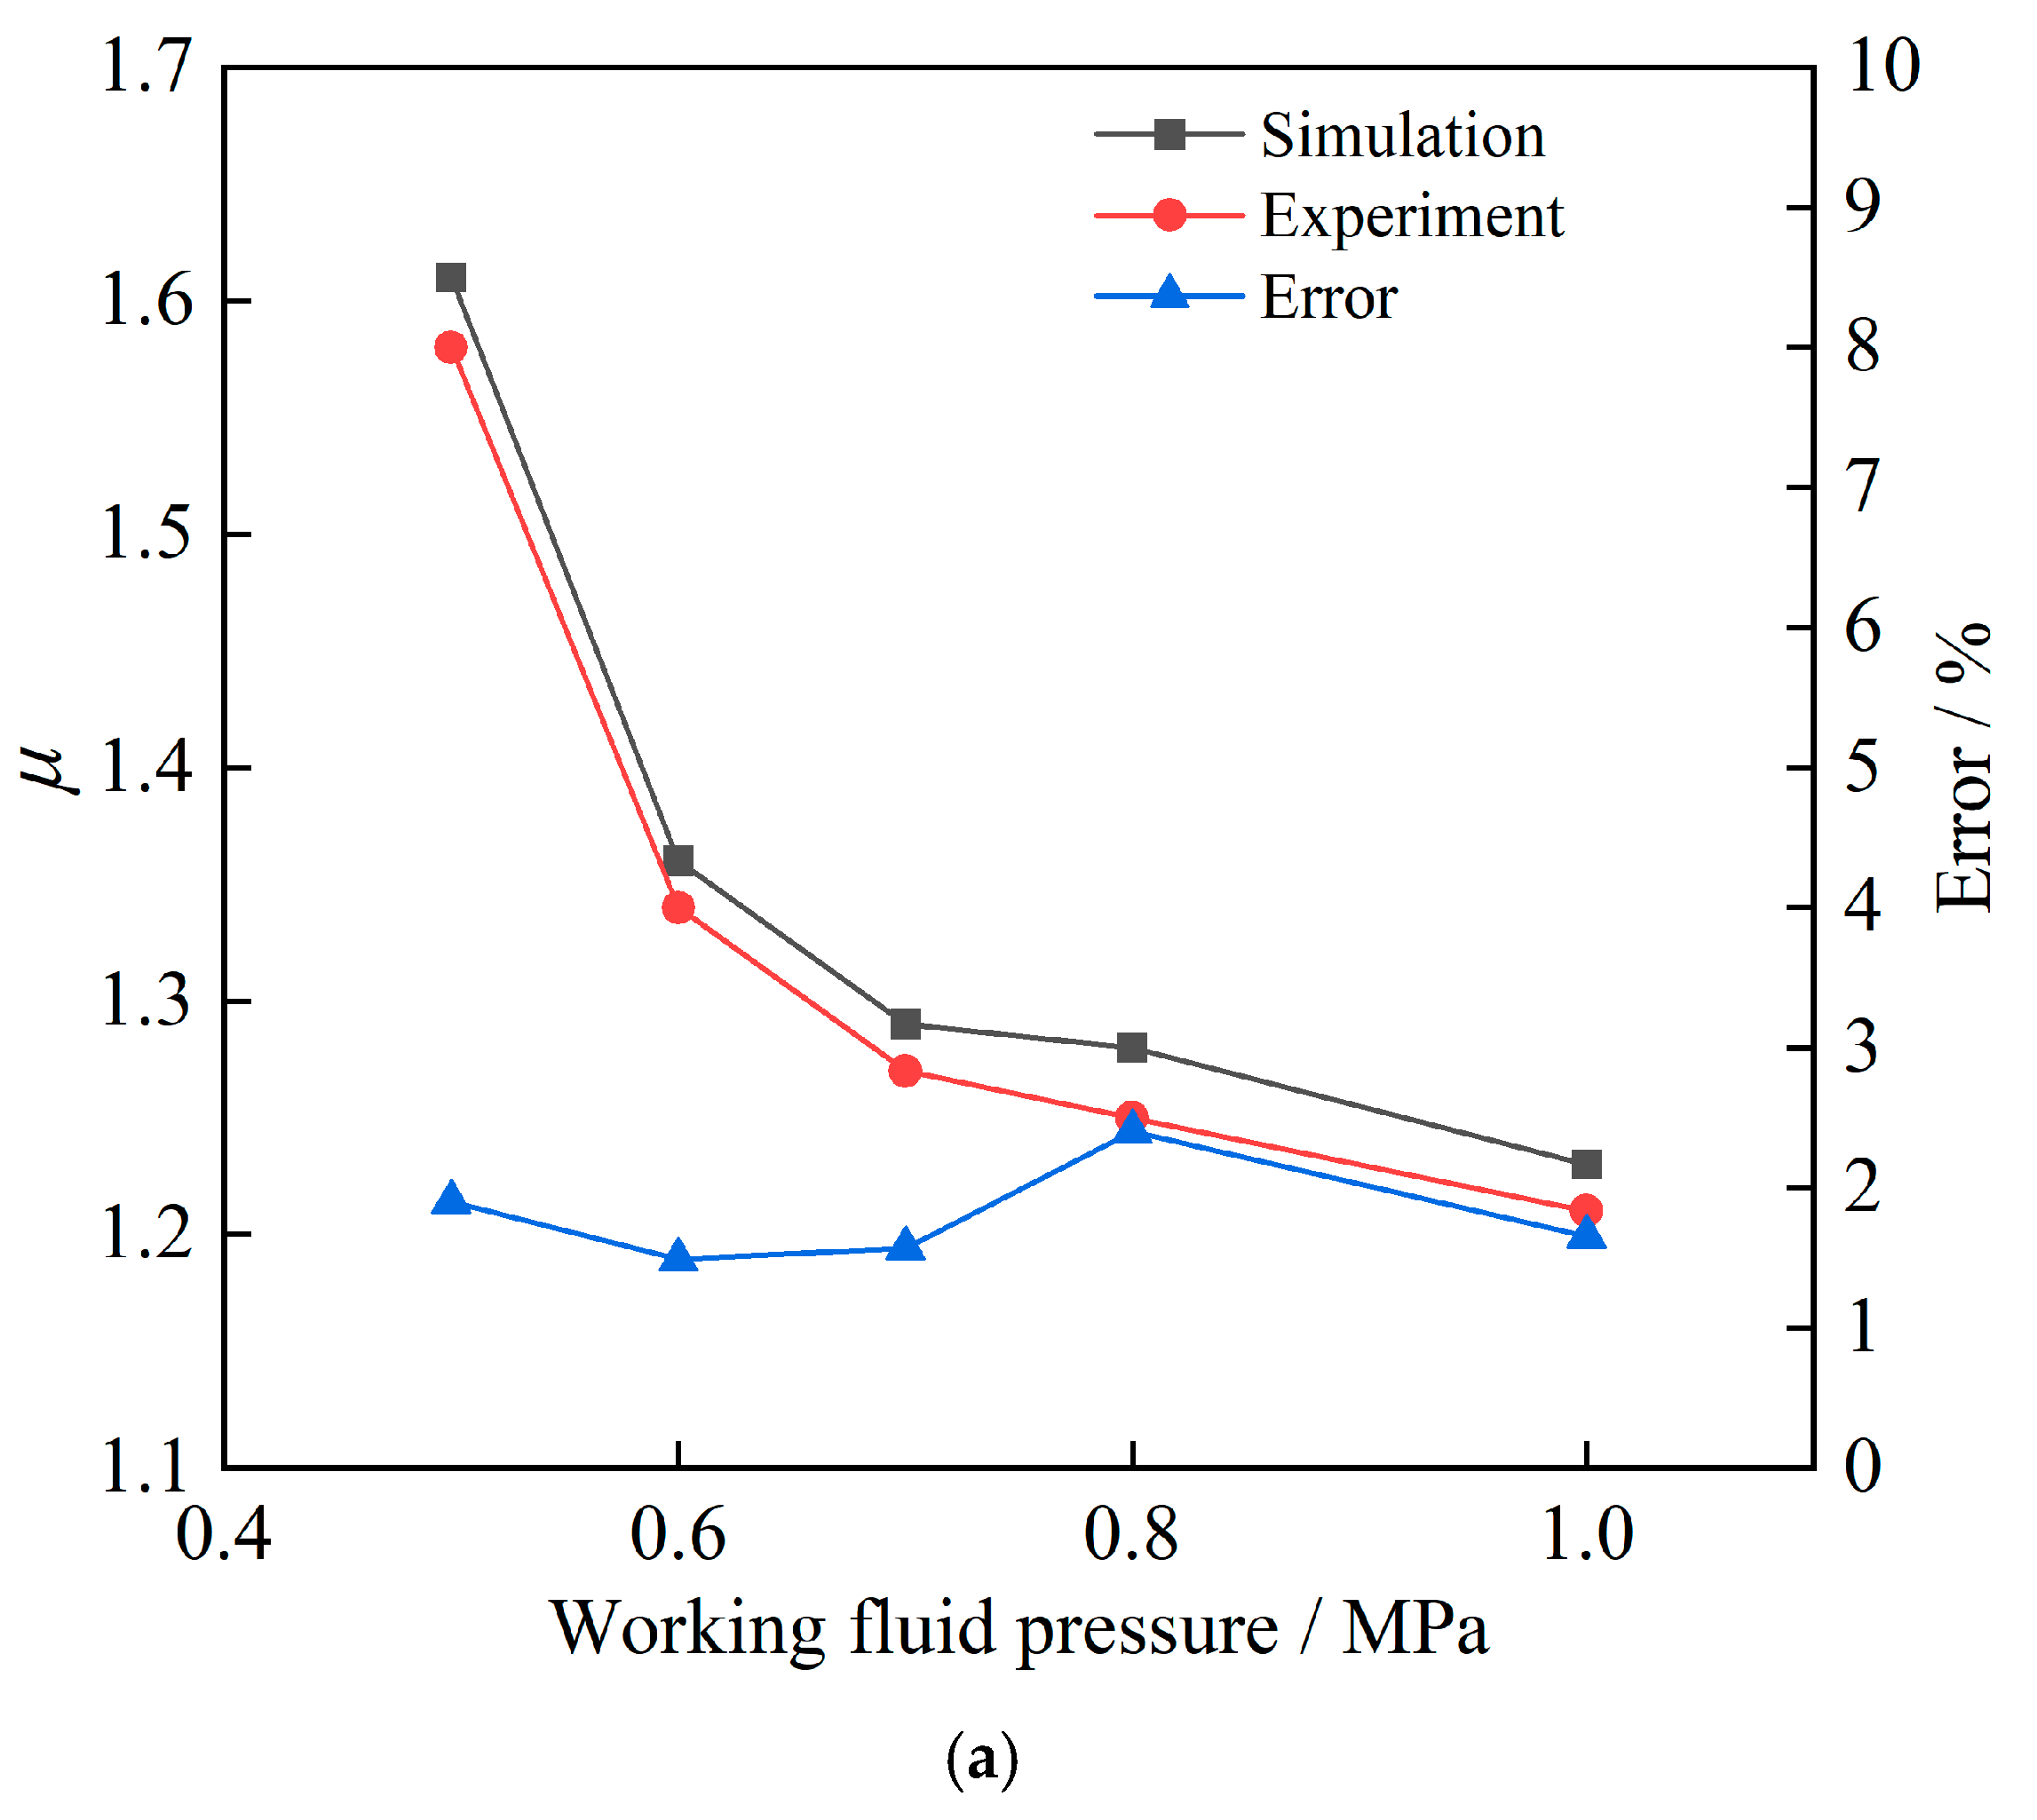
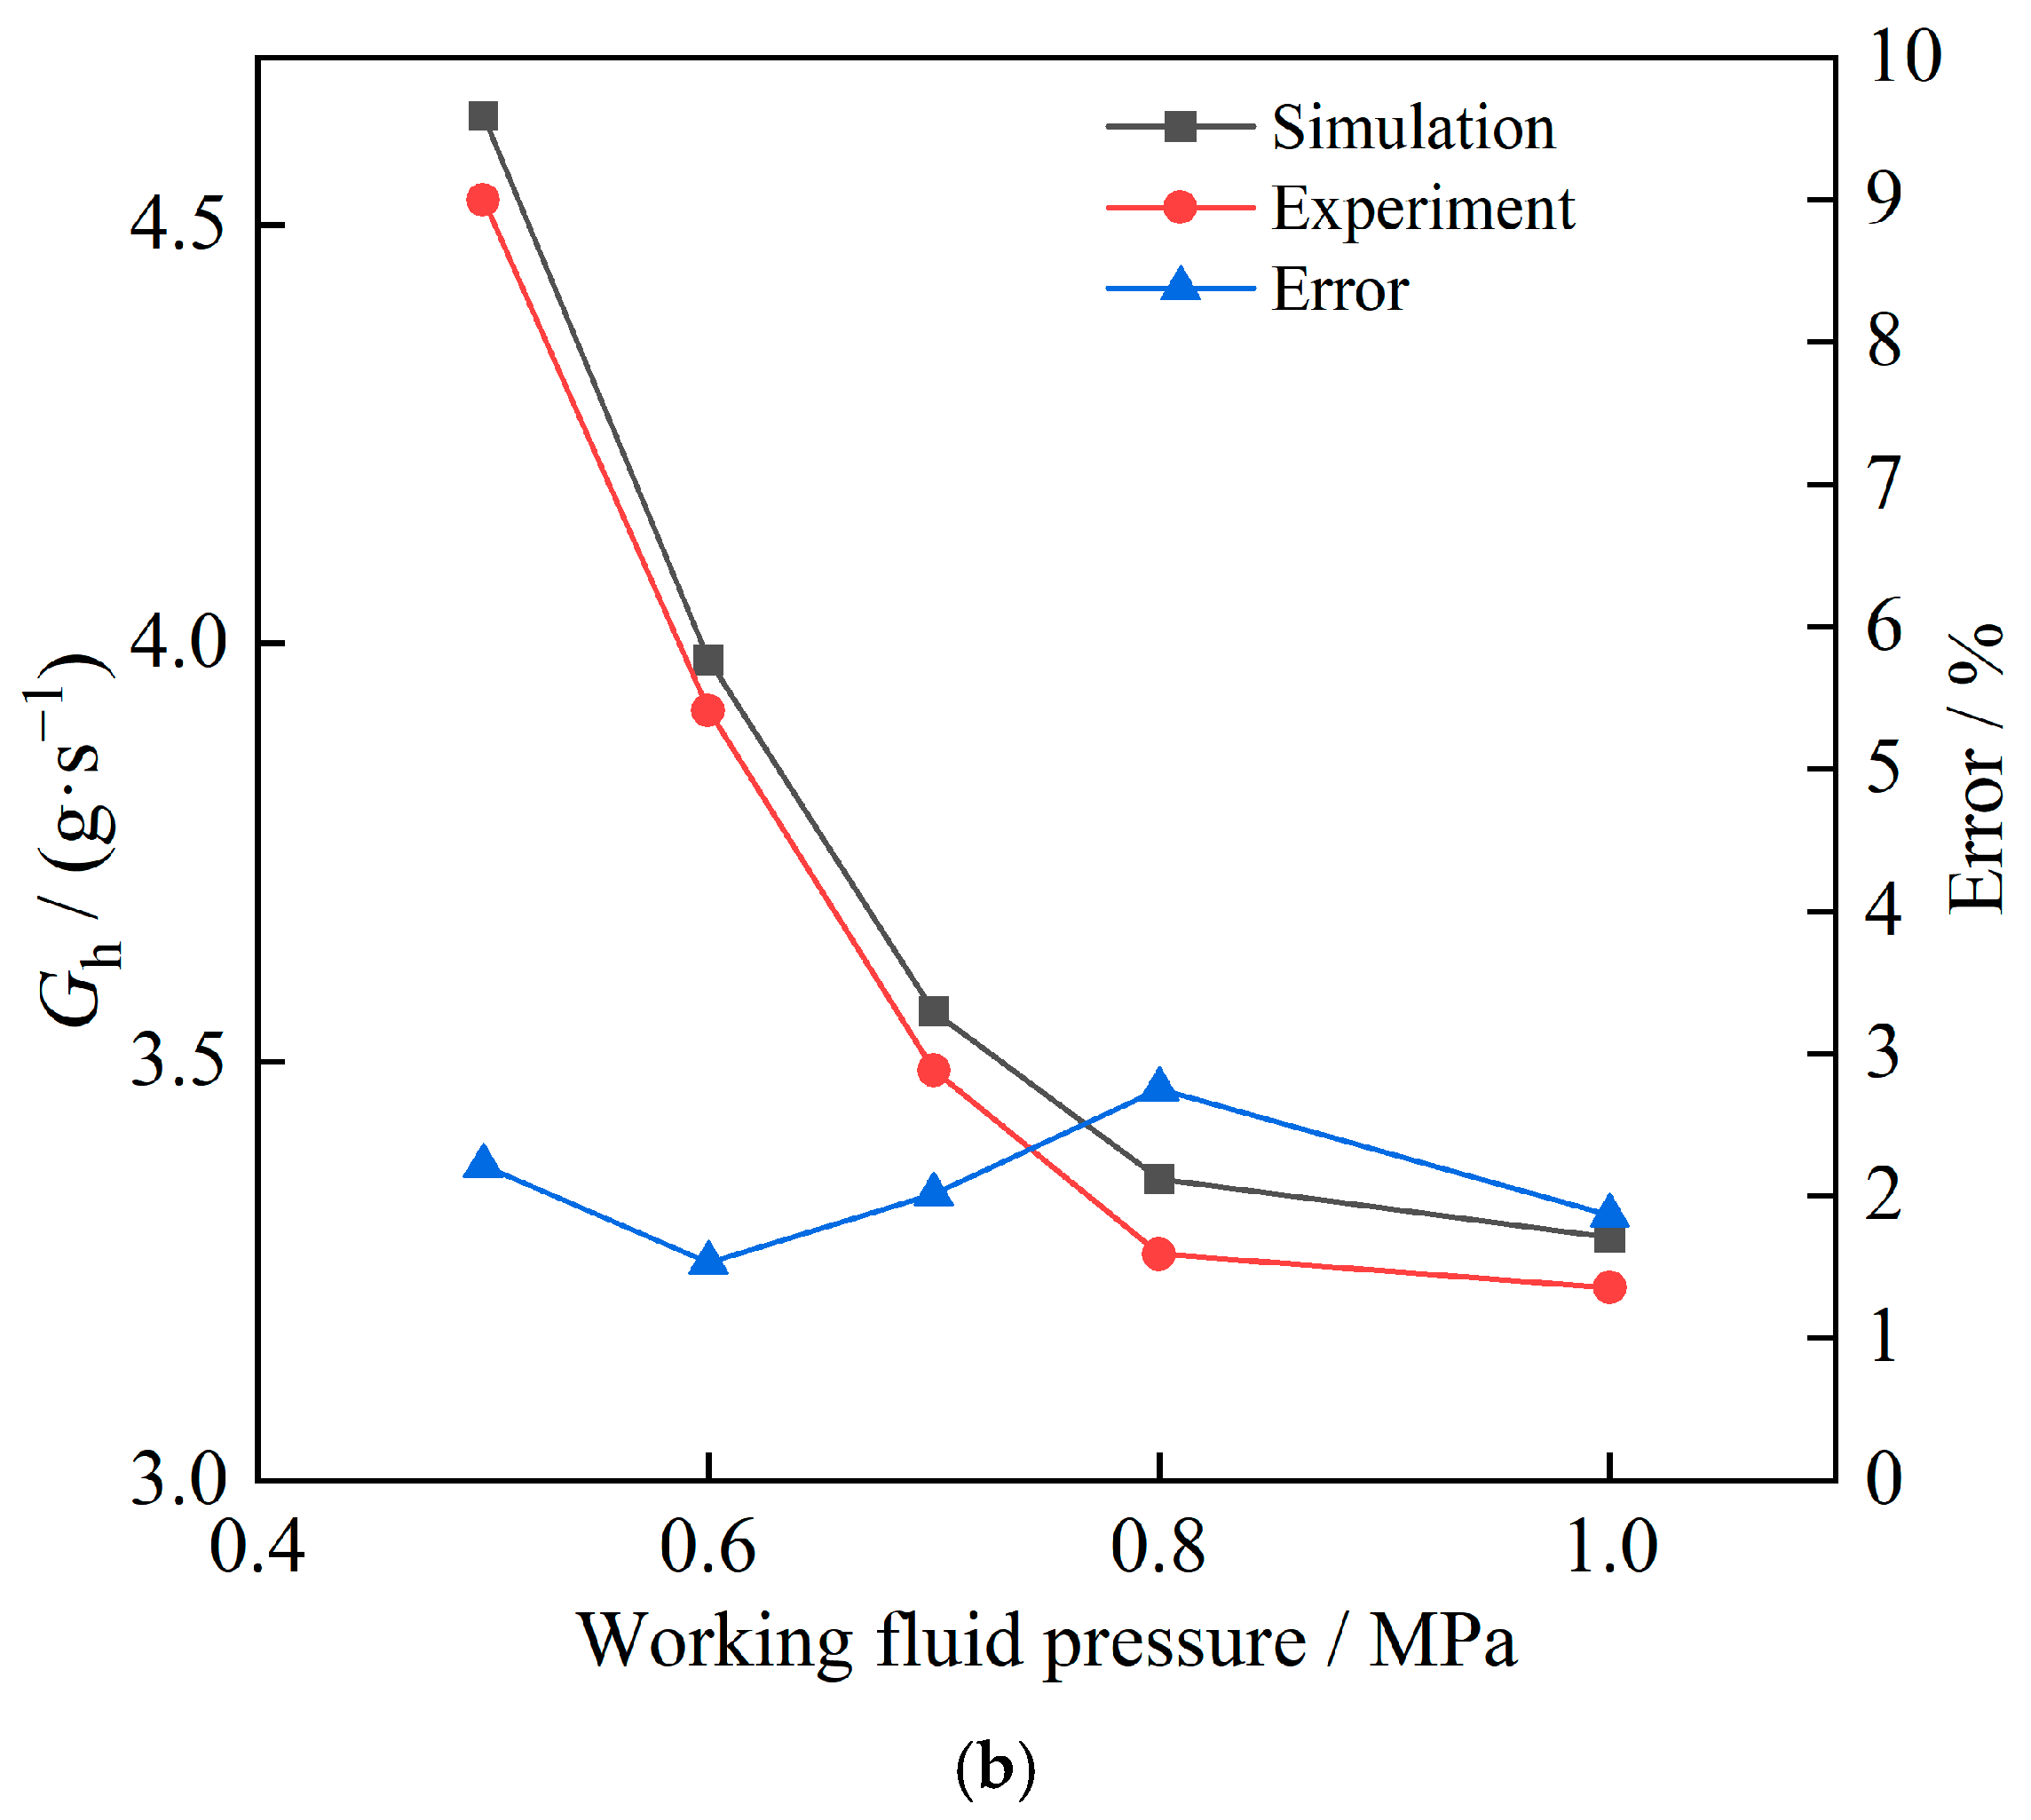
Based on the measurement data from various sensors, the experimental data curve of ejection ratio and ejection flow rate can be obtained. A comparison between the experimental and simulated ejector flow and ejector ratio is illustrated in
Figure 18. The maximum errors between the simulated and experimental ejection fluid mass flow rate and ejection ratio were 2.75% and 2.44%, respectively. These results can verify the correctness of the simulation.


