Abstract
Climate change exerts substantial impacts on human society and the carbon cycle of terrestrial ecosystems. Studying the spatiotemporal characteristics of regional climate change and its impact on carbon sequestration is an important topic in ecology and environmental science. This study utilized meteorological and land use/cover data to explore these dynamics. Statistical methods such as the Mann–Kendall (M-K) test and wavelet analysis were used to simulate the changes in annual average temperature and precipitation in the Poyang Lake Basin from 1980 to 2020. The Carnegie–Ames–Stanford Approach (CASA) model was used to estimate the interannual variation in net primary productivity (NPP) in the region over the past 40 years. Additionally, the present study examined the influence of various factors on NPP changes. The main results are as follows: (1) Over the past four decades, the average temperature in the Poyang Lake Basin was 17.85 °C, while the average precipitation was 1621.35 mm. The average annual temperature rises at a rate of 0.27 °C per decade. (2) A significant shift in the average annual temperature occurred in the early 21st century, and annual precipitation exhibited multiple abrupt changes during the mid-to-late 1990s. Both temperature and precipitation changes follow a 25-year cycle, with temperature hotspots located in the south and precipitation hotspots in the northeast. (3) The impact of climate change on the change in NPP in the Poyang Lake Basin is about 70%, with the annual average temperature having a significant effect on the increase in NPP. This study can provide a scientific foundation for formulating policies aimed at mitigating climate-related disasters and enhancing carbon cycling in terrestrial ecosystems.
1. Introduction
With the rapid development of urbanization, climate change has emerged as a common and pressing challenge for human society. Climate change affects every aspect of social life [1,2,3]. For example, in mid-September 2019, a tropical storm-induced rainstorm triggered a large-scale flood in southeastern Texas, the United States, seriously affecting the lives of about 6.6 million people [4]. In late June 2021, an unprecedented heatwave struck the Pacific Northwest region of Canada and the United States, breaking historical temperature records and reaching new highs of 49.6 °C. The resulting impacts included hundreds of deaths, widespread marine life mortality, and an increased incidence of wildfires and other hazards [5]. Therefore, it is crucial to accurately depict the patterns of temperature and precipitation changes on both temporal and spatial scales.
The industrialization process, driven primarily by fossil fuel combustion and land use changes during human development, has disrupted the carbon balance among Earth’s spheres, contributing to climate change [6,7,8,9]. In recent decades, terrestrial ecosystems have become an essential sink for atmospheric carbon dioxide, playing an irreplaceable role in mitigating the increase in atmospheric carbon dioxide concentrations and slowing global temperature rising [10,11]. However, the carbon cycle of terrestrial ecosystems is highly sensitive to climate change [12,13]. Studies have shown that the decline in tropical forest productivity caused by drought will lead to more carbon being released from tropical forests into the atmosphere, further accelerating climate change [14,15]. Moreover, the increased frequency of precipitation events can intensify soil erosion, exacerbating the transport and deposition of soil organic carbon, which alters the size and spatial distribution of terrestrial carbon sources and sinks [16,17]. Therefore, accurately understanding and assessing the impact of climate change on terrestrial ecosystem carbon sinks is a major scientific issue of widespread concern to the domestic and international academic community, governments, and the public. It will also provide an important scientific basis for improving human society’s ability to respond to and adapt to climate change.
In recent years, with the advancement of technology, carbon sink level observation techniques and carbon sink intensity assessment methods applicable to different spatiotemporal scales have been continuously developed and improved. According to the sources of data and the principles of modeling methods, terrestrial ecosystem carbon sequestration methods can be divided into two types: “bottom-up” and “top-down” [18]. The “bottom-up” approach mainly utilizes ground survey data and meteorological observation data to simulate regional or global terrestrial ecosystem carbon sinks using modeling methods, including ground survey and inventory methods for surface vegetation biomass and soil carbon, vorticity correlation methods, ecological process models, and other methods. This method is based on direct observation data at the sample or grid scale, which presents a more accurate simulation of local carbon sinks and can better reflect the spatial heterogeneity of ecosystems. However, there is uncertainty in the process of expanding from sampling points to regional scales, especially in areas with strong spatial heterogeneity of ecosystems, and long-term observed inventory data are scarce in certain ecosystems (such as wetlands), which may lead to biased regional scale summary results [19,20,21,22]. The “top-down” approach mainly utilizes carbon assimilation inversion technology, based on atmospheric greenhouse gas concentration observations from different platforms (ground-based platforms, aerial remote sensing platforms, satellite remote sensing), combined with meteorological field data and atmospheric radiative transfer models to calculate the carbon sink strength of terrestrial ecosystems. This method can be applied to global or regional scales, providing continuous and large-scale estimates of carbon sinks. It can also provide almost real-time information on carbon sink changes, which helps monitor and evaluate policy effectiveness. However, there may be uncertainties in atmospheric transport models and inversion algorithms, which can affect the accuracy of carbon sink estimation. The complex processes of terrestrial ecosystems may not be fully considered [23,24,25,26,27].
The Carbon Assimilation and Sequestration (CASA) model is a typical “top-down” simulation model used to simulate and estimate carbon exchange processes in terrestrial ecosystems, including photosynthesis, respiration, and carbon allocation. This model has been widely applied in carbon cycle research [28,29]. It is a process model that can simulate the response of ecosystems to environmental changes and is applicable to various types of ecosystems such as forests, grasslands, and shrubs, as well as to temperate, tropical, and cold climate conditions. It can also be combined with remote sensing data to estimate large-scale carbon sinks. Compared to other complex models, the CASA model requires relatively less input data during runtime. Based on the above reasons, we used the CASA model for simulation in this study.
Poyang Lake, located inland near China’s southeast coast, is the country’s largest freshwater lake. The Poyang Lake Basin is densely populated, socio-economically developed, and rich in natural resources, making it a crucial area for biodiversity conservation [30,31]. However, previous studies have not sufficiently analyzed the extent to which climate change affects carbon sequestration in this region. This study aims to simulate the characteristics of climate change in the Poyang Lake Basin over the past 40 years using meteorological data. Furthermore, the changes in net primary productivity (NPP) of vegetation in the watershed over the past 40 years were calculated using the CASA model, and the impacts of climate change and land use change on NPP changes were distinguished.
2. Materials and Methods
2.1. Data Sources and Overview of Study Area
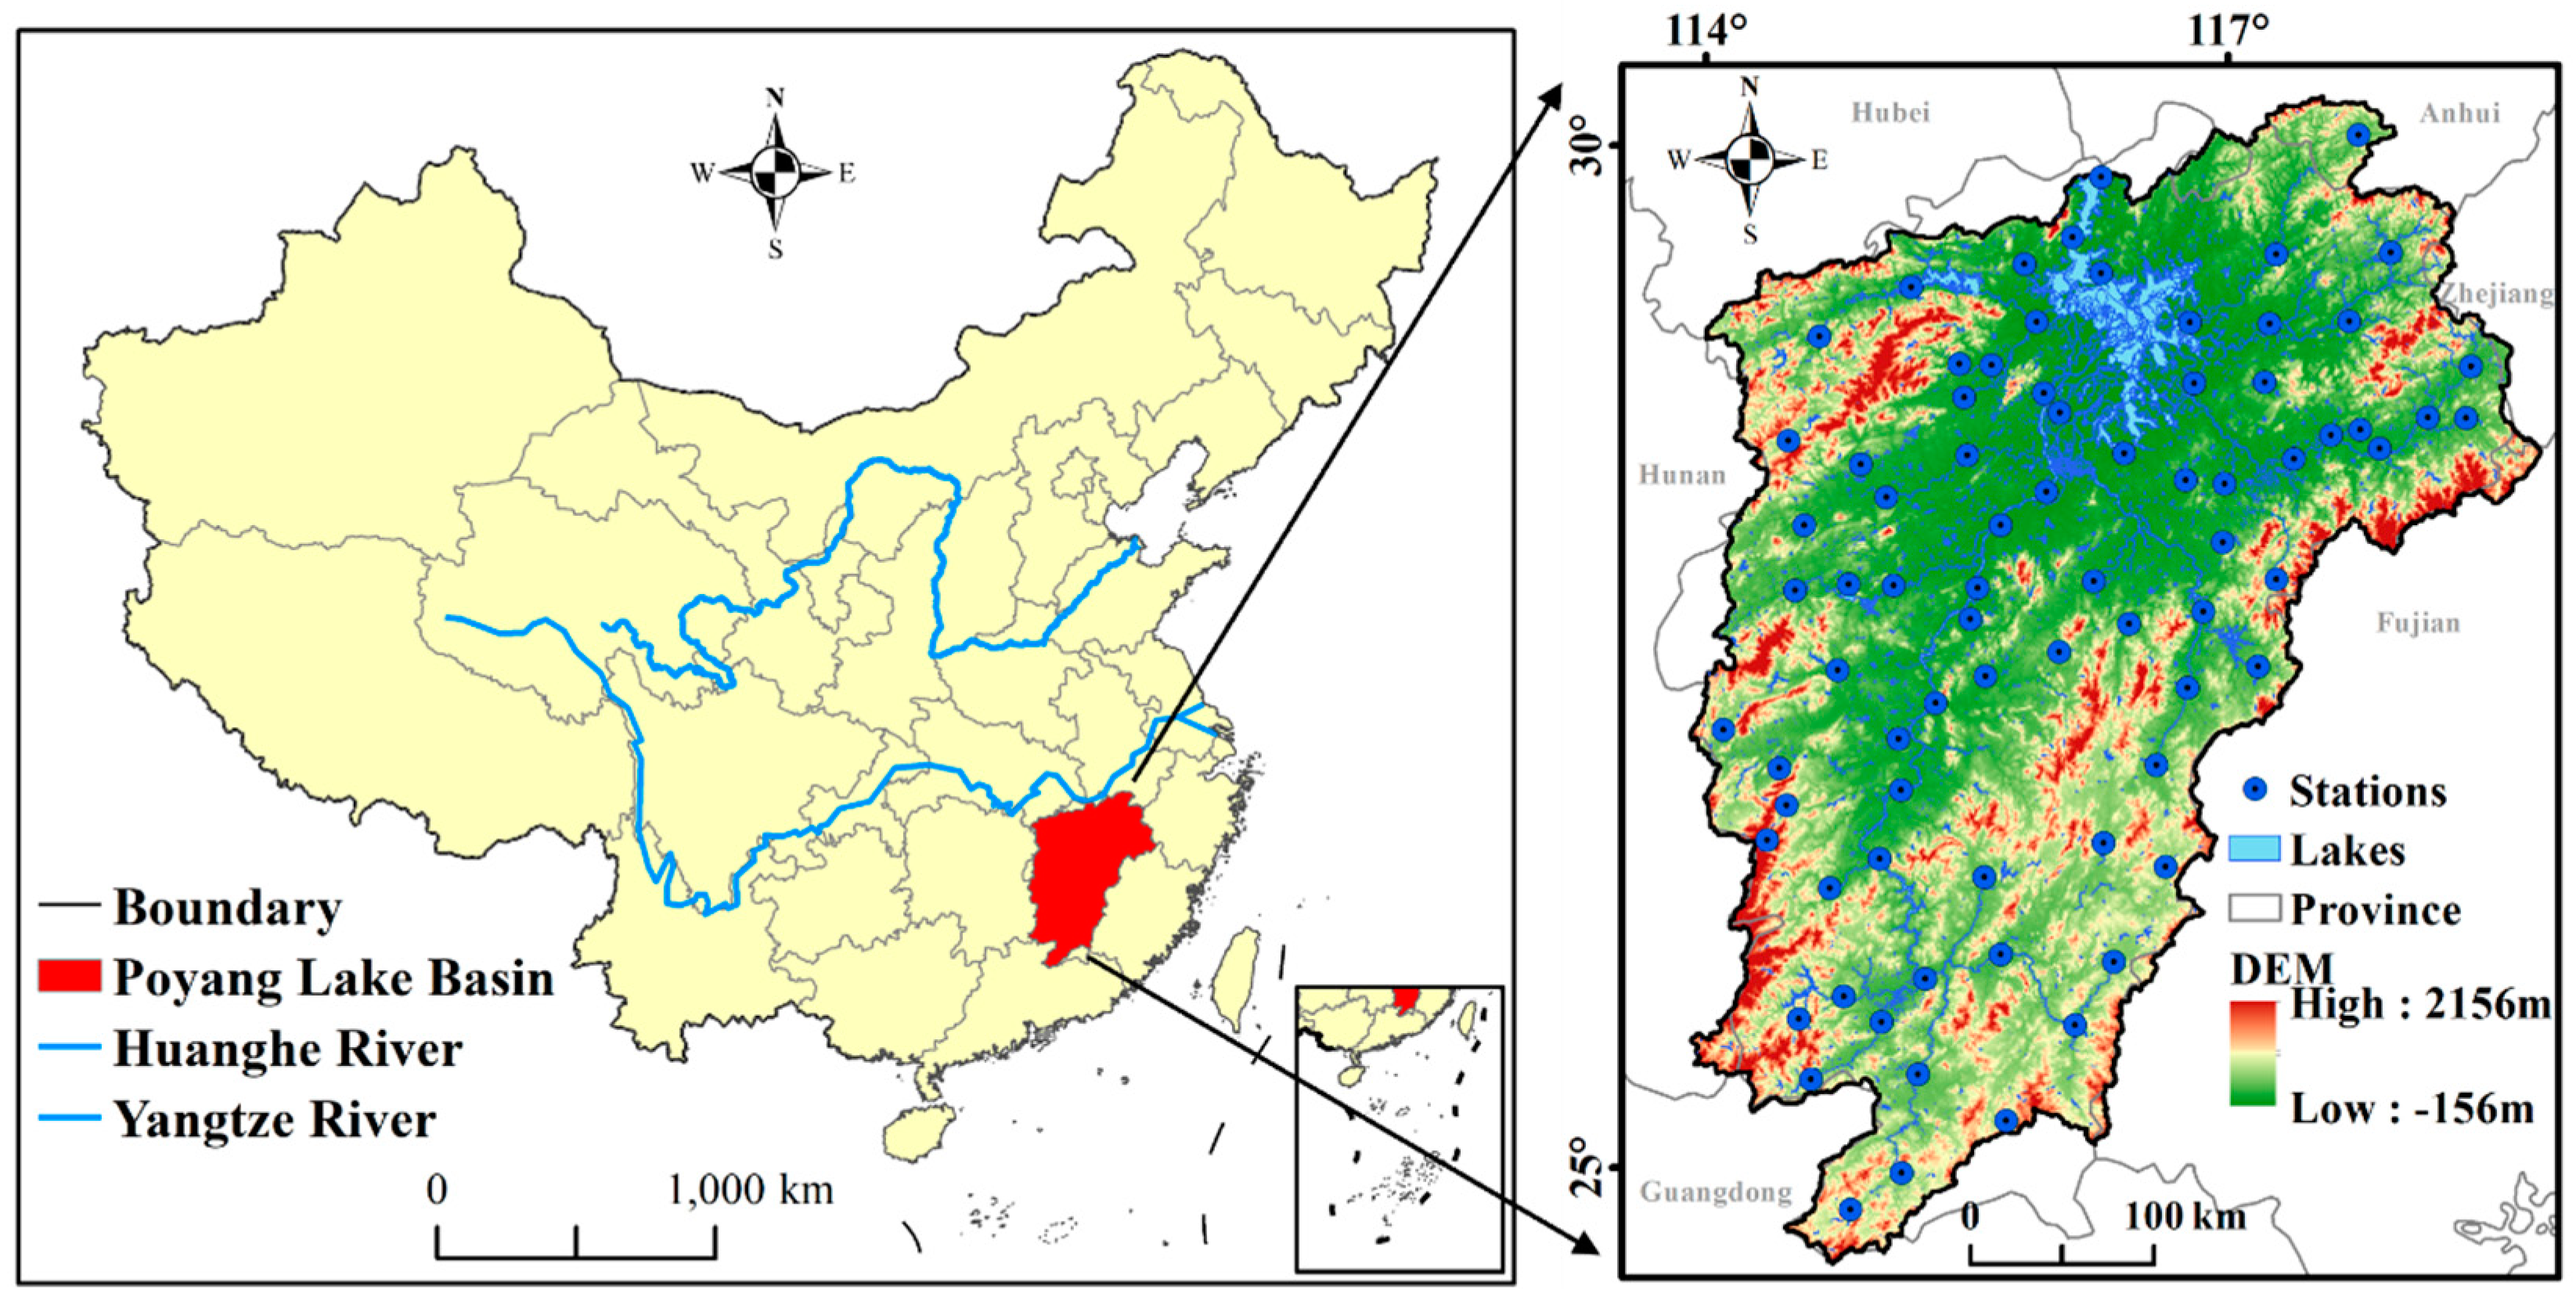
The Poyang Lake Basin is located inland near the southeast coast of China, in the middle and lower reaches of the Yangtze River. The Poyang Lake Basin includes various types of ecosystems such as lakes, wetlands, forests, and farmland, providing an ideal natural laboratory for studying the response of different ecosystems to climate change. The region has a typical subtropical monsoon climate with four distinct seasons, abundant rainfall, and moderate temperatures. Seasonal precipitation and temperature changes provide favorable conditions for studying the impact of climate variability on ecosystem carbon cycling. The Poyang Lake Basin is one of China’s important ecological research bases, with a large amount of long-term monitoring and research data on hydrology, biology, soil, and other aspects, providing valuable basic information for climate change research. As an important ecological functional area, it has received high attention from national and local governments. Research and monitoring of climate change have been supported by policies and funding, with good ground observation stations and remote sensing data support, making it easy to combine model simulations with actual observation data and improve research accuracy (Figure 1).

Figure 1.
An overview of the research area.
This study used meteorological observation data from 1980 to 2020 released by the National Meteorological Information Center (NMIC) of the China Meteorological Administration. Using high-accuracy surface modeling methods (HASMs), the station data are fused with data from the Regional Climate Model 4th edition (RegCM4.6) and interpolated to a spatial resolution of 1 km. This method is widely used for meteorological data interpolation and has high accuracy [32,33]. The solar radiation data are sourced from the Terra Climate dataset of Climatology Lab (https://www.climatologylab.org/terraclimate.html, accessed on 1 August 2024), and the data format is netCDF. We used the ArcGIS platform to extract and resample the data, and resampled them using the nearest neighbor method, resulting in a data resolution of 1 km. The FPAR data are sourced from the MOD15A2 dataset and downloaded from Google Earth Engine. Based on the GEE remote sensing cloud platform, batch reprojection, masking, and resampling of the data were performed with a spatial resolution of 1 km.
2.2. Analysis of Abrupt Changes in Climate Factors
The nonparametric Mann–Kendall (M-K) test does not require samples to follow a specific distribution pattern and allows for a small number of outliers to exist [34,35]. It is precisely because of these advantages that the M-K test has been widely used in time-series detection in disciplines such as meteorology and hydrology [36]. Therefore, in this study, we used this method to test whether there were abrupt changes in the annual average temperature and precipitation in the Poyang Lake Basin. The calculation steps are as follows:
For a time series containing n samples, represents the cumulative number of i-th samples in the sequence where is greater than (1 ≤ j ≤ i). So, the statistic is as follows:
In this study, we assume that the sequence is random and independent, and define it as follows:
Among them, and are the mean and standard deviation of , respectively. We then repeat the above process while making = − ().
is a standard normal distribution. At the significance level α (usually taken as α = 0.05 = ±1.96), if || > ||, it indicates a significant increasing or decreasing trend in the sequence. If two curves intersect and the intersection point happens to be within the confidence interval, then the time corresponding to the intersection point is the time of the inflection point.
2.3. Periodic Analysis of Climate Factors
Wavelet transform is a signal analysis method that uses wavelet functions as basic functions to analyze signals. A wavelet function is a localized waveform that can provide information in both time and frequency domains simultaneously. The algorithm of wavelet analysis is relatively simple and easy to implement in various applications, so it is widely used in research fields such as hydrology and climate [37]. It can reveal the changing periods of different time series. This study chooses the Morlet wavelet function to perform continuous wavelet transform on the time series, and the formula is as follows:
The expression for wavelet variance is as follows:
In the formula, is the coefficient of waves in the wavelet analysis we use; is the scale parameter; is the translation parameter; represents the time scale; indicates the size of the sample we input. Complex wavelet functions are used to transform time-series data and calculate the real part of wavelet coefficients. Observing the periodicity of time series mainly involves two parts: a wavelet variance map and a wavelet real-part contour map. The process of the wavelet variance changing with scale a is called the wavelet variance plot. It can reflect the energy distribution of input signal fluctuations, with a scale of a, and can be used to determine the relative strength of disturbances of different scales in the sequence, with the main period located at the scale of the maximum peak. A signal can also have multiple peaks, each representing a periodic feature. The contour map of the real part of wavelet coefficients reflects the periodic changes in the studied time series at different time scales and their distribution in the time domain.
2.4. Hot Spot and Cold Spot Analysis
In geography and spatial analysis, hot spot analysis and cold spot analysis are two methods used to identify significantly high-value (hot spot) or significantly low-value (cold spot) regions in a spatial dataset [38,39,40]. These analyses are typically used in fields such as statistics, epidemiology, criminology, market analysis, environmental monitoring, etc., and are intended to identify high/low-value clustering areas in the dataset. These regions show statistically higher/lower values than the surrounding areas, indicating the possibility of some concentrated trend or pattern. In this study, we used this method to identify high/low regions of annual average temperature and precipitation in the Poyang Lake Basin. The formula is as follows:
In this formula, represents the spatial weight matrix, whose meaning is that the weight of distance and distance will also vary (i ≠ j). indicates the degree of correlation between the attribute values of a certain unit and neighboring units under a given distance weight condition. The formula for the standardization of is as follows:
where and represent the mathematical expectation and theoretical variance of , respectively. If is greater than zero and passes the confidence test, it indicates that the values around a geographic unit are high, and therefore, the geographic unit belongs to a hot spot area. If is less than zero and has passed the confidence test, this indicates that the values around a certain geographical unit are low and belong to the cold spot area.
2.5. Simulation of NPP in Poyang Lake Basin
The CASA model (Carnegie–Ames–Stanford Approach model) is an ecosystem process model used to simulate the carbon cycle of terrestrial ecosystems, particularly the photosynthesis and respiration of vegetation. This model was originally developed by scientists from Stanford University in the United States with the aim of better understanding the global carbon cycle and its response to climate change. It integrates multiple processes such as photosynthesis, respiration, and vegetation dynamics, providing a comprehensive ecosystem carbon cycle simulation framework. Parameters and input data can be adjusted according to different research needs, suitable for various ecosystems and environmental conditions [41]. The simulation of NPP mainly utilizes two main parameters: the absorbed photosynthetically active radiation (APAR) that vegetation can absorb and the actual light energy utilization efficiency (ε). The calculation process involves numerous factors, and the calculation formula is as follows:
The calculation of APAR can be determined by two variables, Fractional Photosynthetically Active Radiation (FPAR) and Total Solar Radiation (SOL), which are the ratios of effective photosynthetically active radiation that vegetation can absorb. The calculation formulas are as follows:
In the formulas, the proportion of effective photosynthetic radiation that vegetation can absorb mainly depends on parameters such as vegetation type and the Normalized Difference Vegetation Index (NDVI), and changes with the continuous growth of vegetation and seasonal changes. The constant 0.5 represents the ratio of effective radiation that vegetation can absorb and utilize to the total solar radiation. The calculation of light energy utilization efficiency is influenced by multiple parameters, such as temperature, precipitation, vegetation type, etc. The values in this article mainly refer to multiple influencing factors such as the water stress coefficient and the temperature stress coefficient simulated by previous scholars [42,43].
2.6. Land Use Transfer Matrix
The land use transfer matrix is a tool used to analyze and record land use changes, typically used in fields such as geographic information systems (GISs), environmental science, and urban planning. This matrix helps researchers and decision-makers understand the patterns and trends of land use change by quantifying the transitions between land use types. This method can comprehensively and specifically depict the direction of land use change in a certain region, as well as study the sources and composition of various land use types at the beginning and end of the time period [44,45]. To a certain extent, it reflects the direction of land use change guided by human activities and can better reveal the spatiotemporal evolution process of land use patterns. The calculation formula is as follows:
In the formula, , = 1, 2, , . They, respectively, represent the land use types of a geographic unit before and after the transfer; is the number of different land types; is the area of land use transfer.
2.7. The Impact of Different Factors on NPP
The influencing factors of NPP changes can be divided into climate change and human activities. Temperature, precipitation, and solar radiation are the most important climatic factors driving changes in vegetation NPP [46,47]. Land use change is the most direct manifestation of human impact on ecosystems, which in turn affects vegetation productivity [48]. In this study, we attributed changes in NPP to climate change and land use change based on whether land use has undergone a transfer. For a certain geographical unit, assuming no land use transfer has occurred, the change in NPP on that unit is caused by climate change. Correspondingly, if the land use type of the geographical unit changes, the change in NPP corresponding to the unit is associated with the specific direction of land type transfer, such as the transfer of arable land to forest or grassland due to returning farmland to forest or grassland, and the conversion of sandy land to grassland or forest due to desertification control. The corresponding formula is as follows:
In the formula, , and , respectively, represent the total change in NPP from to , the change in NPP caused by climate change, and the change in NPP caused by land use change; represents the area of land use type i that has not changed from to ; represents the area of land use type transitioning from land type to land type during the period to .
3. Results
3.1. Characteristics of Climate Change in Poyang Lake Basin
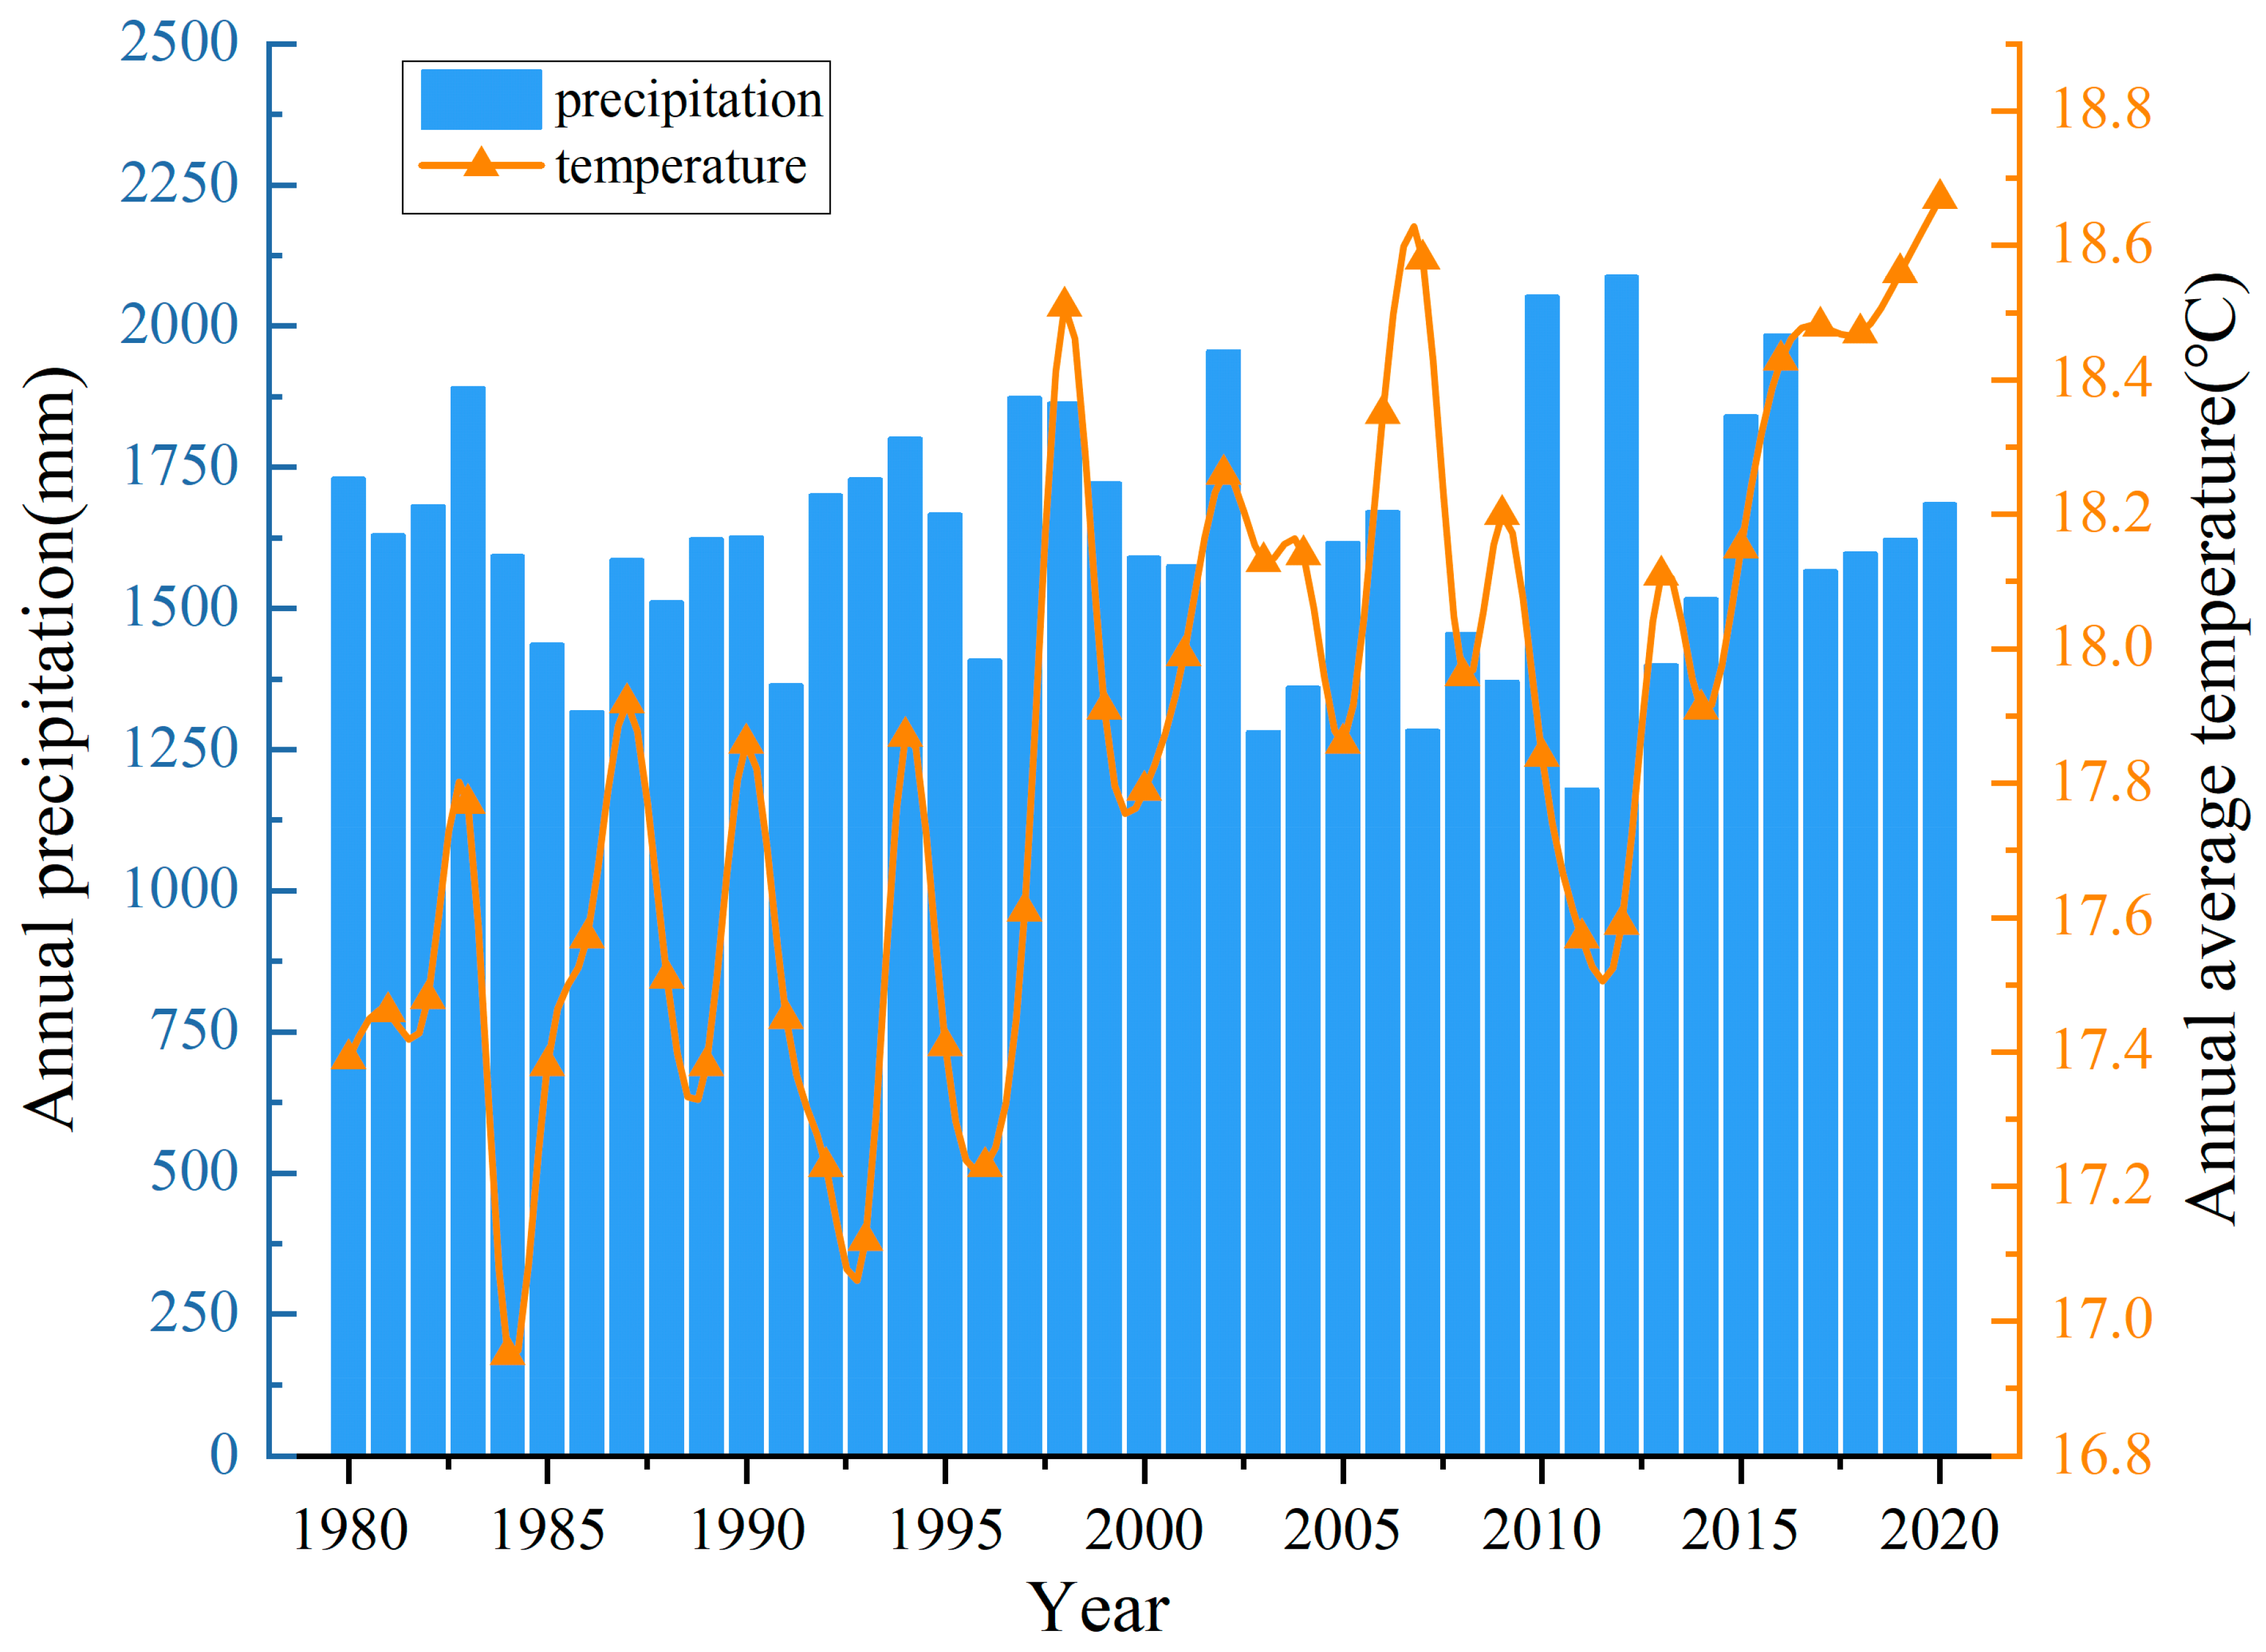
Figure 2 shows the dynamics of the annual average temperature and precipitation in the Poyang Lake Basin from 1980 to 2020. We can see that the annual average temperature in the Poyang Lake Basin is increasing at a rate of 0.27 °C per decade. The average annual temperature in 1984 was the lowest in nearly 40 years, at 16.95 °C, while the highest average annual temperature occurred in 2020, at 18.67 °C. The average temperature from the 1980s to the end of the 20th century (1980–2000) was 17.56 °C, much lower than the average temperature of 18.16 °C from 2001 to 2020, and the average temperature in the past 40 years was about 17.85 °C.

Figure 2.
The dynamics of annual average temperature and precipitation in the Poyang Lake Basin from 1980 to 2020.
Compared to temperature, there is no clear pattern in annual precipitation changes in the Poyang Lake Basin. The average annual precipitation in the past 40 years is 1621.35 mm. The year with the highest precipitation was 2012, at 2088.74 mm, while 2011 was the year with the lowest annual precipitation in nearly 40 years, at only 1180.73 mm.
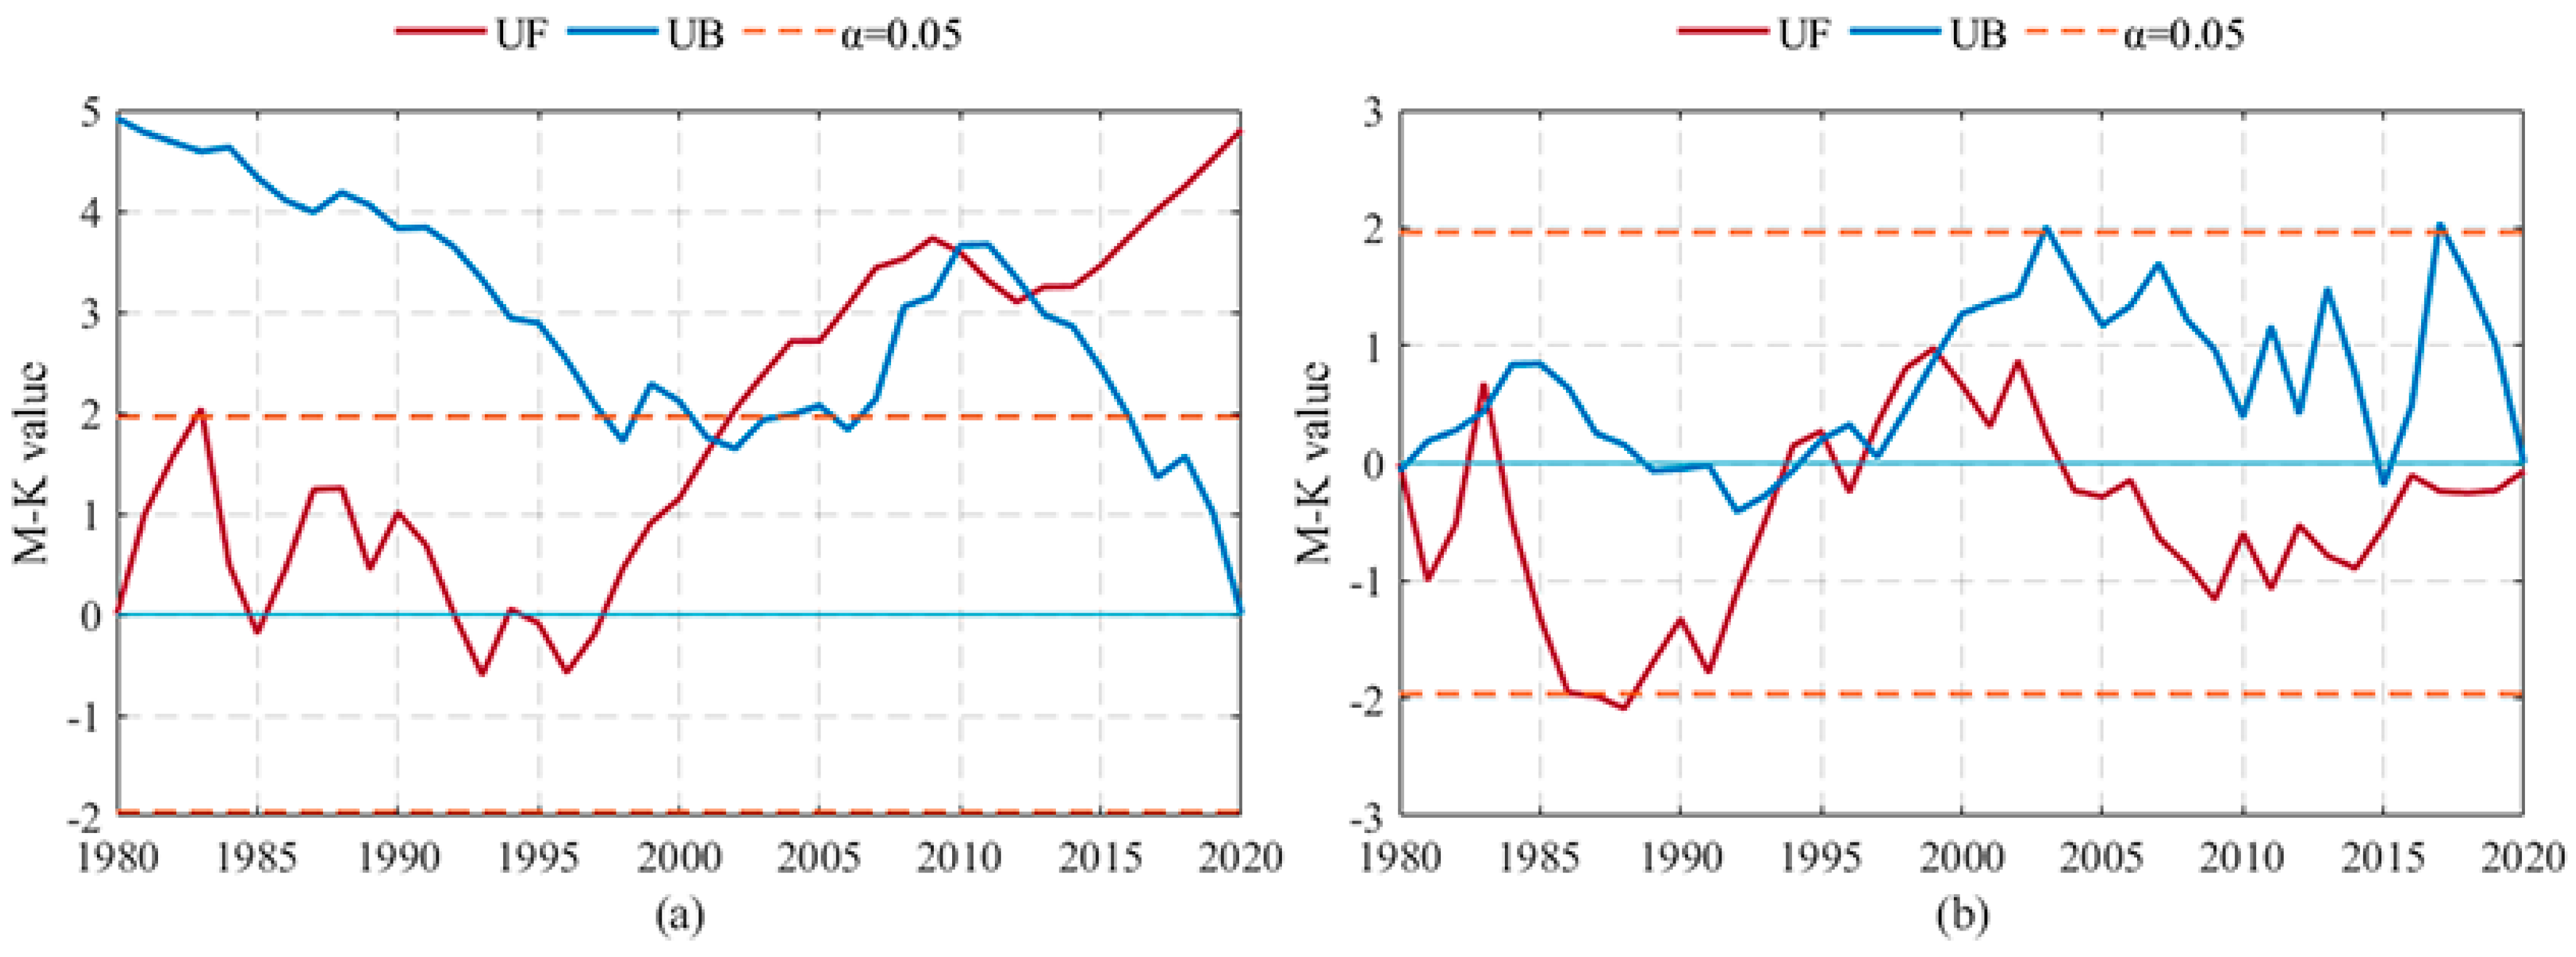
To investigate whether two climate factors have undergone mutations in the past 40 years, we used the M-K mutation test method for testing (Figure 3). As shown in Figure 3a, the UF curve of the annual average temperature shows an upward trend, further indicating that the annual average temperature has been rising in the past 40 years. If the UF curve and UB curve intersect at a certain point within the confidence interval, here corresponding to the year 2002, this indicates that there may have been a sudden change in that year. On the other hand, if the UF and UB curves of annual average precipitation have multiple intersections within the confidence interval, this indicates that there have been multiple abrupt changes in annual precipitation in the past 40 years.
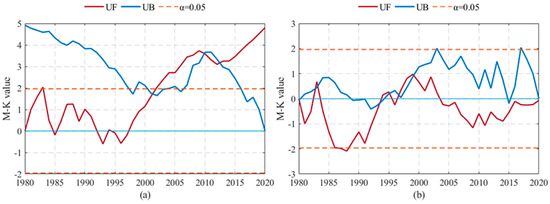
Figure 3.
M-k mutation test results. ((a) represents the result of the abrupt change test for temperature, and (b) represents the result of the abrupt change test for precipitation).
We use wavelet analysis to explore the periodicity of two climate factors. Figure 4a,b are the wavelet real-part contour maps of annual average temperature and annual precipitation, respectively. Figure 4c,d are the wavelet variance maps of the two. By observing Figure 4c, we can see that there are three distinct cycles of annual average temperature over a 40-year time scale, namely around 6 years, 14 years, and 25 years. The peak of the wavelet variance map corresponding to the 25-year cycle is the highest. The above indicates that the average annual temperature in the Poyang Lake Basin exhibits periodic changes, with the strongest periodic changes occurring over a period of 25 years, and a cyclic trend of “decrease rise decrease”.
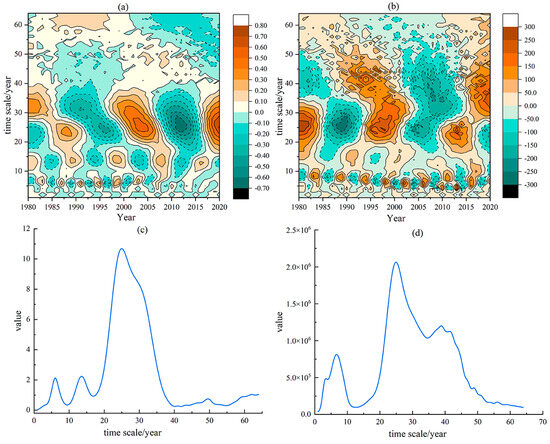
Figure 4.
Wavelet analysis results of temperature and precipitation changes ((a,b) represent the wavelet real part contour maps of temperature and precipitation, respectively, while (c,d) represent the wavelet variance maps of temperature and precipitation, respectively).
For annual precipitation, observing Figure 4d, we can see that there are two distinct peaks over a 40-year time scale, corresponding to years 9 and 25, indicating periodic changes in annual precipitation with periods of 9 and 25 years. This conclusion can also be confirmed from Figure 4b. Under a 9-year cycle, the annual precipitation changes periodically in a “decrease increase decrease” pattern, and under a 25-year time scale, the annual precipitation changes periodically in an “increase decrease increase” pattern.
To investigate the spatial distribution patterns of climate factors, we use hot spot and cold spot analyses for exploration. Figure 5 shows the distribution of hot and cold spots in the average annual temperature of the Poyang Lake Basin over the past 40 years. The hot spots of annual average temperature are mainly distributed in the southern part of the Poyang Lake Basin and have remained almost unchanged in the past 40 years. In contrast, the cold spot areas of annual average temperature are distributed in the western and northern parts of the Poyang Lake Basin, and the cold spot areas with a confidence level of over 99% have the highest proportion among all cold spot areas, indicating that the low-value clustering of annual average temperature is stronger than the high-value clustering.
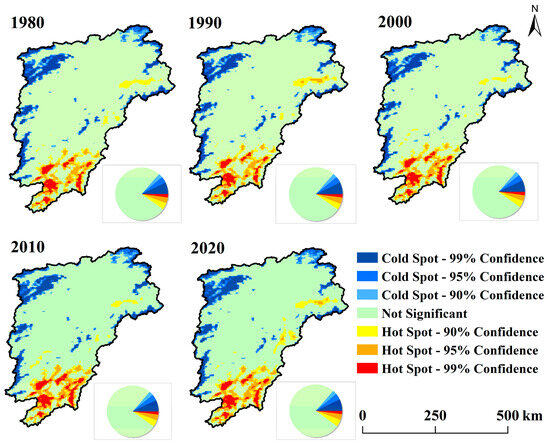
Figure 5.
Analysis of hot and cold spots of annual average temperature.
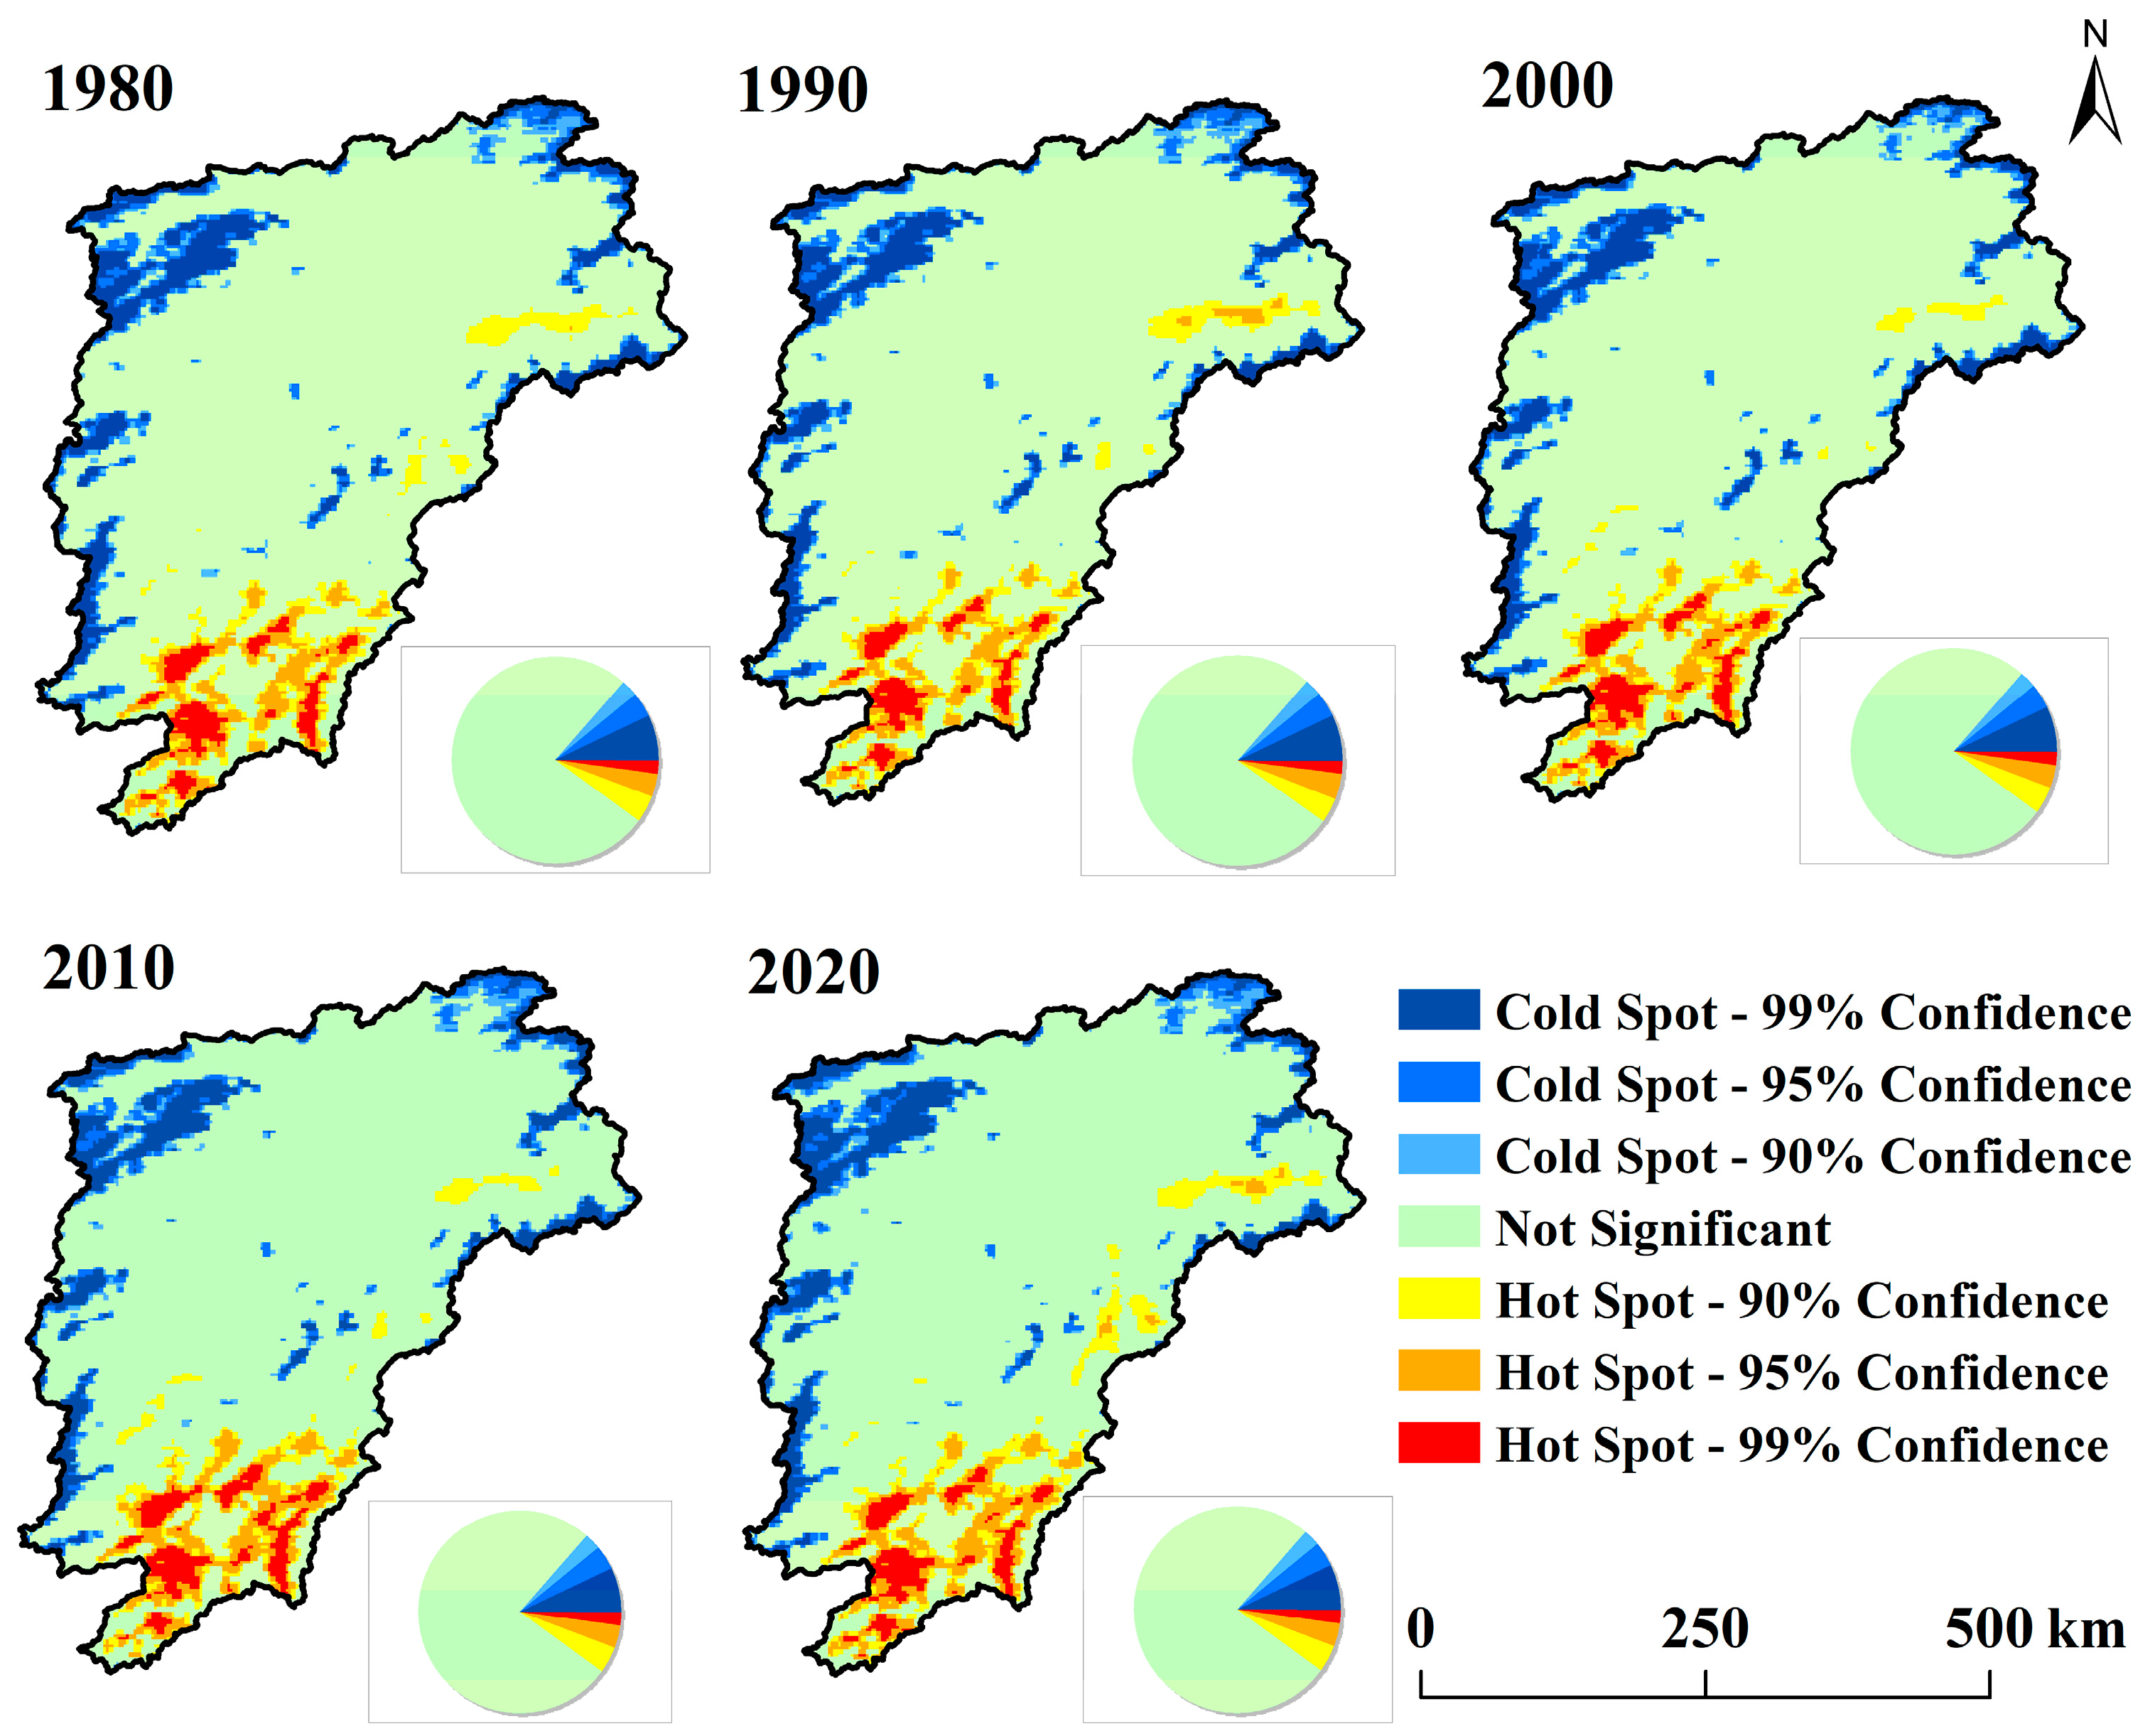
Figure 6 shows the distribution of hot and cold spots of annual precipitation in the Poyang Lake Basin from 1980 to 2020. In 1980, 1990, and 2000, the regions with high annual precipitation (hot spot areas) were mainly concentrated in the eastern part of the Poyang Lake Basin and were also scattered on the western edge. In 2010 and 2020, the hot spots of annual precipitation increased and the main distribution area shifted from the east to the northeast. The cold spot area of annual precipitation gradually shifted from the northern part of the Poyang Lake Basin to the southwestern part.
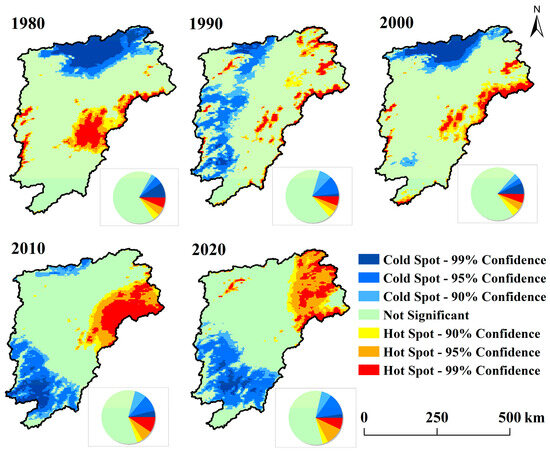
Figure 6.
Analysis of hot and cold spots in annual precipitation.
3.2. The Trend of NPP Changes in the Poyang Lake Basin and the Impact of Climate Change on NPP
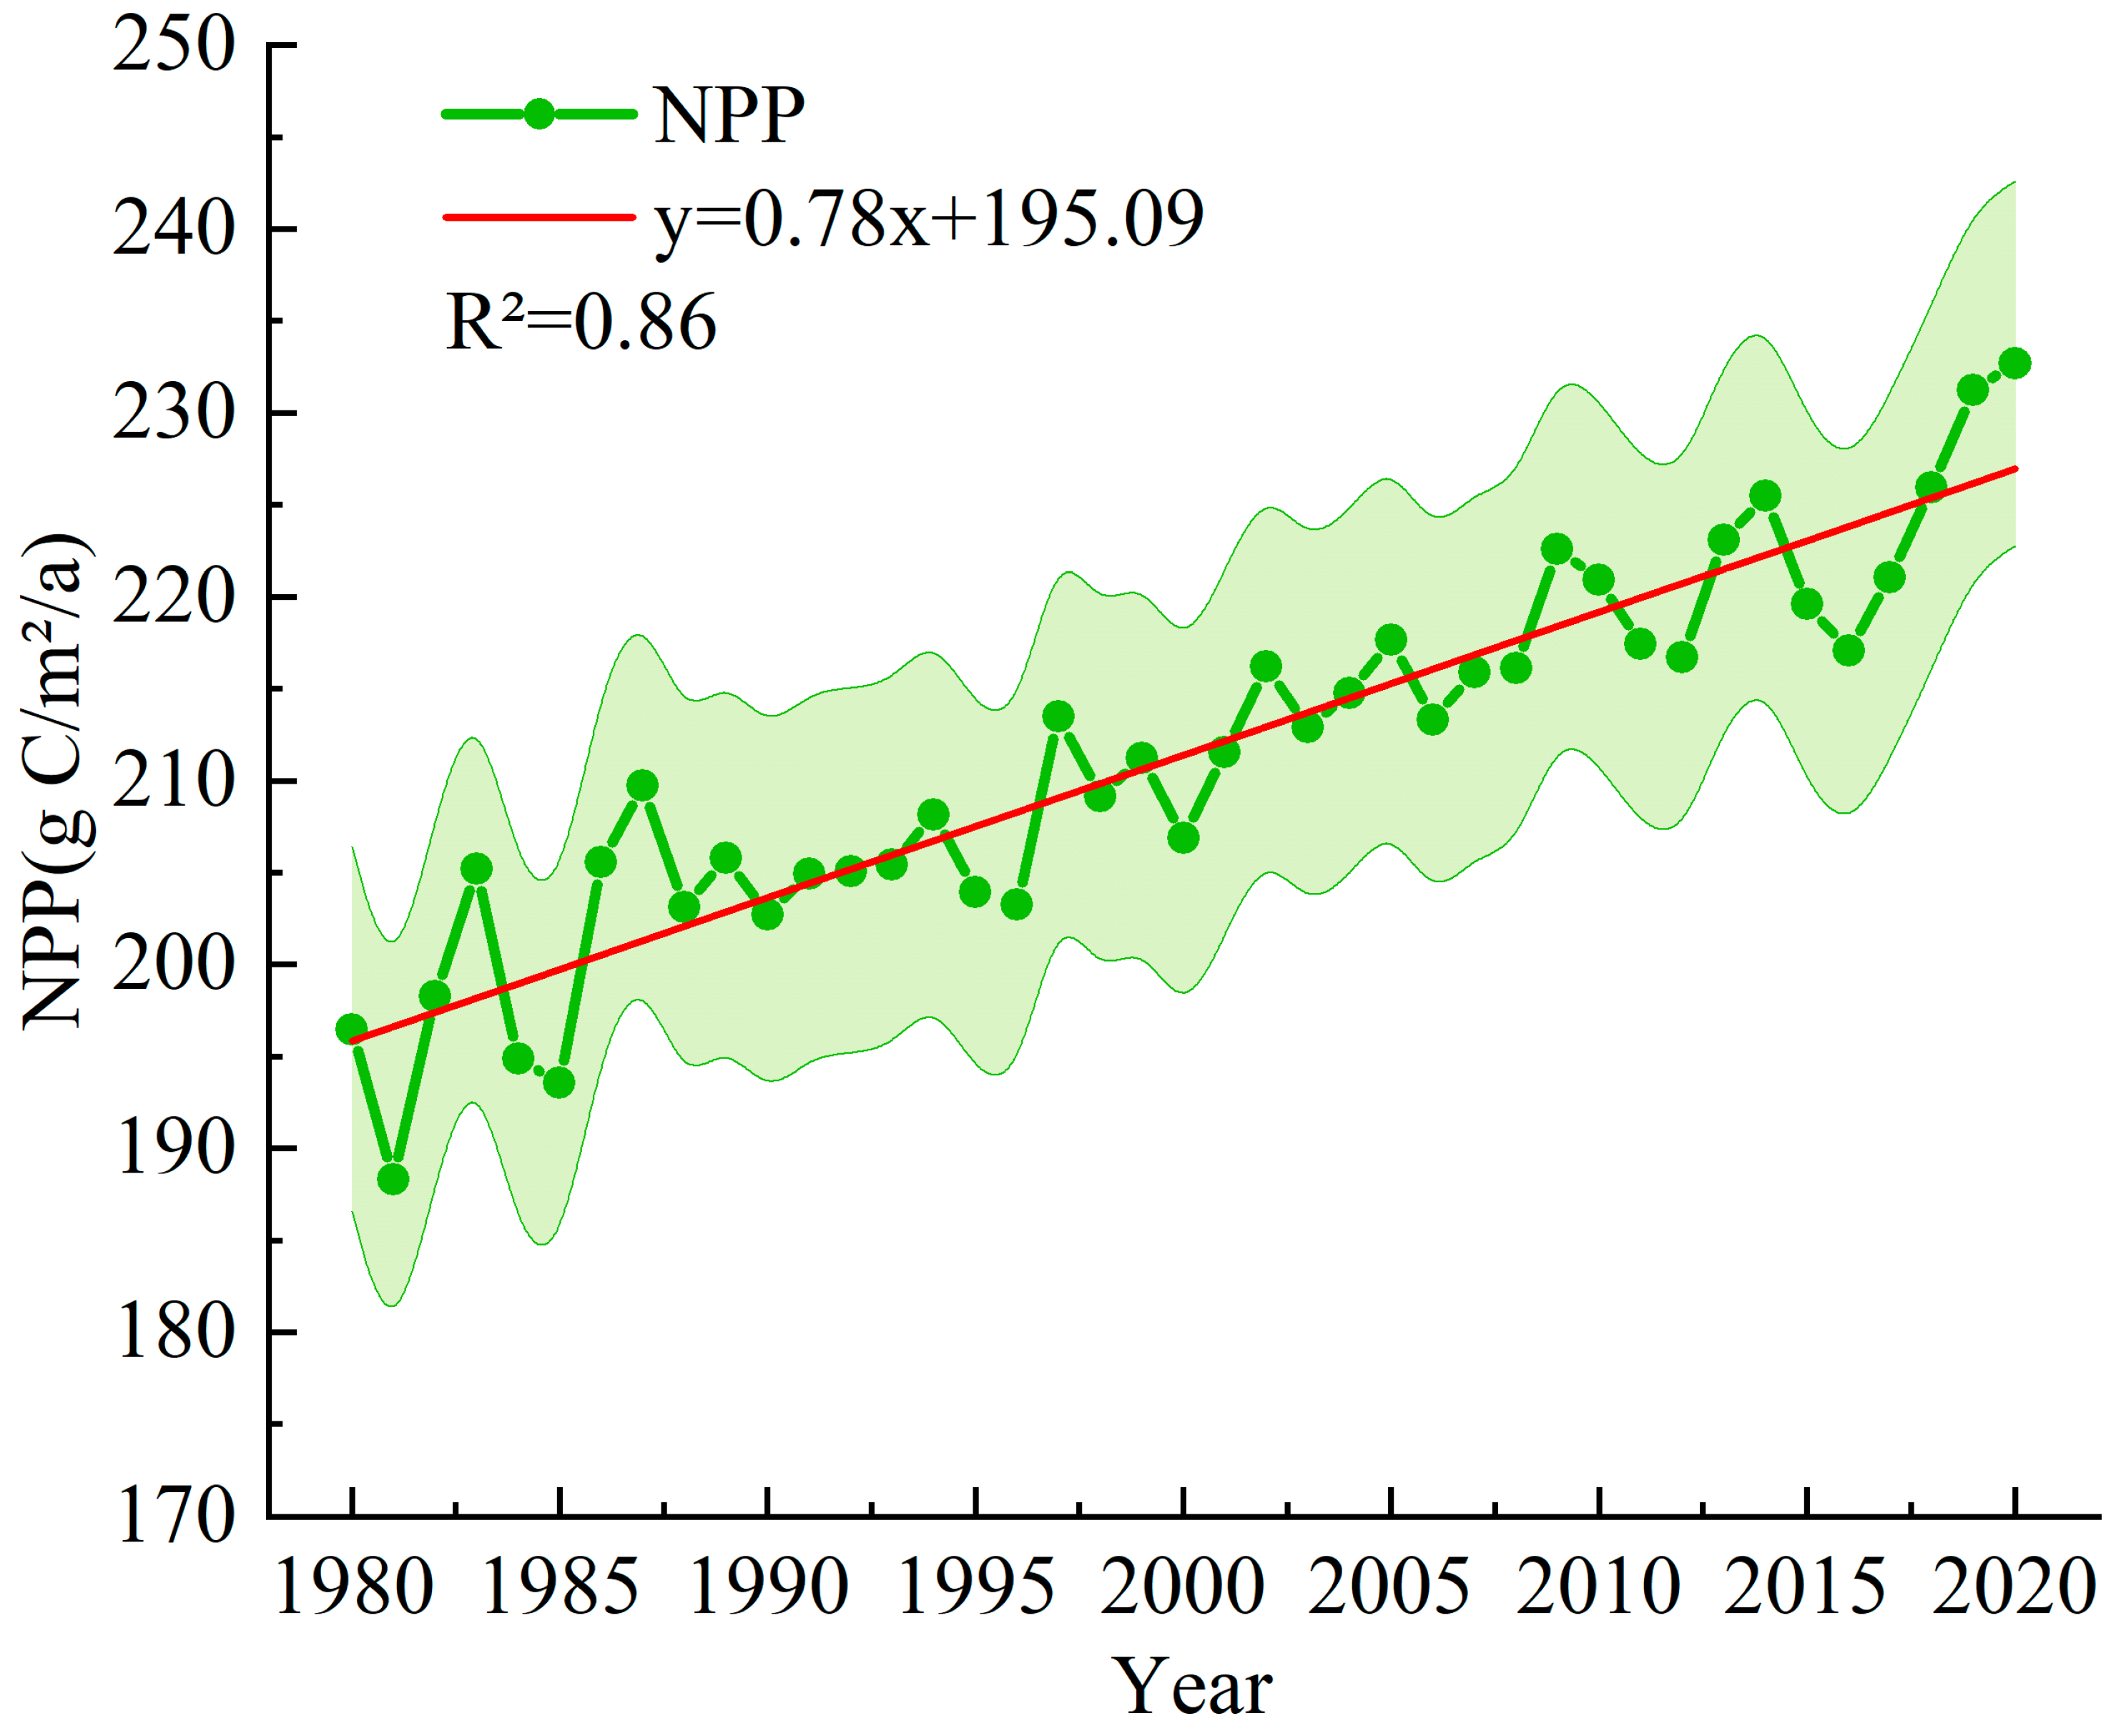
We used the CASA model to simulate the changes in NPP in the Poyang Lake Basin from 1980 to 2020, as shown in Figure 7. In the past 40 years, although there have been some fluctuations in NPP in the Poyang Lake Basin, it has shown a significant upward trend at a rate of 0.78 g per square meter per year and has been “rising linearly” since 2015.

Figure 7.
Changes in NPP from 1980 to 2020.
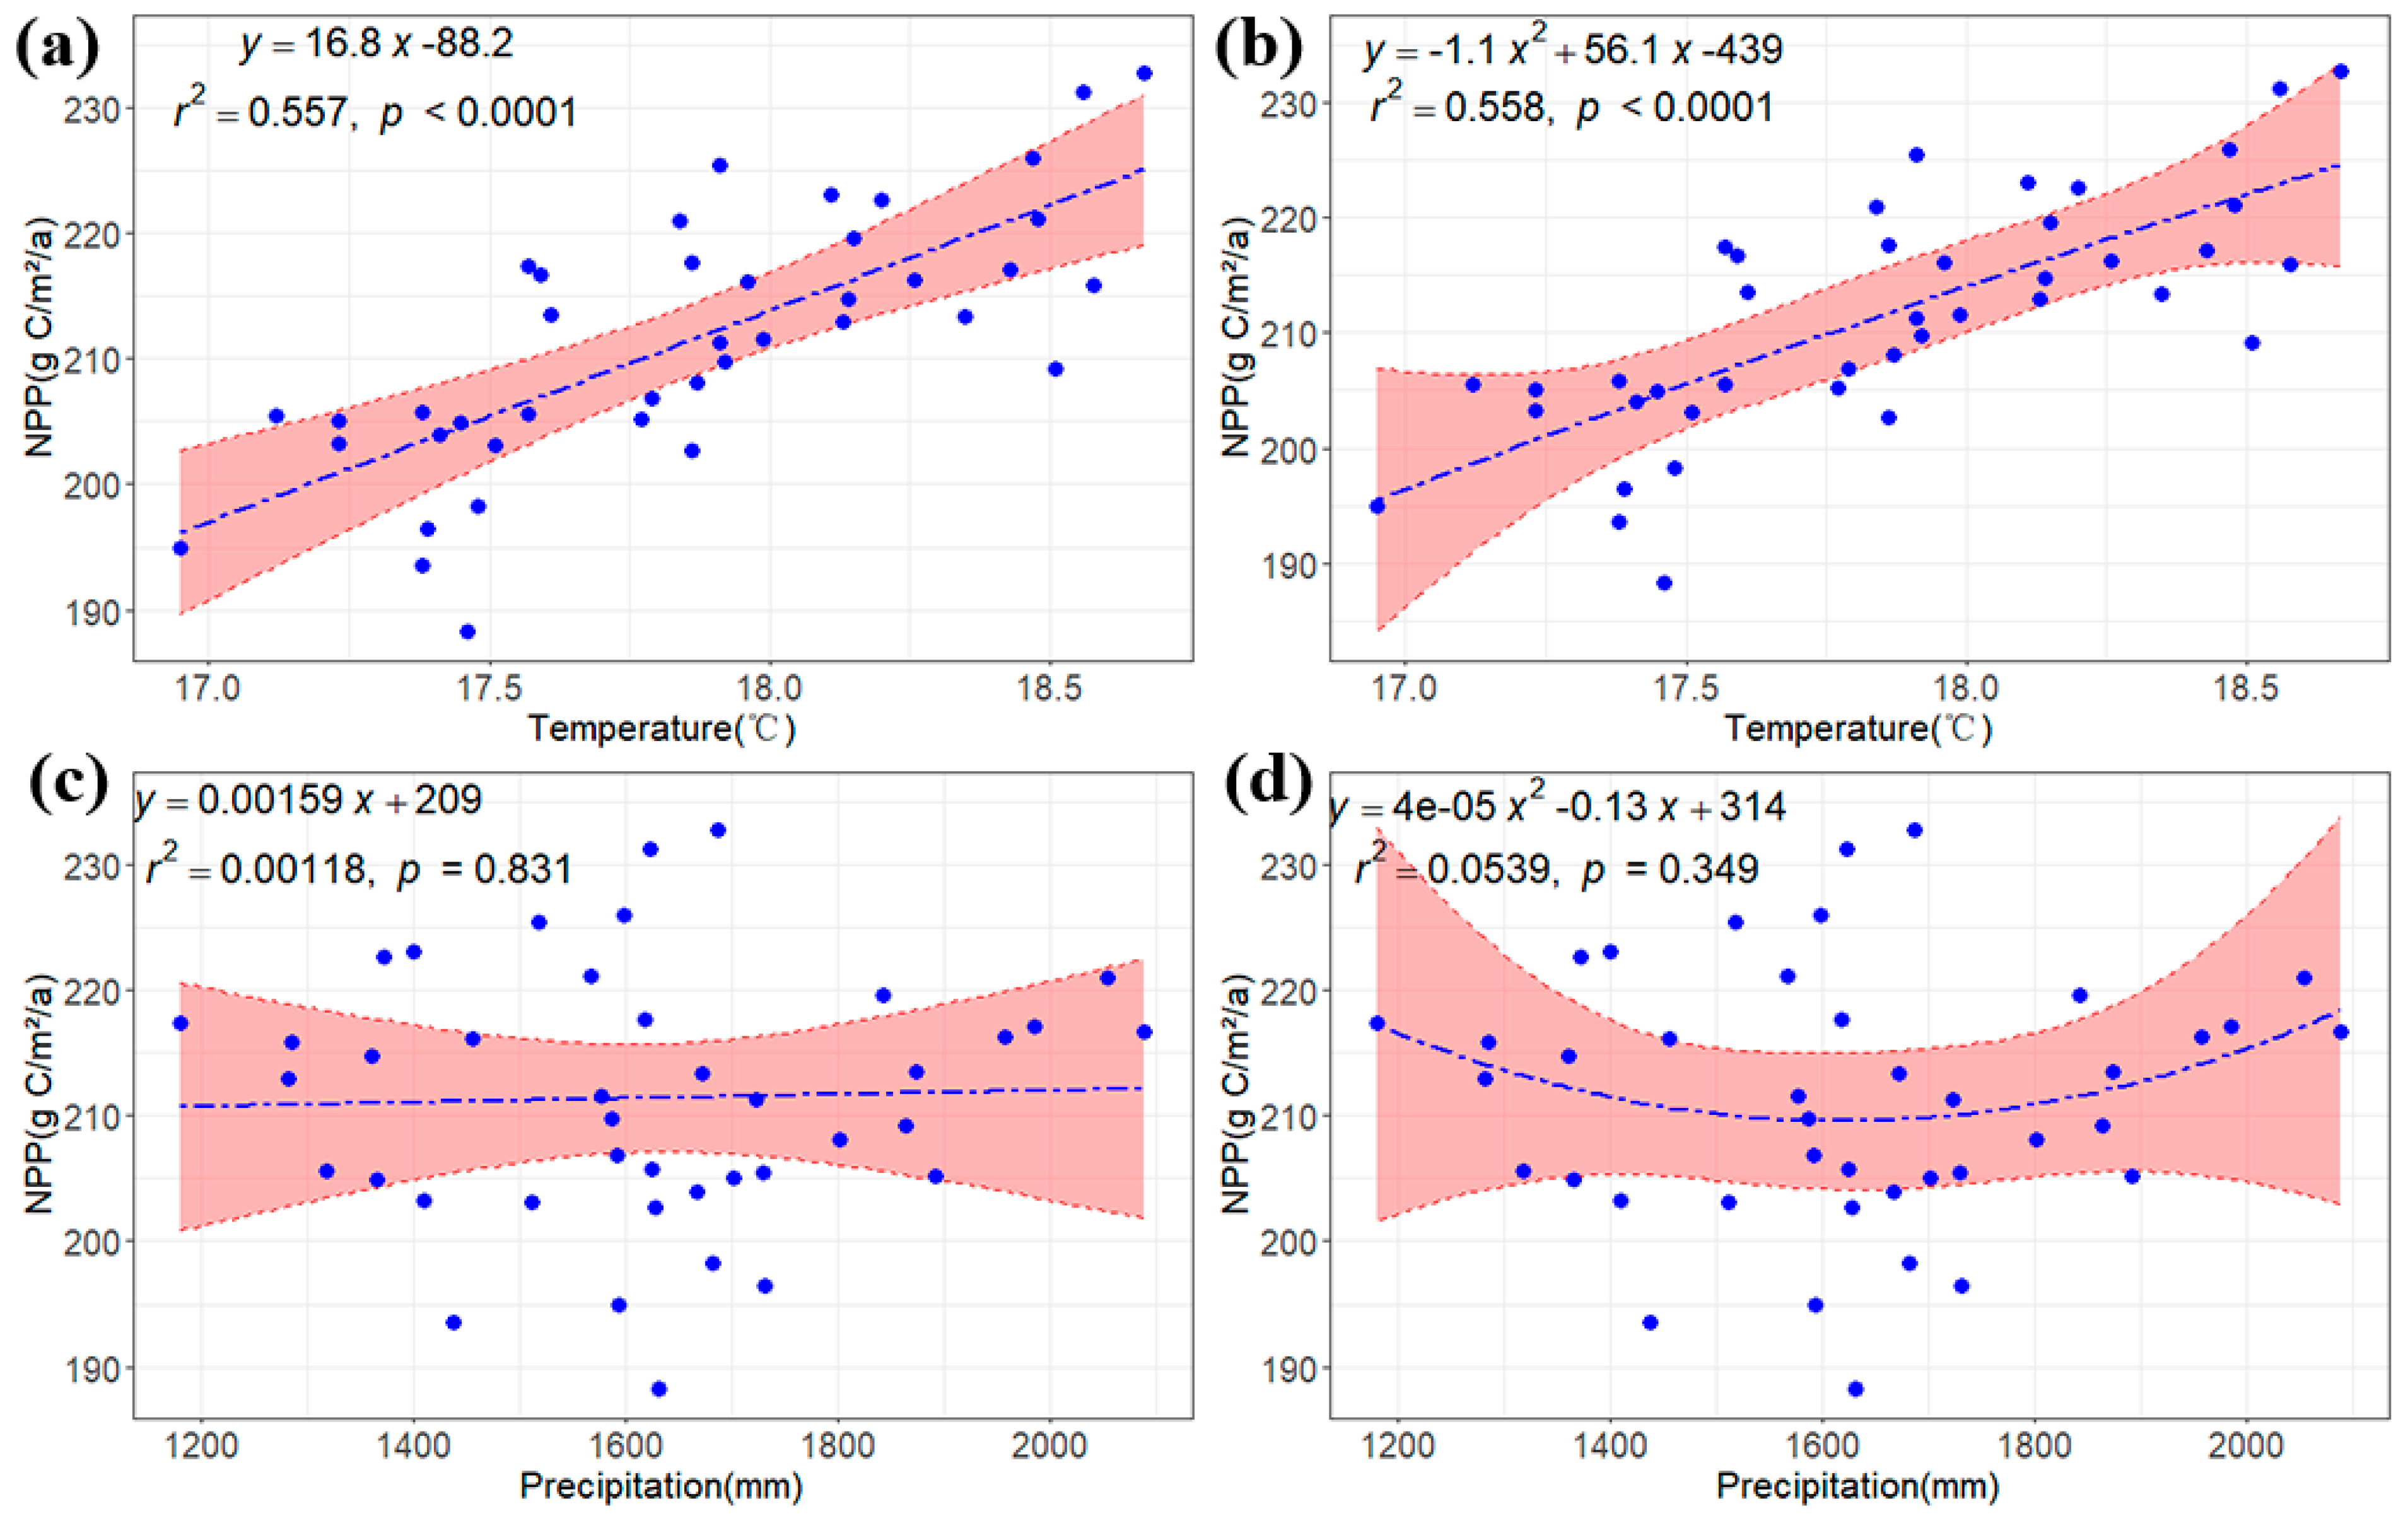
To investigate the effects of annual average temperature and precipitation on the changes in NPP in the Poyang Lake Basin, we fitted the changes in two climate factors and NPP using linear and quadratic functions, respectively (Figure 8). Research has found a significant correlation between annual average temperature and NPP, with an increase of 16.8 GC per square meter in NPP for every 1 °C rise in annual average temperature. Compared to annual average temperature, the impact of changes in annual precipitation on NPP changes is not significant.

Figure 8.
The influence of annual average temperature and precipitation on NPP changes ((a,b) represent the first-order and second-order curve fitting of temperature changes and NPP changes, respectively; (c,d) represent the first-order and second-order curve fitting of precipitation changes and NPP changes, respectively. The shaded area represents the error interval).
3.3. The Impact of Different Factors on NPP Changes in the Poyang Lake Basin
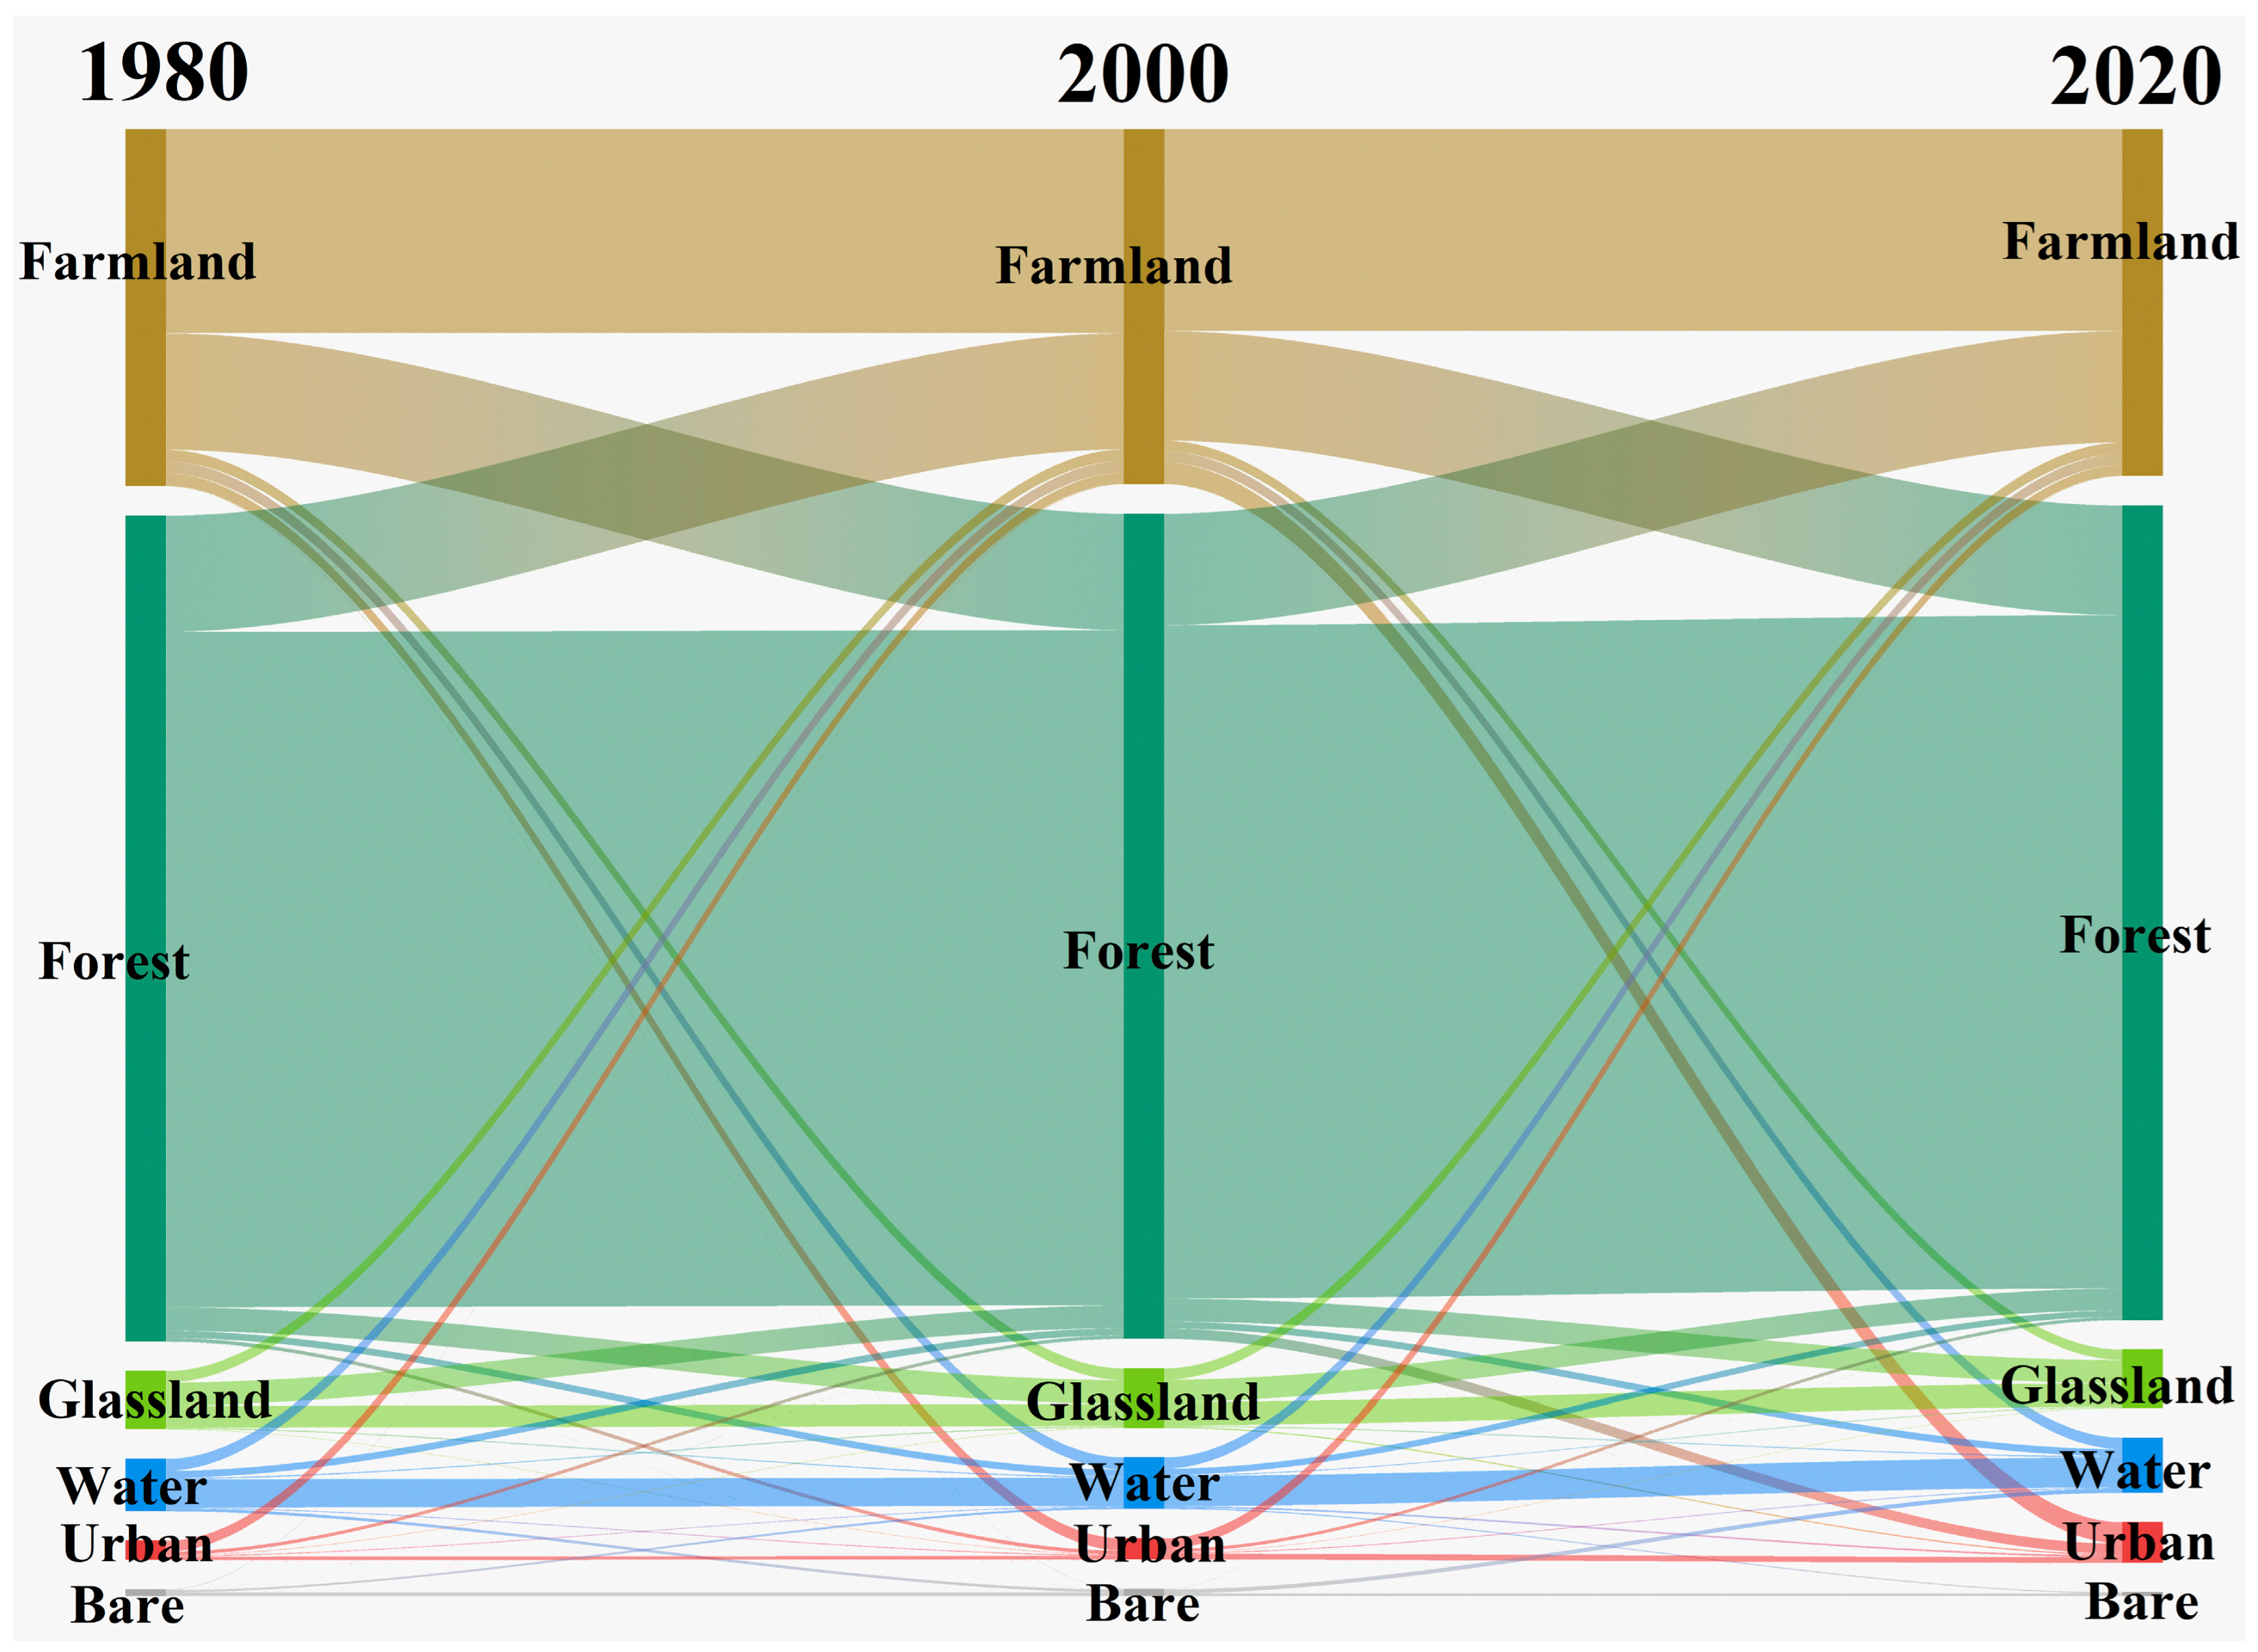
Figure 9 is a Sankey diagram of land use change, vividly showing the changes in land use types in the Poyang Lake Basin from 1980 to 2020. Overall, we can see that the land cover in the Poyang Lake Basin is mainly composed of forests, which are farmland and grassland. Looking at the changes over the past 40 years, we can see that six types of land use are constantly transforming. It can be clearly seen that urbanization land is gradually increasing, while unused land is gradually decreasing. This indirectly indicates the continuous development of urbanization in China over the past 40 years.
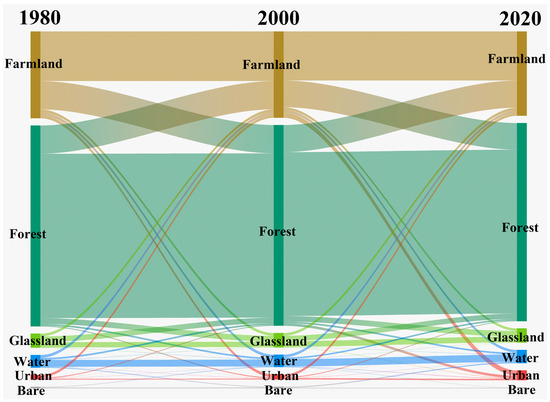
Figure 9.
Land use transfer mulberry map in Poyang Lake Basin.
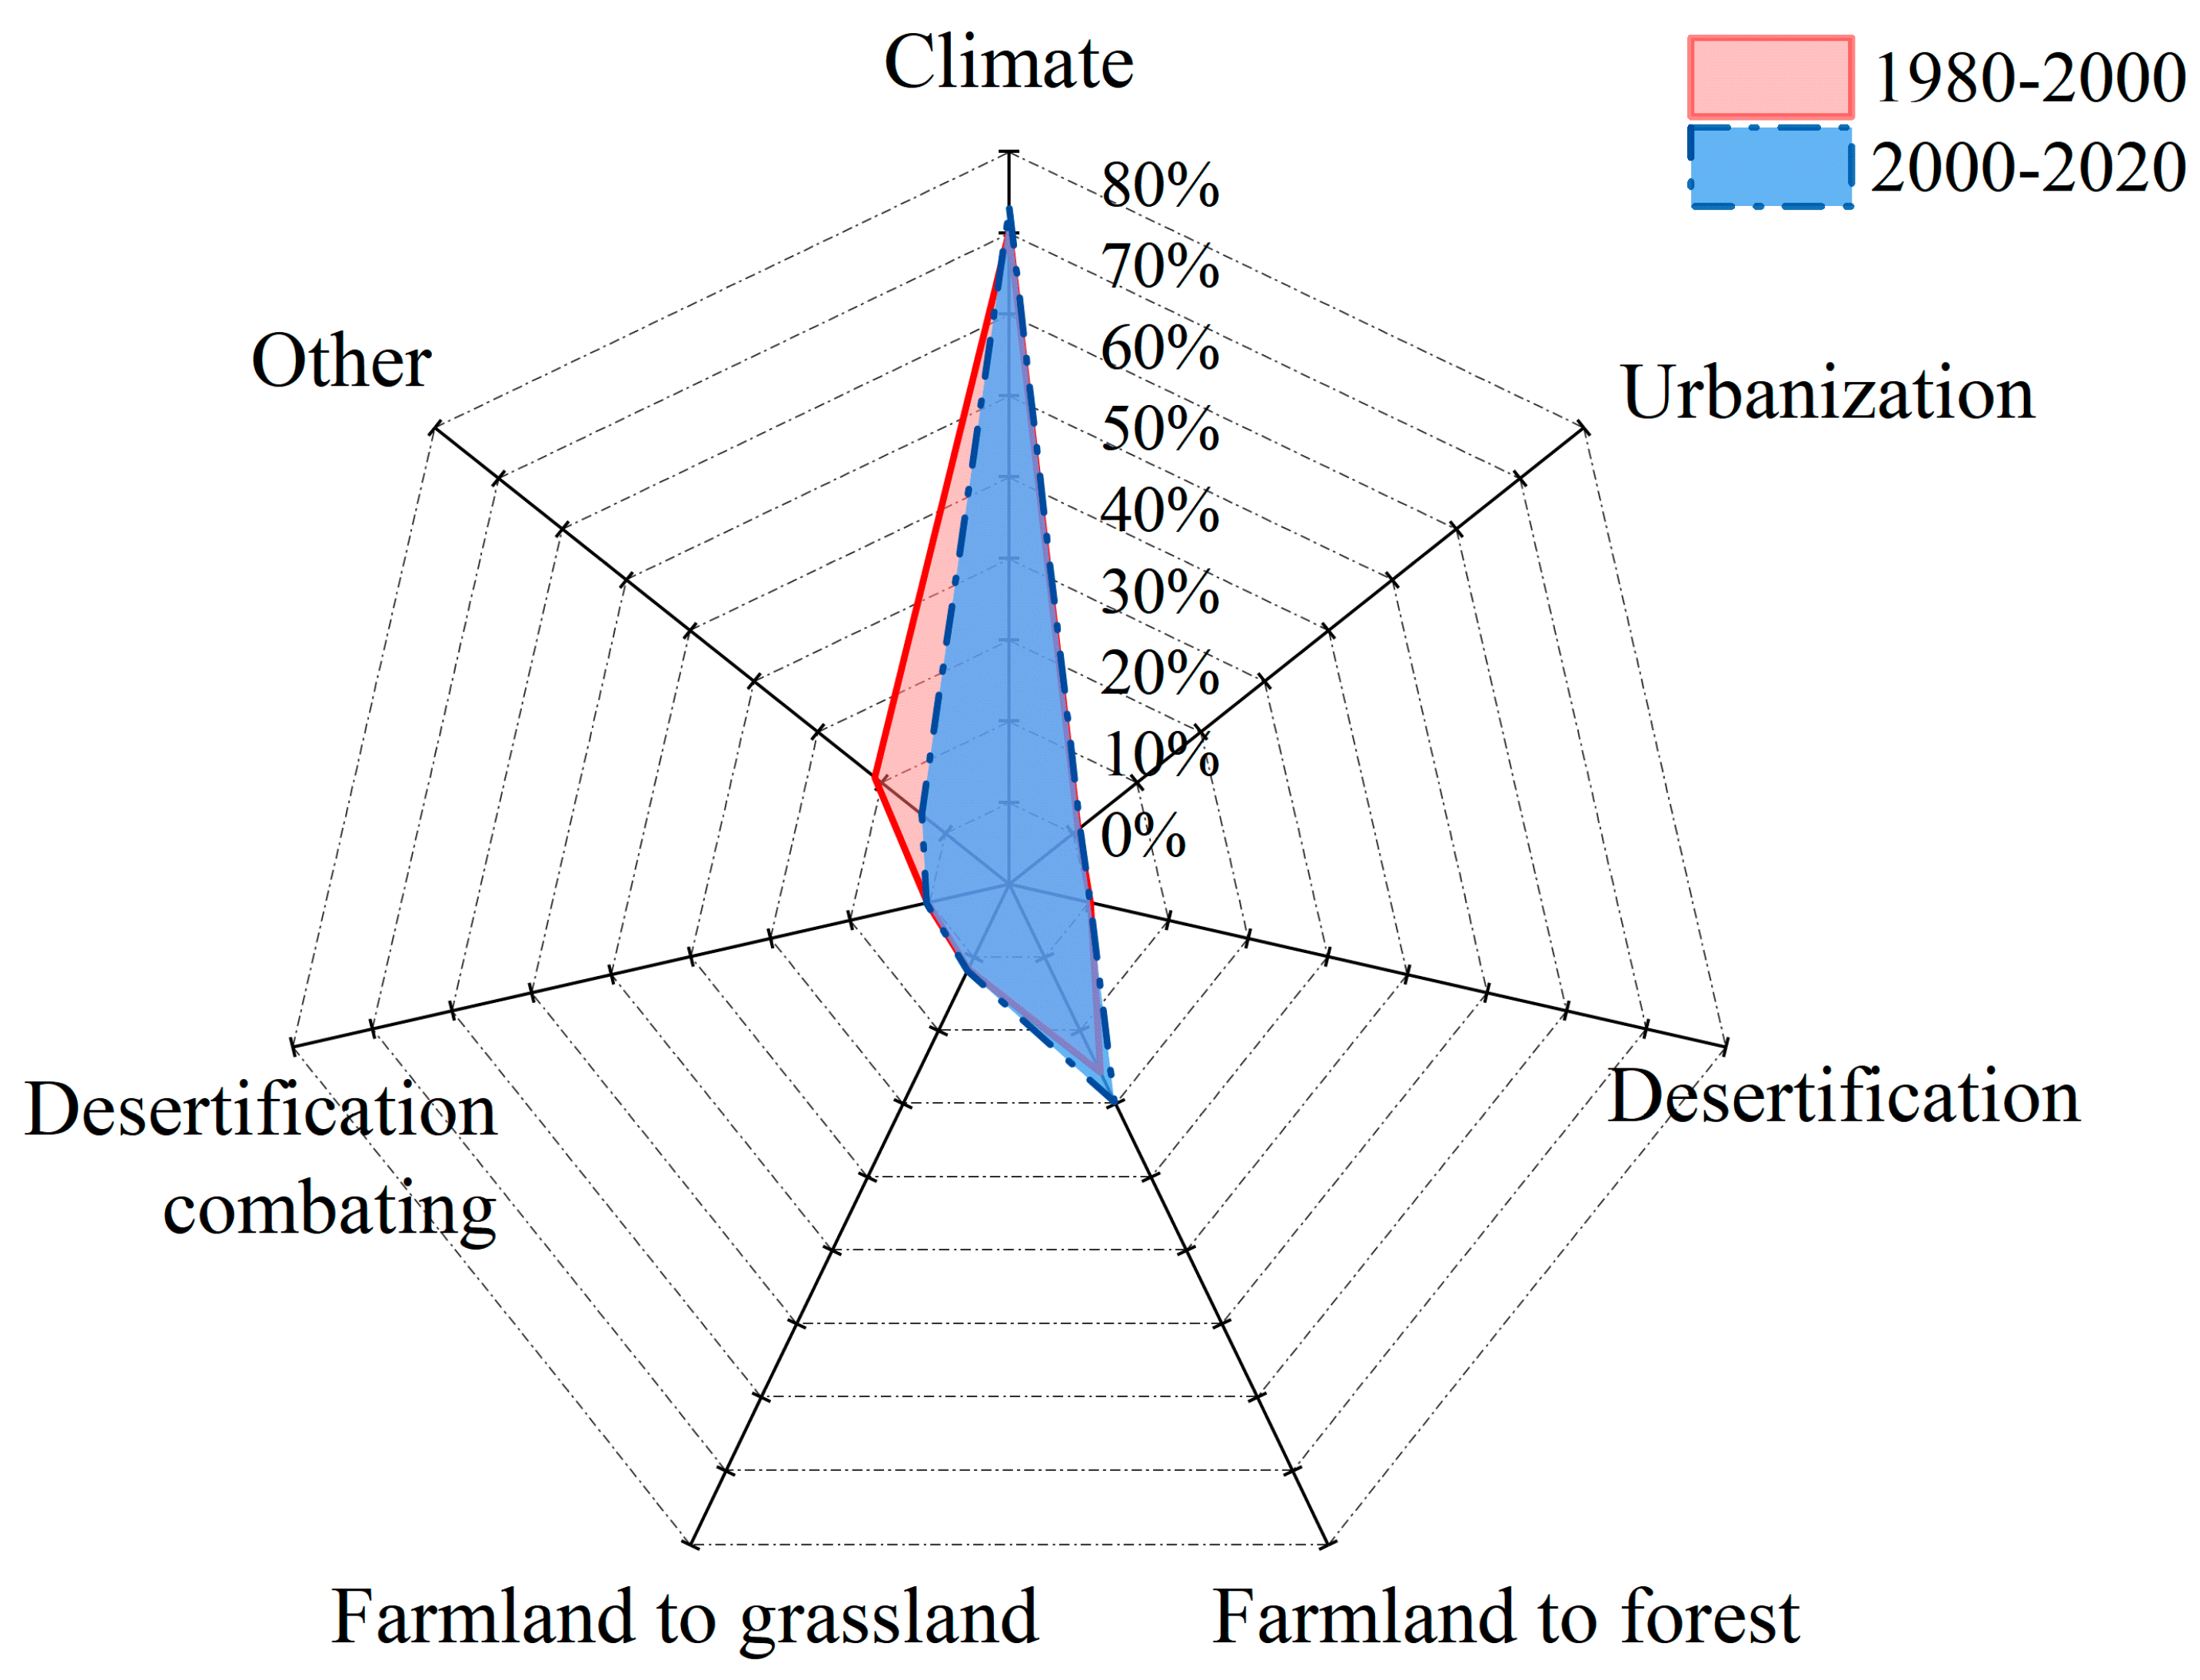
In order to further investigate the impact of climate change and land use change on NPP changes, we conducted calculations based on formulas. The degree of influence of different factors on NPP changes is shown in Figure 10. We have classified the process of land use change as follows: The process of transforming other land types to urban land types is called urbanization; the process of converting other land types into unused land is called desertification. The process of converting farmland into forest land is called returning farmland to forest, and the process of converting it into grassland is called returning farmland to grassland. The process of converting unused land into farmland, forest land, grassland, and water bodies is called desertification prevention and control. Finally, other conversion processes are collectively referred to as ‘other’.
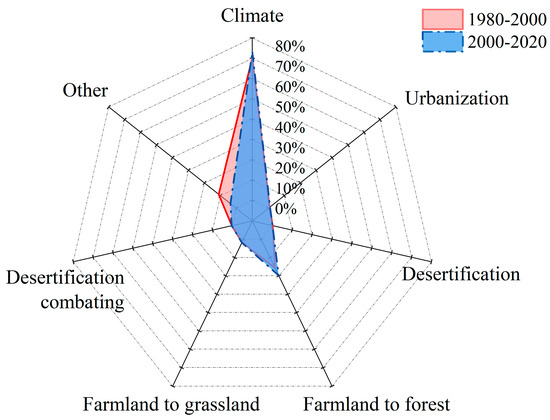
Figure 10.
The degree of influence of different factors on NPP changes.
According to the results, it can be found that climate change has the greatest impact on NPP changes, reaching around 70%. Secondly, the impact of returning farmland to forests can reach 15–20%. The impact of returning farmland to grassland is about 2%. The impact of urbanization is around 1%. The influence of other factors ranges from 4% to 11%. We refer to 1980–2000 as the “first 20 years” and 2000–2020 as the “last 20 years”. From the graph, it can also be seen that in the “last 20 years”, the impact of climate factors on NPP increased from 70.3% to 73.1%. The impact of returning farmland to forests has increased from 15.7% to 19.6%.
4. Discussion
The Poyang Lake Basin is one of the main agricultural production areas in China [49], and climate change in this region has been affecting agricultural production. According to our research findings, the annual precipitation changes in this region are quite complex and lack clear patterns. And there have been multiple abrupt changes in annual precipitation in the Poyang Lake Basin over the past 40 years. When there is a sudden change in precipitation, it often leads to hydrological disasters such as floods or droughts. Previous studies have shown that there were four major floods in the Poyang Lake Basin in 1992, 1995, 1996, and 1998 [50,51]. Our mutation test results also indicate that there were multiple mutation points in annual precipitation between 1995 and 2000. The Poyang Lake Basin is in the subtropical monsoon climate zone and is influenced by southeast and southwest monsoons, resulting in significant differences in precipitation in different seasons. And the terrain in the area is complex, including mountains, hills, and plains. The ups and downs of terrain can affect the rise and fall of air currents, thereby affecting the formation and distribution of precipitation. In terms of extreme precipitation, El Nino/Southern Oscillation (ENSO) is considered an important driving factor for the interannual variability in precipitation anomalies in China [52].
According to our analysis of hot spots and cold spots, the annual precipitation in the northeast of the Poyang Lake Basin is higher than that in the surrounding areas. This indicates a potential risk of flooding in the region, coupled with the relatively low elevation in the northeast area, which makes it prone to water accumulation. Therefore, the northeastern part of the Poyang Lake Basin should be a key monitoring area. Unlike annual precipitation, the high-value area of annual average temperature is in the southern part of the Poyang Lake Basin. Therefore, the southern region should pay attention to protection against high temperature and heat waves.
Our research shows that temperature has a significant impact on changes in NPP. Studies have shown that rising temperatures can enhance the activity of photosynthetic enzymes, reduce the rate of chlorophyll degradation, prolong vegetation growth seasons, and promote the increase in vegetation NPP [53]. In contrast, there is no strong correlation between annual precipitation and changes in NPP. The impact of precipitation on the carbon cycle of ecosystems mainly depends on the water conditions of the ecosystem at the time of precipitation occurrence (i.e., whether it is limited by water) [54,55]. The timing of precipitation also has a certain impact [56]. Previous studies have shown that in arid regions, abundant precipitation leads to an increase in soil moisture, thereby improving ecosystem productivity and carbon accumulation [57]. In humid areas, extreme precipitation is detrimental to ecosystem productivity and carbon sequestration [58]. Moreover, under prolonged flooding, vegetation roots may experience severe hypoxia and reduced respiration, ultimately leading to vegetation death [59].
In experiments on the impact of different influencing factors on NPP, we found that climate factors dominate and their influence is increasing. In recent years, there has been an increasing amount of research on compound extreme climate events by scholars both domestically and internationally. Compared to climate events caused by a single climate factor, composite events pose greater harm and have a wider range of impacts. The significance of assessing complex extreme climate events for carbon sequestration in terrestrial ecosystems is increasing. In this study, we only considered land use change as the impact of human activities on carbon sinks, which may bring some bias. In the study of the impact of human activities, we should also consider the movement of the population center and changes in impermeable areas. In addition, the simulation of NPP in this study depends on the model, and the uncertainty of the model itself may cause certain errors in the simulation results. Integrating model simulation results with field measurement results to improve the accuracy of simulation results will be an important research direction.
5. Conclusions
This study is based on regional climate model data, station meteorological data, and land use data. We used the M-K mutation test method, wavelet analysis, and the hot spot analysis method to simulate the spatiotemporal variation characteristics of annual average temperature and precipitation in the Poyang Lake Basin. We also used the CASA model to simulate the characteristics of NPP changes in the Poyang Lake Basin and finally explored the degree of influence of different factors on NPP changes in the basin in order to provide scientific guidance for the prevention and control of meteorological disasters in the basin and the rational formulation of relevant policies to address the impact of climate change on the carbon cycle.
The findings of this study highlight the critical role of climate change in driving variations in NPP within the Poyang Lake Basin. To mitigate the adverse impacts of climate change on the region’s ecosystems and to optimize carbon sequestration, the following policy recommendations are proposed: Firstly, considering the substantial influence of climate change on NPP, local governments should develop and implement adaptive strategies to minimize the negative effects of rising temperatures and changing precipitation patterns. This includes promoting climate-resilient agricultural practices and strengthening disaster preparedness in vulnerable areas, particularly in the southern and northeastern parts of the basin. Secondly, considering the crucial role that terrestrial ecosystems play in carbon sequestration, efforts should be made to protect and restore natural ecosystems in the Poyang Lake Basin. Policymakers should prioritize afforestation, reforestation, and sustainable land management practices to enhance the region’s carbon sink capacity and support biodiversity conservation. Thirdly, policymakers should focus on improving water infrastructure, optimizing water use in agriculture, and enhancing flood control systems to mitigate the impacts of extreme weather events. Finally, continued investment in climate monitoring and research is essential to track long-term climate trends and assess their impacts on ecosystems. Expanding the network of meteorological stations and leveraging advanced modeling techniques will improve the accuracy of climate projections, enabling better informed policy decisions.
Author Contributions
Conceptualization, Y.Y.; methodology, Y.Y.; software, C.W. and Y.Y.; validation, Y.Y.; data curation, Y.Y.; writing—original draft preparation, Y.Y.; writing—review and editing, T.A., C.W. and T.Y.; visualization, Y.Y.; supervision, T.Y.; project administration, T.Y.; funding acquisition, T.Y. All authors have read and agreed to the published version of the manuscript.
Funding
This work was supported by grants from the National Natural Science Foundation of China (42330707, 41930647), the Science Fund for Creative Research Groups of the National Natural Science Foundation of China (72221002), and the FuZhou Project of JiangXi province for open competition mechanism to select the best candidates (2022JDA07).
Data Availability Statement
The data that support the findings of this study are available upon request from the authors.
Conflicts of Interest
The authors declare no conflicts of interest.
References
- Bastos, A.; Sippel, S.; Frank, D.; Mahecha, M.D.; Zaehle, S.; Zscheischler, J.; Reichstein, M. A joint framework for studying compound ecoclimatic events. Nat. Rev. Earth Environ. 2023, 4, 333–350. [Google Scholar] [CrossRef]
- Murali, G.; Iwamura, T.; Meiri, S.; Roll, U. Future temperature extremes threaten land vertebrates. Nature 2023, 615, 461–467. [Google Scholar] [CrossRef] [PubMed]
- Rodell, M.; Li, B. Changing intensity of hydroclimatic extreme events revealed by GRACE and GRACE-FO. Nat. Water 2023, 1, 241–248. [Google Scholar] [CrossRef]
- Available online: https://www.worldweatherattribution.org/rapid-attribution-of-the-extreme-rainfall-in-texas-from-tropical-storm-imelda/ (accessed on 1 August 2024).
- White, R.H.; Anderson, S.; Booth, J.F.; Braich, G.; Draeger, C.; Fei, C.Y.; Harley, C.D.G.; Henderson, S.B.; Jakob, M.; Lau, C.A.; et al. The unprecedented Pacific Northwest heatwave of June 2021. Nat. Commun. 2023, 14, 727. [Google Scholar] [CrossRef]
- Available online: https://archive.ipcc.ch/pdf/ar6_material/AC6_brochure_en.pdf (accessed on 1 August 2024).
- Available online: https://archive.ipcc.ch/organization/organization_structure.shtml (accessed on 1 August 2024).
- IPCC. Summary for Policymakers. In Climate Change 2021: The Physical Science Basis. Contribution of Working Group I to the Sixth Assessment Report of the Intergovernmental Panel on Climate Change; Cambridge University Press: Cambridge, UK, 2021. [Google Scholar]
- Available online: https://www.unep.org/zh-hans/xinwenyuziyuan/xinwengao-22 (accessed on 1 August 2024).
- IPCC. Climate Change 2013: The Physical Science Basis. Contribution of Working Group I to the Fifth Assessment Report of the Intergovernmental Panel on Climate Change; Cambridge University Press: Cambridge, UK, 2013. [Google Scholar]
- Le Quéré, C.; Raupach, M.R.; Canadell, J.G.; Marland, G.; Le Quéré, C.; Raupach, M.R.; Canadell, J.G.; Marland, G.; Bopp, L.; Ciais, P.; et al. Trends in the sources and sinks of carbon dioxide. Nat. Geosci. 2009, 2, 831–836. [Google Scholar] [CrossRef]
- Piao, S.; Sitch, S.; Ciais, P.; Friedlingstein, P.; Peylin, P.; Wang, X.; Ahlstrom, A.; Anav, A.; Canadell, J.G.; Cong, N.; et al. Evaluation of terrestrial carbon cycle models for their response to climate variability and to CO2 trends. Glob. Chang. Biol. 2013, 19, 2117–2132. [Google Scholar] [CrossRef]
- Wang, X.; Piao, S.; Ciais, P.; Friedlingstein, P.; Myneni, R.B.; Cox, P.; Heimann, M.; Miller, J.; Peng, S.; Wang, T.; et al. A two-fold increase of carbon cycle sensitivity to tropical temperature variations. Nature 2014, 506, 212–215. [Google Scholar] [CrossRef]
- Zeng, Z.; Wu, W.; Li, Y.; Huang, C.; Zhang, X.; Peñuelas, J.; Zhang, Y.; Gentine, P.; Li, Z.; Wang, X.; et al. Increasing meteorological drought under climate change reduces terrestrial ecosystem productivity and carbon storage. One Earth 2023, 6, 1326–1339. [Google Scholar] [CrossRef]
- Cox, P.M.; Betts, R.A.; Jones, C.D.; Spall, S.A.; Totterdell, I.J. Acceleration of global warming due to carbon-cycle feedbacks in a coupled climate model. Nature 2000, 408, 184–187. [Google Scholar] [CrossRef]
- Van Oost, K.; Quine, T.A.; Govers, G.; De Gryze, S.; Six, J.; Harden, J.W.; Ritchie, J.C.; McCarty, G.W.; Heckrath, G.; Kosmas, C.; et al. The impact of agricultural soil erosion on the global carbon cycle. Science 2007, 318, 626–629. [Google Scholar] [CrossRef]
- Frank, D.; Reichstein, M.; Bahn, M.; Thonicke, K.; Frank, D.; Mahecha, M.D.; Smith, P.; Vicca, S.; Babst, F.; Beer, C.; et al. Effects of climate extremes on the terrestrial carbon cycle: Concepts, processes and potential future impacts. Glob. Chang. Biol. 2015, 21, 2861–2880. [Google Scholar] [CrossRef] [PubMed]
- Jiang, F.; Chen, J.; Zhou, L.; Ju, W.; Zhang, H.; Machida, T.; Ciais, P.; Peters, W.; Wang, H.; Chen, B.; et al. A comprehensive estimate of recent carbon sinks in China using both top-down and boltom-up approaches. Sci. Rep. 2016, 6, 22130. [Google Scholar]
- Fang, J.; Chen, A.; Peng, C.; Zhao, S.; Ci, L. Changes in forest biomass carbon storage in China between 1949 and 1998. Science 2001, 292, 2320–2322. [Google Scholar] [CrossRef]
- Piao, S.; Fang, J.; Ciais, P.; Peylin, P.; Huang, Y.; Sitch, S.; Wang, T. The carbon balance of terrestrial ecosystems in China. Nature 2009, 458, 1009–1013. [Google Scholar] [CrossRef] [PubMed]
- Yu, G.; Chen, Z.; Piao, S.; Peng, C.; Ciais, P.; Wang, Q.; Li, X.; Zhu, X. High carbon dioxide uptake by subtropical forest ecosystems in the East Asian monsoon region. Proc. Natl. Acad. Sci. USA 2014, 111, 4910–4915. [Google Scholar] [CrossRef]
- Wang, Q.; Zheng, H.; Zhu, X.; Yu, G. Primary estimation of Chinese terrestrial carbon sequestration during 2001–2010. Sci. Bull. 2015, 60, 577–590. [Google Scholar] [CrossRef]
- Thompson, R.; Palra, P.K.; Cchevalier, F.; Maksyulov, S.; Law, R.M.; Peters, W.; Ganshin, A.; Zhuravlev, R.; Maki, T.; Nakamura, T.; et al. Top- down assessment of the Asian carbon budget since the mid-1990s. Nat. Commun. 2016, 7, 10724. [Google Scholar] [CrossRef]
- Jiang, F.; Wang, H.; Chen, J.; Ju, W. Regional CO2 fluxes from 2010 to 2015 inferred from GOSAT XCO2 retrievals using a new version of the Global Carbon Assimilation System. Atmos. Chem. Phys. 2021, 21, 1963–1985. [Google Scholar] [CrossRef]
- Dib, A.E.; Johnson, C.E.; Driscoll, C.T.; Fahey, T.J.; Hayhoe, K. Simulating effects of changing climate and CO2 emissions on soil carbon pools at the Hubbard Brook experimental forest. Glob. Chang. Biol. 2014, 20, 1643–1656. [Google Scholar] [CrossRef]
- Mishra, G.; Jangir, A.; Francaviglia, R. Modeling soil organic carbon dynamics under shifting cultivation and forests using Rothc model. Ecol. Modell. 2019, 396, 33–41. [Google Scholar] [CrossRef]
- Yan, M.; Tian, X.; Li, Z.; Chen, E.; Wang, X.; Han, Z.; Sun, H. Simulation of Forest Carbon Fluxes Using Model Incorporation and Data Assimilation. Remote Sens. 2016, 8, 567. [Google Scholar] [CrossRef]
- Fang, P.; Yan, N.; Wei, P. Aboveground biomass mapping of crops supported by improved casa model and sentinel-2 multispectral imagery. Remote Sens. 2021, 13, 2755. [Google Scholar] [CrossRef]
- Field, C.B.; Behrenfeld, M.J.; Randerson, J.T. Primary production of the biosphere: Integrating terrestrial and oceanic components. Science 1998, 281, 237–240. [Google Scholar] [CrossRef] [PubMed]
- Available online: https://baijiahao.baidu.com/s?id=1722534552161917340&wfr=spider&for=pc (accessed on 1 August 2024).
- Li, X.; Zhang, Q.; Ye, X. Dry/Wet Conditions Monitoring Based on TRMM Rainfall Data and Its Reliability Validation over Poyang Lake Basin, China. Water 2013, 5, 1848–1864. [Google Scholar] [CrossRef]
- Yue, T.; Liu, Y.; Zhao, M. A fundamental theorem of Earth’s surface modelling. Environ. Earth Sci. 2016, 75, 1–12. [Google Scholar] [CrossRef]
- Yue, T. Surface Modeling: High Accuracy and High-Speed Methods; CRC Press: Boca Raton, FL, USA, 2011. [Google Scholar]
- Mann, H.B. Nonparametric test against trend. Econometrica 1945, 13, 245–259. [Google Scholar] [CrossRef]
- Kendall, M.G. Rank Correlation Methods. 1948. Available online: https://www.semanticscholar.org/paper/Rank-Correlation-Methods-Kendall/b7000835226609a5c0ff6dacb5c2cc9d38dfe916 (accessed on 1 August 2024).
- Gocic, M.; Trajkovic, S. Analysis of changes in meteorological variables using Mann–Kendall and Sen’s slope estimator statistical tests in Serbia. Glob. Planet Chang. 2013, 100, 172–182. [Google Scholar] [CrossRef]
- Grinsted, A.; Moore, J.C.; Jevrejeva, S. Application of the cross wavelet transform and wavelet coherence to geophysical time series. Nonlinear Process. Geophys. 2004, 11, 561–566. [Google Scholar] [CrossRef]
- Getis, A.; Ord, J.K. The analysis of spatial association by use of distance statistics. Geogr. Anal. 1992, 24, 189–206. [Google Scholar] [CrossRef]
- Streletskiy, D.A.; Sherstiukov, A.B.; Frauenfeld, O.W.; Nelson, F.E. Changes in the 1963–2013 shallow ground thermal regime in Russian permafrost regions. Environ. Res. Lett. 2015, 10, 125005. [Google Scholar] [CrossRef]
- Liu, D.; Zhao, Q.; Guo, S.; Liu, P.; Xiong, L.; Yu, X.; Zou, H.; Zeng, Y.; Wang, Z. Variability of Spatial Patterns of Autocorrelation and Heterogeneity Embedded in Precipitation. Hydrol. Res. 2018, 50, 215–230. [Google Scholar] [CrossRef]
- Potter, C.S.; Randerson, J.T.; Field, C.B.; Matson, P.A.; Vitousek, P.M.; Mooney, H.A.; Klooster, S.A. Terrestrial Ecosystem Production: A Process Model Based on Global Satellite and Surface Data. Glob. Biogeochem. Cycles 1993, 7, 811–841. [Google Scholar] [CrossRef]
- Wu, C.; Chen, K.; E, C.; You, X.; He, D.; Hu, L.; Liu, B.; Wang, R.; Shi, Y.; Li, C.; et al. Improved CASA Model Based on Satellite Remote Sensing Data: Simulating Net Primary Productivity of Qinghai Lake Basin Alpine Grassland. Geosci. Model Dev. 2022, 15, 6919–6933. [Google Scholar] [CrossRef]
- Bao, G.; Bao, Y.; Qin, Z.; Xin, X.; Bao, Y.; Bayarsaikan, S.; Zhou, Y.; Chuntai, B. Modeling Net Primary Productivity of Terrestrial Ecosystems in the Semi-Arid Climate of the Mongolian Plateau Using LSWI-Based CASA Ecosystem Model. Int. J. Appl. Earth Obs. Geoinf. 2016, 46, 84–93. [Google Scholar] [CrossRef]
- Quan, B. The Introduction to Land Use and Land Cover Change; China Science and Technology Press: Beijing, China, 2010. [Google Scholar]
- Shi, G.; Jiang, N.; Yao, L. Land Use and Cover Change during the Rapid Economic Growth Period from 1990 to 2010: A Case Study of Shanghai. Sustainability 2018, 10, 426. [Google Scholar] [CrossRef]
- Churkina, G.; Running, S.W. Contrasting climatic controls on the estimated productivity of global terrestrial biomes. Ecosystems 1998, 1, 206–215. [Google Scholar] [CrossRef]
- Nemani, R.R.; Keeling, C.D.; Hashimoto, H. Climate-driven increases in global terrestrial net primary production from 1982 to 1999. Science 2003, 300, 1560–1563. [Google Scholar] [CrossRef]
- Guo, L.; Liu, R.; Shoaib, M. Impacts of landscape change on net primary productivity by integrating remote sensing data and ecosystem model in a rapidly urbanizing region in China. J. Clean. Prod. 2021, 325, 129314. [Google Scholar] [CrossRef]
- Zhang, Q.; Sun, P.; Singh, V.P.; Li, J.; Tu, X. Evaluation of Transitional Behavior of Wetness/Drought Regimes in the Poyang Lake Basin, China. Theor. Appl. Climatol. 2016, 126, 631–642. [Google Scholar] [CrossRef]
- Zhang, Q.; Peng, S.; Chen, X.; Jiang, T. Hydrological Extremes in the Poyang Lake Basin, China: Changing Properties, Causes and Impacts. Hydrol. Process. 2011, 25, 3121–3130. [Google Scholar] [CrossRef]
- Guo, H.; Zhang, Q.; Wang, Y.J. Annual variations in climatic and hydrological processes and related flood and drought occurrences in the Poyang Lake basin. Acta Geogr. Sin. 2012, 67, 699–709. [Google Scholar]
- Li, S.S.; Yang, S.N.; Liu, X.F. Spatiotemporal variability of extreme precipitation in north and south of the Qinling–Huaihe region and influencing factors during 1960–2013. Prog. Geogr. 2015, 34, 354–363. [Google Scholar]
- Liu, Q.; Fu, Y.; Zhu, Z. Delayed autumn phenology in the Northern Hemisphere is related to change in both climate and spring phenology. Glob. Chang. Biol. 2016, 22, 3702–3711. [Google Scholar] [CrossRef]
- Knapp, A.K.; Beier, C.; Briske, D.D.; Classen, A.T.; Luo, Y.; Reichstein, M.; Smith, M.D.; Smith, S.D.; Bell, J.E.; Fay, P.A.; et al. Consequences of More Extreme Precipitation Regimes for Terrestrial Ecosystems. BioScience 2008, 58, 811–821. [Google Scholar] [CrossRef]
- Zeppel, M.J.B.; Wilks, J.V.; Lewis, J.D. Impacts of Extreme Precipitation and Seasonal Changes in Precipitation on Plants. Biogeosciences 2014, 11, 3083–3093. [Google Scholar] [CrossRef]
- Fay, P.A.; Blair, J.M.; Smith, M.D.; Nippert, J.B.; Carlisle, J.D.; Knapp, A.K. Relative Effects of Precipitation Variability and Warming on Tallgrass Prairie Ecosystem Function. Biogeosciences 2011, 8, 3053–3068. [Google Scholar] [CrossRef]
- Knapp, A.K.; Fay, P.A.; Blair, J.M.; Collins, S.L.; Smith, M.D.; Carlisle, J.D.; Harper, C.W.; Danner, B.T.; Lett, M.S.; McCarron, J.K. Rainfall Variability, Carbon Cycling, and Plant Species Diversity in a Mesic Grassland. Science 2002, 298, 2202–2205. [Google Scholar] [CrossRef]
- Heisler-White, J.L.; Blair, J.M.; Kelly, E.F.; Harmoney, K.; Knapp, A.K. Contingent Productivity Responses to More Extreme Rainfall Regimes across a Grassland Biome. Glob. Chang. Biol. 2009, 15, 2894–2904. [Google Scholar] [CrossRef]
- Kramer, K.; Vreugdenhil, S.J.; van der Werf, D.C. Effects of Flooding on the Recruitment, Damage and Mortality of Riparian Tree Species: A Field and Simulation Study on the Rhine Floodplain. For. Ecol. Manag. 2008, 255, 3893–3903. [Google Scholar] [CrossRef]


Disclaimer/Publisher’s Note: The statements, opinions and data contained in all publications are solely those of the individual author(s) and contributor(s) and not of MDPI and/or the editor(s). MDPI and/or the editor(s) disclaim responsibility for any injury to people or property resulting from any ideas, methods, instructions or products referred to in the content. |
© 2024 by the authors. Licensee MDPI, Basel, Switzerland. This article is an open access article distributed under the terms and conditions of the Creative Commons Attribution (CC BY) license (https://creativecommons.org/licenses/by/4.0/).