
The Design of a PV System of a Multi-Location Large Consumer: A Case Study from Al-Balqa Applied University


Abstract
1. Introduction
2. Methodology
2.1. Design of In-Site Generation (ISG)
2.2. Remote Wheeling PV Design
3. Case Study Results
3.1. ISG Design
3.2. RWG Based on Three Regions
3.3. Effect of Irradiation and Temprature
3.4. Effect of the Proposed Design on the National Grid
4. Comparison and Discussion
4.1. Comparison Between the Proposed Designs
4.2. The Proposed Approach Generalization
5. Conclusions
Author Contributions
Funding
Institutional Review Board Statement
Informed Consent Statement
Data Availability Statement
Acknowledgments
Conflicts of Interest
References
- Jaber, J.O. Future energy consumption and greenhouse gas emissions in Jordanian industries. Appl. Energy 2002, 71, 15–30. [Google Scholar] [CrossRef]
- Jordanian Department of Statistics. Available online: https://dosweb.dos.gov.jo/ (accessed on 11 August 2024).
- Ministry of Energy and Mineral Resources (MEMR). Available online: https://www.memr.gov.jo/EN/ListDetails/Projects/72/21 (accessed on 15 July 2024).
- International Energy Agency. Available online: https://www.iea.org/ (accessed on 10 July 2024).
- Awada, E.; Radwan, E.; Abed, S.; Al-Mahrouk, A. Economic Analysis and Design of Sustainable Solar Electric Vehicle Carport at Applied Science Private University in Jordan. Energies 2024, 17, 4321. [Google Scholar] [CrossRef]
- Jia, H.; Liang, L.; Xie, J.; Zhang, J. Environmental Effects of Technological Improvements in Polysilicon Photovoltaic Systems in China—A Life Cycle Assessment. Sustainability 2022, 14, 8670. [Google Scholar] [CrossRef]
- Mustafa, R.J.; Gomaa, M.R.; Al-Dhaifallah, M.; Rezk, H. Environmental Impacts on the Performance of Solar Photovoltaic Systems. Sustainability 2020, 12, 608. [Google Scholar] [CrossRef]
- Al-Refaie, A.; Lepkova, N.; Hadjistassou, C. Using System Dynamics to Examine Effects of Satisfaction with PV Systems, Advertising, and Competition on Energy Security and CO2 Emissions in Jordan. Sustainability 2023, 15, 14907. [Google Scholar] [CrossRef]
- Zhou, Y.; Pan, M.; Urban, F. Comparing the International Knowledge Flow of China’s Wind and Solar Photovoltaic (PV) Industries: Patent Analysis and Implications for Sustainable Development. Sustainability 2018, 10, 1883. [Google Scholar] [CrossRef]
- Asif, M. Urban Scale Application of Solar PV to Improve Sustainability in the Building and the Energy Sectors of KSA. Sustainability 2016, 8, 1127. [Google Scholar] [CrossRef]
- Gulkowski, S. Specific Yield Analysis of the Rooftop PV Systems Located in South-Eastern Poland. Energies 2022, 15, 3666. [Google Scholar] [CrossRef]
- Monna, S.; Abdallah, R.; Juaidi, A.; Albatayneh, A.; Zapata-Sierra, A.J.; Manzano-Agugliaro, F. Potential Electricity Production by Installing Photovoltaic Systems on the Rooftops of Residential Buildings in Jordan: An Approach to Climate Change Mitigation. Energies 2022, 15, 496. [Google Scholar] [CrossRef]
- Weckx, S.; D’Hulst, R.; Driesen, J. Locational Pricing to Mitigate Voltage Problems Caused by High PV Penetration. Energies 2015, 8, 4607–4628. [Google Scholar] [CrossRef]
- Shafiullah, M.; Ahmed, S.D.; Al-Sulaiman, F.A. Grid Integration Challenges and Solution Strategies for Solar PV Systems: A Review. IEEE Access 2022, 10, 52233–52257. [Google Scholar] [CrossRef]
- Salah, A.A.; Shalby, M.M.; Basim Ismail, F. The status and potential of renewable energy development in Jordan: Exploring challenges and opportunities. Sustain. Sci. Pract. Policy 2023, 19, 2212517. [Google Scholar] [CrossRef]
- Al-Shammari, S.; Ko, W.; Al Ammar, E.A.; Alotaibi, M.A.; Choi, H.-J. Optimal Decision-Making in Photovoltaic System Selection in Saudi Arabia. Energies 2021, 14, 357. [Google Scholar] [CrossRef]
- Bouaouda, A.; Afdel, K.; Abounacer, R. Unveiling Genetic Reinforcement Learning (GRLA) and Hybrid Attention-Enhanced Gated Recurrent Unit with Random Forest (HAGRU-RF) for Energy-Efficient Containerized Data Centers Empowered by Solar Energy and AI. Sustainability 2024, 16, 4438. [Google Scholar] [CrossRef]
- Cacciuttolo, C.; Guardia, X.; Villicaña, E. Implementation of Renewable Energy from Solar Photovoltaic (PV) Facilities in Peru: A Promising Sustainable Future. Sustainability 2024, 16, 4388. [Google Scholar] [CrossRef]
- KAWARENERGY. Available online: http://kawarenergy.com/ (accessed on 12 June 2024).
- Shatnawi, N.; Abu-Qdais, H.; Abu Qdais, F. Selecting renewable energy options: An application of multi-criteria decision making for Jordan. Sustain. Sci. Pract. Policy 2021, 17, 209–219. [Google Scholar] [CrossRef]
- Abu Qadourah, J. Energy and economic potential for photovoltaic systems installed on the rooftop of apartment buildings in Jordan. Results Eng. 2022, 16, 100642. [Google Scholar] [CrossRef]
- Saraswathi, K. A Review Paper on Electricity Generation from Solar Energy. Int. J. Sci. Dev. Res. 2020, 5, 279–284. [Google Scholar]
- Güney, T. Solar energy, governance and CO2 emissions. Renew. Energy 2022, 184, 791–798. [Google Scholar] [CrossRef]
- Ahsan Kabir, M.; Farjana, F.; Choudhury, R.; Imrul Kayes, A.; Sawkat Ali, M.; Farrok, O. Net-metering and Feed-in-Tariff policies for the optimum billing scheme for future industrial PV systems in Bangladesh. Alex. Eng. J. 2023, 63, 157–174. [Google Scholar] [CrossRef]
- Chakraborty, S.; Sadhu, P.K.; Pal, N. New location selection criterions for solar PV power plant. Int. J. Renew. Energy Res. 2014, 4, 1020–1030. [Google Scholar]
- Budin, L.; Grdenić, G.; Delimar, M. A quadratically constrained optimization problem for determining the optimal nominal power of a pv system in net-metering model: A case study for Croatia. Energies 2021, 14, 1746. [Google Scholar] [CrossRef]
- Sun, Y.; Venugopal, V.; Brandt, A.R. Short-term solar power forecast with deep learning: Exploring optimal input and output configuration. Sol. Energy 2019, 188, 730–741. [Google Scholar] [CrossRef]
- Luz, G.P.; Brito, M.C.; Sousa, J.M.C.; Vieira, S.M. Coordinating shiftable loads for collective photovoltaic self-consumption: A multi-agent approach. Energy 2021, 229, 120573. [Google Scholar] [CrossRef]
- Gjorgievski, V.Z.; Cundeva, S.; Markovska, N.; Georghiou, G.E. Virtual net-billing: A fair energy sharing method for collective self-consumption. Energy 2022, 254, 124246. [Google Scholar] [CrossRef]
- Reis, I.F.G.; Gonçalves, I.; Lopes, M.A.R.; Antunes, C.H. Collective self-consumption in multi-tenancy buildings–To what extent do consumers’ goals influence the energy system’s performance? Sustain. Cities Soc. 2022, 80, 103688. [Google Scholar] [CrossRef]
- Elmitwally, A. A new algorithm for allocating multiple distributed generation units based on load centroid concept. Alex. Eng. J. 2013, 52, 655–663. [Google Scholar] [CrossRef]
- Mahmoud, K.; Yorino, N.; Ahmed, A. Optimal Distributed Generation Allocation in Distribution Systems for Loss Minimization. IEEE Trans. Power Syst. 2016, 31, 960–969. [Google Scholar] [CrossRef]
- Holloway, R.; Ho, D.; Delotavo, C.; Xie, W.Y.; Rahimi, I.; Nikoo, M.R.; Gandomi, A.H. Optimal location selection for a distributed hybrid renewable energy system in rural Western Australia: A data mining approach. Energy Strateg. Rev. 2023, 50, 101205. [Google Scholar] [CrossRef]
- Kamel, S.; Abdel-Mawgoud, H.; Hashim, F.A.; Bouaouda, A.; Dominguez-Garcia, J.L. Achieving Optimal PV Allocation in Distribution Networks Using a Modified Reptile Search Algorithm. IEEE Access 2024, 12, 42651–42666. [Google Scholar] [CrossRef]
- Adewuyi, O.B.; Adeagbo, A.P.; Adebayo, I.G.; Howlader, H.O.R.; Sun, Y. Modified analytical approach for pv-dgs integration into a radial distribution network considering loss sensitivity and voltage stability. Energies 2021, 14, 7775. [Google Scholar] [CrossRef]
- Abu Dyak, A.T.; Abu-Lehyeh, E.O.; Kiwan, S. Assessment of implementing Jordan’s renewable energy plan on the electricity grid. Jordan J. Mech. Ind. Eng. 2017, 11, 113–119. [Google Scholar]
- Electric Distribution Utilities of Jordan—Launch Partnership Program with USEA. Available online: https://usea.org/sites/default/files/page_files/Article_Jordan_Dist_EEV_May_2009.pdf (accessed on 16 June 2024).
- National Electric Power Company, Annual Report. 2022. Available online: https://www.nepco.com.jo/store/DOCS/web/2022_EN.pdf (accessed on 28 May 2024).
- Sunshine & Daylight Hours in Amman, Jordan. Available online: https://www.climate.top/jordan/amman/sunlight/ (accessed on 16 July 2024).
- Božiková, M.; Bilčík, M.; Madola, V.; Szabóová, T.; Kubík, Ľ.; Lendelová, J.; Cviklovič, V. The Effect of Azimuth and Tilt Angle Changes on the Energy Balance of Photovoltaic System Installed in the Southern Slovakia Region. Appl. Sci. 2021, 11, 8998. [Google Scholar] [CrossRef]
- NASA Power/DAV. Available online: https://power.larc.nasa.gov/data-access-viewer/ (accessed on 20 July 2024).
- AlShamaileh, E.; Moosa, I.S.; Al-Fayyad, H.; Lahlouh, B.; Kazem, H.A.; Abu-Afifeh, Q.; Al-Saqarat, B.S.; Esaifan, M.; Hamadneh, I. Performance Comparison and Light Reflectance of Al, Cu, and Fe Metals in Direct Contact Flat Solar Heating Systems. Energies 2022, 15, 8888. [Google Scholar] [CrossRef]
- Jordan Meteorological Department. Available online: http://jmd.gov.jo/en/Climate1/Details/3 (accessed on 2 August 2024).


| College Name | College Located | Latitude | Longitude | Number of Students (at 2023) | Power Consumed (%) | PV Required (MW) | |
|---|---|---|---|---|---|---|---|
| 1 | Faculty of Graduate Studies | Internal | 32.02515898 | 35.71677215 | 273 | 1.096 | 0.13152 |
| 2 | Faculty of Medicine | Internal | 32.02515898 | 35.71677215 | 600 | 2.409 | 0.28908 |
| 3 | Faculty of Engineering | Internal | 32.02515898 | 35.71677215 | 1120 | 4.4974 | 0.539688 |
| 4 | Faculty of Nursing | Internal | 32.02515898 | 35.71677215 | 800 | 3.212 | 0.38544 |
| 5 | Faculty of Science | Internal | 32.02515898 | 35.71677215 | 708 | 2.843 | 0.34116 |
| 6 | Faculty of Business | Internal | 32.02515898 | 35.71677215 | 1480 | 5.943 | 0.71316 |
| 7 | Faculty of Human Sciences | Internal | 32.02515898 | 35.71677215 | 1468 | 5.8949 | 0.707388 |
| 8 | Prince Abdullah bin Ghazi Faculty of Information and Communication Technology | Internal | 32.02515898 | 35.71677215 | 516 | 2.072 | 0.24864 |
| 9 | Faculty of Technological Agriculture | Internal | 32.02515898 | 35.71677215 | 512 | 2.056 | 0.24672 |
| 10 | Salt Technical College | Internal | 32.02515898 | 35.71677215 | 88 | 0.3534 | 0.042408 |
| 11 | Artificial Intelligence College | Internal | 32.02515898 | 35.71677215 | 92 | 0.3694 | 0.044328 |
| 12 | Law College | Internal | 32.02515898 | 35.71677215 | 240 | 0.96374 | 0.1156488 |
| 13 | Huson University College | External | 32.48731073 | 35.88983552 | 1820 | 7.3084 | 0.877008 |
| 14 | Irbid University College | External | 32.54614275 | 35.86205624 | 2688 | 10.7939 | 1.295268 |
| 15 | Ajloun University College | External | 32.31807408 | 35.75208694 | 1924 | 7.726 | 0.92712 |
| 16 | Faculty of Engineering Technology | External | 31.99380503 | 36.01731455 | 2940 | 11.8058 | 1.416696 |
| 17 | Princess Alia University College | External | 31.96510614 | 35.89702225 | 1376 | 5.52543 | 0.6630516 |
| 18 | Zarka University College | External | 32.05301501 | 36.09282319 | 1732 | 6.955 | 0.8346 |
| 19 | Princess Rahma University College | External | 32.11071312 | 35.73815459 | 1200 | 4.8187 | 0.578244 |
| 20 | Amman University College for Banking and Financial Sciences | External | 32.03731051 | 35.95663113 | 1112 | 4.4653 | 0.535836 |
| 21 | Karak University College | External | 31.16483039 | 35.74657866 | 1626 | 6.52933 | 0.7835196 |
| 22 | Shobak University College | External | 30.49596666 | 35.52697523 | 132 | 0.53 | 0.0636 |
| 23 | Ma’an University College | External | 30.24549202 | 35.68824331 | 488 | 1.9596 | 0.235152 |
| 24 | Aqaba University College | External | 29.56747972 | 35.02161724 | 768 | 3.084 | 0.37008 |
| College Name | Building Number | Area (m2) | Azimuth (Degree) | PV Max Annual Generation (kWh/y) | Building | |
|---|---|---|---|---|---|---|
| 1 | Main Campus | 1 | 723 | 15 | 216,552 | 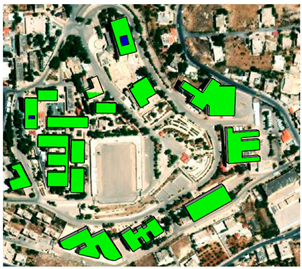 |
| 2 | 815 | 0 | 289,879 | |||
| 3 | 471 | 0 | 167,525 | |||
| 4 | 2120 | 0 | 754,041 | |||
| 5 | 967 | 0 | 343,942 | |||
| 6 | 2458 | 45 | 460,137 | |||
| 7 | 680 | 0 | 127,296 | |||
| 8 | 680 | 0 | 127,296 | |||
| 9 | 500 | 21 | 138,528 | |||
| 10 | 460 | 0 | 163,612 | |||
| 11 | 1141 | 15 | 341,752 | |||
| 12 | 1342 | 35 | 301,466 | |||
| 13 | 975 | 7 | 321,235 | |||
| 14 | 2711 | 31 | 649,599 | |||
| 15 | 1796 | 31 | 430,350 | |||
| 16 | 1872 | 9 | 602,754 | |||
| 2 | Al-Huson University College | 1 | 4180 | 5 | 1,408,492 | 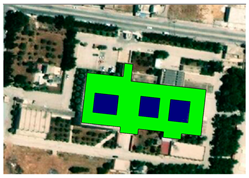 |
| 3 | Irbid University College | 1 | 2136 | 8.8 | 689,357 | 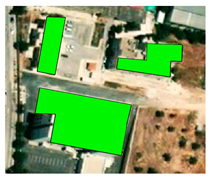 |
| 2 | 518 | 8.8 | 167,175 | |||
| 3 | 635 | 8.8 | 204,935 | |||
| 4 | Ajloun University College | 1 | 714 | 23 | 192,471 | 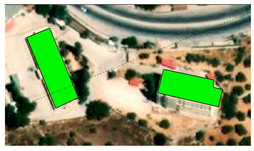 |
| 2 | 557 | 11.5 | 174,131 | |||
| 5 | Faculty of Engineering Technology | 1 | 1353 | 0 | 481,235 |  |
| 2 | 424 | 2 | 147,633 | |||
| 3 | 2731 | 24 | 725,965 | |||
| 4 | 1059 | 42 | 210,139 | |||
| 5 | 740 | 8.4 | 239,930 | |||
| 6 | 4905 | 3 | 1,689,517 | |||
| 6 | Princess Alia University College | 1 | 1352 | 15 | 404,951 |  |
| 2 | 672 | 15 | 201,277 | |||
| 7 | Zarka University College | 1 | 511 | 37 | 110,964 |  |
| 2 | 1650 | 37 | 358,300 | |||
| 3 | 1430 | 37 | 310,527 | |||
| 4 | 1104 | 37 | 239,735 | |||
| 8 | Princess Rahma University College | 1 | 717 | 3 | 246,969 |  |
| 2 | 1158 | 3 | 398,870 | |||
| 3 | 483 | 3 | 166,368 | |||
| 4 | 295 | 3 | 101,612 | |||
| 5 | 400 | 3 | 137,779 | |||
| 6 | 353 | 3 | 121,590 | |||
| 9 | Amman University College for Banking and Financial Sciences | 1 | 456 | 0 | 162,190 | 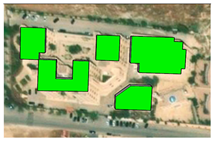 |
| 2 | 785 | 0 | 279,208 | |||
| 3 | 357 | 0 | 126,977 | |||
| 4 | 498 | 0 | 177,128 | |||
| 5 | 1123 | 0 | 399,428 | |||
| 10 | Karak University College | 1 | 1696 | 7 | 558,784 |  |
| 2 | 786 | 7 | 258,964 | |||
| 3 | 340 | 7 | 112,020 | |||
| 4 | 794 | 7 | 261,600 | |||
| 5 | 339 | 7 | 116,961 | |||
| 6 | 552 | 7 | 181,868 | |||
| 7 | 558 | 7 | 183,845 | |||
| 11 | Shobak University College | 1 | 250 | 0 | 88,920 |  |
| 2 | 266 | 0 | 94,610 | |||
| 3 | 400 | 0 | 142,272 | |||
| 4 | 1052 | 0 | 374,175 | |||
| 5 | 1715 | 0 | 609,991 | |||
| 6 | 372 | 0 | 132,312 | |||
| 7 | 665 | 0 | 236,527 | |||
| 12 | Ma’an University College | 1 | 2172 | 15 | 650,557 | 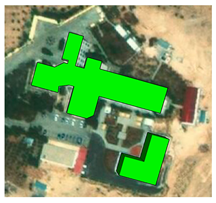 |
| 2 | 621 | 15 | 186,001 | |||
| 13 | Aqaba University College | 1 | 441 | 6 | 146,948 | 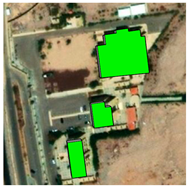 |
| 2 | 357 | 6 | 118,958 | |||
| 3 | 1588 | 6 | 529,147 |
| College Name | PV Annual Generation (MWh/y) | PV Required (MW) | State | Additional PV (MW) | Additional Area(m2) | |
|---|---|---|---|---|---|---|
| 1 | Main Campus | 6373 | 3.8052 | Uncovered | 1.349 | 9368 |
| 2 | Al-Huson University College | 1584 | 0.877 | Uncovered | 0.2678 | 1859 |
| 3 | Irbid University College | 1194 | 1.295268 | Uncovered | 0.8359 | 5805 |
| 4 | Ajloun University College | 412 | 0.92712 | Uncovered | 0.7686 | 5337 |
| 5 | Faculty of Engineering Technology | 3931 | 1.4167 | Covered | - | - |
| 6 | Princess Alia University College | 7344 | 0.663 | Covered | - | - |
| 7 | Zarka University College | 1146 | 0.8346 | Uncovered | 0.0938 | 651 |
| 8 | Princess Rahma University College | 1319 | 0.578244 | Uncovered | 0.071 | 493 |
| 9 | Amman University College for Banking and Financial Sciences | 1288 | 0.535836 | Uncovered | 0.04 | 278 |
| 10 | Karak University College | 1674 | 0.7835 | Uncovered | 0.1396 | 969 |
| 11 | Shobak University College | 1678 | 0.0636 | Covered | - | - |
| 12 | Ma’an University College | 836 | 0.235 | Covered | - | - |
| 13 | Aqaba University College | 795 | 0.37 | Uncovered | 0.06423 | 446 |
| College Name | Latitude | Longitude | PV Required (MW) | Distribution Region | Centroid | ||
|---|---|---|---|---|---|---|---|
| Latitude | Longitude | ||||||
| 1 | Huson University College | 32.48731073 | 35.88983552 | 0.877008 | North | 32.46127358 | 35.83702166 |
| 2 | Irbid University College | 32.54614275 | 35.86205624 | 1.295268 | |||
| 3 | Ajloun University College | 32.31807408 | 35.75208694 | 0.92712 | |||
| 4 | Main Campus | 32.02515898 | 35.71677215 | 3.8051808 | Middle | 32.02451992 | 35.84443157 |
| 5 | Faculty of Engineering Technology | 31.99380503 | 36.01731455 | 1.416696 | |||
| 6 | Princess Alia University College | 31.96510614 | 35.89702225 | 0.6630516 | |||
| 7 | Zarka University College | 32.05301501 | 36.09282319 | 0.8346 | |||
| 8 | Princess Rahma University College | 32.11071312 | 35.73815459 | 0.578244 | |||
| 9 | Amman University College for Banking and Financial Sciences | 32.03731051 | 35.95663113 | 0.535836 | |||
| 10 | Karak University College | 31.16483039 | 35.74657866 | 0.7835196 | South | 30.57966112 | 35.54278629 |
| 11 | Shobak University College | 30.49596666 | 35.52697523 | 0.0636 | |||
| 12 | Ma’an University College | 30.24549202 | 35.68824331 | 0.235152 | |||
| 13 | Aqaba University College | 29.56747972 | 35.02161724 | 0.37008 | |||
| State | Distribution Region | Number of PV Projects | Total Capacity (MW) | |
|---|---|---|---|---|
| 1 | Aqaba | South | 2 | 102 |
| 2 | Ma’an | South | 15 | 522 |
| 3 | Mafraq | South | 9 | 308 |
| 4 | Amman | Middle | 3 | 280 |
| Design Type | Financial Analysis | Grid and Distribution Effect | |||||
|---|---|---|---|---|---|---|---|
| New Land | Area Preparation | Implementation | Maintenance | Network | Electricity Bill | ||
| ISG | Points per faculty | No need, but building strength should be considered | Easy to prepare and supported with electricity but in some locations obstacles fund such as; water tanks and chillers. | Should be suitable for university activity and students education. | Easy to reach location with full civil services. A large number of faculties makes hard annual PV maintenance. | The system approximately cover the electricity for each faculty and supports electricity besides the university which is usually crowded demands. | Each faculty pays for the consumed power after substitute the local generation. |
 |  |  |  |  |  | ||
| RWG | Single centroid point | Single land is needed that may located in a crowded area or far from transmission line. | Hard and not supported with electricity but without obstacles. | Should be suitable for neighborhoods if available. | Hard to reach location without civil services. | The system supplies electricity to areas far from most faculties and also sometimes to regions with low demands | It is difficult to track power generation and pay for the consumed electricity when three different distribution companies need to be satisfied. |
 |  |  |  |  |  | ||
| Three centroid points | Three lands are needed that can be balanced with weight to find optimum location. | Easy to prepare, supported with electricity, and without obstacles. | Should be suitable for neighborhoods if available. | Soft to reach location without civil services. | The system supplies electricity to areas around several faculties and also near to regions with high demands | Power generation at each point and payments for each faculty are managed by their respective distribution companies. | |
 |  |  |  |  |  | ||
Disclaimer/Publisher’s Note: The statements, opinions and data contained in all publications are solely those of the individual author(s) and contributor(s) and not of MDPI and/or the editor(s). MDPI and/or the editor(s) disclaim responsibility for any injury to people or property resulting from any ideas, methods, instructions or products referred to in the content. |
© 2024 by the authors. Licensee MDPI, Basel, Switzerland. This article is an open access article distributed under the terms and conditions of the Creative Commons Attribution (CC BY) license (https://creativecommons.org/licenses/by/4.0/).
Share and Cite
Al-Mahrouk, A.; Awada, E.; Al-Rousan, W.; Al-Mahrouk, D. The Design of a PV System of a Multi-Location Large Consumer: A Case Study from Al-Balqa Applied University. Sustainability 2024, 16, 9385. https://doi.org/10.3390/su16219385
Al-Mahrouk A, Awada E, Al-Rousan W, Al-Mahrouk D. The Design of a PV System of a Multi-Location Large Consumer: A Case Study from Al-Balqa Applied University. Sustainability. 2024; 16(21):9385. https://doi.org/10.3390/su16219385
Chicago/Turabian StyleAl-Mahrouk, Akram, Emad Awada, Wasseem Al-Rousan, and Dana Al-Mahrouk. 2024. "The Design of a PV System of a Multi-Location Large Consumer: A Case Study from Al-Balqa Applied University" Sustainability 16, no. 21: 9385. https://doi.org/10.3390/su16219385
APA StyleAl-Mahrouk, A., Awada, E., Al-Rousan, W., & Al-Mahrouk, D. (2024). The Design of a PV System of a Multi-Location Large Consumer: A Case Study from Al-Balqa Applied University. Sustainability, 16(21), 9385. https://doi.org/10.3390/su16219385