Article

Factors Influencing Consumer Upcycling Behavior—A Study Based on an Integrated Model of the Theory of Planned Behavior and the Technology Acceptance Model

School of Art and Design, Beijing Forestry University, Beijing 100083, China
*
Author to whom correspondence should be addressed.
Sustainability 2024, 16(21), 9179; https://doi.org/10.3390/su16219179
Submission received: 23 August 2024 / Revised: 3 October 2024 / Accepted: 15 October 2024 / Published: 23 October 2024

Abstract

:
In the context of the global climate change debate, changing consumer awareness and guiding them towards sustainable lifestyles should be key considerations. This study investigates the factors influencing consumers’ upcycling behaviors by conducting research and collecting 336 valid questionnaires at the “Eco Blet” sustainable design exhibition and workshop held at Livat Beijing (Ingka Centres Beijing). The survey results revealed that consumers’ upcycling behavior is significantly influenced by subjective norms, perceived behavioral control, perceived usefulness, and attitudes. In addition, individuals with higher levels of education and those with annual incomes of less than 100,000 RMB and more than 400,000 RMB are more likely to engage in upcycling. The empirical analysis of consumer upcycling behavior is conducted using structural equation modeling (SEM), and the theory of planned behavior (TPB) and technology acceptance model (TAM) are integrated into a comprehensive framework. This research provides both theoretical support and practical insights for promoting sustainable consumer behaviors, contributing significantly to carbon emission reduction.

1. Introduction

Economic progress has led to large amounts of carbon emissions, triggering climate and environmental problems such as global warming, rising sea levels and pollution. These challenges threaten human survival [1]. The Green Paper on Climate Change: Report on Combating Climate Change (2021) points out that the transition time for developed countries from carbon emissions peaking to achieving carbon neutrality is usually 50 to 70 years, while China has only pledged to complete this transition within 30 years, which puts China under tremendous pressure [2]. Against this background, China needs to take a sustainable, low-carbon, and high-quality development path. In addition to transforming production and consumption methods, it is essential to change consumer behavior, with promoting upcycling and recycling being crucial components of this effort. By transforming unwanted items into higher-value products and reducing waste generation, upcycling is more conducive to environmental sustainability than other practices such as recycling [3].
Upcycling is a sustainable design process that involves creating or modifying goods from discarded materials or components. It is a fundamental notion in the burgeoning circular economy [4,5]. Early humans used bones and stones to make tools and plants to build shelters, while modern people reuse corrugated cardboard boxes or use plastic bottles to store rice [6]. Upcycling represents an advanced environmental protection concept that not only promotes environmental conservation and resource efficiency but also reflects evolving consumer attitudes, a heightened sense of responsibility, and deeper spiritual values. As environmental concerns intensify, resources become increasingly scarce, and waste levels surge; hence, the upcycling concept has gained traction. Numerous companies, enterprises, and creative teams have adopted upcycling as a core element of their marketing strategies, highlighting its growing significance in promoting sustainable lifestyles. Nastasi has also found that upcycling has great potential to improve socio-economic and environmental benefits [7].
In macroeconomic research, the study data show that upcycling has formed a USD 400 billion market globally each year, especially in the fashion and food sectors. Prominent brands like Alexander McQueen, Levi’s, and Louis Vuitton are driving sustainable fashion by creating new products from discarded materials and surplus fabrics. Additionally, the Upcycled Food Association has introduced new certification standards to promote the use of ingredients that would otherwise be wasted. The United States holds the largest share of the upcycling market, while in Asia, South Korea follows closely behind. In South Korea, the number of upcycling brands increased from 11 in 2010 to 150 in 2016 [8]. Japan is also developing a substantial upcycling market due to its advanced waste management policies and initiatives. In China, however, consumer awareness of upcycling remains low, and the market acceptance of upcycled products is still limited. Therefore, enhancing consumer understanding of upcycling and encouraging sustainable lifestyles presents a significant growth opportunity in China.
In academic research, Sung conducted a comprehensive study on upcycling design, utilizing multiple databases such as Google Scholar, IEEE, and Elsevier. Her findings indicate a rapid increase in research papers on upcycling design since 2008, with a concentration in engineering technology, design, waste management, and lifestyle sectors [9]. In the industrial sector, food waste can be repurposed in the production of cosmetics, for example, grape pomace from wine production is used to extract polyphenols, fatty acids, minerals, and vitamins for cosmetic use. In the construction industry, Guselnikova’s research proposes ways to convert waste materials into high-value materials through post-polymerization modification or surface functionalization without breaking the polymer chain [10]. From the field of design practice, some designers have integrated creativity into upgrades and reconstructions, resulting in some artistic works and personal brands. For example, Adidas introduced a running shoe partially manufactured from recycled fishing nets, while FREITAG utilizes recycled materials such as truck tarps, old seat belts, and car inner tubes to produce bags and accessories [11]. Burns discusses sustainable design development through upcycling in fashion design education [12]. Bridgens et al. discussed the potential of creatively upgrading recycling, reconnecting people with materials, and exploring public reactions to creative reuse by creating a café structure entirely made of recycled materials [6]. In community service design, Wu and colleagues proposed a new community service model to expand the upcycling of discarded clothing. By connecting community residents through online platforms and offline workshops, they highlighted the unique role of “community tailors” who provide technical support for transforming old clothes. They proposed a community-based service network linking local residents and hobbyists with “community tailors”, which can further connect with local schools and fashion brands to promote a sustainable culture [13]. At the enterprise and consumer levels, the Seoul Upcycling Plaza, established in 2017 in South Korea, is the largest upcycling cultural complex. This comprehensive community integrates material collection, design, experience, and sales, providing materials and venues for upcycling activities. It also features galleries and shops, offering significant potential for expanding upcycling practices in both educational and consumer contexts [14].
Some scholars have also focused on the factors that influence upcycling behavior. Shi used qualitative research methods to analyze consumers’ psychological motivations when choosing upcycling, such as personal values, environmental awareness, and creative expression. The study found that upcycling not only satisfied consumers’ sense of environmental responsibility but also enhanced their sense of achievement and self-efficacy [3]. In Sovanna’s study on factors influencing Japanese consumers’ clothing upcycling behavior, it was proposed that perceived pleasure and environmental awareness also significantly affect consumers’ upcycling behavior [15]. Sung highlights that upcycling can mitigate environmental impact, with attitudes, intentions, and subjective norms being critical determinants of upcycling behavior [16].
In the literature survey, we found that only a few scholars paid attention to the factors affecting upcycling. Sung also emphasized that upcycling is insufficiently researched; it has the potential to become one of the environmentally sustainable behaviors and may help reduce waste and greenhouse gas emissions [16,17,18,19,20]. In contrast, more scholars focus on other sustainable behaviors. For example, they pay more attention to research related to consumers’ behavior in purchasing sustainable products, waste recycling behavior, and environmental protection behavior [21,22,23,24,25,26,27].
While upcycling has not been widely studied, it is exactly the kind of approach that has the potential to significantly reduce waste and energy consumption, offering a broad perspective on carbon reduction. Therefore, this study investigated the intrinsic and extrinsic factors influencing consumer upcycling behavior by constructing an integrated model that combines the technology acceptance model (TAM) and the theory of planned behavior (TPB). The model was analyzed and validated through design practice, and based on the findings, effective intervention strategies were proposed to encourage and increase upcycling behaviors, which could have a positive impact on reducing carbon emissions.

2. Research Model and Hypotheses

In psychological research, understanding behavior and behavior change often relies on theoretical models that explain the nature of behaviors and how they are influenced and constrained. Therefore, selecting an appropriate model to understand specific behaviors is crucial. For the study of sustainable behavior, Stern identified four categories of influencing factors: (a) attitudinal factors, including norms and values; (b) external situational factors, such as interpersonal relationships, legal, and institutional factors; (c) personal capabilities, which encompass income, resources, talents, and knowledge; and (d) personal habits, as changing behavior often requires breaking old habits [28]. Additionally, many scholars agree on the complexity of sustainable behavior, emphasizing the need to understand it through both internal and external factors [29,30]. The study of upcycling behavior in this research is particularly well-suited to Ajzen’s TPB and Davis’s TAM.

2.1. Theoretical Framework

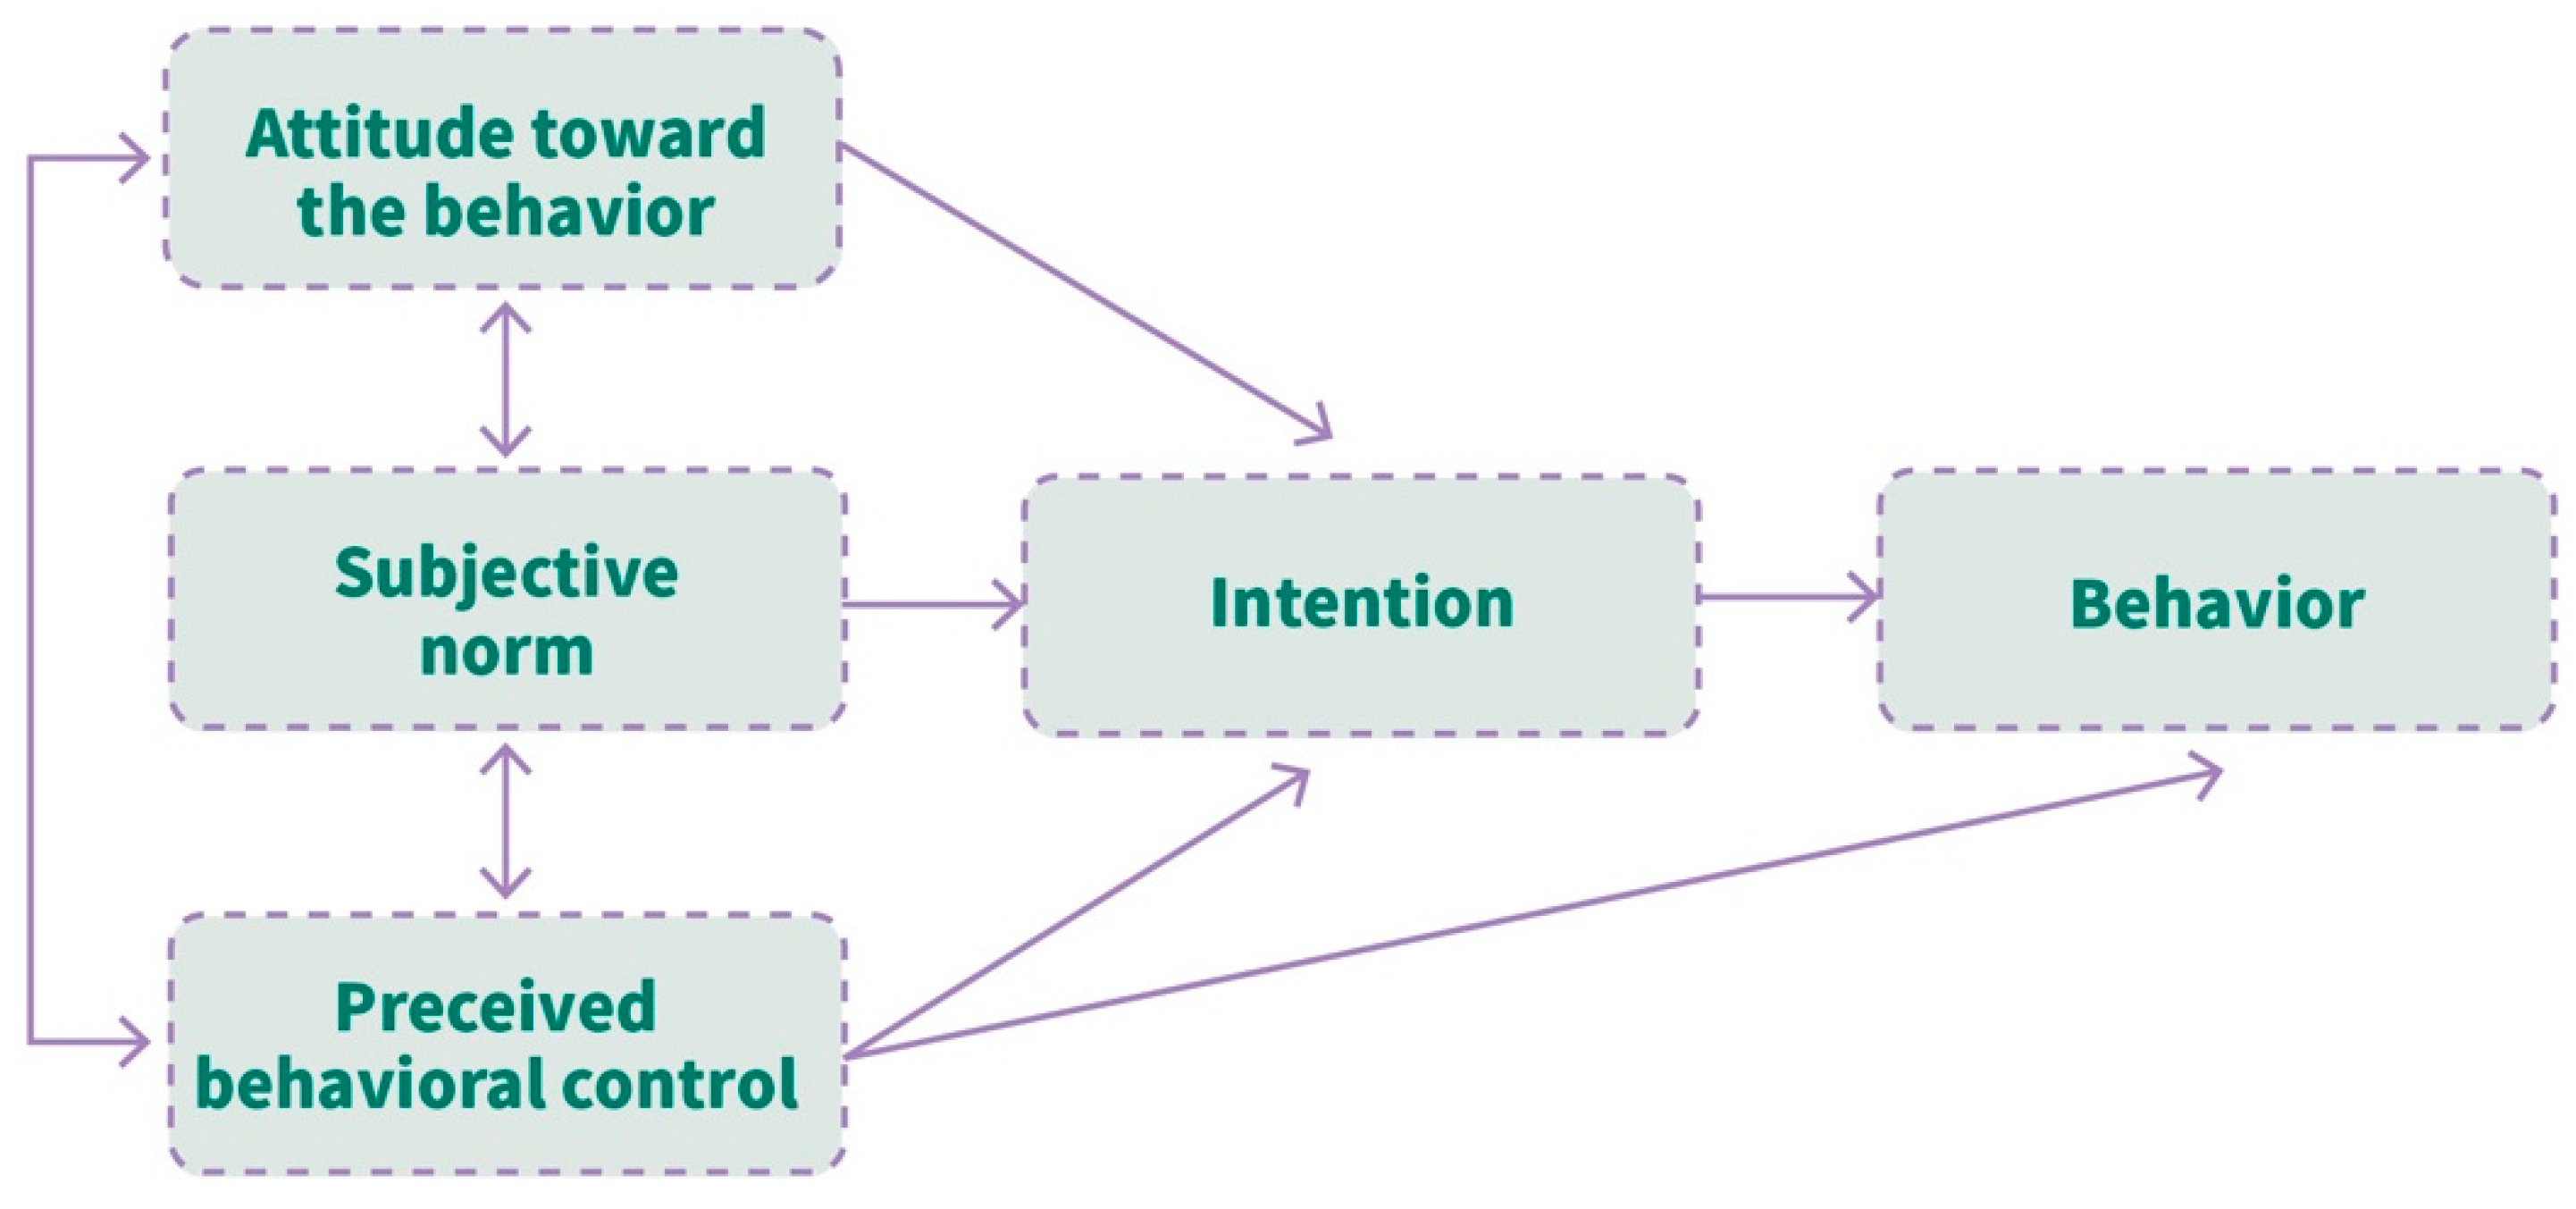
2.1.1. Theory of Planned Behavior

Ajzen developed the TPB, which is an extension of the Theory of Reasoned Action (TRA), explains individual behavior decision-making processes [31]. TRA proposes that subjective norms and attitude are fundamental factors influencing behavioral intention [32]. Ajzen enhanced the predictive capability of TRA by incorporating perceived behavioral control, resulting in the formulation of TPB [31]. The TPB states that behavioral intention, influenced by attitude, subjective norms, and perceived behavioral control, is the most reliable predictor of conduct. A positive mood, perceived support from significant others, and a sense of ease in completing an action all contribute to strengthening an individual’s desire to engage in that behavior and increase the likelihood of it occurring. The TPB comprises the following five components (Figure 1):
  • Attitude: Attitude pertains to an individual’s personal evaluation of the attractiveness or unattractiveness of participating in a specific conduct. Positive attitudes are likely to encourage behavior, while negative attitudes can deter it.
  • Subjective Norm: Social pressure refers to the influence exerted by important individuals such as family and friends, which can either encourage or discourage the performance of a specific action.
  • Perceived Behavioral Control: It is the subjective evaluation of the ease or difficulty of executing a specific behavior by an individual. It considers both internal factors, such as emotional regulation, experiences, and abilities, and external factors, such as information, opportunities, and resources.
  • Intention: It pertains to an individual’s level of determination and motivation to carry out a certain conduct, as demonstrated by their specific plans and actions.
  • Behavior: The actual action taken, which is largely determined by behavioral intention but also directly influenced by perceived behavioral control, leading to possible inconsistencies between intention and behavior.
The robust explanatory and predictive power of TPB was demonstrated by Armitage and Conner’s analysis, which revealed that attitude, subjective norms, and perceived behavioral control account for 27% of the difference in behavior and 39% of the difference in behavioral intention [33].

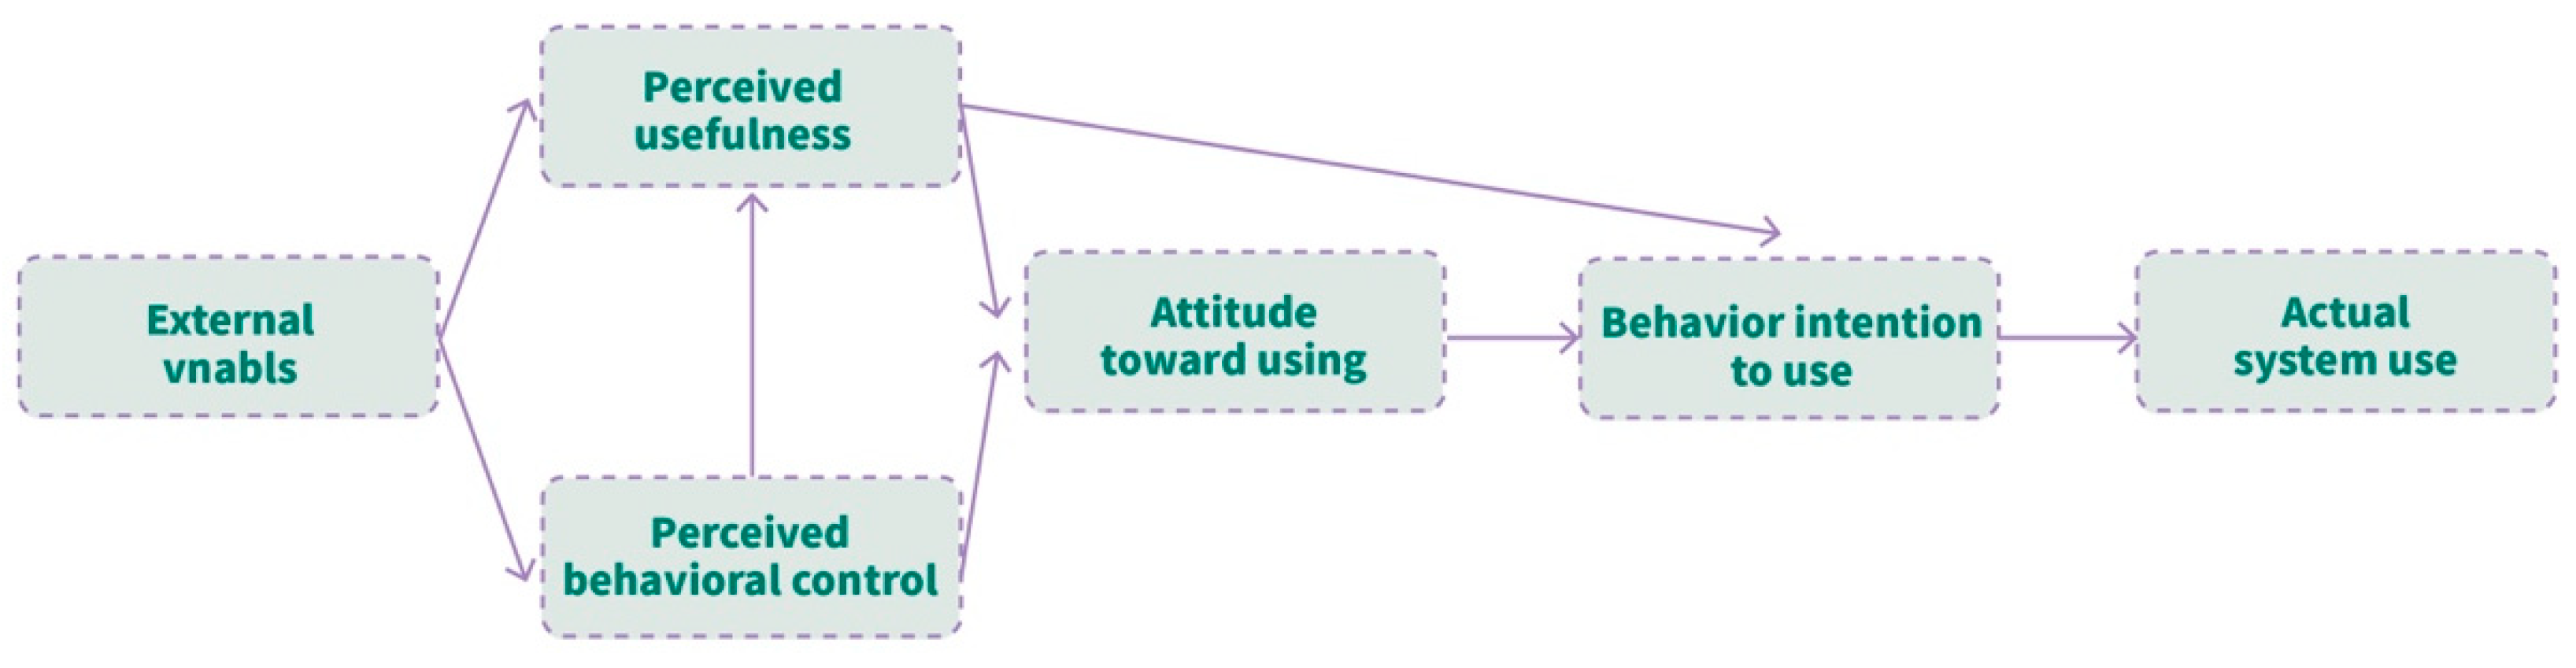
2.1.2. Technology Acceptance Model

In 1989, Davis proposed the TAM, which expands upon the TRA by integrating multiple ideas of behavior and expectations to examine the acceptance of information systems by users. TAM is a well-established framework for analyzing the various aspects that influence the adoption of new technologies and subsequent usage behavior. Numerous studies on the acceptance and application of new technologies have demonstrated the powerful predictive capability of the TAM [34]. According to TAM, the behavior of a user in utilizing a system based on their intended behavior, which is influenced by their attitude and perceived benefit. Perceived utility and the factors that determine attitude include perceived simplicity of usage, with perceived ease of use also influencing perceived usefulness [35]. For instance, Liu et al. employed TAM to study consumer behavior in choosing smart hotels, finding that perceived usefulness and ease of use significantly impacted consumer behavior [36]. TAM consists of the following six elements (Figure 2):
  • Perceived usefulness: The degree to which a person thinks that using a certain technology would enhance their productivity, efficiency, or ability to finish tasks. It highlights the practical benefits of the technology for achieving personal goals.
  • Perceived ease of use: Usability refers to the extent to which a user considers a technology as being user-friendly. Increased perceived ease of use results in a more favorable attitude towards the technology.
  • Attitude toward using: User’s overall appraisal of a specific technology, including both positive and negative emotions derived from their evaluations of the technology’s utility and user-friendliness.
  • Subjective norms: The perceived social pressure to use a specific technology, influenced by the expectations of colleagues, family, friends, or other social groups.
  • Behavioral intention: The individual’s intention to adopt a particular technology, indicating their plans to use it in the future and serving as a precursor to actual adoption.
  • Actual system use: The individual’s real-world use of a particular technology, extending from behavioral intention to practical adoption and usage.

2.1.3. Model Integration

The fundamental components of the TPB encompass attitude, subjective norms, and perceived behavioral control. This theory considers both internal psychological factors and external social pressures, focusing on the subjective attitudes of individuals. It is widely used to explain and predict a range of behaviors. Prior to this study, interviews with consumers revealed that the attitudes and participation of those around them towards upcycling influence their own participation. Additionally, the perceived ease or difficulty of upcycling also affects their involvement. Thus, TPB is appropriate for this study.
The fundamental variables of the TAM comprise attitude, perceived usefulness, and perceived ease of use. TAM is widely applied to explain users’ acceptance and usage behavior towards technology. Upcycling, as a relatively novel environmental approach, requires participants to have certain learning, creativity, and manual skills, making TAM suitable for this study.
Both TAM and TPB are derived from the TRA. While TAM primarily emphasizes the new technology adoption, it fails to contemplate important social and emotional elements. In contrast, TPB successfully considers these factors. TPB emphasizes subjective control over behavior. This similarity provides the basis for integrating the two theories. Research has shown that an integrated model has higher explanatory power than using TAM or TPB alone. For example, Chen’s study found that drivers’ adoption of ETC services is influenced by a combination of technology acceptance, social institutions, and personal traits. Therefore, combining TPB and TAM to study drivers’ attitudes towards ETC services proved effective [37]. Choe and Kim were among the first to attempt to combine the TAM with the theory of planned behavior (TPB) to explain consumer behavior in the field of robotic restaurants, and their model has been highly validated, proving effective in predicting consumer behavior in dining environments [38]. Upcycling behavior involves the acceptance of an innovative technology and is influenced by complex factors such as society, the behavior of others, and personal attitudes. Using these two theories together enables a more comprehensive understanding and prediction of upcycling behavior.

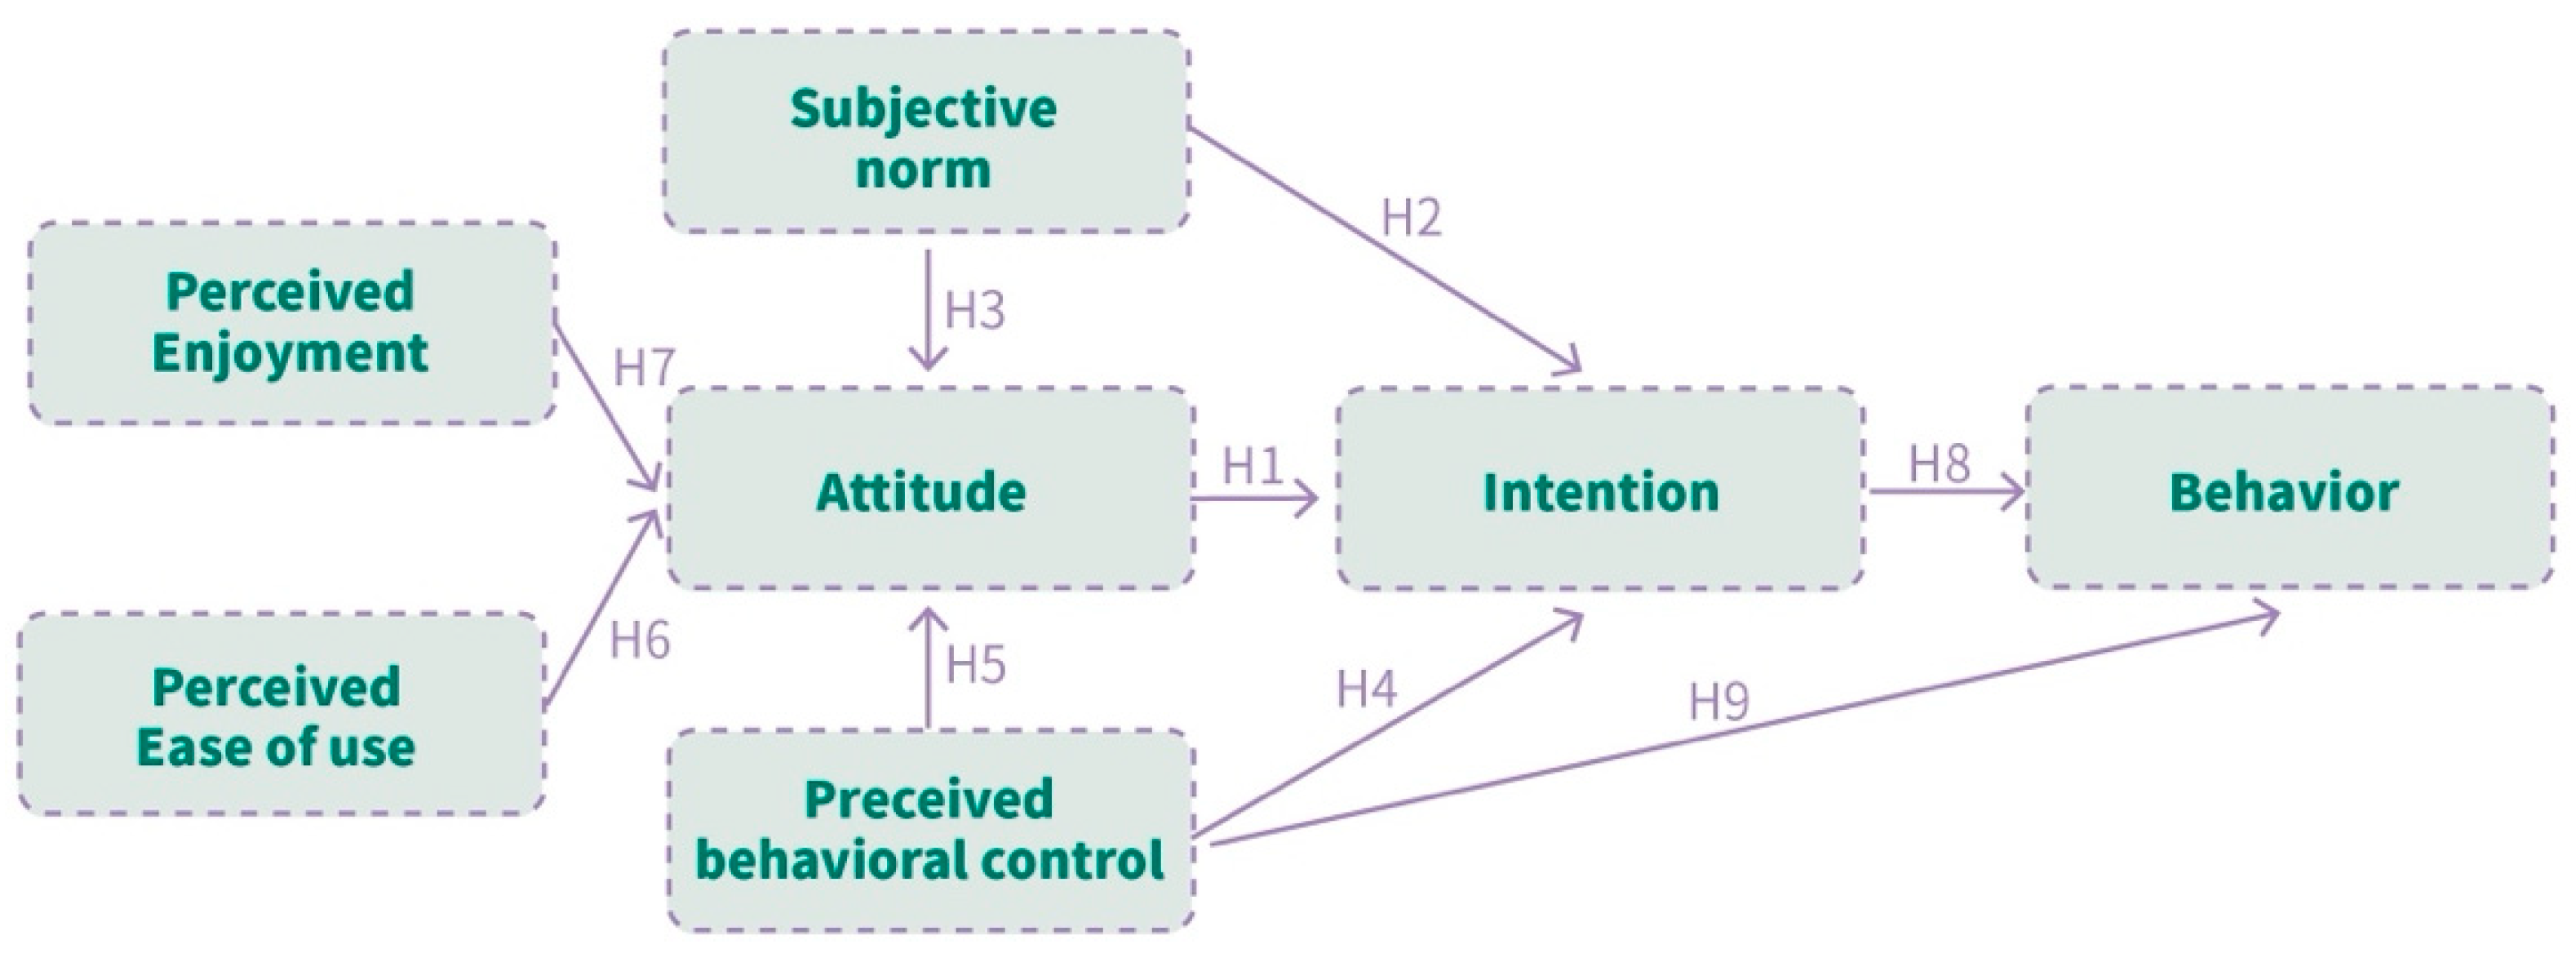
2.2. Revised Behavior Model

This work aims to combine the TPB and TAM models in order to enhance the model’s ability to explain and predict outcomes, taking into account the limitations of both models. The new theoretical model consists of seven variables, such as attitude, subjective norms, perceived behavioral control, and nine assumptions (Figure 3):

2.2.1. Attitude

Rausch and Kopplin discovered that consumers’ perspectives regarding sustainable apparel and subjective norms have a substantial impact on their intentions to purchase, which then affects their actual buying behavior of environmentally friendly apparel [39]. Kang et al. conducted a comparative analysis of young customers in South Korea, the US, and China discovered that behavioral attitude positively influence consumers’ purchase intentions for sustainable textile clothing [40]. According to the TPB framework, behavioral attitude may both explain and forecast behavioral intents, making it a useful predictor of such intentions [31]. From this, the following hypothesis is put forward:
H1. 
Attitude towards upcycling has a beneficial impact on intention to engage in upcycling behavior.

2.2.2. Subjective Norm

According to the TPB theoretical framework, subjective norms are effective predictors of behavioral intention. They can explain and predict behavioral intentions and often influence personal attitudes, making individuals more likely to follow social expectations [33]. For example, Kim and Seock found that individual norms regarding the purchase of environmentally friendly products significantly influence purchase intentions. Furthermore, the subjective standards that consumers perceive can indirectly influence their intentions to make a purchase by means of individual norms [41]. From this, the following hypotheses are put forward:
H2. 
Subjective norms have a positive influence on the analysis of intention to engage in upcycling behavior.
H3. 
Subjective norms have a positive influence on the attitude toward upcycling behavior.

2.2.3. Perceived Behavioral Control

Stronger behavioral intentions are associated with higher levels of perceived behavioral control, according to Ajzen’s analysis of much research [42]. From this, the following hypothesis is put forward:
H4. 
The inclination to engage in upcycling activity is positively influenced by perceived behavioral control.
Paul’s study demonstrated a favorable influence of both attitude and perceived behavioral control on customers’ behavior in purchasing green items when investigating their relationship. Attitude exerts the most potent influence on purchase intention, with perceived behavioral control ranking second in significance [43]. From this, the following hypothesis is put forward:
H5. 
Upcycling behavior attitudes are positively impacted by perceived behavioral control.
Kang et al. found that consumers’ purchase intentions are positively influenced by perceived behavioral control in a comparative study of the purchasing behavior of youth consumers of sustainable textile apparel in China, the United States, and South Korea [40]. In addition, when consumers can clearly perceive changes in internal and external conditions, perceived behavioral control will also directly affect behavior. From this, the following hypothesis is put forward:
H9. 
Consumer perceived behavioral control positively influences upcycling behavior.

2.2.4. Perceived Ease of Use

Consumers’ perception of how simple or difficult it is to participate in upcycling activities is known as perceived ease of usage, emphasizing consumers’ internal experiences and personal understanding. Shen has shown that higher perceived ease of use leads to a stronger willingness to use online services [44]. From this, the following hypothesis is put forward:
H6. 
Consumers’ attitudes toward upcycling are positively influenced by their perceived simplicity of use.

2.2.5. Perceived Enjoyment

Perceived enjoyment refers to the pleasure individuals gain from upcycling activities, fulfilling their needs for enjoyment or interest [45]. Through individual or group upcycling activities, consumers interact with materials and tools, stimulating personal creativity and evoking positive, pleasant emotions and experiences. From this, the following hypothesis is put forward:
H7. 
Perceived entertainment positively influences consumers’ attitudes towards participating in upcycling.

2.2.6. Intention

Usually, behavior is a direct reflection of one’s goals. Locals are more likely to engage in upcycling activities if they have stronger intentions to upcycle [33]. From this, the following hypothesis is put forward:
H8. 
Consumer intention to engage in upcycling positively influences actual upcycling behavior.

3. Research Process and Methods

The subjects of this study are consumers with experience in or interest in upcycling, regardless of age, occupation, or gender. For example, the public often subconsciously reuses plastic bottles and cardboard boxes, while artists deliberately use waste materials for creative expression. Given the challenge of determining a sampling frame, purposive sampling was employed [46]. The questionnaires were distributed at the “Eco Blet” sustainable design exhibition and workshop to ensure that participants met the study criteria, thus providing accurate data. However, purposive sampling may result in an under-representative sample, potentially limiting the generalizability of the findings. Since the sample selection was not random, the results may not be applicable to all populations or situations.

3.1. Design Overview

This design initiative takes place at Livat Beijing (Ingka Centres Beijing), which serves as a multifunctional space encompassing shopping, socialization, inspiration, and community engagement on a global scale. It not only provides physical gathering spaces and experiential venues but also prioritizes making a sustained positive impact on both the local community and the environment [47].
The exhibition space is situated on the first floor of Livat Beijing (Ingka Centres Beijing), occupying a rectangular corridor measuring 80 m long and 9 m wide. The design’s height and width are tailored to accommodate commercial space requirements without obstructing the adjacent shops, while ensuring smooth pedestrian flow.

3.2. Design Process

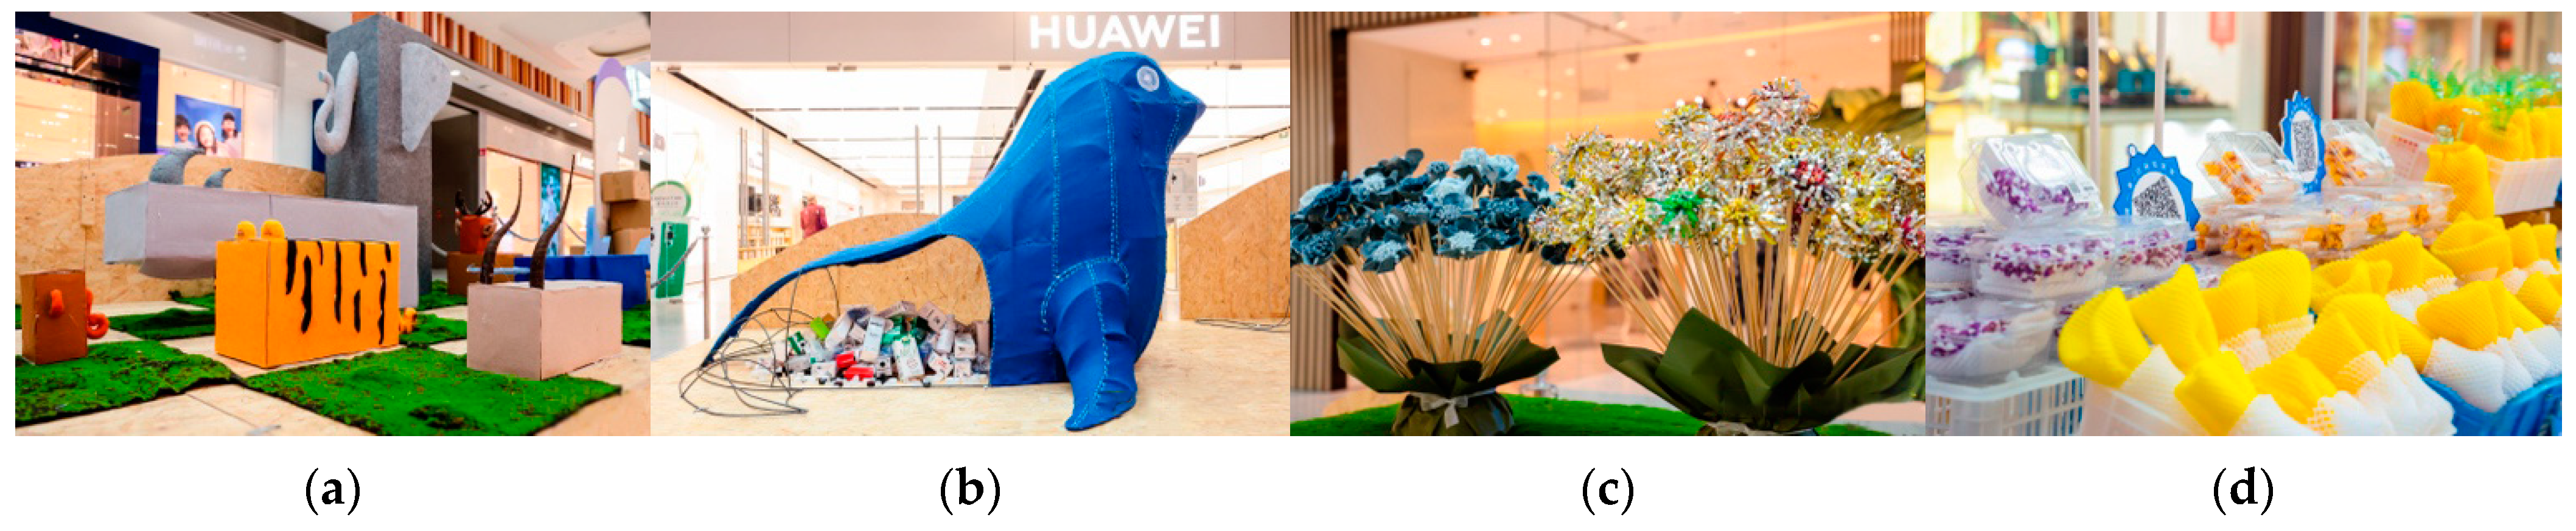
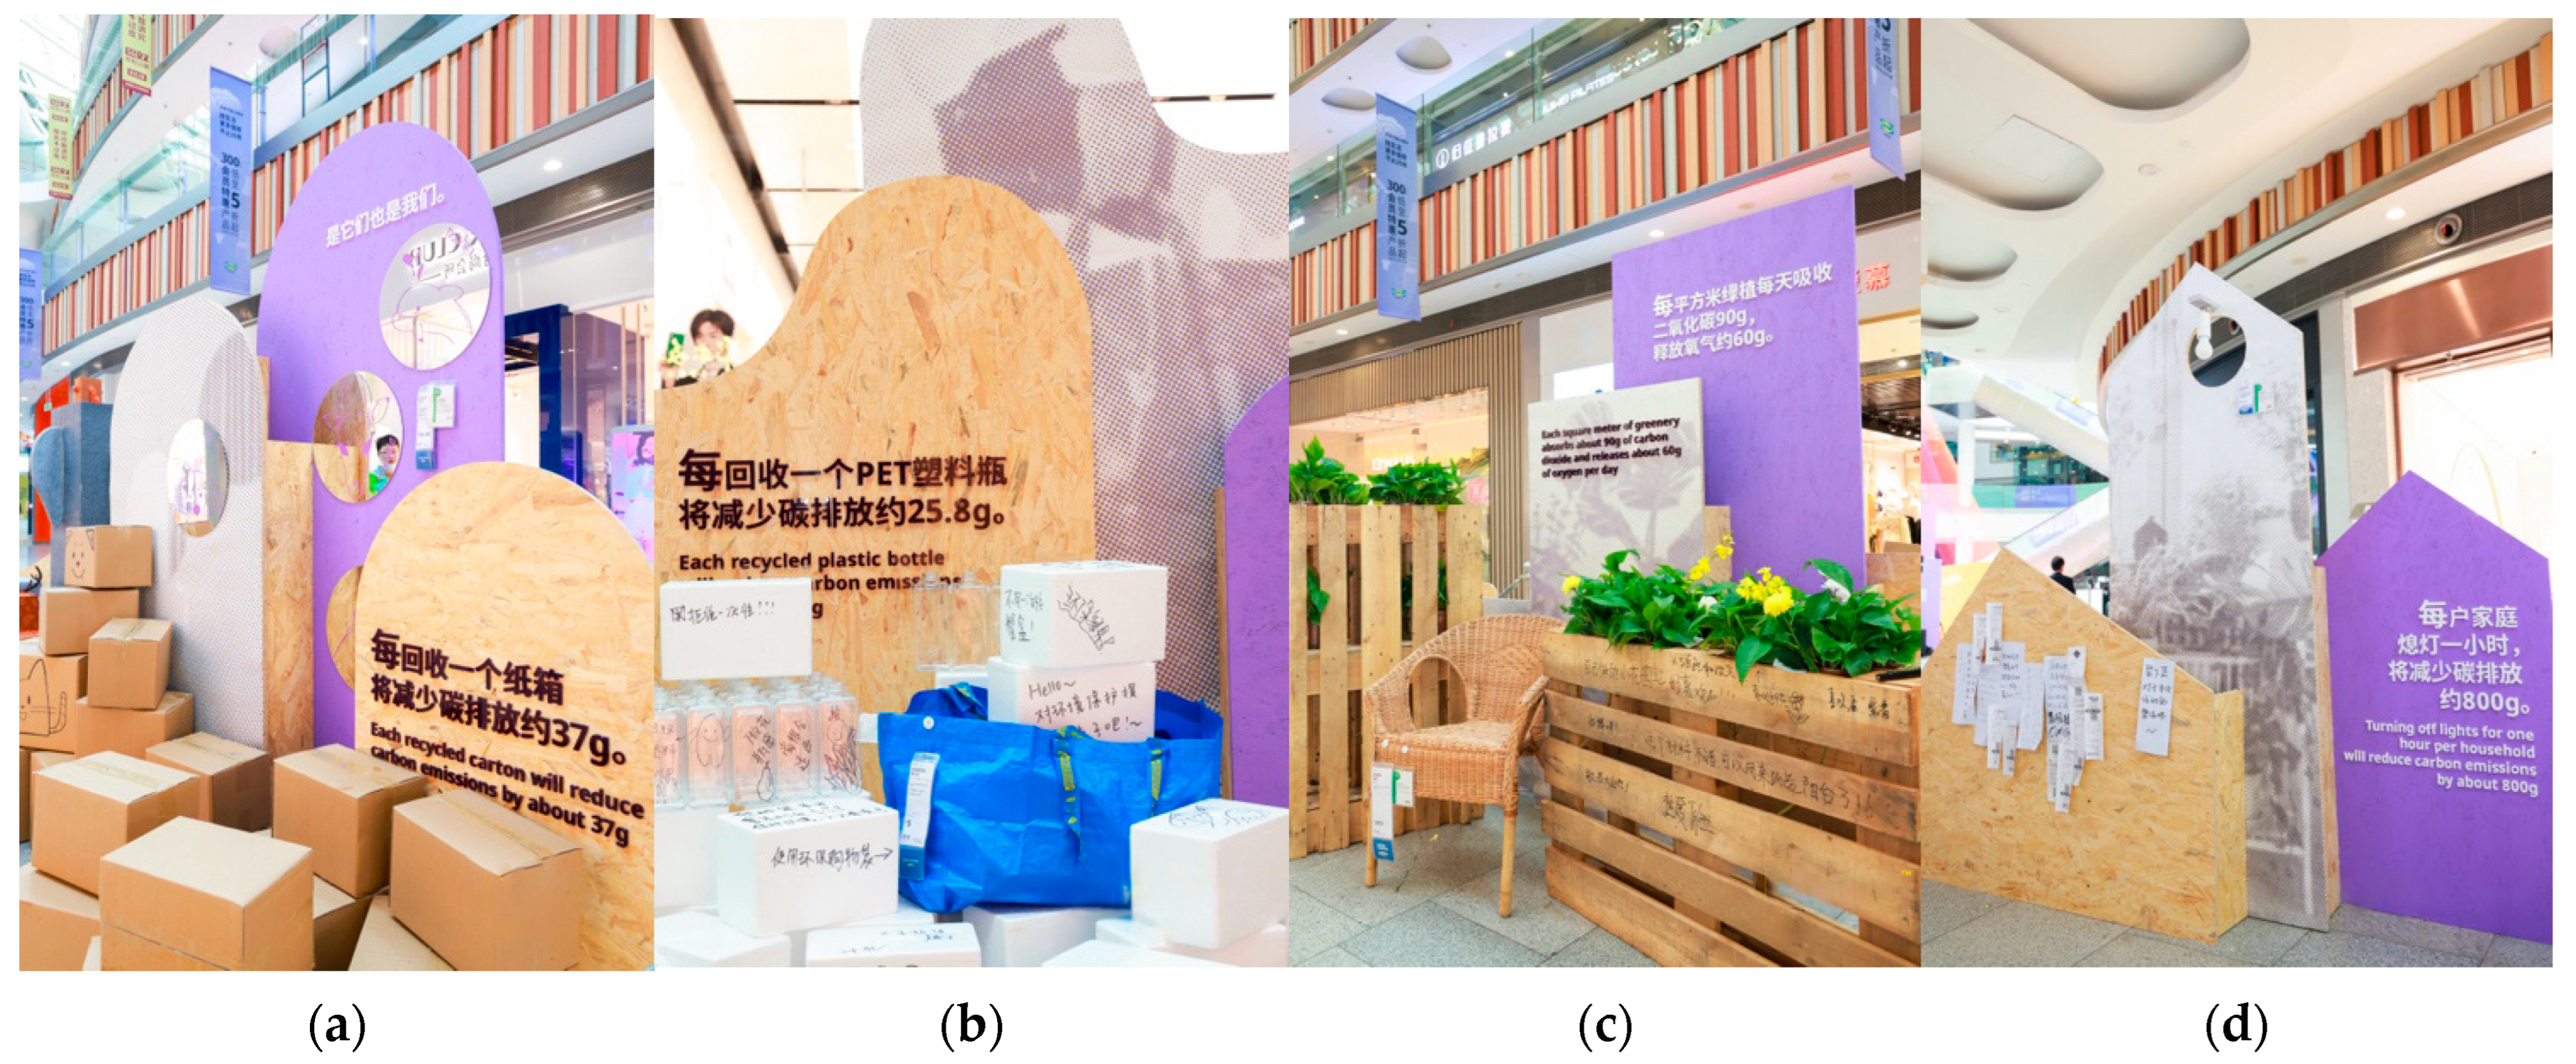
3.2.1. Project Overview

The exhibition “Eco Blet” revolves around the theme of upcycling and showcases four sets of artworks themed around biodiversity, ocean pollution, climate change, and urban pollution. These artworks predominantly employ discarded materials such as cardboard boxes, old fabrics, newspapers, and plastics, with the aim of raising consumer awareness and prompting reflection (Figure 4).

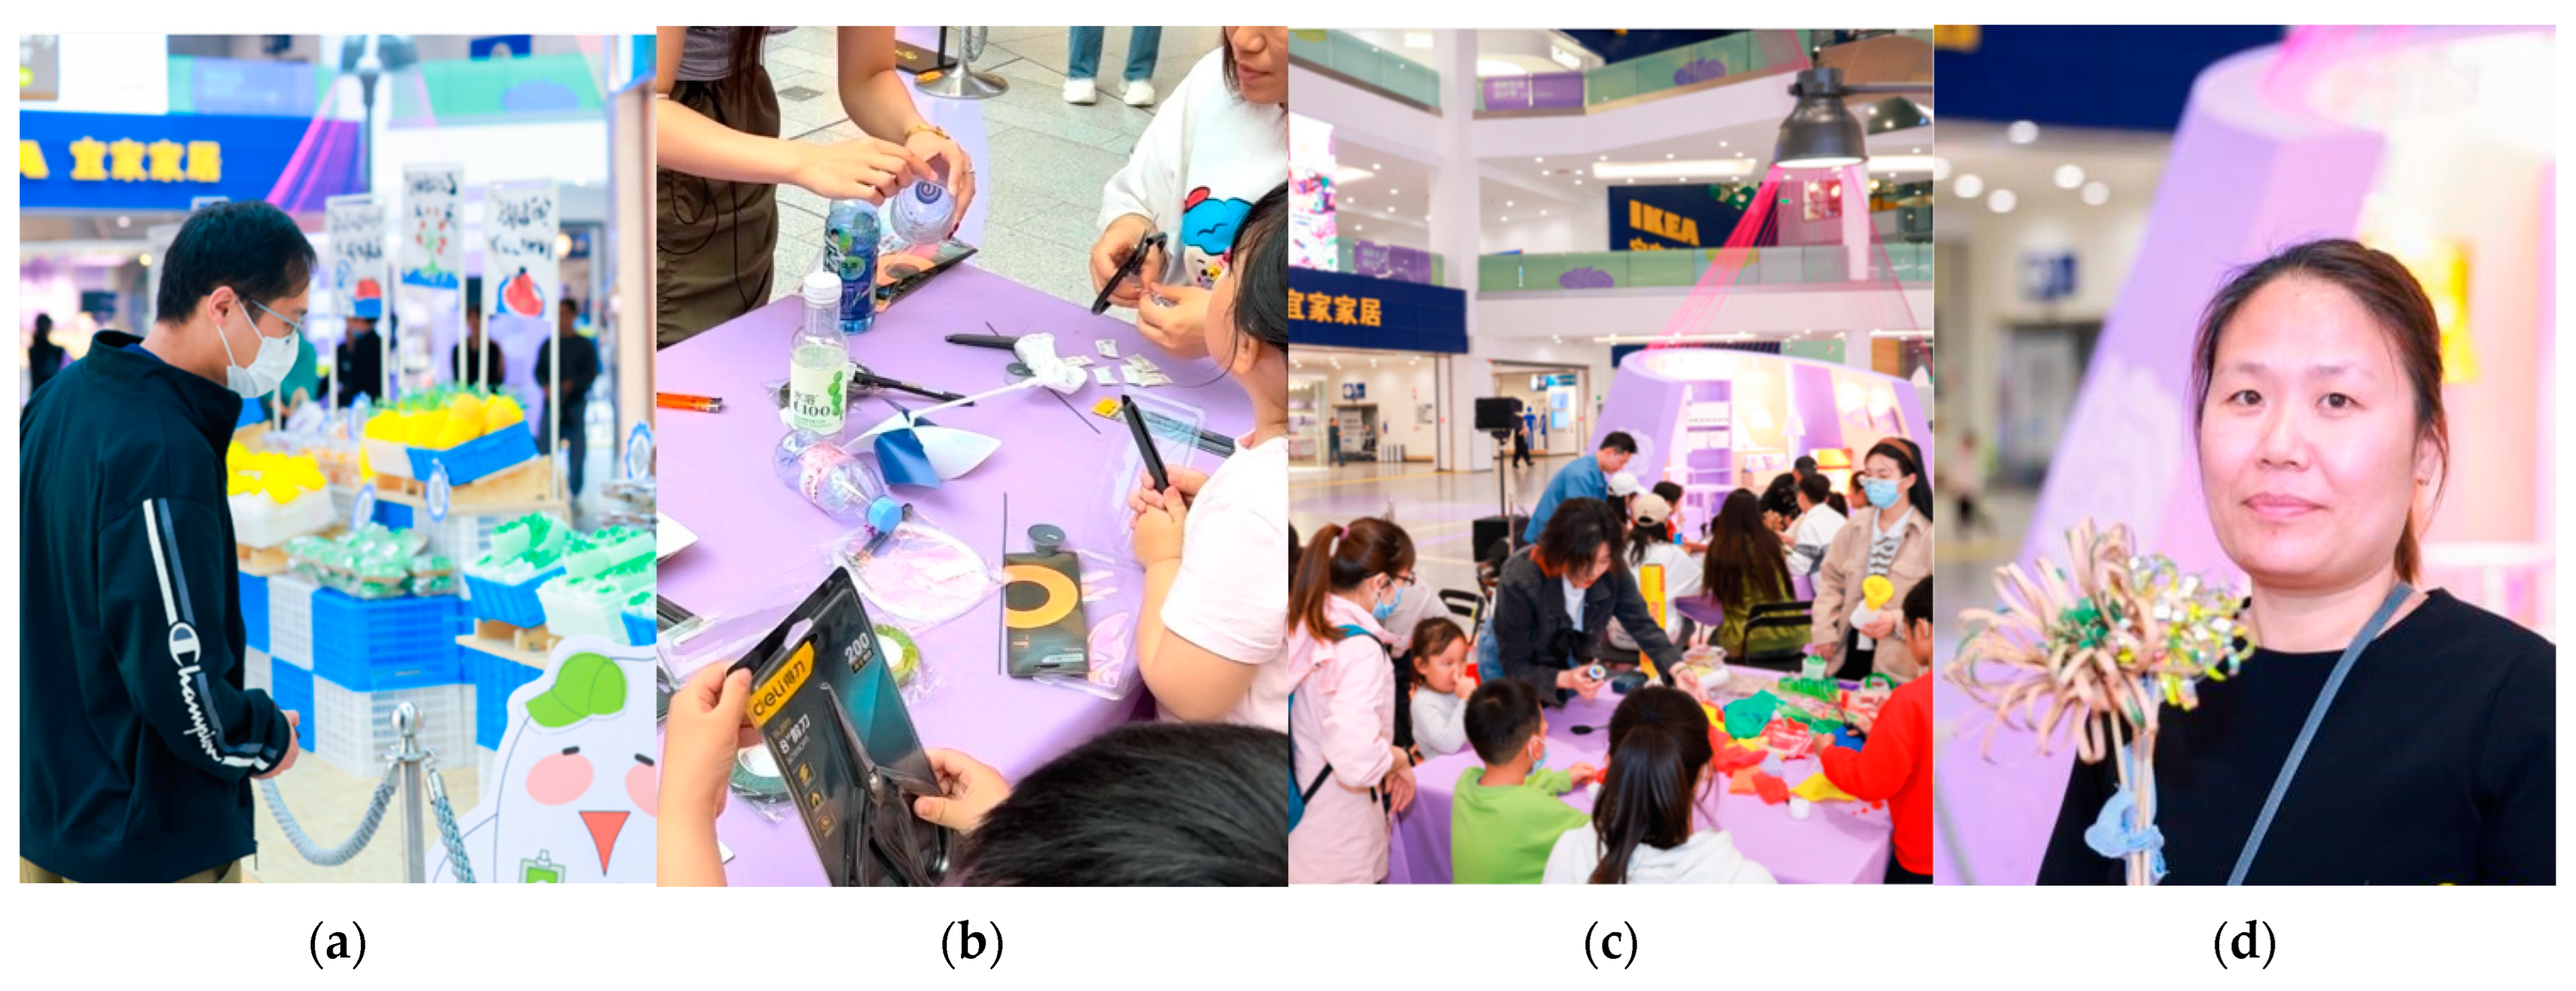
3.2.2. Co-Creation Section

Each artwork is accompanied by a collaborative design section, where designers and consumers work together to complete the designs. Examples include (a) constructing modular spaces using discarded cardboard boxes to encourage consumers to reconsider resources and reduce forest destruction and resource wastage; (b) building scenes with discarded plastic bottles and foam boxes to advocate for reducing the use of disposable plastics and protecting the ecological environment; (c) designing green spaces with discarded wooden pallets to guide consumers in using waste materials and living in harmony with nature; (d) displaying energy-saving products to encourage consumers to use them and reduce energy consumption. Consumers participate in these designs through painting and writing, expressing their attitudes, insights, gains, and expectations on the theme.
This design practice fosters consumer identification with upcycling behavior through consumer visits, participation, and collaborative design sessions, while preliminary opinions and feedback are collected through consumer on-site messages. This process not only enhances consumer environmental awareness but also advances research progess and facilitates questionnaire collection (Figure 5).

3.2.3. Workshop

During the exhibition, several workshops were conducted, such as upcycling plastic bottles, upcycling fabric scraps, upcycling cardboard boxes, etc. (Figure 6). Participants in the workshops included facilitators (researchers, designers), participants (consumers, families with children), and coordinators (mall staff). Participants were recruited in advance through the official platform, and interested consumers could also join in real-time on site.
In the initial phase, participants acquire an understanding of upcycling. The facilitators lead participants through a tour of the design exhibition and provide background information to help them grasp the concept of upcycling. Subsequently, all participants share their past attempts or knowledge of upcycling designs to assess their prior comprehension and ensure alignment with the research topic.
During the second phase, the facilitators conduct upcycling demonstrations. They introduce various upcycling materials and use on-site demonstrations to familiarize participants with the steps and methods of upcycling, encouraging innovation among them. For instance, designers utilize discarded plastic bottles to craft plastic flowers. These discarded plastic bottles, available for participants to utilize, are collected through recycling and come in various shapes, textures, and colors, thereby enhancing the diversity in design.
In the final phase, participants engage in upcycling creations. Drawing inspiration from the demonstrations and exchanges, participants, guided by the facilitators, complete unique designs. Additionally, facilitators provide incentives to participants, fostering encouragement and affirmation for their upcycling behaviors.
To ensure the effectiveness of the data, several workshops were organized throughout the month-long exhibition. The purpose of the workshops was twofold: (a) to popularize upcycling by deepening consumers’ understanding of upcycling behavior; (b) to provide hands-on upcycling practice, allowing those who have never upcycled before to grasp its significance. Throughout the event, participants demonstrate a high level of interaction and cooperation, actively sharing experiences and ideas on upcycling, enhancing their skills, and promoting upcycling behavior.
The questionnaires were carefully screened during collection, with those containing incomplete or duplicate responses being eliminated. This rigorous process ensured that the subsequent analyses were based on accurate and representative data, thereby enhancing the reliability of the findings.

3.3. Questionnaire Design

Based on co-creation activities and literature research, a new hypothetical model was developed, encompassing seven variables: attitude, subjective norms, perceived behavioral control, and others, along with nine hypotheses (see Section 2 for details). Using a five-point Likert scale that ranged from “strongly disagree” to “strongly agree”, the seven traits were evaluated. All measurement items were adapted from established scales in prior studies and modified appropriately for this research context (Table 1). Specifically, Ajzen’s work served as the primary inspiration for the questions evaluating upcycling behavior, intention, attitude, subjective norms, and perceived behavioral control [48]. The items for perceived ease of use were taken from Davis’s study [35]. The items for perceived enjoyment were taken from Chen’s research [49].

4. Research Analysis

This study employed the statistical software packages SPSS 26.0 and AMOS 27.0 to analyze the data. The purpose was to accomplish the research objectives and evaluate the hypotheses. An exploratory study was conducted using SPSS 26.0 to examine initial findings and ascertain the demographic characteristics of the sample. The measurement items’ reliability was evaluated using Cronbach’s α coefficient. Confirmatory factor analysis (CFA) was used by AMOS 27.0 to evaluate if the measures were sufficient, affirming their reliability, convergent validity, and divergent validity. Later, structural equation modeling (SEM) was used to examine the proposed connections between the research topics [50].

4.1. Data Sample Analysis

Analysis of the respondents’ basic information reveals that 38.69% of the respondents are male, while 61.31% are female. Most of the participants, 82.44%, are 18–25 years old, with fewer individuals in other age groups. Regarding annual income, 91.37% of the respondents earn less than 100,000 RMB, and only a small number earn more than 200,000 RMB. Most respondents have a bachelor’s degree, accounting for 72.32%, with fewer individuals having education levels below a bachelor’s degree or a graduate degree and above (Table 2).
Regarding upcycling behavior, 21.43% of respondents reuse waste daily, 28.27% do so weekly, 23.51% monthly, 8.04% yearly, and 18.75% almost never engage in waste reuse. In summary, the frequency analysis indicates that most respondents reuse waste either weekly or monthly, with the highest frequency being once a week (28.27%). Conversely, a minority of respondents almost never reuse waste (18.75%).
The survey on waste disposal methods shows that 34.27% of respondents sell or donate their waste to recycling stations, with a response rate of 58.33%. Another 24.48% discard waste directly, with a response rate of 41.67%. Some respondents (21.15%) expressed a desire to reuse waste but have not acted on it, with a response rate of 36.01%. Additionally, 19.93% of respondents reuse waste, with a response rate of 33.93%. Other methods had a low response rate of only 0.17%, with a response rate of 0.30%. Overall, most respondents opt to recycle or donate their waste, though a significant number also indicate intentions to reuse or directly discard waste.
And then, demographic-based group differences were compared, independent samples t-tests were used to examine gender group differences, and one-way ANOVA was utilized to examine group differences in age, income, and education.
From the table below (Table 3), there is a significant difference in upcycling intention based on different educational levels (p < 0.05), while the other six differences are not significant. Therefore, a normality test will be conducted to enhance the credibility of the results.
The statistic W closer to 1 indicates that the data conform more closely to a normal distribution, reflecting a stronger normality (Table 4). If p < 0.05, this means that we reject the null hypothesis; therefore, graphical methods should be combined for a comprehensive assessment.
Based on the Q–Q plot (Figure 7), the data overall conform to a normal distribution. When the sample size is large, even if the data are close to normal, the p-value may be significant due to the sensitivity of the statistical test.
From the table above (Table 5), there are significant differences in upcycling intention between the group with education below a bachelor’s degree and the group with a master’s degree and above, as well as between the bachelor’s degree group and the master’s degree and above group (p ≤ 0.05).
From the table above (Table 6), there are significant differences in perceived behavioral control and attitudes based on income status (p < 0.05), while no significant differences exist in the other five items. Therefore, a normality test will be conducted to enhance the credibility of the results.
The statistic W closer to 1 indicates that the data conform more closely to a normal distribution, reflecting a stronger normality. If p > 0.05, we accept the null hypothesis, indicating no controversy; if p < 0.05, we reject the null hypothesis and need to combine graphical methods for a comprehensive assessment (Table 7).
In perceived behavioral control, for the income group of less than 100,000 RMB (p < 0.05), the null hypothesis is rejected, necessitating a combination of graphical methods for assessment, while other groups (p > 0.05) indicate that the data follow a normal distribution. In terms of attitudes, the income group of 100,000–200,000 RMB (p > 0.05) also suggests that the data follow a normal distribution, whereas other groups (p < 0.05) reject the null hypothesis, requiring a comprehensive assessment using graphical methods.
Based on the Q–Q plot (Figure 8), the data overall conform to a normal distribution.
From the table above (Table 8), it can be seen that there are significant differences in perceived behavioral control and attitudes based on income, specifically between the income group of less than 100,000 RMB and those in the 100,000–200,000 RMB and 200,001–400,000 RMB groups, as well as between the groups of 100,000–200,000 RMB and above 400,000 RMB, and between the groups of 200,001–400,000 RMB and above 400,000 RMB (p ≤ 0.05).

4.2. Descriptive Statistics

To ensure the accuracy and strength of the sample data, it is crucial to initially assess if the sample data adhere to a normal distribution. This step is crucial to prevent the effects of non-normal distribution data on the hypothesis testing results of the structural equation model [50].
From the table above, the means of the variables range from 3.107 to 3.243, with standard deviations between 0.9 and 1.1. The skewness and kurtosis absolute values vary from 0.29 to 0.434 (all less than 3) [51] and 0.786 to 1.052 (all less than 10), respectively. These values suggest that the data can be considered approximately normally distributed (Table 9).

4.3. Reliability Analysis

Reliability in empirical research refers to the stability, consistency, and dependability of measurable findings. A higher dependability coefficient signifies greater stability and consistency of outcomes. It is crucial to acknowledge that systematic errors uniformly influence measurement data and do not compromise reliability. Instead, reliability is mostly influenced by random errors. Cronbach’s alpha is a statistic used in this research to evaluate the reliability of the information gathered via the questionnaire. Information whose Cronbach’s alpha falls between 0.7 and 0.8 is considered worthy of more investigation.
The Cronbach’s alpha coefficients of the questionnaire data were assessed using SPSS 26. The table below contains the coefficients for each variable. All variables exhibit Cronbach’s alpha coefficients over 0.7, showing satisfactory reliability of the questionnaire data. This demonstrates good internal consistency across the dimensions of the questionnaire, confirming that the data have passed the reliability analysis (Table 10).

4.4. Validity Analysis

In empirical analysis, validity indicates how accurately measurement results predict latent variables. Therefore, the level of validity represents the extent to which these results reflect latent variable content. Typically, a combination of exploratory factor analysis (EFA) and CFA is implemented to ensure the effectiveness and authenticity of validity.

4.4.1. Exploratory Factor Analysis

EFA is a method for uncovering the latent structure within data. EFA identifies a set of latent factors that explain the correlations between variables, primarily involving factor extraction, rotation, and interpretation.
Initially, the data are assessed for appropriateness using the Kaiser–Meyer–Olkin measure of sampling adequacy (KMO) and Bartlett’s test of sphericity. Next, the main component extraction and varimax rotation procedures are utilized to explain the total variance and analyze the rotated component matrix.
The table indicates that the KMO value of 0.838 is greater than 0.7, which satisfies the prerequisite for factor analysis. This implies that the data are suitable for factor analysis. Additionally, the data meet the criteria of Bartlett’s test of sphericity (p < 0.05), which is indicative of the research data’s suitability for factor analysis (Table 11).
The table shows that seven factors were identified in the factor analysis, with eigenvalues over 1, which is consistent with the number of components specified in the questionnaire. The variance explained by these seven rotated factors is as follows: 13.374%, 10.914%, 10.907%, 10.796%, 10.546%, 10.149%, and 7.932%, individually. The cumulative variance explained after rotation is 74.618%. Kline mentions 60% as an empirical guideline for determining the effectiveness of factor analysis [52]. Generally, cumulative variance explained greater than 60% is considered indicative of good data fit (Table 12) [53].
The rotational component matrix of factor loadings that was generated from the questionnaire data in this study is in accordance with the scales and dimensions that were specified in the research design. Furthermore, it is evident that all items corresponding to each dimension have loading values exceeding 0.5. Thus, the questionnaire demonstrates high validity, affirming its suitability for subsequent research analysis (Table 13).

4.4.2. Confirmatory Factor Analysis

In order to ascertain whether the factors and the connections between their related items are consistent with theoretical concepts, as determined by EFA, CFA is implemented. The consistency between the measurement model and the established theoretical model is referred to as construct validity in the process. The adequacy of construct validity is typically evaluated using fit indices.
The CFA model of this study, which includes Chi-square minimum discrepancy/degrees of freedom (CMIN/DF), root mean square error of approximation (RMSEA), goodness of fit index (GFI), normed fit index (NFI), incremental fit index (IFI), comparative fit index (CFI), Tucker–Lewis index (TLI), parsimony normed fit index (PNFI), and parsimony comparative fit index (PCFI), has the preponderance of model fit indices, as indicated by the table provided. The model meets the established criteria, demonstrating solid compatibility (Table 14).
Composite reliability (CR) and average variance extracted (AVE) are frequently implemented to evaluate convergence validity. A standardized factor loading greater than 0.5, an AVE greater than 0.5, and a CR greater than 0.7 are indicative of robust convergent validity in the research data in confirmatory factor analysis.
In the confirmatory factor analysis (CFA) model of this study, most model fit indices, such as CMIN/DF, RMSEA, CFI, NFI, TLI, and IFI, satisfy the established criteria, indicating a satisfactory fit for the model, as indicated by the table provided (Table 15).
For perceived entertainment, the square root of AVE, which is 0.799, is higher than the maximum absolute correlation coefficient of 0.403 between factors. This suggests that there is good discriminant validity. For perceived ease of use, the square root of AVE is 0.799, which surpasses the highest absolute correlation coefficient between factors of 0.377. This suggests that there is good discriminant validity. For upcycling subjective norms, the square root of AVE is 0.796, which surpasses the highest absolute correlation coefficient between components of 0.434, suggesting strong discriminant validity. For upcycling perceived behavioral control, the square root of AVE is 0.756, which surpasses the highest absolute correlation coefficient between factors of 0.350. This suggests that there is good discriminant validity. For upcycling attitude, the square root of AVE is 0.782, which surpasses the highest absolute correlation coefficient between factors of 0.412. This suggests that there is good discriminant validity. For upcycling intention, the square root of AVE is 0.756, which surpasses the highest absolute correlation coefficient between factors of 0.434. This suggests that there is good discriminant validity. For upcycling behavior, the square root of AVE is 0.813, which surpasses the highest absolute correlation coefficient between factors of 0.341. This suggests that there is good discriminant validity (Table 16).

4.5. Correlation Analysis

The correlation coefficient, which is typically a number between −1 and 1, is the standard method for expressing the results of correlation analysis. In particular, the correlation coefficient is more significant when it is positive (0–1) as it approaches 1. Conversely, the correlation coefficient is more significant when it is negative (−1–0) as it approaches −1. If the correlation coefficient is nearly zero, there is no discernible linear relationship between the two variables.
The table unequivocally illustrates that there are substantial positive correlations between perceived delight, perceived convenience of use, upcycling subjective norms, and upcycling perceived behavioral control. Significant positive correlations exist between upcycling intention and upcycling subjective norms, upcycling perceived behavioral control, and upcycling attitude. Furthermore, upcycling perceived behavioral control and upcycling intention exhibit substantial positive correlations with upcycling behavior (Table 17).

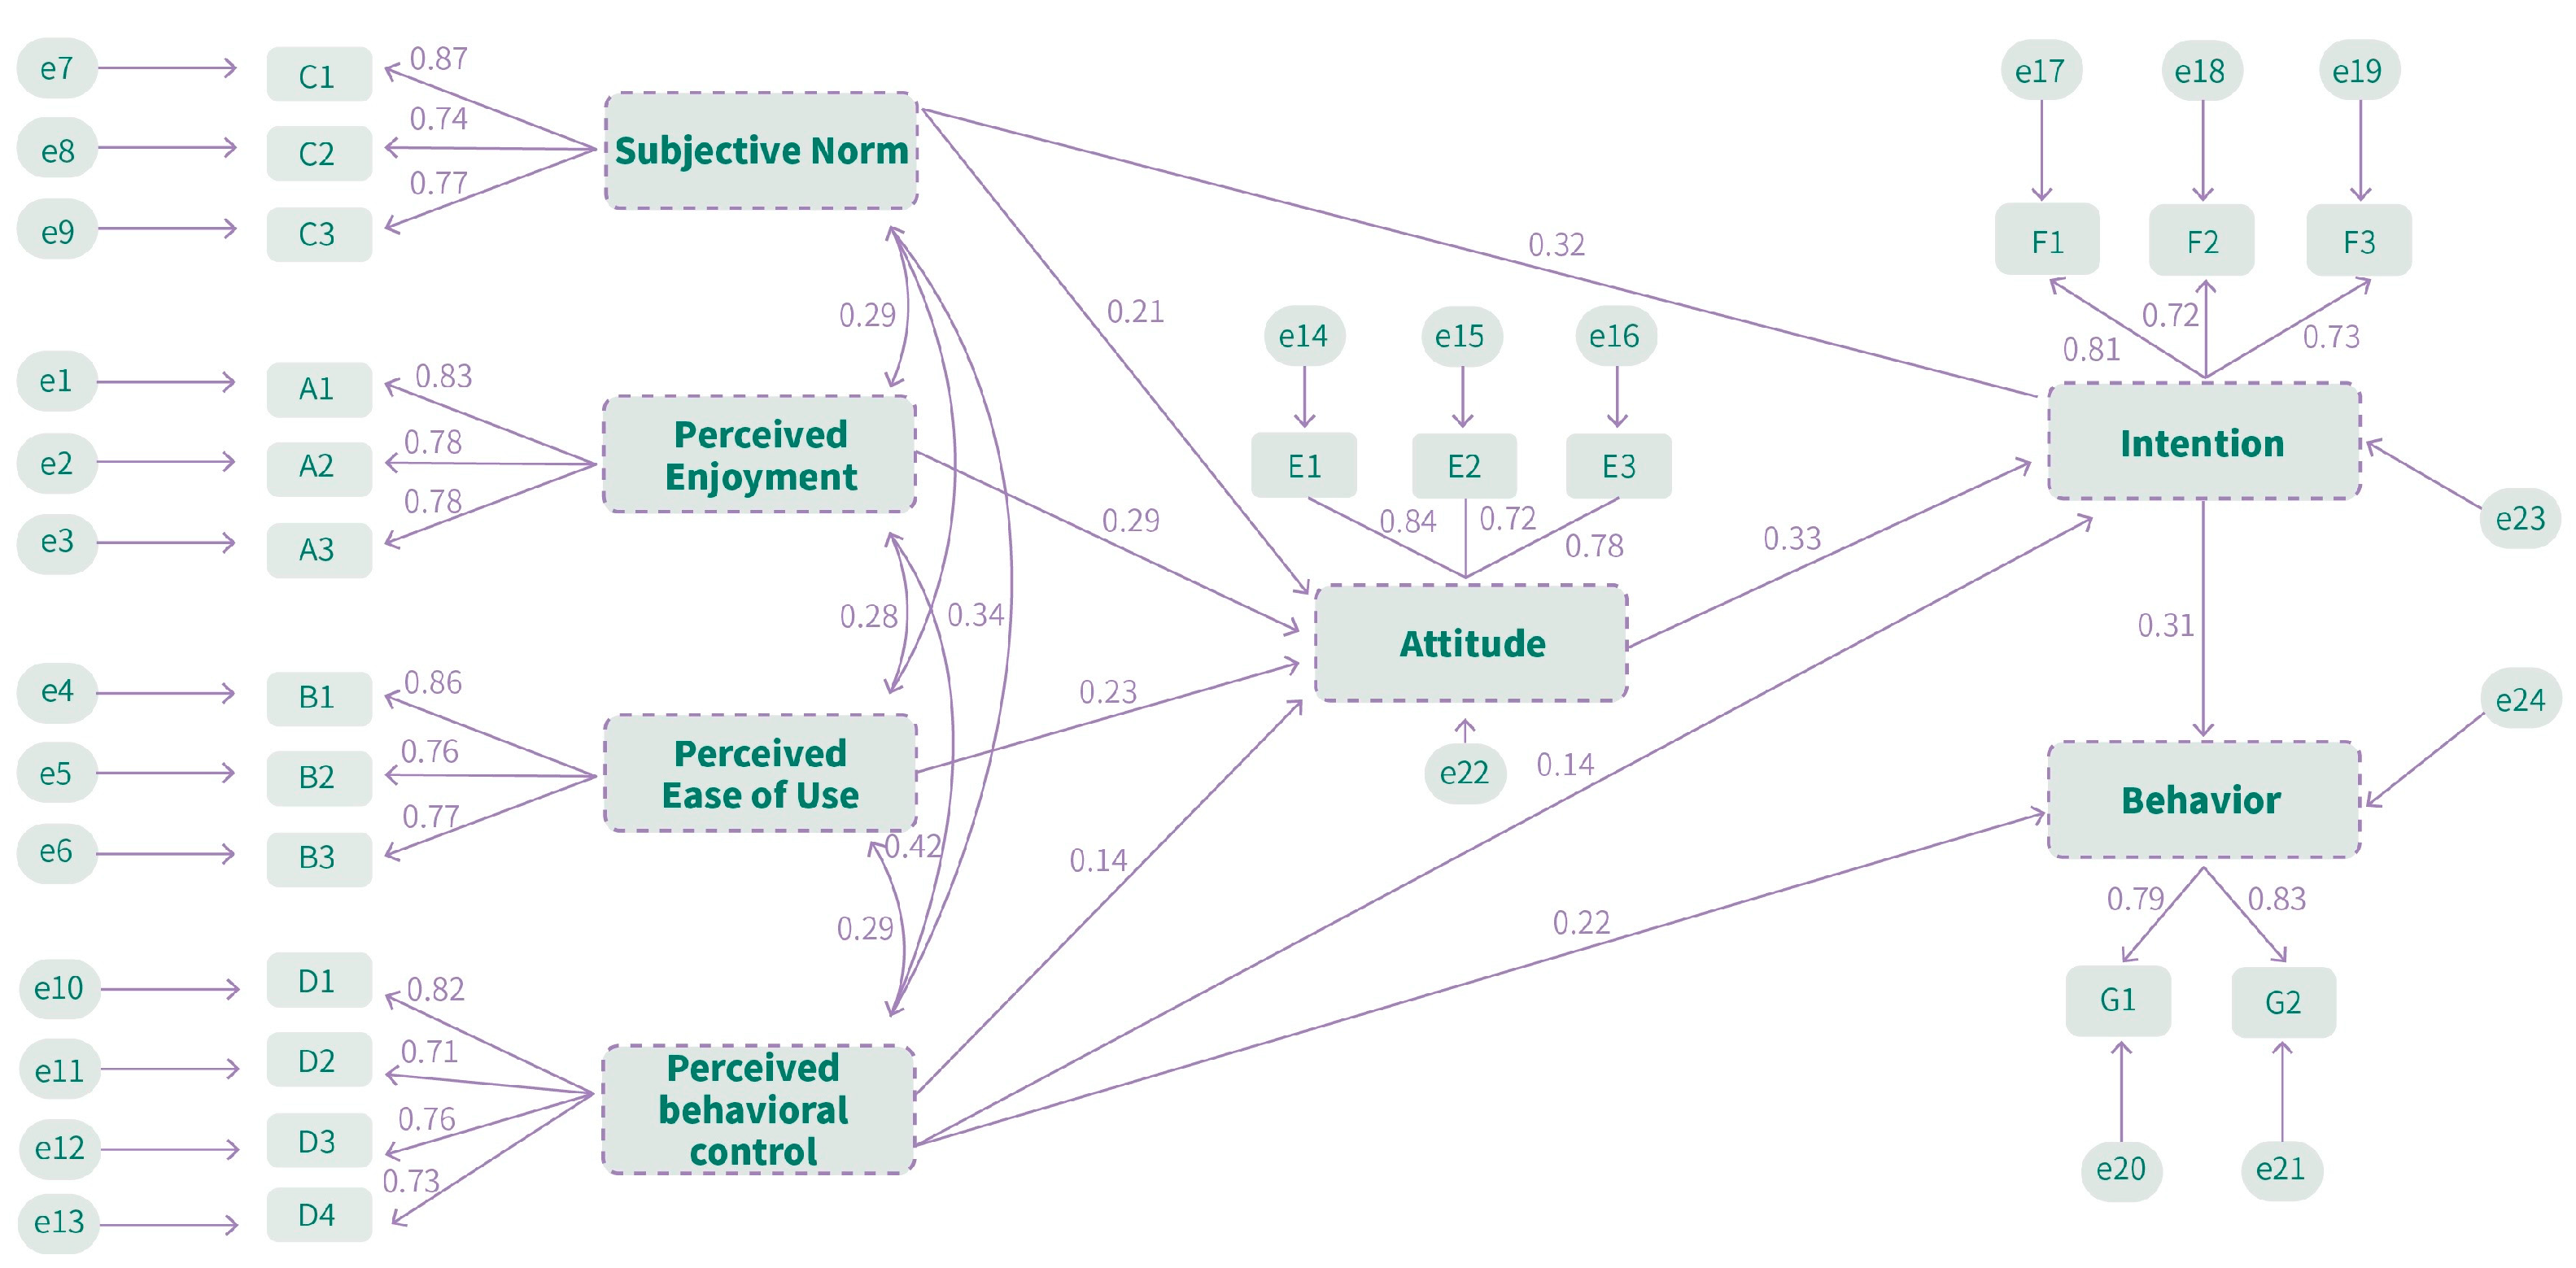
4.6. Structural Equation Model Test

The research data in this study have successfully passed reliability and validity evaluations, suggesting that they are of high quality. As a result, this investigation implemented AMOS 26 to construct a structural equation model (SEM) that would verify the relationships between variables in accordance with the research hypotheses. The SEM diagram comprises 7 variables, 21 observed variables, and 24 residual variables (Figure 9).
The updated model was enhanced with research data and analyzed using AMOS 26 for route analysis. Standardized path coefficients (Estimate), standard errors (SE), critical ratios (CR), and significance p-values were generated by this analysis. The significance of path coefficients in the research model is assessed via CR and p-values. CR values exceeding 1.96 indicate significance at the 0.05 level.
According to the analysis of path coefficients among latent variables shown in the table, relationships between the latent variables can be determined.
Intention is significantly positively influenced by attitude (β = 0.325, p < 0.05). Subjective norms have a substantial positive effect on intention (β = 0.321, p < 0.05). The attitude toward upcycling is significantly positively influenced by subjective norms (β = 0.209, p < 0.05). Perceived behavioral control has a significant positive impact on intention (β = 0.135, p < 0.05). Attitude is significantly positively influenced by perceived behavioral control (β = 0.142, p < 0.05). Perceived ease of use has a significant positive impact on attitude (β = 0.231, p < 0.05). Perceived Enjoyment has a significant positive impact on attitude (β = 0.288, p < 0.05). Intention has a significant positive impact on behavior (β = 0.314, p < 0.05). Behavior is significantly positively influenced by perceived behavioral control (β = 0.218, p < 0.05) (Table 18).

5. Results

This study examines the primary factors that influence consumers’ upcycling behavior and the intrinsic relationships among seven attributes: upcycling behavior, behavioral intention, subjective norms, attitude, perceived behavioral control, perceived enjoyment, and perceived convenience of use. Based on the data analysis from the previous chapter, all nine hypotheses are supported. The following discussion will address the analysis results.
H1 and H8 are corroborated, suggesting that customers have a more favorable disposition towards upcycling the stronger their intentions to engage in upcycling behavior, thus leading to actual behavior. Upcycling intention positively influences upcycling behavior, with strong significance.
Support is provided for H2, indicating that upcycling behavior aligned with consumers’ values, such as meeting self-expectations or personal moral obligations, directly promotes consumers’ upcycling. According to the data from the previous chapter, subjective norms exert a stronger favorable influence on behavioral intention in comparison to attitude.
H3 is supported, implying that consumers’ upcycling behavior is positively influenced by social pressures from individuals or groups, such as praise from partners or support from parents.
H4 is supported, indicating that consumers’ self-analysis of the difficulty of upcycling behavior can hinder or promote their upcycling behavior to some extent.
H5 and H6 are supported, showing that simpler upcycling forms increase consumers’ positive attitudes, and reducing consumers’ learning costs can increase the frequency of upcycling behavior to some extent.
H7 is supported, suggesting that more interesting upcycling forms can increase consumers’ positive attitudes.
H9 is supported, indicating that when consumers have a clear understanding of the degree of conditions required for upcycling behavior, it positively influences the occurrence of upcycling behavior.

6. Discussion and Implications

6.1. Discussion of the Results

This study examines the main factors influencing consumers’ upcycling behaviors and the intrinsic relationships among seven factors: upcycling behavior, behavioral intention, subjective norms, attitude, perceived behavioral control, perceived entertainment, and perceived ease of use. Based on the data analysis in the previous chapter, all nine hypotheses were supported. The results of the analysis are discussed below.
H1, H2, and H4 were confirmed, which indicates that attitude, subjective norms, and perceived behavioral control are the key factors influencing upcycling behavioral intention. The more positive a consumer’s attitude toward upcycling, the stronger his or her intention to upgrade and reengineer behaviors. This result is consistent with the results of most of the studies using TPB [54,55,56] and is in line with Ajzen’s findings [48] that behavioral intentions are driven by attitudes, subjective norms, and perceptual behavioral control. Diana’s study of adolescents’ level of physical activity, in conjunction with the theory of TPB, also confirms the significant influence of attitudes, subjective norms, and perceptual behavioral control, which had a significant positive correlation with adolescents’ autonomous motivation; so, in promoting adolescent physical activity, interventions should foster autonomous motivation by enhancing the internalization of behaviors [57]. It is worth noting that the establishment of H9 implies that the significance of perceived behavioral control in this study is relatively weak compared to the first two, while the influence of perceived behavioral control on behavior is relatively strong, and in Godin’s study on exercise behavior, it was also confirmed that perceived behavioral control not only has a significant positive influence on behavior but can also indirectly influence actual behavior through behavioral intention; when individuals perceive that they have more control over their exercise behavior, they are more likely to produce exercise behavior [58]. This was confirmed in Li’s study on the key drivers of intention to purchase plant-based eggs, which integrated the value–belief–norm (VBN) with the TPB model, and the analysis concluded that perceived behavioral control was a key driver of plant-based egg purchase [59].
H3 is supported, which means that consumers’ upcycling behavior is influenced by surrounding social pressures from individuals or groups, such as high influence from partners, parents, or peers [60]. Comparing the results of this study with the study conducted by Villanueva, who suggested that the influence of subjective norms on behavior is at the lowest level of contribution [61], subjective norms in this study have a high level of contribution to the influence of upcycling behavior. As Khan emphasized, subjective norms are one of the most important variables affecting consumers’ reuse and recycling in developing countries [62]. Therefore, in promoting upcycling strategies, governments, NGOs, event organizers, etc., need to promote the importance of upcycling in order to strengthen consumers’ subjective norms.
H5 and H6 are supported, consistent with TPB, and this study confirms that perceived behavioral control is a significant predictor of upcycling intentions and behaviors, and that higher perceived behavioral control increases the likelihood that intentions will be converted into actual behaviors, as noted by Ajzen [48]. In addition, the TAM framework emphasizes the importance of perceived ease of use in determining technology adoption; and in the context of upgrading and reengineering, this study’s results are similar to Saoula’s findings: perceived ease of use is the most important factor influencing user behavior [63]. Thus, the lack of tools, materials, skills or inspiration can be frustrating for consumers, suggesting that breaking down constraints, sharing resources, and solving problems with good communication can promote higher levels of engagement, and that there is a need to provide easy-to-access resources and facilities, as well as well-developed solutions, to ensure that consumers are able to upcycle with ease, thereby increasing their sense of control.
H7 is supported by suggesting that a more interesting form of upcycling increases positive consumer attitudes, which validates Davis’ argument [35]. However, it is worth noting that in Deng’s study, perceived entertainment proved to have a significant direct effect on behavioral intention to use virtual fashion clothing, and not through an indirect form of influence [64].
H8 confirms the positive effect of upcycling behavioral intention on actual behavior with a high contribution, which suggests that consumers who have the intention to upcycle are more likely to engage in actual behavior. This was also confirmed by Warganegara in his study of grocery purchasing behavior on e-commerce platforms in Indonesia [65]. Similar results were obtained in a study of consumer e-commerce usage, where the authors suggested that enhancing consumers’ behavioral intentions (e.g., by improving the platform’s user experience) is an important way to promote actual usage behavior [66].
In addition, by differentiating different individual factors, the results of this paper show that different individual factors show significant differences in perceived behavioral control, attitude, and behavioral intention, which suggests that individual factors do influence upcycling behaviors to a certain extent. There was no significant difference between males and females in terms of their intentions and perceived behavioral control when engaging in upcycling behaviors, which implies that gender may not be a factor to focus on when designing upcycling promotion strategies.
In the context of upcycling intention, there are significant differences between the group with education below a bachelor’s degree and the group with a master’s degree and above, as well as between the bachelor’s degree group and the master’s degree and above group. This indicates that educational level may influence individuals’ attitudes and willingness toward upcycling. Respondents with a master’s degree or higher may have a deeper understanding of sustainability and upcycling, and their higher environmental awareness and sense of social responsibility could lead them to be more willing to engage in upcycling behavior, thus demonstrating a greater intention to upcycle.
Additionally, significant differences exist between respondents with an income of less than 100,000 RMB and those in the 100,000–200,000 RMB, 200,001–400,000 RMB, and above 400,000 RMB income brackets. This suggests that income level may impact individuals’ perceptions and behaviors regarding upcycling. Higher-income groups may have more resources and capabilities to participate in upcycling activities, resulting in a more positive attitude toward them.

6.2. Theoretical and Practical Implications

First, this paper focuses sustainable behavior research on upcycling behavior research, proposes a new theoretical model including attitude, subjective norms, perceived behavioral control, perceived ease of use, etc., and explores the relationship between these influences and consumer upcycling behavior. In previous academic research, although the scope of sustainable behavior research with the help of TPB is very wide, it mainly focuses on the fields of green consumption behavior [61,67,68,69], green dietary behavior [59,70,71,72,73], green tourism behavior [74,75,76,77,78], and garbage recycling behavior [16,79,80,81]. Most of the research using TAM focuses on the fields of artificial intelligence technology [82,83,84] and the use of mobile applications [85,86,87]. Therefore, researchers should pay more attention to the study of attitudes as well as intentions towards consumers’ upcycling behavior. This study confirms the three main factors of TPB theory and the significant influence of attitude, subjective norms, and perceived behavioral control on behavioral intention and probes deeply into the influence of individual-level influences on upcycling attitudes from the perspectives of perceived ease-of-use and perceived amusement, which have rarely been addressed in previous studies of upcycling behaviors, and there is a lack of research on upcycling behaviors among Chinese consumers. This study enriches the existing theories and provides empirical evidence and ideas for promoting consumer up-cycling behavior, hoping that more scholars around the world will pay attention to and discuss the potential of up-cycling for sustainable development.
In addition, this study is of practical significance as it reveals the key factors influencing consumers’ upcycling behavior through empirical analysis and provides guidance for the actual promotion of sustainable consumption behavior. Specifically, the “Eco Blet” sustainable design exhibition and workshop at Livat Beijing (Ingka Centres Beijing) demonstrated how design and interactive activities can raise consumers’ environmental awareness and lead them to participate actively in upcycling behaviors. This approach not only helps to promote sustainable lifestyles but also makes a significant contribution to reducing carbon emissions.

6.3. Limitations and Future Research

There are still some limitations in this study, which will inform the direction of future in-depth research. The data samples in this study were mainly collected from the “Eco Blet” sustainable design exhibition and workshops held at Livat Beijing (Ingka Centres Beijing). While the 336 valid questionnaires collected through these events are useful for understanding consumer upcycling behaviors, the geographic scope of the sample and the backgrounds of the event participants may limit the generalizability of the results. This study used questionnaires to collect data, and while it was possible to obtain a large amount of quantitative information, this method runs the risk of self-reporting bias by respondents, which may lead to deviations in the results from actual behavior. In addition, the questions in the questionnaire design may not cover all potential factors affecting upcycling behavior, thus limiting the comprehensiveness of the study.
This study integrated TPB and TAM to analyze consumers’ upcycling behavior, and although this integrated model enhances the explanatory power of the behavior, it may have overlooked some other important psychological or social factors. For example, emotional factors, values, and sociocultural background may have an important influence on upcycling behavior and will be considered more in future studies.
In the present, and even in the future, the transition from product-centered sustainable design to consumer-centered sustainable behavior change design represents a significant shift, with an increasingly broader societal impact. Ceschin notes that sustainable design is evolving from isolated product-level innovations to system-level innovations, requiring the involvement of various societal stakeholders. His sustainable design evolution framework effectively illustrates this progression [88].
If upcycling is thoroughly explored through social innovation and its practices are gradually expanded, the contributions to resource conservation and environmental protection would be significant. This strategy has the potential to promote sustainable development significantly and contribute to China’s dual carbon objectives, playing a crucial part in the country’s endeavors to decrease carbon emissions and attain carbon neutrality.
Given these findings, this research presents the following recommendations:
  • At the government level, formulate relevant policies and guidelines, strengthen promotion and education with respect to upcycling, enhance public awareness of upcycling, and regulate behavior. This includes economic incentives for upcycling behaviors, tax reductions for environmental protection, environmental standards and certifications, etc., to encourage public participation in upcycling activities and advocate for more sustainable lifestyles. Different levels of support can be provided, such as establishing upcycling fund projects and providing financial support, investing in upcycling facility construction, developing innovative technologies, and cultivating talents.
  • At the commercial level, advocate for sustainable concepts using commercial resources, incorporate upcycling into sustainable development strategies and business models, promote the circulation of corporate resources, and promote sustainable consumption methods. Environmental products and services can be launched to enhance corporate image; by leveraging brand effects and resource advantages, dynamic and interesting upcycling co-creation activities can be offered as a service to promote consumption while increasing consumer awareness and stimulating consumer upcycling behavior.
  • At the societal level, social organizations and media can stimulate positive consumer behavior through educational and promotional activities, such as interesting TV programs, media events, short video dissemination, etc. Furthermore, platforms for communication can be established to organize upcycling exchange activities and community projects, provide resource sharing and technical support, promote experience sharing and cooperation, and foster a good community cultural atmosphere and community cohesion.
  • At the consumer level, consumers can be motivated to engage in upcycling by utilizing the facilities and services provided by the government and communities to gain convenience and rewards. Additionally, consumers can actively participate in educational and training activities conducted by governments or social organizations to improve their understanding and mastery of upcycling skills and knowledge.

7. Conclusions

The study makes significant contributions in two respects: first, research confirms and clarifies the significant influence of attitude, subjective norms, and behavioral intents in encouraging upcycling activity at the individual level, substantially enhancing the model’s explanatory capacity for upcycling behavior; secondly, the integration of the TPB and the TAM confirms the impact of perceived usability and perceived entertainment on upcycling behavior. Notably, perceived entertainment moderates upcycling behavior positively, offering a more nuanced understanding of upcycling behavior and theoretical support for subsequent interventions and expansions.
While the study has produced comprehensive findings, it also has certain limitations. It primarily focuses on individuals who have engaged in or are engaging in upcycling, necessitating further research into consumers’ individual characteristics, behavioral motivations, and other pertinent factors for a more holistic understanding, a direction to be pursued in future investigations.

Author Contributions

Conceptualization, K.M. and J.Z.; methodology, K.M. and J.Z.; validation, K.M., B.L. and J.Z.; formal analysis, K.M. and J.Z.; writing—original draft preparation, K.M.; writing—review and editing, K.M. and J.Z.; funding acquisition, J.Z. All authors have read and agreed to the published version of the manuscript.

Funding

This research received no external funding.

Institutional Review Board Statement

Not applicable.

Informed Consent Statement

Not applicable.

Data Availability Statement

Data are contained within the article.

Acknowledgments

Special thanks to Livat Beijing (Ingka Centres Beijing), IKEA Xihongmen Store and BOTTLOOP for providing the space, materials, information and staff assistance for this research.

Conflicts of Interest

The authors declare no conflicts of interest.

References

  1. You, W.; Zhang, Y.; Lee, C.C. The dynamic impact of economic growth and economic complexity on CO2 emissions: An advanced panel data estimation. Econ. Anal. Policy 2022, 73, 112–128. [Google Scholar] [CrossRef]
  2. Li, F.; Zhang, Y. Simulation of Development Strategies and Evaluation of Low-Carbon Development Level in Jiangsu Province under Carbon Peaking and Carbon Neutrality Goals. Sustainability 2024, 16, 1597. [Google Scholar] [CrossRef]
  3. Shi, T.; Huang, R.; Sarigöllü, E. A qualitative study on internal motivations and consequences of consumer upcycling. J. Clean. Prod. 2022, 377, 134–185. [Google Scholar] [CrossRef]
  4. Braungart, M. Upcycle to eliminate waste: The chemist recasts materials in an endless loop. Nature 2013, 494, 174–175. [Google Scholar] [CrossRef]
  5. Martin, M.; Eklund, M. Improving the environmental performance of biofuels with industrial symbiosis. Biomass Bioenergy 2011, 35, 1747–1755. [Google Scholar] [CrossRef]
  6. Bridgens, B.; Powell, M.; Farmer, G.; Walsh, C.; Reed, E.; Royapoor, M.; Gosling, P.; Hall, J.; Heidrich, O. Creative upcycling: Reconnecting people, materials and place through making. J. Clean. Prod. 2018, 189, 145–154. [Google Scholar] [CrossRef]
  7. Nastasi, R.; Proietti, G.; Marino, C.; Remondino, C.L. Strategy models for upcycling. How to create a systemic change through practice potentialities. AALTO UNIVERSITY PUBLICATION SERIES. ART+ DESIGN+ ARCHITECTURE 2023, 3, 695–703. [Google Scholar]
  8. Park, H.K. Current state and analysis of domestic and overseas upcycling product brands. Treatise Plast. Media 2018, 21, 48–57. [Google Scholar]
  9. Sung, K. A review on upcycling: Current body of literature, knowledge gaps and a way forward. In Proceedings of the ICECESS: 17th International Conference on Environmental, Cultural, Economic and Social Sustainability, Venice, Italy, 13–14 April 2015. [Google Scholar]
  10. Guselnikova, O.; Semyonov, O.; Sviridova, E.; Gulyaeu, R.; Gorbunova, A.; Kogolev, D.; Trelin, A.; Yamauchi, Y.; Boukherroub, R.; Postnikov, P. “Functional upcycling” of polymer waste towards the design of new materials. Chem. Soc. Rev. 2023, 14. [Google Scholar] [CrossRef]
  11. Yu, S.; Lee, J. The effects of consumers’ perceived values on intention to purchase upcycled products. Sustainability 2019, 11, 1034. [Google Scholar] [CrossRef]
  12. Burns, A. Upcycling Classics—Sustainable Design Development through Fabric Manipulation Techniques in Fashion Design Education. Int. J. Art Des. Educ. 2024, 43, 272–288. [Google Scholar]
  13. Wu, D.; Zhuang, M.; Zhang, X.; Zhao, Y. Towards Circular Fashion: Design for Community-Based Clothing Reuse and Upcycling Services under a Social Innovation Perspective. Sustainability 2022, 15, 262. [Google Scholar] [CrossRef]
  14. Sung, K. Evaluating two interventions for scaling up upcycling: Community event and upcycling plaza. In Proceedings of the International Conference on Resource Sustainability, Dublin, Ireland, 19–23 July 2021. [Google Scholar]
  15. Ly, S.; Furukawa, R. Factors That Influence Clothing Upcycling Behavior in Japan: Extending the Theory of Planned Behavior. Sustainability 2024, 16, 6116. [Google Scholar] [CrossRef]
  16. Sung, K.; Cooper, T.; Kettley, S. Factors influencing upcycling for UK makers. Sustainability 2019, 11, 870. [Google Scholar] [CrossRef]
  17. Bhatt, D.; Silverman, J.; Dickson, M.A. Consumer interest in upcycling techniques and purchasing upcycled clothing as an approach to reducing textile waste. International Journal of Fashion Design. Technol. Educ. 2019, 12, 118–128. [Google Scholar]
  18. Coppola, C.; Vollero, A.; Siano, A. Consumer upcycling as emancipated self-production: Understanding motivations and identifying upcycler types. J. Clean. Prod. 2021, 285, 124–812. [Google Scholar] [CrossRef]
  19. Kim, S. Bringing Everyday Design into People’s Life: Design Considerations for Facilitating Everyday Design Behavior. Ph.D. Thesis, Ulsan National Institute of Science and Technology, Ulsan, Republic of Korea, 2021. [Google Scholar]
  20. Yue, S.; Wang, P.; Yu, B.; Zhang, T.; Zhao, Z.; Li, Y.; Zhan, S. From plastic waste to treasure: Selective upcycling through catalytic technologies. Adv. Energy Mater. 2023, 13, 2302008. [Google Scholar] [CrossRef]
  21. Jackson, T. Motivating sustainable consumption: A review of evidence on consumer behaviour and behavioural change. Sustain. Dev. Res. Netw. 2005, 29, 30–40. [Google Scholar]
  22. Tonglet, M.; Phillips, P.S.; Read, A.D. Using the Theory of Planned Behaviour to investigate the determinants of recycling behaviour: A case study from Brixworth, UK. Resour. Conserv. Recycl. 2004, 41, 191–214. [Google Scholar] [CrossRef]
  23. Barr, S.; Gilg, A.; Shaw, G. ‘Helping People Make Better Choices’: Exploring the behaviour change agenda for environmental sustainability. Appl. Geogr. 2011, 31, 712–720. [Google Scholar] [CrossRef]
  24. Casalegno, C.; Candelo, E.; Santoro, G. Exploring the antecedents of green and sustainable purchase behaviour: A comparison among different generations. Psychol. Mark. 2022, 39, 1007–1021. [Google Scholar] [CrossRef]
  25. Ur Rahman, S.; Chwialkowska, A.; Hussain, N.; Bhatti, W.A.; Luomala, H. Cross-cultural perspective on sustainable consumption: Implications for consumer motivations and promotion. Environment. Dev. Sustain. 2023, 25, 997–1016. [Google Scholar] [CrossRef]
  26. Choi, S.; Kim, I. Role of restorative natural environments in predicting hikers’ pro-environmental behavior in a nature trail context. J. Travel Tour. Mark. 2024, 41, 596–613. [Google Scholar] [CrossRef]
  27. Quan, L.; Koo, B.; Han, H. Exploring the factors that influence customers’ willingness to switch from traditional hotels to green hotels. J. Travel Tour. Mark. 2023, 40, 185–202. [Google Scholar] [CrossRef]
  28. Stern, P.C. New environmental theories: Toward a coherent theory of environmentally significant behavior. J. Soc. Issues 2000, 56, 407–424. [Google Scholar] [CrossRef]
  29. Kallbekken, S.; Rise, J.; Westskog, H. Combining insights from economics and social psychology to explain environmentally significant consumption. In Sustainable Energy, 1st ed.; John, K.D., Rübbelke, D.T.G., Eds.; Routledge: London, UK, 2010; pp. 127–145. [Google Scholar]
  30. Martiskainen, M. Affecting consumer behaviour on energy demand. Sussex SPRU–Sci. Technol. Policy Res. 2007, 81, 42–49. [Google Scholar]
  31. Ajzen, I. The theory of planned behavior. Organ. Behav. Hum. Decis. Process. 1991, 50, 179–211. [Google Scholar] [CrossRef]
  32. Fishbein, M.; Ajzen, I. Belief, attitude, intention, and behavior: An introduction to theory and research. Philos. Rhetor. 1977, 10, 130–132. [Google Scholar]
  33. Armitage, C.J.; Conner, M. Efficacy of the theory of planned behaviour: A meta-analytic review. Br. J. Soc. Psychol. 2001, 40, 471–499. [Google Scholar] [CrossRef]
  34. Joo, K.; Kim, J.; Hwang, J. Effects of foodservice consumers’ perceptions of face recognition payment on attitude, desire, and behavioral intentions: A cross-cultural study. J. Travel Tour. Mark. 2024, 41, 359–376. [Google Scholar] [CrossRef]
  35. Davis, F.D. Perceived usefulness, perceived ease of use, and user acceptance of information technology. MIS Q. 1989, 13, 319–340. [Google Scholar] [CrossRef]
  36. Liu, Y.Q.; Henseler, J.; Liu, Y.D. What makes tourists adopt smart hospitality? An inquiry beyond the technology acceptance model. Digit. Bus. 2022, 2, 100042. [Google Scholar] [CrossRef]
  37. Chen, C.D.; Fan, Y.W.; Farn, C.K. Predicting electronic toll collection service adoption: An integration of the technology acceptance model and the theory of planned behavior. Transp. Res. Part C Emerg. Technol. 2007, 15, 300–311. [Google Scholar] [CrossRef]
  38. Choe, J.Y.; Kim, J.J.; Hwang, J. Innovative robotic restaurants in Korea: Merging a technology acceptance model and theory of planned behaviour. Asian J. Technol. Innov. 2022, 30, 466–489. [Google Scholar] [CrossRef]
  39. Rausch, T.M.; Kopplin, C.S. Bridge the gap: Consumers’ purchase intention and behavior regarding sustainable clothing. J. Clean. Prod. 2021, 278, 123882. [Google Scholar] [CrossRef]
  40. Kang, J.; Liu, C.; Kim, S.H. Environmentally sustainable textile and apparel consumption: The role of consumer knowledge, perceived consumer effectiveness and perceived personal relevance. Int. J. Consum. Stud. 2013, 37, 442–452. [Google Scholar] [CrossRef]
  41. Kim, S.H.; Seock, Y.K. The roles of values and social norm on personal norms and pro-environmentally friendly apparel product purchasing behavior: The mediating role of personal norms. J. Retail. Consum. Serv. 2019, 51, 83–90. [Google Scholar] [CrossRef]
  42. Ajzen, I. From intentions to actions: A theory of planned behavior. In Action Control: From Cognition to Behavior; Kuhl, J., Beckmann, J., Eds.; Springer: Berlin/Heidelberg, Germany, 1985; pp. 11–39. [Google Scholar]
  43. Paul, J.; Modi, A.; Patel, J. Predicting green product consumption using theory of planned behavior and reasoned action. J. Retail. Consum. Serv. 2016, 29, 123–134. [Google Scholar] [CrossRef]
  44. Shen, C.C.; Chiou, J.S. The impact of perceived ease of use on Internet service adoption: The moderating effects of temporal distance and perceived risk. Comput. Hum. Behav. 2010, 26, 42–50. [Google Scholar] [CrossRef]
  45. Kowalczuk, P. Consumer acceptance of smart speakers: A mixed methods approach. J. Res. Interact. Mark. 2018, 12, 418–431. [Google Scholar] [CrossRef]
  46. Bryman, A. Social Research Methods, 5th ed.; Oxford University Press: Oxford, UK, 2016; pp. 1–747. [Google Scholar]
  47. Livat. Available online: https://www.livat.cn/zh-cn/about-us/ (accessed on 5 June 2024).
  48. Constructing a TPB Questionnaire: Conceptual and Methodological Considerations. Available online: https://people.umass.edu/aizen/pdf/tpb.measurement.pdf (accessed on 5 June 2024).
  49. Chen, S.Y. Green helpfulness or fun? Influences of green perceived value on the green loyalty of users and non-users of public bikes. Transp. Policy 2016, 47, 149–159. [Google Scholar] [CrossRef]
  50. Maichum, K.; Parichatnon, S.; Peng, K.C. Application of the extended theory of planned behavior model to investigate purchase intention of green products among Thai consumers. Sustainability 2016, 8, 1077. [Google Scholar] [CrossRef]
  51. Mallery, P.; George, D. SPSS for Windows Step by Step; Allyn & Bacon, Inc.: Needham, MA, USA, 2000; pp. 1–371. [Google Scholar]
  52. Kline, P. An Easy Guide to Factor Analysis; Routledge: London, UK, 2014; pp. 1–208. [Google Scholar]
  53. Stevens, J.P. Applied Multivariate Statistics for the Social Sciences, 5th ed.; Routledge: Cincinnati, OH, USA, 2012; pp. 337–406. [Google Scholar]
  54. Gansser, O.A.; Reich, C.S. Influence of the new ecological paradigm (NEP) and environmental concerns on pro-environmental behavioral intention based on the theory of planned behavior (TPB). J. Clean. Prod. 2023, 382, 134629. [Google Scholar]
  55. Albayati, H.; Alistarbadi, N.; Rho, J.J. Assessing engagement decisions in NFT Metaverse based on the Theory of Planned Behavior (TPB). Telemat. Inform. Rep. 2023, 10, 100045. [Google Scholar] [CrossRef]
  56. Belida, P.R.C.; Ong, A.K.S.; Young, M.N.; German, J.D. Determining the Factors Influencing the Behavioral Intention of Job-Seeking Filipinos to Career Shift and Greener Pasture. Societies 2024, 14, 145. [Google Scholar] [CrossRef]
  57. Su, D.L.; Wan, A.W.; Zhang, L.; Teng, J.; Chan, D.K. Predicting Adolescents’ Leisure-Time Physical Activity Levels: A Three-Wave Prospective Test of the Integrated Model of Self-Determination Theory and the Theory of Planned Behavior. Behav. Sci. 2024, 14, 693. [Google Scholar] [CrossRef]
  58. Godin, G.; Valois, P.; Lepage, L. The pattern of influence of perceived behavioral control upon exercising behavior: An application of Ajzen’s theory of planned behavior. J. Behav. Med. 1993, 16, 81–102. [Google Scholar] [CrossRef] [PubMed]
  59. Li, P.; Lin, I.K.; Chen, H.S. Low Carbon Sustainable Diet Choices—An Analysis of the Driving Factors behind Plant-Based Egg Purchasing Behavior. Nutrients 2024, 16, 2604. [Google Scholar] [CrossRef]
  60. Ajzen, I.; Fishbein, M. Understanding Attitudes and Predicting Social Behavior. Exp. Soc. Psychol 1980, 22, 453–474. [Google Scholar] [CrossRef]
  61. Villanueva, D.J.B.; Ong, A.K.S.; German, J.D. Machine Learning Methods Analysis of Preceding Factors Affecting Behavioral Intentions to Purchase Reduced Plastic Products. Sustainability 2024, 16, 2978. [Google Scholar] [CrossRef]
  62. Khan, F.; Ahmed, W.; Najmi, A. Understanding consumers’ behavior intentions towards dealing with the plastic waste: Perspective of a developing country. Resour. Conserv. Recycl. 2019, 142, 49–58. [Google Scholar] [CrossRef]
  63. Saoula, O.; Shamim, A.; Suki, N.M.; Ahmad, M.J.; Abid, M.F.; Patwary, A.K.; Abbasi, A.Z. Building e-trust and e-retention in online shopping: The role of website design, reliability and perceived ease of use. Span. J. Mark.-ESIC 2023, 27, 178–201. [Google Scholar] [CrossRef]
  64. Deng, Y.; Shen, H.; Ji, X. Exploring Virtual Fashion Consumption through the Emotional Three-Level Theory: Reflections on Sustainable Consumer Behavior. Sustainability 2024, 16, 5818. [Google Scholar] [CrossRef]
  65. Warganegara, D.L.; Babolian Hendijani, R. Factors That Drive Actual Purchasing of Groceries through E-Commerce Platforms during COVID-19 in Indonesia. Sustainability 2022, 14, 3235. [Google Scholar] [CrossRef]
  66. Klopping, I.M.; McKinney, E. Extending the technology acceptance model and the task-technology fit model to consumer e-commerce. Inf. Technol. Learn. Perform. J. 2004, 22, 1–14. [Google Scholar]
  67. Ali, M.; Ullah, S.; Ahmad, M.S.; Cheok, M.Y.; Alenezi, H. Assessing the impact of green consumption behavior and green purchase intention among millennials toward sustainable environment. Environ. Sci. Pollut. Res. 2023, 30, 23335–23347. [Google Scholar] [CrossRef]
  68. Yu, S.; Zhong, Z.; Zhu, Y.; Sun, J. Green Emotion: Incorporating Emotional Perception in Green Marketing to Increase Green Furniture Purchase Intentions. Sustainability 2024, 16, 4935. [Google Scholar] [CrossRef]
  69. Tang, C.; Han, Y.; Ng, P. Green consumption intention and behavior of tourists in urban and rural destinations. J. Environ. Plan. Manag. 2023, 66, 2126–2150. [Google Scholar] [CrossRef]
  70. Carfora, V.; Cavallo, C.; Catellani, P.; Del Giudice, T.; Cicia, G. Why Do Consumers Intend to Purchase Natural Food? Integrating Theory of Planned Behavior, Value-Belief-Norm Theory, and Trust. Nutrients 2021, 13, 1904. [Google Scholar] [CrossRef]
  71. Canova, L.; Bobbio, A.; Manganelli, A.M. Buying organic food products: The role of trust in the theory of planned behavior. Front. Psychol. 2020, 11, 575–820. [Google Scholar] [CrossRef]
  72. Qi, X.; Ploeger, A. Explaining Chinese Consumers’ Green Food Purchase Intentions During the COVID-19 Pandemic: An Extended Theory of Planned Behaviour. Foods 2021, 10, 1200. [Google Scholar] [CrossRef] [PubMed]
  73. Ruzgys, S.; Pickering, G.J. Gen Z and sustainable diets: Application of The Transtheoretical Model and the theory of planned behaviour. J. Clean. Prod. 2024, 434, 140300. [Google Scholar] [CrossRef]
  74. Fauzi, M.A.; Hanafiah, M.H.; Kunjuraman, V. Tourists’ intention to visit green hotels: Building on the theory of planned behaviour and the value-belief-norm theory. J. Tour. Futures 2024, 10, 255–276. [Google Scholar] [CrossRef]
  75. Wang, L.; Wong, P.P.; Narayanan, E.A. The demographic impact of consumer green purchase intention toward green hotel selection in China. Tour. Hosp. Res. 2020, 20, 210–222. [Google Scholar] [CrossRef]
  76. Liao, C.; Huang, Y.; Zheng, Z.; Xu, Y. Investigating the factors influencing urban residents’ low-carbon travel intention: A comprehensive analysis based on the TPB model. Transp. Res. Interdiscip. Perspect. 2023, 22, 100948. [Google Scholar] [CrossRef]
  77. Han, H. Travelers’ pro-environmental behavior in a green lodging context: Converging value-belief-norm theory and the theory of planned behavior. Tour. Manag. 2015, 47, 164–177. [Google Scholar] [CrossRef]
  78. Qiu, H.; Wang, X.; Morrison, A.M.; Kelly, C.; Wei, W. From ownership to responsibility: Extending the theory of planned behavior to predict tourist environmentally responsible behavioral intentions. J. Sustain. Tour. 2022, 1–24. [Google Scholar] [CrossRef]
  79. Cao, J.; Qiu, H.; Morrison, A.M. Self-identity matters: An extended theory of planned behavior to decode tourists’ waste sorting intentions. Int. J. Environ. Res. Public Health 2023, 20, 5099. [Google Scholar] [CrossRef]
  80. Wildt, K.K.D.; Meijers, M.H.C. Time spent on separating waste is never wasted: Fostering people’s recycling behavior through the use of a mobile application. Comput. Hum. Behav. 2023, 139, 107541. [Google Scholar] [CrossRef]
  81. Halder, P.; Singh, H. Predictors of Recycling Intentions among the Youth: A Developing Country Perspective. Recycling 2018, 3, 38. [Google Scholar] [CrossRef]
  82. Wang, C.; Ahmad, S.F.; Ayassrah, A.Y.A.B.A.; Awwad, E.M.; Irshad, M.; Ali, Y.A.; AI-Razgan, M.; Khan, Y.; Han, H. An empirical evaluation of technology acceptance model for Artificial Intelligence in E-commerce. Heliyon 2023, 9, e18349. [Google Scholar] [CrossRef] [PubMed]
  83. Wang, S.F.; Chen, C.C. Exploring Designer Trust in Artificial Intelligence-Generated Content: TAM/TPB Model Study. Appl. Sci. 2024, 14, 6902. [Google Scholar] [CrossRef]
  84. Mohr, S.; Kühl, R. Acceptance of artificial intelligence in German agriculture: An application of the technology acceptance model and the theory of planned behavior. Precis. Agric. 2021, 22, 1816–1844. [Google Scholar] [CrossRef]
  85. Vahdat, A.; Alizadeh, A.; Quach, S.; Hamelin, N. Would you like to shop via mobile app technology? The technology acceptance model, social factors and purchase intention. Australas. Mark. J. 2021, 29, 187–197. [Google Scholar] [CrossRef]
  86. Wu, J.; Song, S. Older adults’ online shopping continuance intentions: Applying the technology acceptance model and the theory of planned behavior. Int. J. Hum.-Comput. Interact. 2021, 37, 938–948. [Google Scholar] [CrossRef]
  87. Sajid, S.; Rashid, R.M.; Haider, W. Changing trends of consumers’ online buying behavior during COVID-19 pandemic with moderating role of payment mode and gender. Front. Psychol. 2022, 13, 919334. [Google Scholar] [CrossRef]
  88. Ceschin, F.; Gaziulusoy, I. Evolution of design for sustainability: From product design to design for system innovations and transitions. Des. Stud. 2016, 47, 118–163. [Google Scholar] [CrossRef]
Figure 1. The theory of planned behavior (TPB).
Sustainability 16 09179 g001
Figure 2. The technology acceptance model (TAM).
Sustainability 16 09179 g002
Figure 3. The proposed conceptual model and research hypotheses.
Sustainability 16 09179 g003
Figure 4. Illustrates various upcycling designs: (a) “Survival-defense”: upcycling design of discarded carton; (b) “After a meal”: upcycling of household waste; (c) “Florescence”: upcycling design of discarded fabrics and cans; (d) “No eating non plastic”: upcycling design of discarded plastic.
Sustainability 16 09179 g004
Figure 5. Presents the co-design sections for various waste materials: (a) Waste carton; (b) Waste plastic box; (c) Waste wooden pallets; (d) Waste shopping lists.
Sustainability 16 09179 g005
Figure 6. Depicts the different workshop sessions: (a) Visit session: participants explore the exhibition; (b) Exercise session: participants create plastic flowers; (c) Exercise session: participants craft fabric pendants; (d) Result session: participants pose for a photo with their completed work.
Sustainability 16 09179 g006
Figure 7. (a) Intended normal Q–Q plot: Q4 = below bachelor’s degree; (b) intended normal Q–Q plot: Q4 = bachelor’s degree; (c) intended normal Q–Q plot: Q4 = master’s degree and above.
Sustainability 16 09179 g007
Figure 8. (a) Perceived behavioral control normal Q–Q plot: Q3 ≤ 100,000 RMB; (b) attitude normal Q–Q plot: Q3 ≤ 100,000 RMB; (c) attitude normal Q–Q plot: Q3 = 200,001–400,000 RMB; (d) attitude normal Q–Q plot: Q3 ≥ 400,000 RMB.
Sustainability 16 09179 g008
Figure 9. Structural equation modeling (SEM).
Sustainability 16 09179 g009
Table 1. Construct and items.
ConstructScale ItemsSource
Perceived EnjoymentA1: I think upcycling can be a crafting experience.
A2: I think upcycling can relieve stress.
A3: I think upcycling is a good way to spend my free time.
[49]
Perceived Ease of UseB1: Upcycling doesn’t take much of my time.
B2: I have enough space in my home to support recycling.
B3: I am very creative when upcycling.
[35]
Subjective NormsC1: I would feel guilty about not upcycling (e.g., drink bottles can still hold spices, etc.)
C2: Upcycling is in line with what my friends and family expect of me.
C3: Social policies support upcycling.
[48]
Perceived Behavioral ControlD1: Overall, I think upcycling is easy.
D2: There are no significant production costs associated with upcycling.
D3: There is no outside influence on whether I upgrade or not.
D4: The difficulty of upcycling directly affects my attitude.
AttitudeE1: For me upcycling is pleasant.
E2: For me upgrading is useful.
E3: I think upcycling should be done.
[48]
IntentionF1: In the future, I intend to upcycle.
F2: In the future, I intend to increase the frequency of upcycling.
F3: In the future, I intend to plan for the reuse of waste.
BehaviorG1: In the past year, how often have you upcycled?
G2: In the past year, what percentage of the time did you use your own rebuilt products?
Table 2. Frequency analysis results.
NameOptionsFrequencyPercentage (%)Cumulative Percentage (%)
GenderMale13038.6938.69
Female20661.31100.00
Age Group<18339.829.82
18–2527782.4492.26
26–35154.4696.73
36–45102.9899.70
46–6010.30100.00
Income Status<100,000 RMB30791.3791.37
100,000–200,000 RMB133.8795.24
200,001–400,000 RMB61.7997.02
>400,000 RMB102.98100.00
Education LevelBelow bachelor’s degree7622.6222.62
Bachelor’s degree24372.3294.94
Master’s degree and above175.06100.00
Frequency of Waste Reuse in Daily LifeAlmost every day7221.4321.43
Once a week9528.2749.70
Once a month7923.5173.21
Once a year278.0481.25
Almost never6318.75100.00
Table 3. One-way ANOVA with different academic qualifications.
SSdfMSFp
Perceived EnjoymentB1.06420.5320.4760.621
W371.9043331.117
T 372.968335
Perceived Ease of UseB0.03320.0170.0150.985
W374.4573331.124
T 374.490335
Subjective NormsB0.09720.0490.0440.957
W364.8373331.096
T 364.934335
Perceived Behavioral ControlB0.26920.1340.1570.855
W285.3253330.857
T 285.594335
AttitudeB5.29722.6492.7500.065
W320.6973330.963
T 325.994335
IntentionB6.77623.3883.7430.025
W301.4023330.905
T 308.178335
BehaviorB1.25420.6270.5160.597
W404.7283331.215
T 405.981335
Table 4. Normality test.
FormOptionsShapiro-Wilk
Wdfp
IntentionBelow bachelor’s degree0.934760.001
Bachelor’s degree0.9472430.000
Master’s degree and above0.827170.005
Table 5. Least significant difference.
DV(I) Education Level(J) Education LevelMD(I–J)SEp95% Confidence Interval
Lower LimitUpper Bound
AttitudeBelow bachelor’s degreeBachelor’s degree0.028580.125040.819−0.21740.2745
Below bachelor’s degreeBachelor’s degree−0.62392 *0.255250.015−1.1260−0.1218
Bachelor’s degreeMaster’s degree and above−0.65250 *0.238680.007−1.1220−0.1830
* Note: The significance level of the mean difference is 0.05.
Table 6. One-way ANOVA with different annual incomes.
SSdfMSFp
Perceived EnjoymentB2.57330.8580.7690.512
W370.3953321.116
T 372.968335
Perceived Ease of UseB5.82931.9431.7500.157
W368.6613321.110
T 374.490335
Subjective NormsB0.47730.1590.1450.933
W364.4563321.098
T 364.934335
Perceived Behavioral ControlB33.390311.13014.6520.000
W252.2033320.760
T 285.594335
AttitudeB10.64133.5473.7340.012
W315.3533320.950
T 325.994335
IntentionB2.27530.7580.8230.482
W305.9033320.921
T 308.178335
BehaviorB4.51131.5041.2430.294
W401.4713321.209
T 405.981335
Table 7. Normality test.
FormIncome StatusShapiro-Wilk
Wdfp
Perceived Behavioral Control<100,000 RMB0.9633070.000
100,000–200,000 RMB0.916130.225
200,001–400,000 RMB0.80060.059
>400,000 RMB0.884100.144
Attitude<100,000 RMB0.9553070.000
100,000–200,000 RMB0.919130.247
200,001–400,000 RMB0.70060.006
>400,000 RMB0.796100.013
Table 8. Least significant difference.
DV(I) Income Status(J) Income StatusMD(I-J)SEp95% Confidence Interval
Lower LimitUpper Bound
Perceived Behavioral Control<100,000 RMB100,000–200,000 RMB1.43022 *0.246800.0000.94471.9157
<100,000 RMB200,001–400,000 RMB1.21227 *0.359280.0010.50551.9190
<100,000 RMB>400,000 RMB0.020600.280070.941−0.53030.5715
100,000–200,000 RMB200,001–400,000 RMB−0.217950.430170.613−1.06410.6282
100,000–200,000 RMB>400,000 RMB−1.40962 *0.366610.000−2.1308−0.6885
200,001–400,000 RMB>400,000 RMB−1.19167 *0.450080.008−2.0770−0.3063
Attitude<100,000 RMB100,000–200,000 RMB−0.64377 *0.275970.020−1.1866−0.1009
<100,000 RMB200,001–400,000 RMB−0.98966 *0.401750.014−1.7800−0.1994
<100,000 RMB>400,000 RMB−0.022000.313180.944−0.63810.5941
100,000–200,000 RMB200,001–400,000 RMB−0.345900.481020.473−1.29210.6003
100,000–200,000 RMB>400,000 RMB0.621770.409940.130−0.18461.4282
200,001–400,000 RMB>400,000 RMB0.967670.503280.055−0.02241.9577
* Note: The significance level of the mean difference is 0.05.
Table 9. Descriptive statistics for variables.
NameMeanStandard DeviationSkewnessKurtosis
Perceived Enjoyment3.1151.055−0.422−0.939
Perceived Ease of Use3.1071.057−0.335−1.052
Subjective Norms3.2091.044−0.342−0.947
Perceived Behavioral Control3.2180.923−0.35−0.786
Attitude3.2200.986−0.29−0.988
Intention3.1510.959−0.211−1.121
Behavior3.2431.101−0.434−0.872
Table 10. Cronbach’s reliability analysis.
DimensionNumber of ItemsSample SizeCronbach’s Alpha Coefficient
Perceived Enjoyment33360.835
Perceived Ease of Use33360.834
Subjective Norm33360.830
Perceived Behavioral Control43360.838
Attitude33360.815
Intention33360.791
Behavior23360.783
Table 11. KMO and bartlett’s test.
KMO Value0.838
Bartlett’s test of sphericityApproximate Chi-Square3303.342
df210
p0.000
Table 12. Variance explained rates.
Factor NumberEigenvaluesPre-Rotation Variance ExplainedPost-Rotation Variance Explained
EigenvaluesPercentage of Variance Explained (%)Cumulative (%)EigenvaluesPercentage of Variance Explained (%)Cumulative (%)EigenvaluesPercentage of Variance Explained (%)Cumulative
(%)
16.69331.87431.8746.69331.87431.8742.80813.37413.374
21.9899.47041.3441.9899.47041.3442.29210.91424.288
31.7768.45749.8001.7768.45749.8002.29010.90735.195
41.5447.35257.1531.5447.35257.1532.26710.79645.991
51.3296.33163.4831.3296.33163.4832.21510.54656.537
61.2245.83169.3141.2245.83169.3142.13110.14966.686
71.1145.30474.6181.1145.30474.6181.6667.93274.618
Table 13. Factor loading coefficients after rotation.
NameFactor LoadingsCommunality (Common Factor Variance)
Factor 1Factor 2Factor 3Factor 4Factor 5Factor 6Factor 7
A10.1390.0010.8800.0480.1070.0500.1110.822
A20.2360.1610.7660.0930.1680.0880.1070.724
A30.0750.0990.8210.0980.1560.1360.1070.753
B10.0360.9100.0530.1110.0640.0690.0340.855
B20.1710.7700.0360.1240.1570.1830.1540.721
B30.0950.7960.1560.0970.1760.1130.0720.726
C10.0700.1280.0690.8930.0730.1230.0310.845
C20.1590.1040.0630.7790.0960.1960.1070.705
C30.1450.1000.1060.7780.2250.168−0.0220.726
D10.8800.0080.1040.0480.0550.063−0.0090.796
D20.7500.0870.1180.0560.0750.1760.1110.636
D30.7800.1100.0560.1770.1480.0560.0860.688
D40.7310.1090.1770.1170.1380.0800.0850.624
E10.0550.1440.1410.1240.8660.1400.0500.831
E20.1760.1620.2080.1410.7240.1350.0720.668
E30.1950.1090.1120.1360.7680.1580.1800.729
F10.0830.1070.1000.1250.0820.8790.0530.826
F20.2110.1000.1130.1950.1330.7300.0890.664
F30.0750.1620.0640.1880.2210.7240.1400.664
G10.0770.0930.1780.0200.0610.1630.8680.830
G20.1470.1300.1170.0810.1880.0730.8590.837
Note: Bold numbers in the table indicate factor loading coefficients with absolute values greater than 0.4.
Table 14. Model fit indices.
Indicator NameFit StandardTest ResultAcceptability
CMIN/df<32.040Acceptance
RMSEA<0.080.056Acceptance
GFI>0.80.916Acceptance
NFI>0.80.899Acceptance
IFI>0.80.946Acceptance
CFI>0.80.945Acceptance
TLI>0.80.931Acceptance
PNFI>0.50.719Acceptance
PCFI>0.50.756Acceptance
Table 15. Factor loadings table.
Latent VariableMeasurement ItemCoefficient (Coef.)Standard Error (Std. Error)z (CR)pStandard Estimate (Std. Estimate)Average Variance Extracted (AVE) Composite Reliability (CR)
Perceived EnjoymentA11---0.8320.6380.841
A20.7670.05314.42900.784
A30.7510.05214.36400.779
Perceived Ease of UseB11---0.8580.6390.841
B20.7260.05114.32300.768
B30.730.05114.33600.769
Subjective NormC11---0.8680.6340.838
C20.6930.0513.98900.743
C30.7390.05114.51300.773
Perceived Behavioral ControlD11---0.8230.5710.841
D20.7220.05513.13400.712
D30.7800.05614.03600.757
D40.7350.05513.41500.726
AttitudeE11---0.8410.6120.825
E20.6530.04913.22500.721
E30.7410.05214.21500.78
IntentionF11---0.8180.5710.799
F20.7380.0612.25200.721
F30.7120.05812.29700.725
BehaviorG11---0.7770.6600.795
G20.8790.0988.98100.846
Table 16. Discriminant validity: Pearson correlation and AVE square root.
Perceived EnjoymentPerceived Ease of UseSubjective NormPerceived Behavioral ControlAttitudeIntentionBehavior
Perceived Enjoyment0.799
Perceived Ease of Use0.256 ***0.799
Subjective Norm0.253 ***0.318 ***0.796
Perceived Behavioral Control0.353 ***0.262 ***0.313 ***0.756
Attitude0.403 ***0.377 ***0.378 ***0.350 ***0.782
Intention0.295 ***0.349 ***0.434 ***0.322 ***0.415 ***0.756
Behavior0.341 ***0.278 ***0.182 ***0.261 ***0.325 ***0.312 ***0.813
Note: Numbers in bold along the diagonal are the square root of average variance extracted (AVE); *** p < 0.001.
Table 17. Pearson correlation.
Perceived EntertainmentPerceived Ease of UseSubjective NormPerceived Behavioral ControlAttitude Intention Behavior
Perceived Entertainment1
Perceived Ease of Use0.256 **1
Subjective Norm0.253 **0.318 **1
Perceived Behavioral Control0.354 **0.262 **0.313 **1
Attitude0.403 **0.376 **0.377 **0.350 **1
Intention0.295 **0.349 **0.434 **0.322 **0.415 **1
Behavior0.342 **0.278 **0.182 **0.261 **0.325 **0.312 **1
Note: ** p < 0.01.
Table 18. Path analysis.
PathStandard Path CoefficientUnstandardized Path CoefficientSECRp
H1Attitude → Intention0.3250.3010.0664.5760.000 **
H2Subjective Norms → Intention0.3210.2830.064.710.000 **
H3Subjective Norms → Attitude0.2090.20.0613.2550.001 **
H4Perceived Behavioral Control → Intention0.1350.1830.0892.0630.039 *
H5Perceived Behavioral Control → Attitude0.1420.2080.0972.150.032 *
H6Perceived Ease of Use → Attitude 0.2310.30.0823.6490.000 **
H7Perceived Enjoyment → Attitude 0.2880.3750.0864.3470.000 **
H8Intention → Behavior0.3140.3160.0764.1480.000 **
H9Perceived Behavioral Control → Behavior0.2180.2970.0983.0340.002 *
Note: * p < 0.05 ** p < 0.01.
Disclaimer/Publisher’s Note: The statements, opinions and data contained in all publications are solely those of the individual author(s) and contributor(s) and not of MDPI and/or the editor(s). MDPI and/or the editor(s) disclaim responsibility for any injury to people or property resulting from any ideas, methods, instructions or products referred to in the content.

