1. Introduction
Improving the quality of life is one of the main priorities for modern urban development. Maintaining the comfort and safety of drivers and passengers on the roads is crucial for improving life quality. By 2030, almost 60% of the world’s population is predicted to reside in cities. Given that millions of people depend on the road infrastructure for their daily transportation, road safety is critically important. This implies that the demand for transportation would surpass the capacity of most present transportation systems, placing a high load on the road infrastructure in these cities [
1].
Ensuring that roads are maintained in good condition is critical for the safety and comfort of citizens. However, poor surface quality, aging infrastructure, heavy traffic, and natural events such as earthquakes and heavy rainfall can lead to significant road damage, including potholes and cracks [
2]. Besides being detrimental to comfort and leading to costly vehicle damages, potholes and other road anomalies can be very dangerous, potentially causing accidents with serious injuries or fatalities. Thus, addressing this problem in a timely manner is essential for safeguarding drivers and passengers.
In Saudi Arabia, road traffic accidents account for about 5% of all fatalities [
3]. Over the past decade, the rate of road deaths has risen from 17.4 to 24 per 100,000 people [
3]. Additionally, Saudi Arabia experiences 19 fatalities and 4 injuries due to automobile accidents every hour, underscoring the significant public health risk posed by these incidents [
3]. One of the primary elements leading to accidents and fatalities is the road infrastructure, which should be designed and maintained to eliminate or decrease hazards for all road users [
1].
The current system used in Saudi Arabia for pothole detection is managed by the Saudi municipalities. The system requires that employees at the road maintenance department manually scan the roads, inspect the potholes, estimate the danger, and report the detected potholes. Thus, the reporting is subjective, relying on the employees’ expertise, and it is also opportunistic, depending on the potholes encountered during inspections. Additionally, this task can be labor-intensive, requiring many employees to cover extensive urban areas. It is particularly challenging in congested streets, posing a significant threat to the safety of the employees. Alternatively, drivers or citizens can report potholes. However, this depends on their willingness to take pictures of the potholes and upload them using a web portal or mobile application, a task that can be time-consuming and inconvenient for some drivers [
4]. Moreover, the current system does not include any mechanism for informing drivers about nearby potholes.
Several research approaches have been proposed to automatically analyze road conditions for identifying potholes and other road anomalies [
5]. These approaches can be categorized into two main categories, vision-based, and vibration-based [
6]. While vibration-based approaches for road condition monitoring are cost-effective, easier to install, and more reliable under various environmental conditions, vision-based systems provide extensive and contextual information on road conditions. This information can lead to more comprehensive maintenance strategies and enhanced road safety.
This paper proposes a system that automates pothole detection using deep learning. The proposed system, PDS-UAV, uses unmanned aerial vehicles (UAVs), also known as drones, to capture images of potholes, providing a wide sensing range compared with drivers’ smartphones or in-vehicle cameras. Images are then uploaded to the system for analysis and classification using a deep neural network detection algorithm, specifically You Only Look Once (YOLO), known for its accuracy and speed. Thus, the proposed system allows for easier pothole detection without relying on the chance of encountering potholes or individuals’ perceptions and viewpoints.
The main contribution of this paper is the development of a pothole detection and management system that utilizes a deep learning model for detecting potholes from images captured by UAVs. Initially, a deep learning model for pothole detection is trained using a publicly available dataset. The model is then tested using a dataset collected for Jeddah city in Saudi Arabia to confirm its accuracy and reliability in identifying potholes by using cross-city testing as a method for cross-domain generalization. Additionally, two web applications are developed: one for the road maintenance employees (RMEs) to manage the repairs of the detected potholes, and another is used to inform drivers about nearby potholes based on their routes by utilizing map annotation.
The remainder of the paper is organized as follows:
Section 2 reviews various approaches proposed in the literature for pothole detection using smartphones, in-vehicle cameras, or UAV images.
Section 3 introduces the proposed PDS-UAV system.
Section 4 elaborates on the development methodology of PDS-UAV. The PDS-UAV deep learning model for pothole detection is presented in
Section 5.
Section 6 covers the testing of the PDS-UAV system.
Section 7 presents the discussion, and
Section 8 concludes the paper.
3. PDS-UAV System Overview
The target users of the system, PDS-UAV, can be divided into two main categories, which are:
Road maintenance employees (RMEs): This category includes the employees responsible for road maintenance who are working at city municipalities. In our scenario, we focus on employees at the Jeddah City municipality. These employees utilize the system to report pothole locations, monitor them, and update their status.
Road users (RUs): This category includes drivers, bicyclists, and pedestrians who utilize the proposed system to be informed about pothole locations on their routes. This system helps RUs avoid detected potholes, ensuring their safety and preventing potential vehicle damage.
The proposed system, PDS-UAV, consists of three main parts: (A) UAV, (B) deep learning model, and (C) web application. The UAV is used for capturing road surface images and includes the camera, GPS, and battery. The deep learning model is responsible for pothole detection using deep learning classification methods (e.g., YOLO). Finally, the web application includes two different versions of the system, (D) and (E), customized for the two users’ categories. Part (D) is the web application designed for RMEs. It includes three components, the map, potholes’ locations, and potholes images. In addition, it includes two functions, uploading pothole images and updating pothole status. Part (E) is the web application designed for RUs, including drivers, pedestrians, and bicyclists. The RU web application includes two components: a map displaying the selected route based on the entered starting and destination points and map annotations to indicate the locations of detected potholes.
Figure 1 shows all the components of the system and the interactions between these components.
The system is operated as follows: the UAV captures video of the road surface, and frames (images) are extracted from this video. Then, the extracted images are uploaded to the system through the RME’s web application. The deep learning model performs the classification for pothole detection from the uploaded images. Classified images of potholes are stored in the system’s database along with their locations and relevant information. RMEs retrieve detected potholes’ information and view them on a map. Additionally, they can update the status of these potholes based on the progress of their repair. On the other hand, RUs retrieve potholes’ information and locations based on their routes by overlaying the pothole locations on the map and displaying information about the number of detected potholes on their routes, thereby allowing RUs to avoid these potholes and preventing their impact on safety or vehicle condition.
4. PDS-UAV Development Methodology
In this section, the steps of the PDS-UAV development methodology are discussed. These steps include data gathering from target system users, system design based on the gathered data from target users, the deep learning model development, and finally the PDS-UAV system implementation. Jeddah City was chosen as the empirical focus of this study to detect potholes due to its rapidly growing urban infrastructure and heavy traffic. The city’s diverse range of road conditions, from high-traffic highways to less-maintained suburban streets, provides a suitable testing ground for evaluating a pothole detection system.
4.1. Data Gathering Methods
In this research, two data collection methods, an interview and a questionnaire, were employed. The interview is designed for road maintenance department employees to obtain insights into the current pothole reporting system from an expert perspective, identify the issues employees face with the current system, determine their needs, and outline what the new system should include. On the other hand, the questionnaire aims to gather information from road users about pothole-related issues, the current pothole reporting system, needed services, and the appearance of the system’s interfaces.
4.1.1. Road Maintenance Department Interview
A semi-structured interview, which consists of open-ended questions, was conducted with an employee from the information technology department (IT) at Jeddah municipality. The interview questions are as follows:
What is the current system used for detecting and reporting potholes?
How do you rate the overall performance of the current system?
How long does it take to receive information about a detected pothole?
Are there any issues with the current system? If yes, what are these issues?
How do you solve the current issues of the system?
Would a system that uses AI to detect potholes from UAV images be beneficial?
If your answer to the previous question is yes, what would be the impact of the new system on potholes detection and management?
Do you think adding a feature that allows road users to view potholes’ locations on a map would be beneficial for avoiding them?
When asked about the current system used for pothole detection, the interviewee explained that the current system for detecting and reporting potholes is integrated into the asphalt pavement condition monitoring system. This system relies on manual human scanning conducted by Jeddah municipality employees during their inspections.
In response to rating the overall performance of the current system, the interviewee stated that the system’s performance is acceptable, although it might have some challenges. Regarding the timing of receiving information about detected potholes, it was revealed that field employees typically report their detected potholes at the end of the day, which depends on encountered potholes during their inspections. When addressing the issues and challenges of the current system, the interviewee acknowledged that even though the system is functioning adequately, it faces issues primarily due to human-induced delays and errors. Manual detection is limited by the number of available employees and their ability to efficiently scan large areas of the road network. The reliance on the chance of encountering potholes further limits the system’s effectiveness. Additionally, human errors can lead to decreased operational efficiency and potential inaccuracies in the detection. Additionally, the interviewee suggested that increasing the number of employees performing manual inspections could help to reduce detection delays.
Responding to the question about having a new system that detects potholes using AI and UAV images, the interviewee revealed that incorporating such a system would be highly beneficial. It was explained that such a system would aid employees by allowing them to cover larger areas of the road network quickly and safely, especially in big cities and congested main streets. This would accelerate pothole reporting and repairs. Moreover, using AI would help to minimize human errors associated with the current manual system. Furthermore, the interviewee expressed strong support for adding a feature that allows road users to view the locations of detected potholes in order to avoid them. A mobile interface for locating potholes would be particularly advantageous for road users, providing contextual information to enhance their travel safety.
4.1.2. Road Users Questionnaire
A questionnaire was distributed to road users to gather insights based on their daily experiences. This questionnaire was created using Google Forms and was composed of eight questions. Responses were received from 101 participants. The questions were categorized into three sections, each targeting a specific issue. An overview of the questionnaire and the collected data are shown in
Table 2.
The survey data reveals that potholes are a significant concern for drivers, with 88.2% reporting that potholes cause damage to their vehicles and 99% believing that potholes can lead to accidents. Nearly 80% of the participants had recently encountered potholes, and 83.2% expressed interest in an application to view nearby potholes. Additionally, 75% of participants felt that they would benefit from such an application, with 59% preferring a mobile interface and suggesting features like ease of use, the ability to comment on potholes, warning signs, and reporting capabilities to the municipality.
4.2. PDS-UAV System Requirements
Based on the reviewed literature and the data gathered from the target users, this section outlines the main requirements necessary for the successful implementation and operation of the proposed system, PDS-UAV. It details the functional requirements for both road maintenance employees and road users. Additionally, the software, hardware, and database requirements necessary to support the system’s functionality are elaborated upon.
4.2.1. Functional Requirements
For RMEs, the proposed system will incorporate a deep learning model into a web-based application, designed to streamline pothole management. The system should allow authorized users to log in, upload pothole images, and store their locations using GPS. It should classify images to determine whether they depict potholes and store the classified images in a database for future reference. The system should display the locations of detected potholes on a map, count potholes based on their status, and provide a search function. Users should be able to update pothole statuses, ensuring up-to-date information. Finally, the system should include a logout function for user security. For the RUs, the system is a web-based application with specific features and requirements to improve the users’ experience and safety on the roads. The system should inform road users of nearby detected potholes based on their routes. It should display the locations of detected potholes on a map, allowing users to navigate from their current location to a chosen destination while avoiding potential hazards.
4.2.2. Software, Hardware, and Database Requirements
The PDS-UAV system includes three main components: the deep learning model, the web application, and the database. Python was used for the deep learning model, hypertext markup language (HTML), cascading style sheets (CSSs), JavaScript were used for the web application, and Firebase was used for the database. The hardware equipment needed for the proposed system includes a UAV to fly over roads and capture images to determine whether they contain potholes or not. A Laptop or PC is used to perform training and testing on the dataset. Additionally, a laptop (or PC) and a smartphone are required to run the applications. In the PDS-UAV system, a database is needed to store information and images of potholes, as well as the credential information for the employees at the road maintenance department in Jeddah municipality. The road maintenance department employees should have an email and password to access the system’s database. The data requirements for the RME include the employee’s first name, last name, password, phone number, and email. The pothole data requirements include latitude and longitude for geography, which describe the pothole location coordinates; an image of the pothole; the pothole’s district location name; and the pothole status.
4.3. System Design
The system design of PDS-UAV is presented in the following subsections using a use case diagram, activity diagrams, and sequence diagrams.
4.3.1. Use Case Diagram
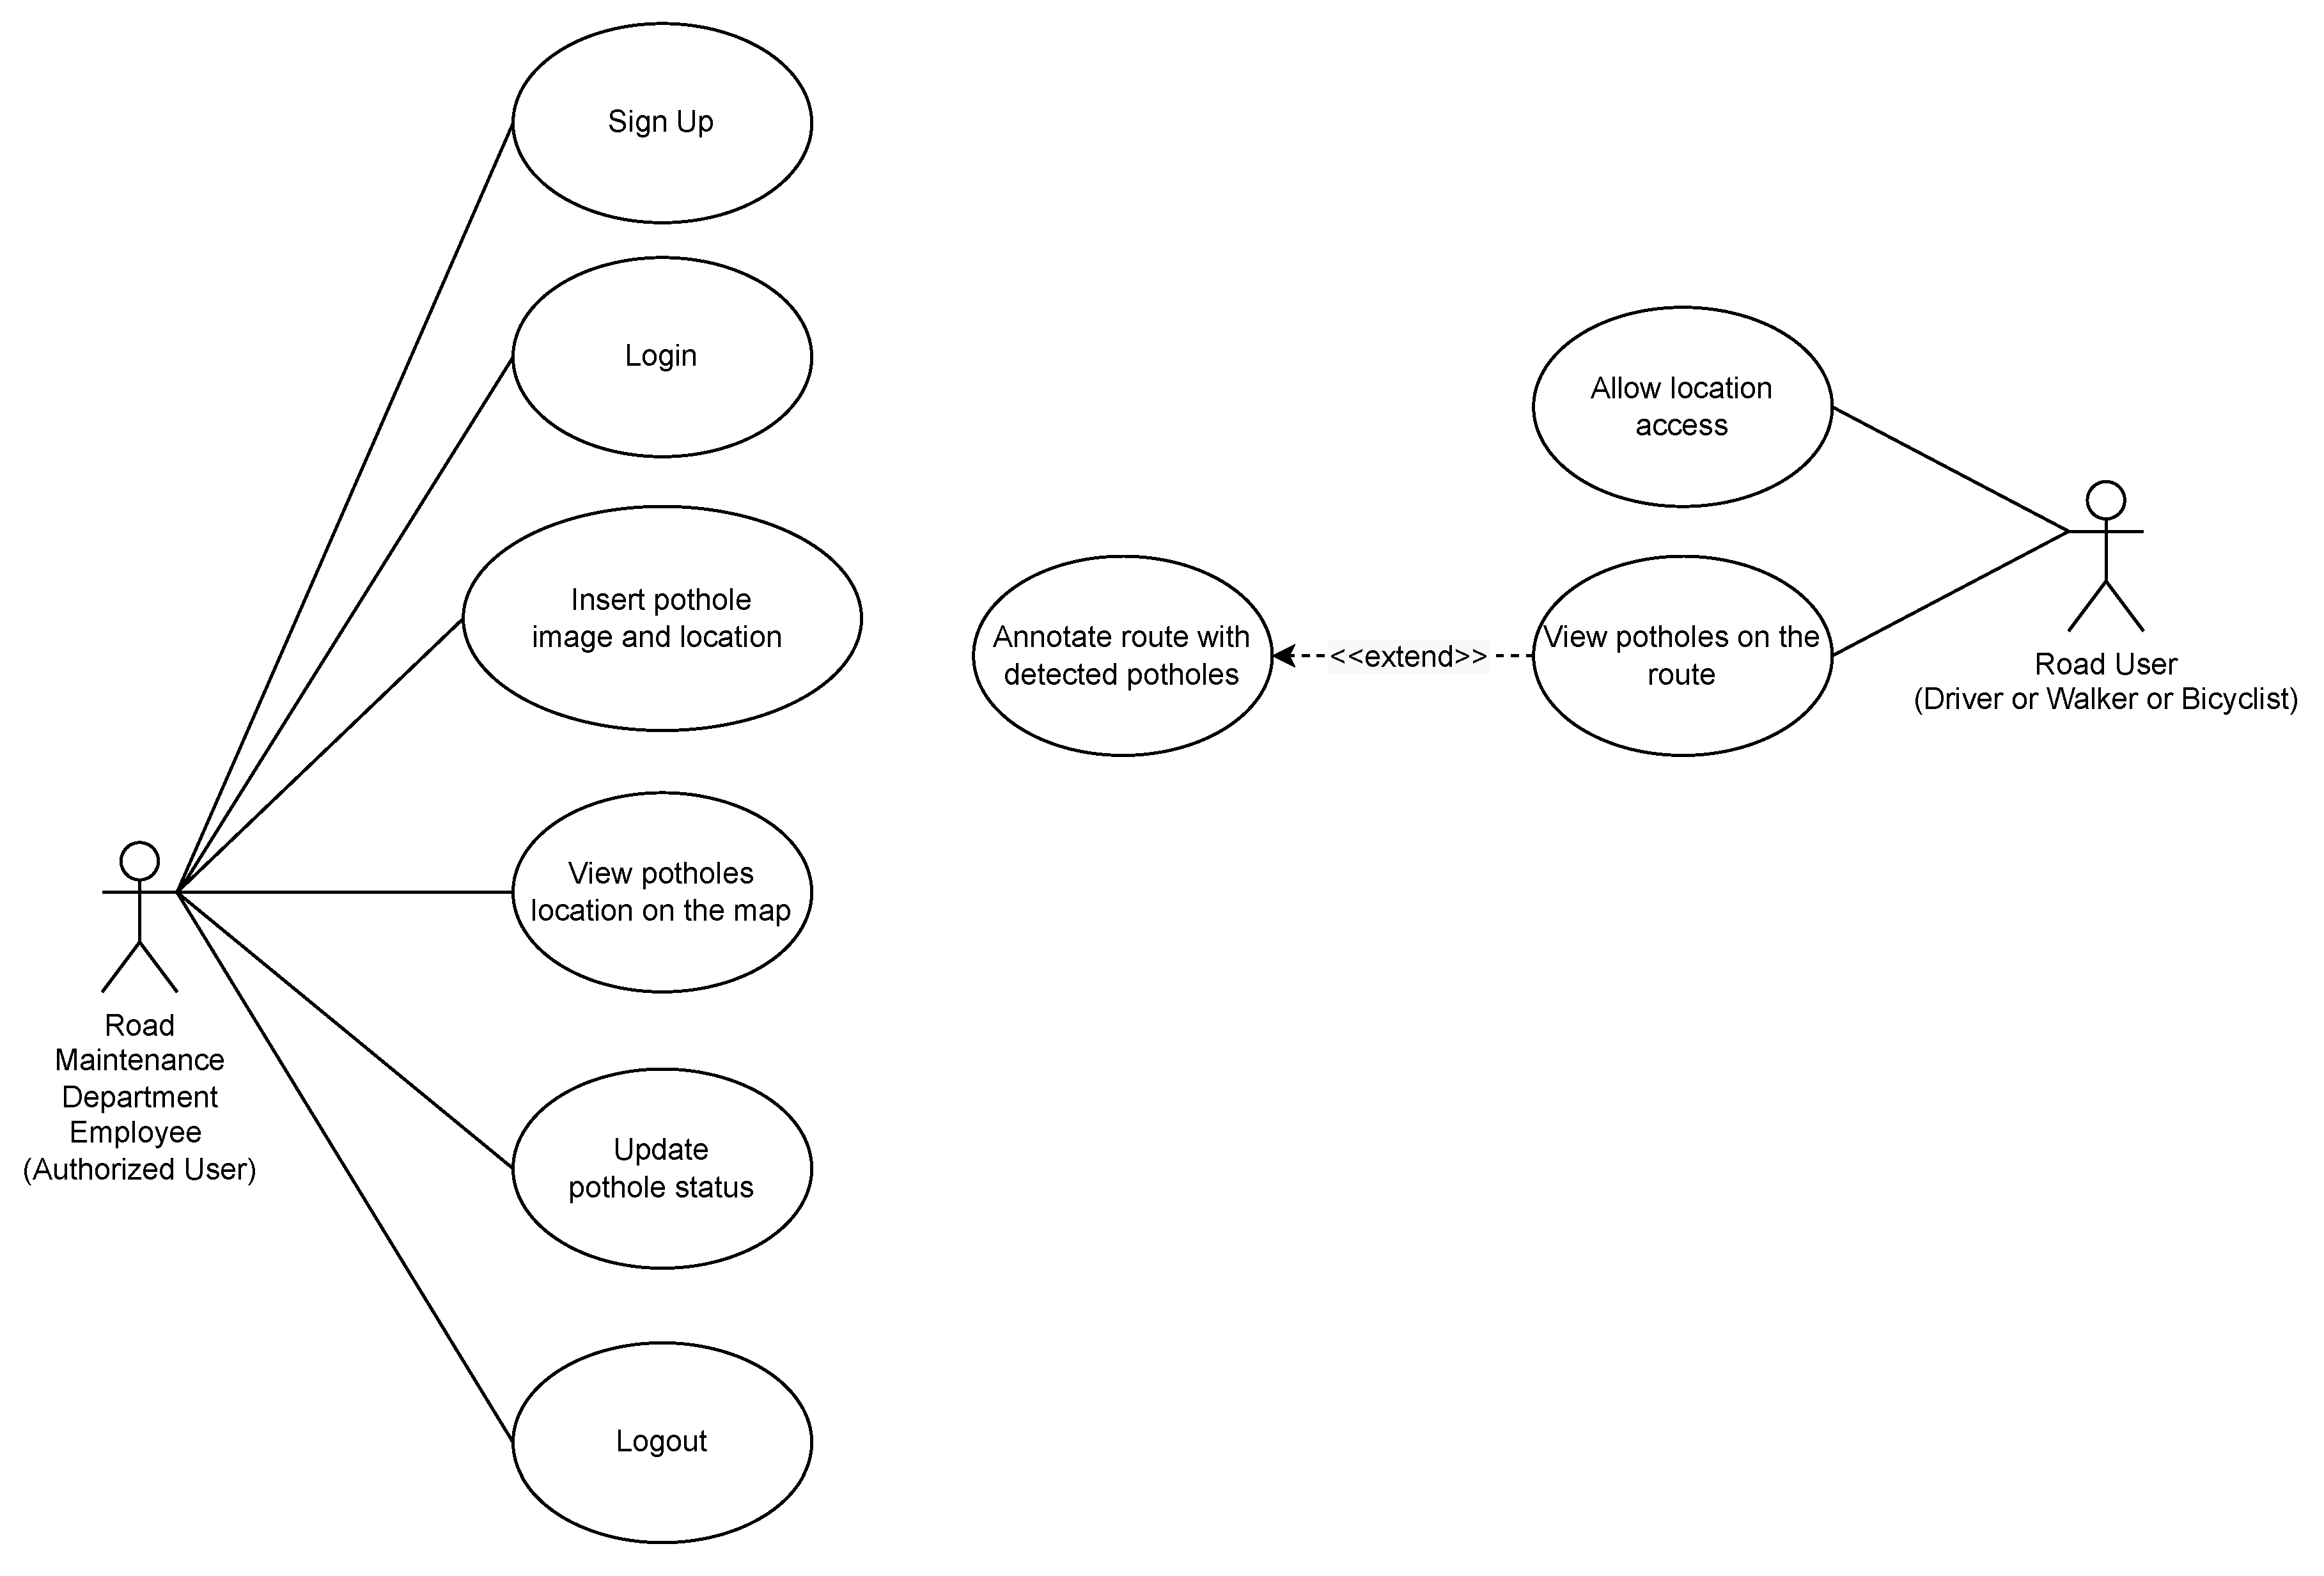
Figure 2 illustrates the use case diagram for the PDS-UAV system, highlighting the interactions between the system and its users. There are two primary user types: the RMEs at Jeddah municipality, and the RUs (driver, walker, or bicyclist). Each has different processes to run the entire PDS-UAV system. The RMEs sign up, log into the system, upload images and locations of potholes they encounter, view the locations of detected potholes on a map, update the status of potholes after maintenance, and log out of the system. The RUs allow the system to access their locations and view information about nearby potholes.
4.3.2. Activity Diagrams
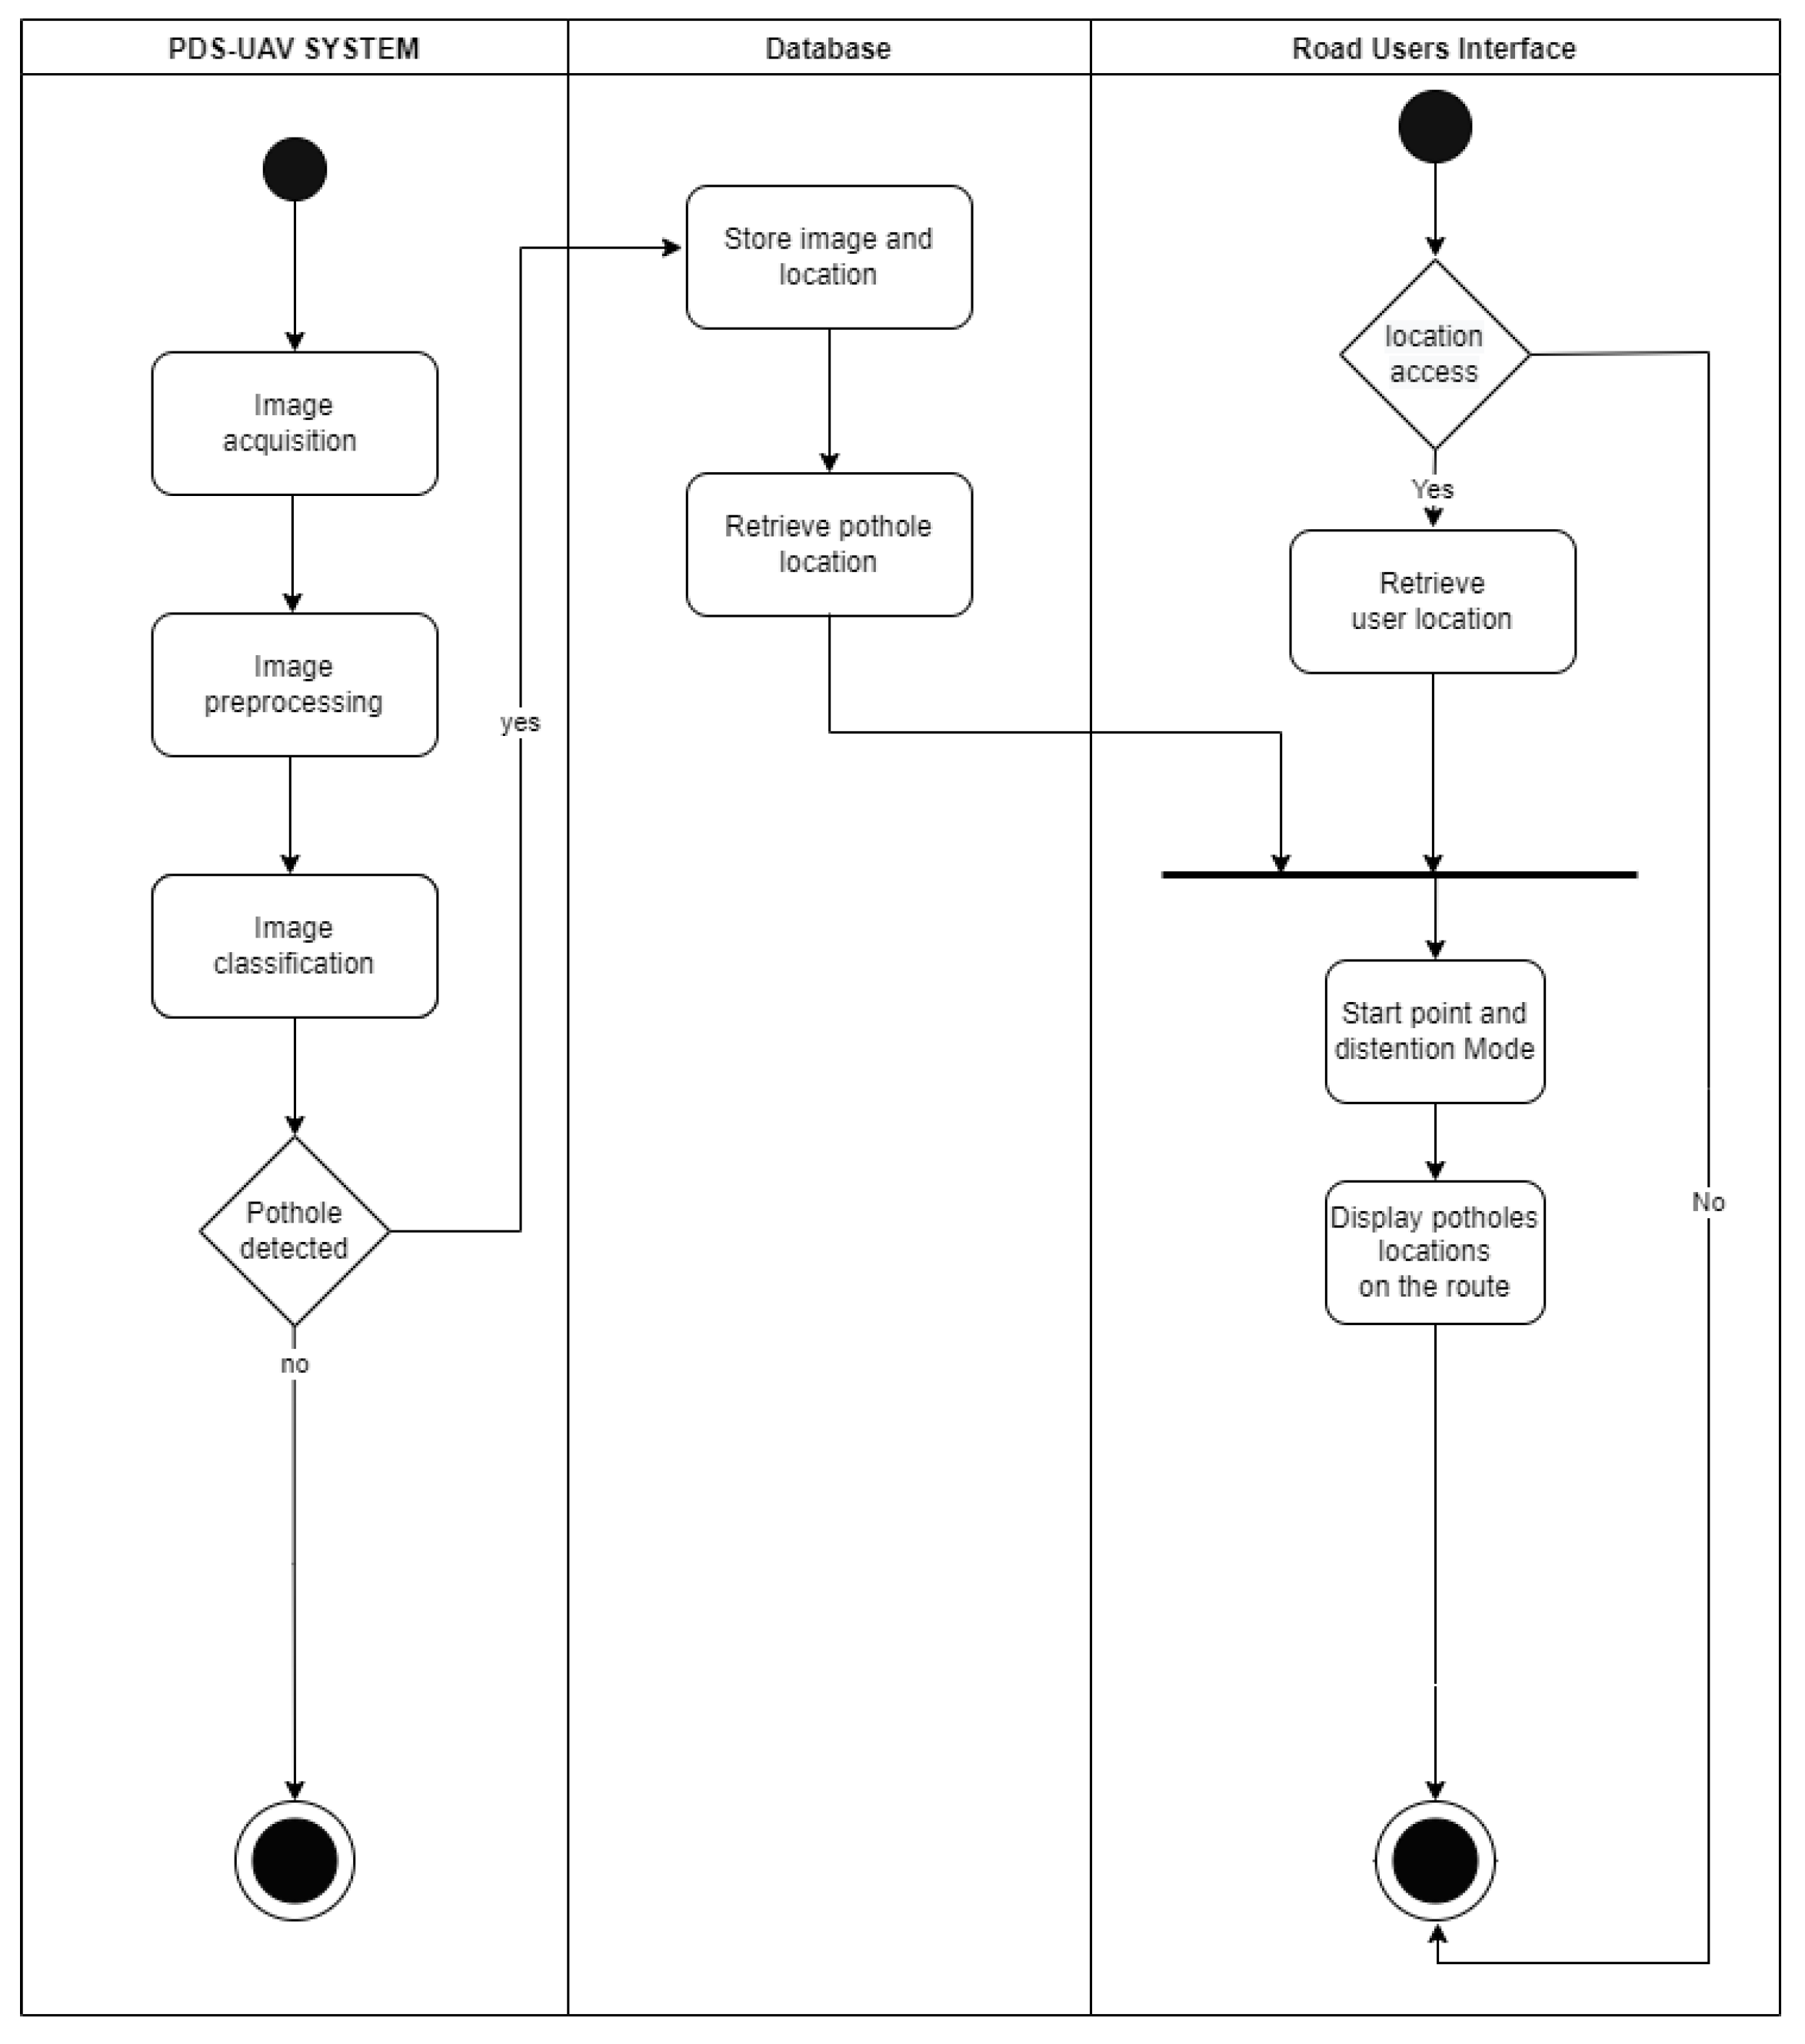
Figure 3 and
Figure 4 illustrate the activity diagrams of the system. In
Figure 3, the system starts by acquiring images to determine whether they include potholes. Next, image preprocessing techniques are applied to ensure compatibility with the deep learning model. Then, the classification phase begins. If an image is classified as a pothole, it is stored in the database. Otherwise, it is discarded. In the RME’s interface, authorized users log in and can perform various functions within the application. These functions include viewing potholes on the map and updating pothole statuses, which range from ‘Waiting for repair’ to ‘Under progress’ to ‘Repaired’. Unauthorized users cannot access the application. Finally, when users log out, the system session ends.
In
Figure 4, the user is asked to allow location access. If the user allows location access, the pothole locations are retrieved from the database. The RUs enter their starting and destination points. The system then displays a map showing the users’ route annotated with all the detected potholes.
4.3.3. Sequence Diagrams
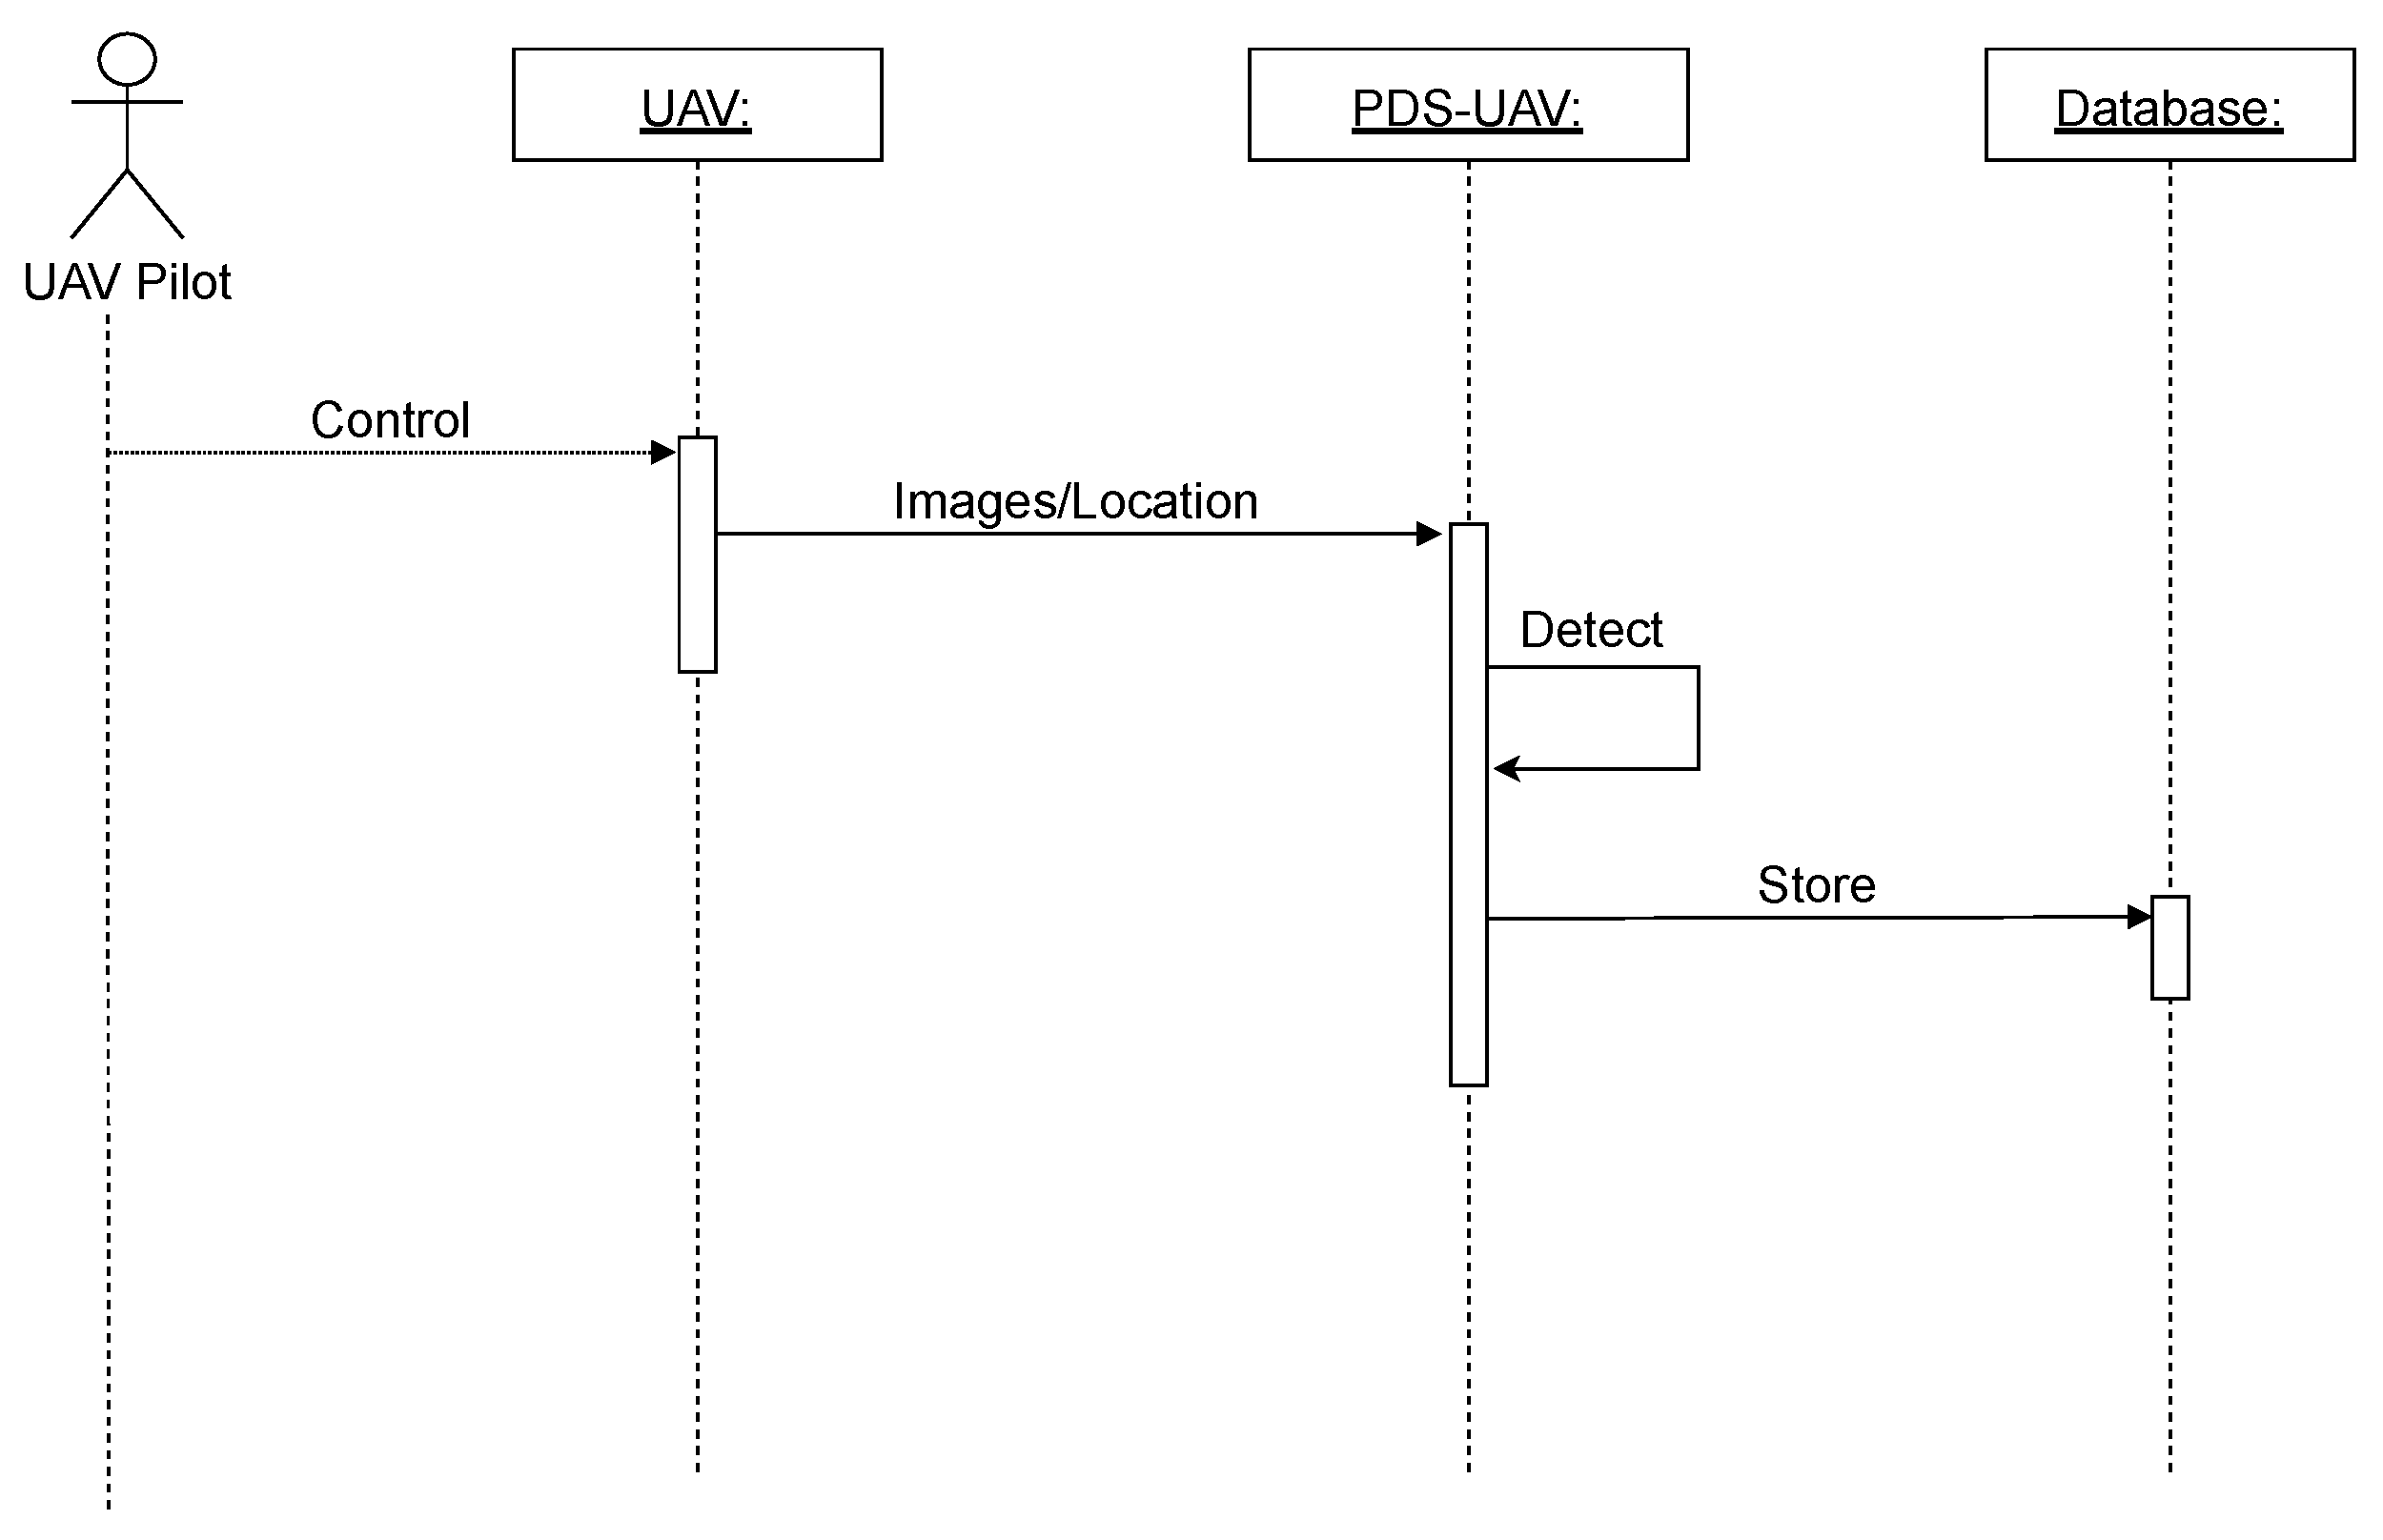
Figure 5 illustrates the sequence diagram of the PDS-UAV system. The UAV pilot is an RME, who controls the UAV flight and uploads images of the road surface to the system to detect potholes from these images. If a pothole is detected, its information, including the image and location, is stored in the database.
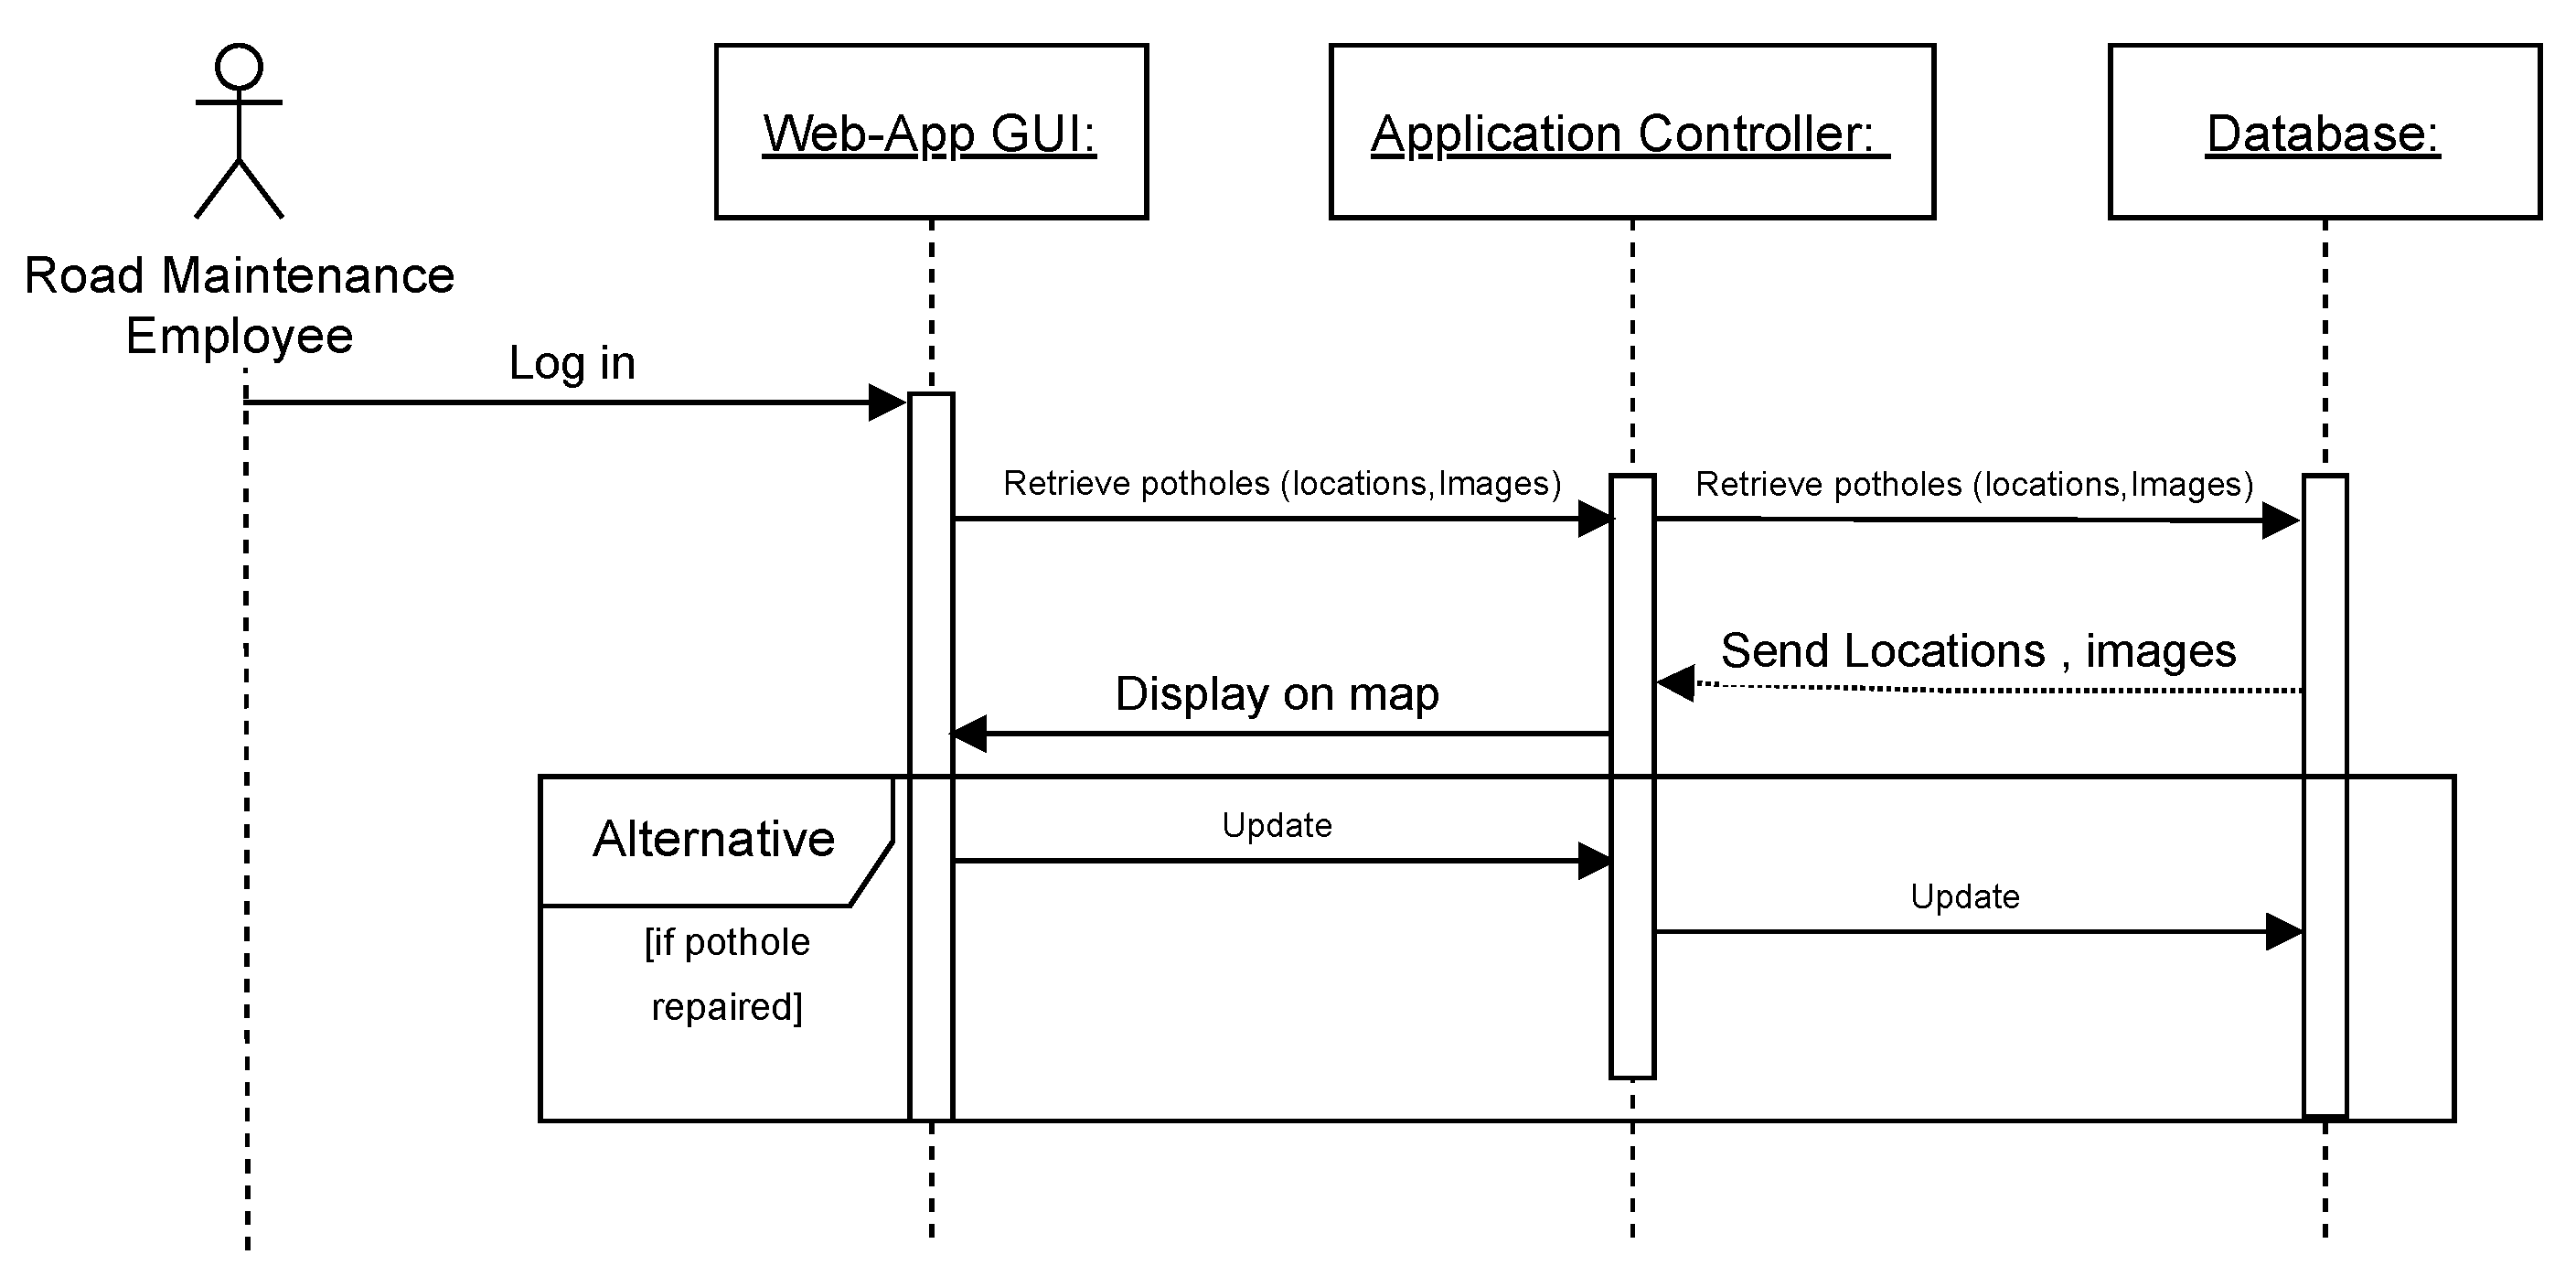
The RMEs log in and retrieve pothole information from the database, which can be viewed on the map or in the list view. In addition, they update the pothole statuses based on their repairs. The application controller enables the communication between the web app GUI and the database, as seen in
Figure 6.
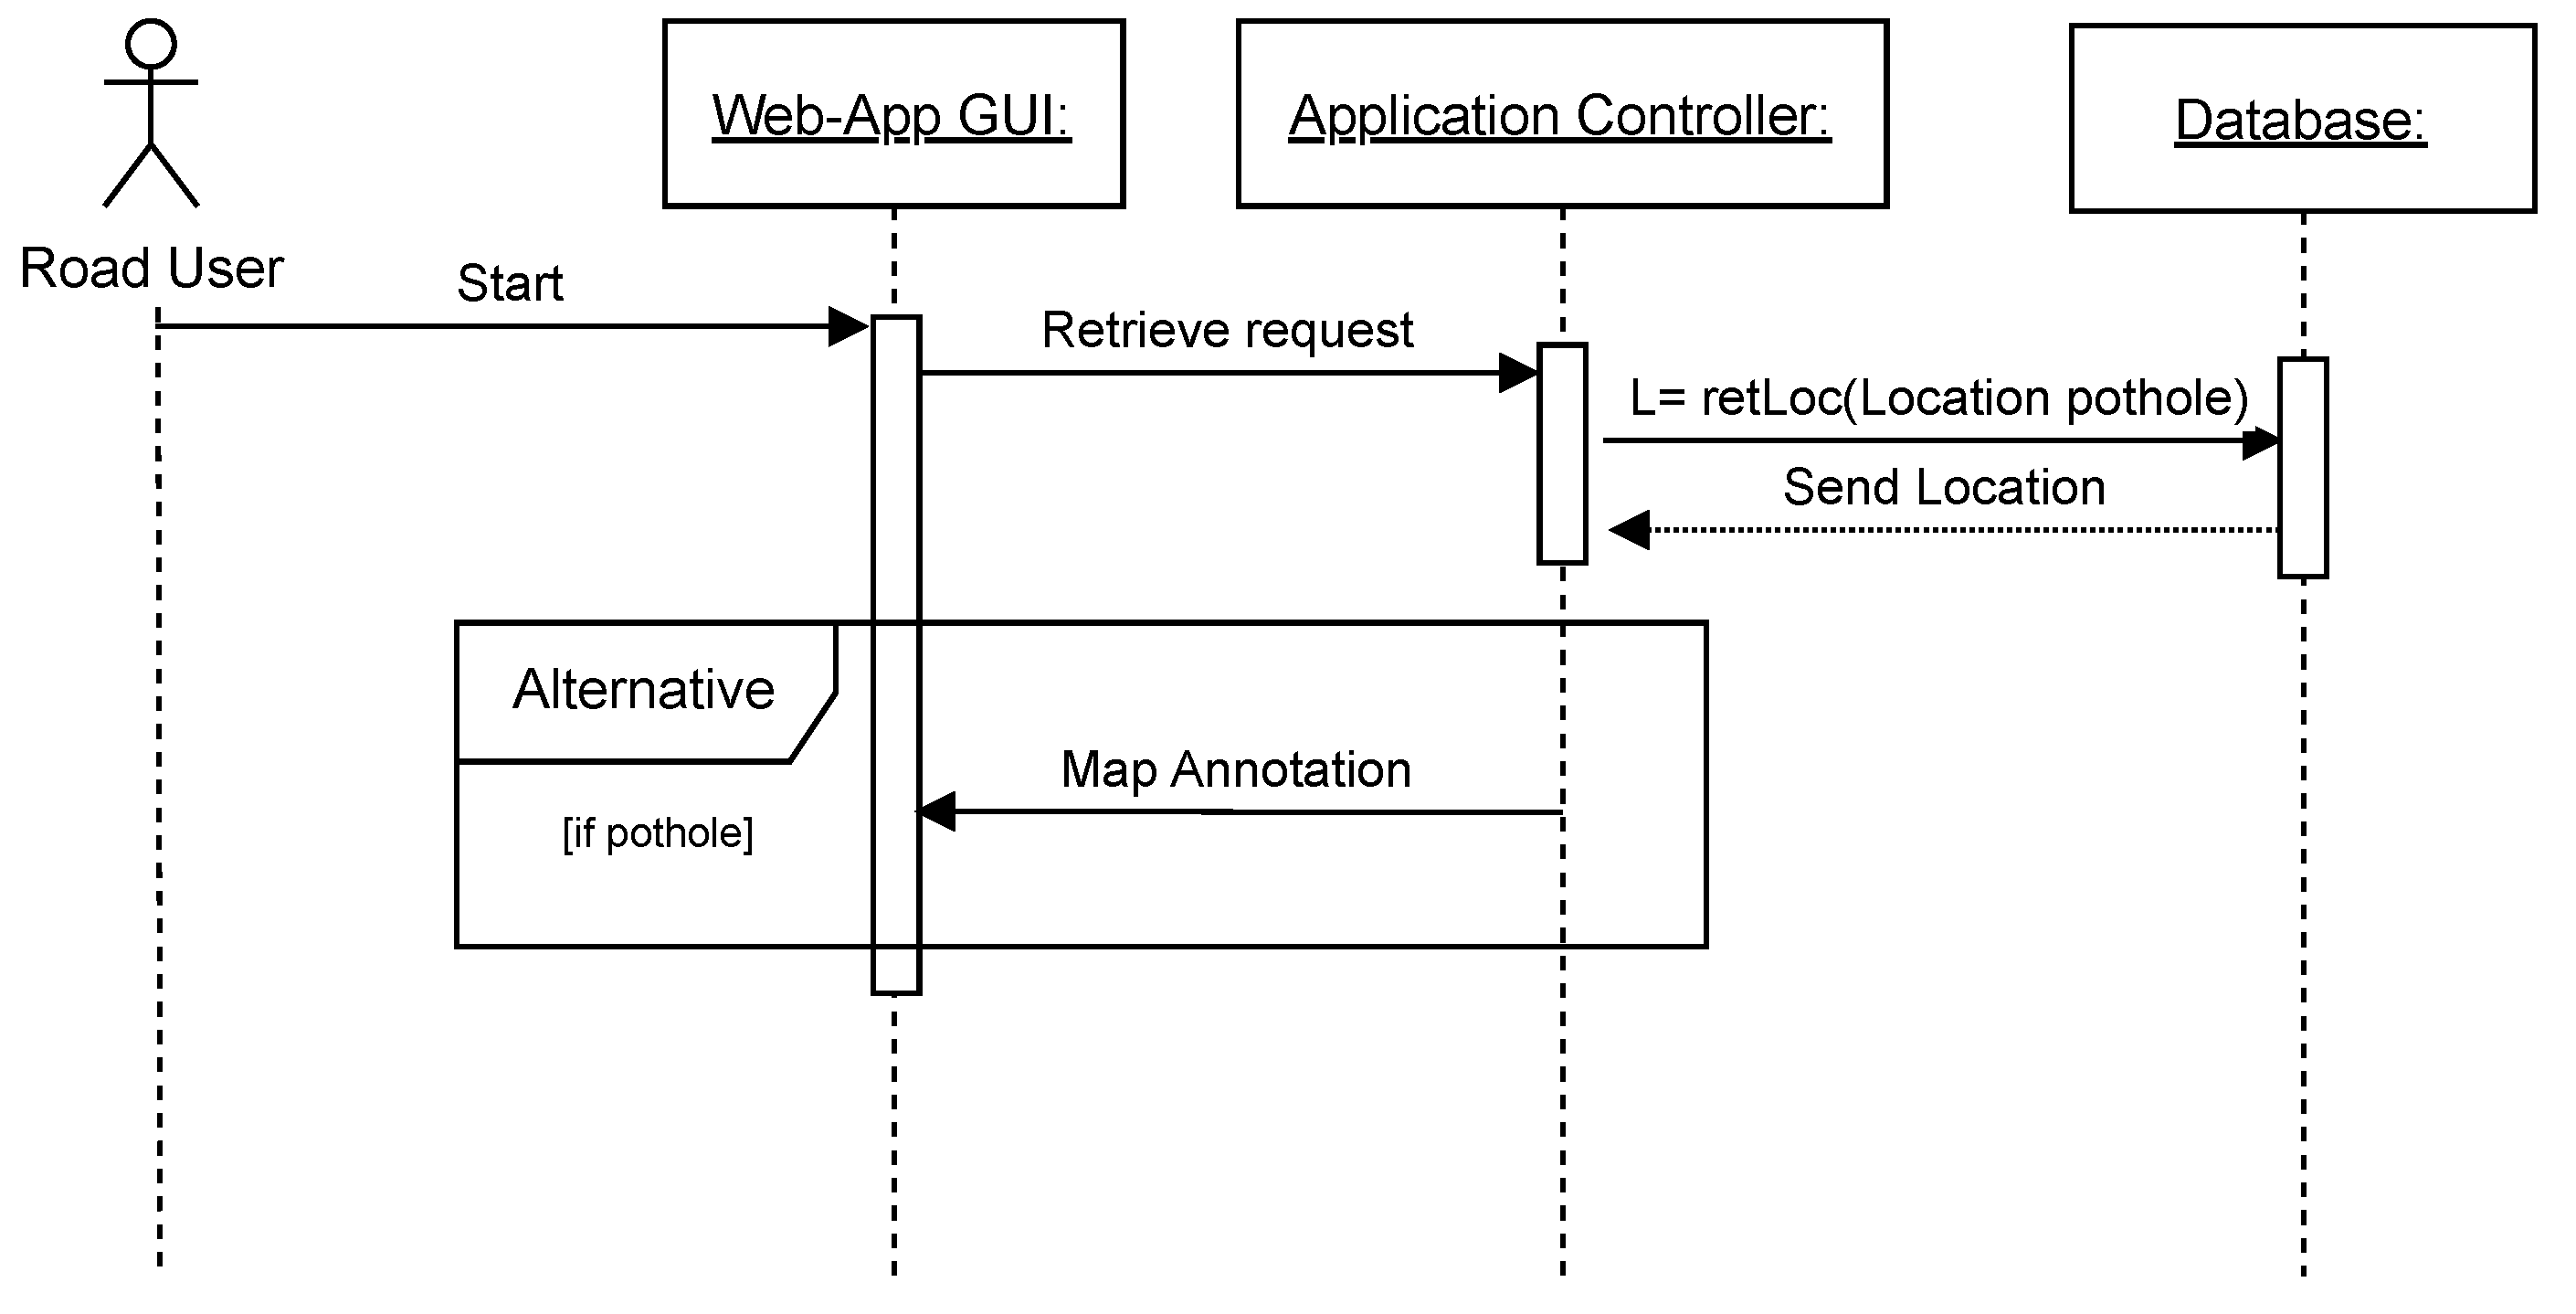
Figure 7 illustrates the sequence diagram for the RUs. The user begins by being asked to allow their location and entering the starting and destination points. If the user allows location access, the pothole locations are retrieved from the database. After retrieving the pothole locations, the system informs the user about detected potholes by annotating the map with the potholes’ locations.
4.4. PDS-UAV System Implementation
The development of the system required various technologies for both the front end and back end of the application. HTML and CSS are the main languages used for developing the front end of the web application. HTML is used for designing and structuring pages, while CSS is used for the styling and formatting. Additionally, Bootstrap is used as an add-on that provides easy-to-use templates to simplify styling and design. JavaScript (ES6) is employed for specific commands, such as inserting an interactive map on the interface. Finally, Python v3.9 and Flask v2.1 tools and libraries are used to build the web framework and link it with the deep learning model. These technologies have been used within Visual Studio Code, an application for coding and developing interfaces. In addition, Firebase is used as a back-end service that helps to gain access to the shared data and store the data in JSON documents. Firestore is utilized as a flexible NoSQL database within the cloud-based Firebase platform.
The welcome page shown in
Figure 8 appears when the users enter the website. On this page, multiple options are displayed for the user to choose from. The user can view the system’s goals, sign up as RME, or use the system services as a road user.
4.4.1. RMEs Web Application
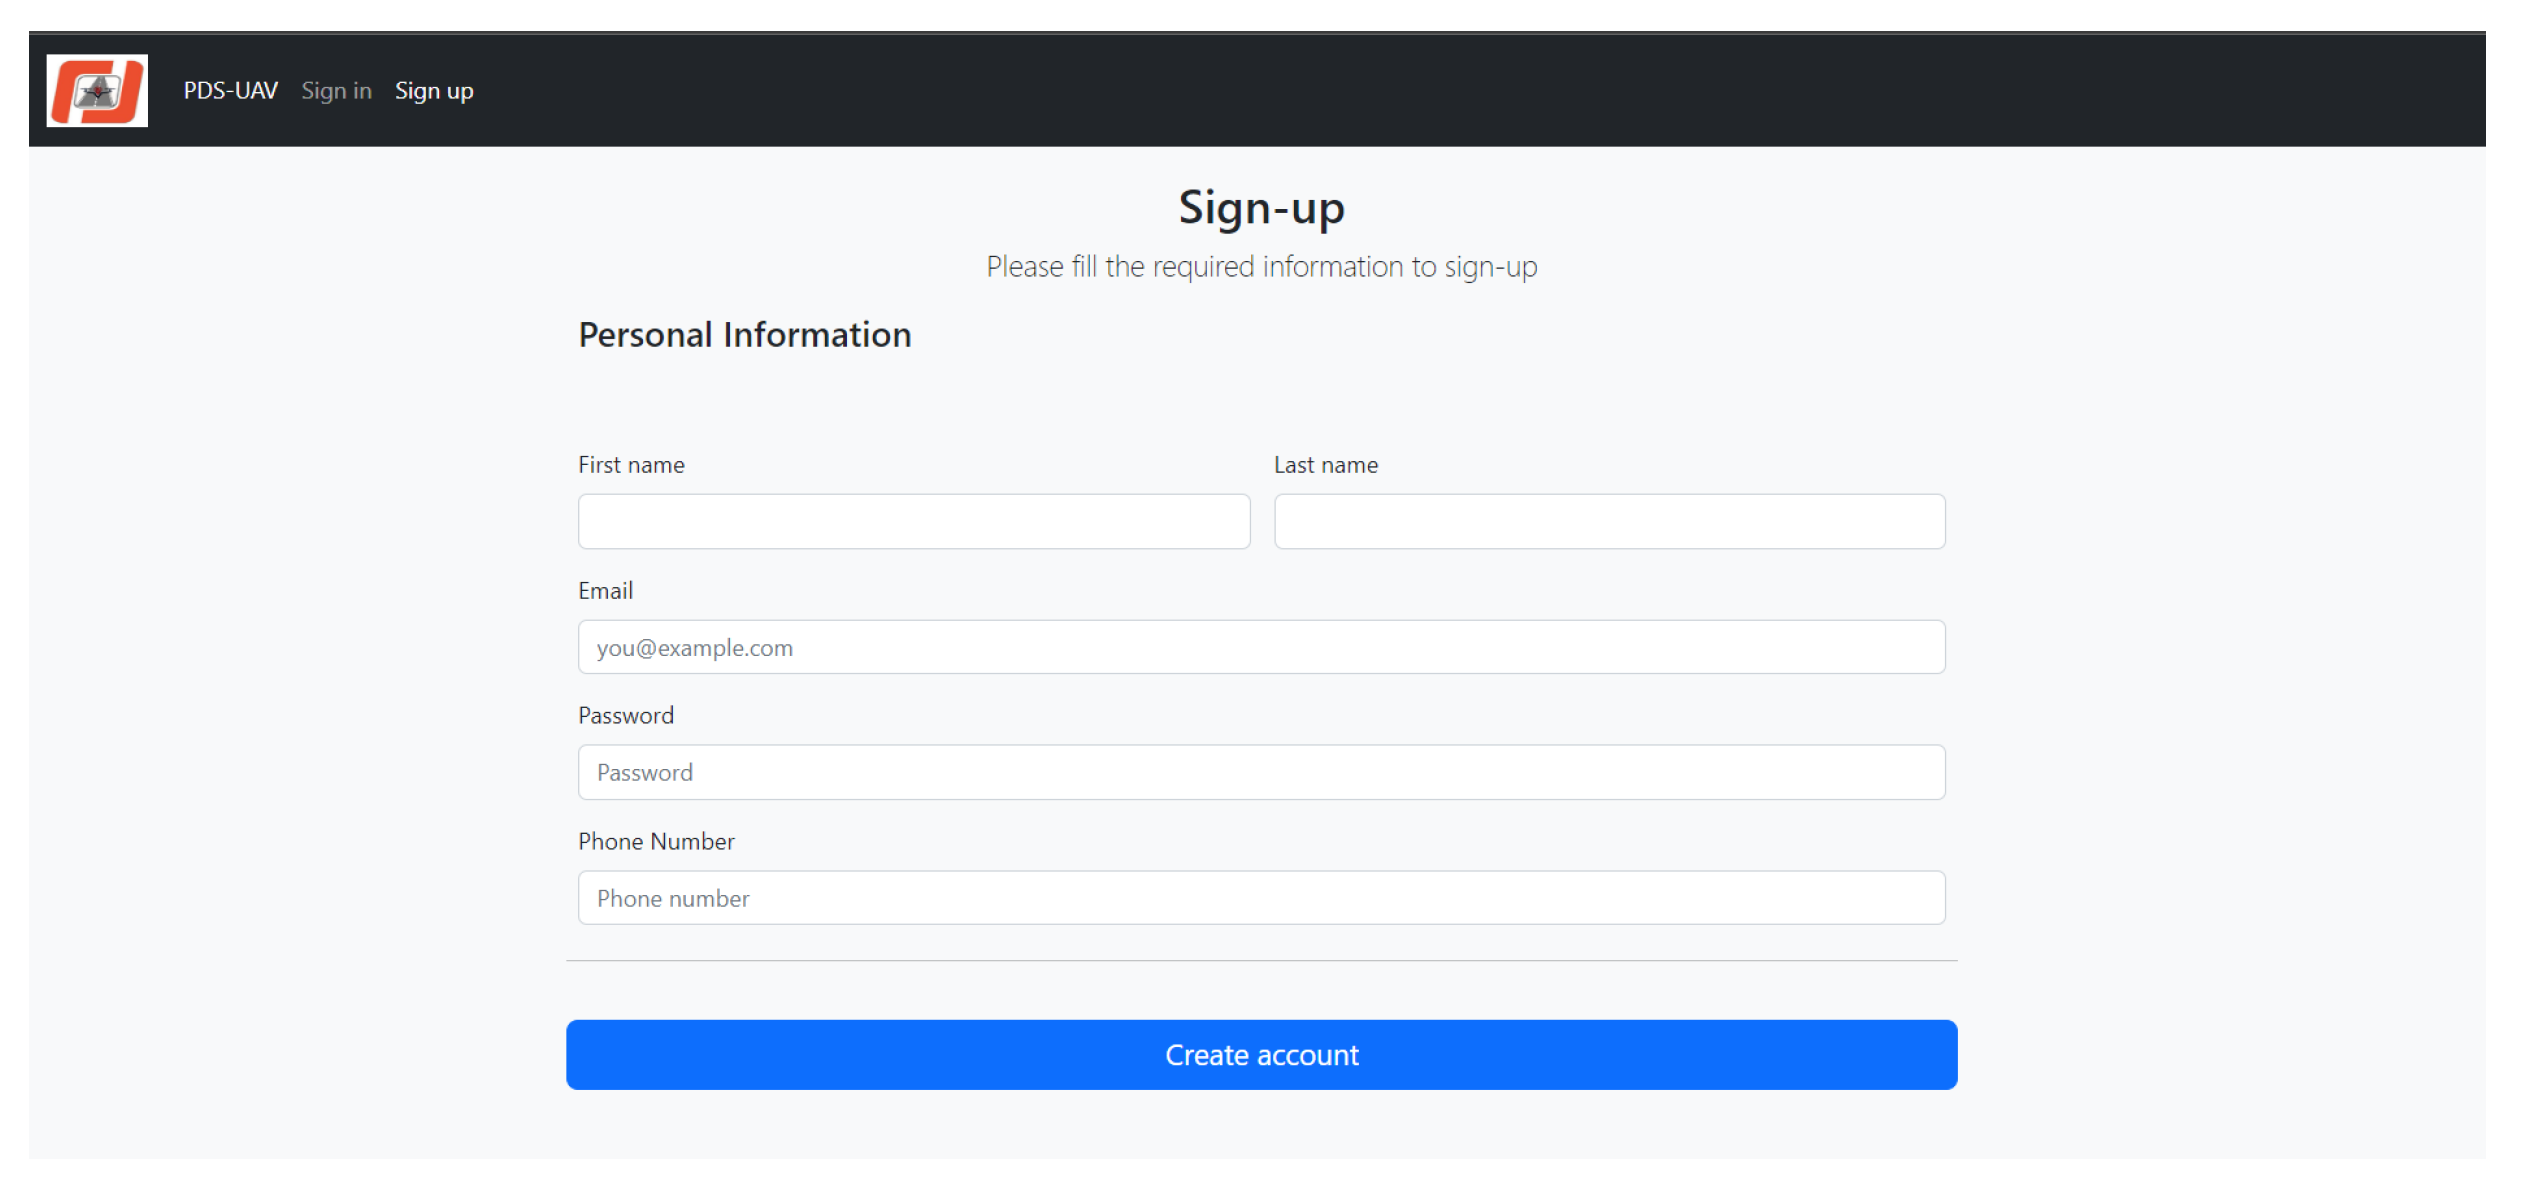
The web application is composed of the following components: sign up, sign-in, add a new pothole, and update. The sign up functionality, shown in
Figure 9, allows RMEs to create a new account by filling out the required information. Validation of the user input is crucial to ensure that the entered data are correct and complete and meet the required format, thereby preventing errors and improving the overall user experience. Validation is implemented on both the client side and server side of the application. Client-side validation, performed using JavaScript, provides immediate feedback to the user and includes checks for required fields and correct data types. Server-side validation is performed on the server to confirm the data’s validity before saving it to the database. This dual-layer validation approach at the client and server sides helps maintain data integrity and enhances the reliability of the system.
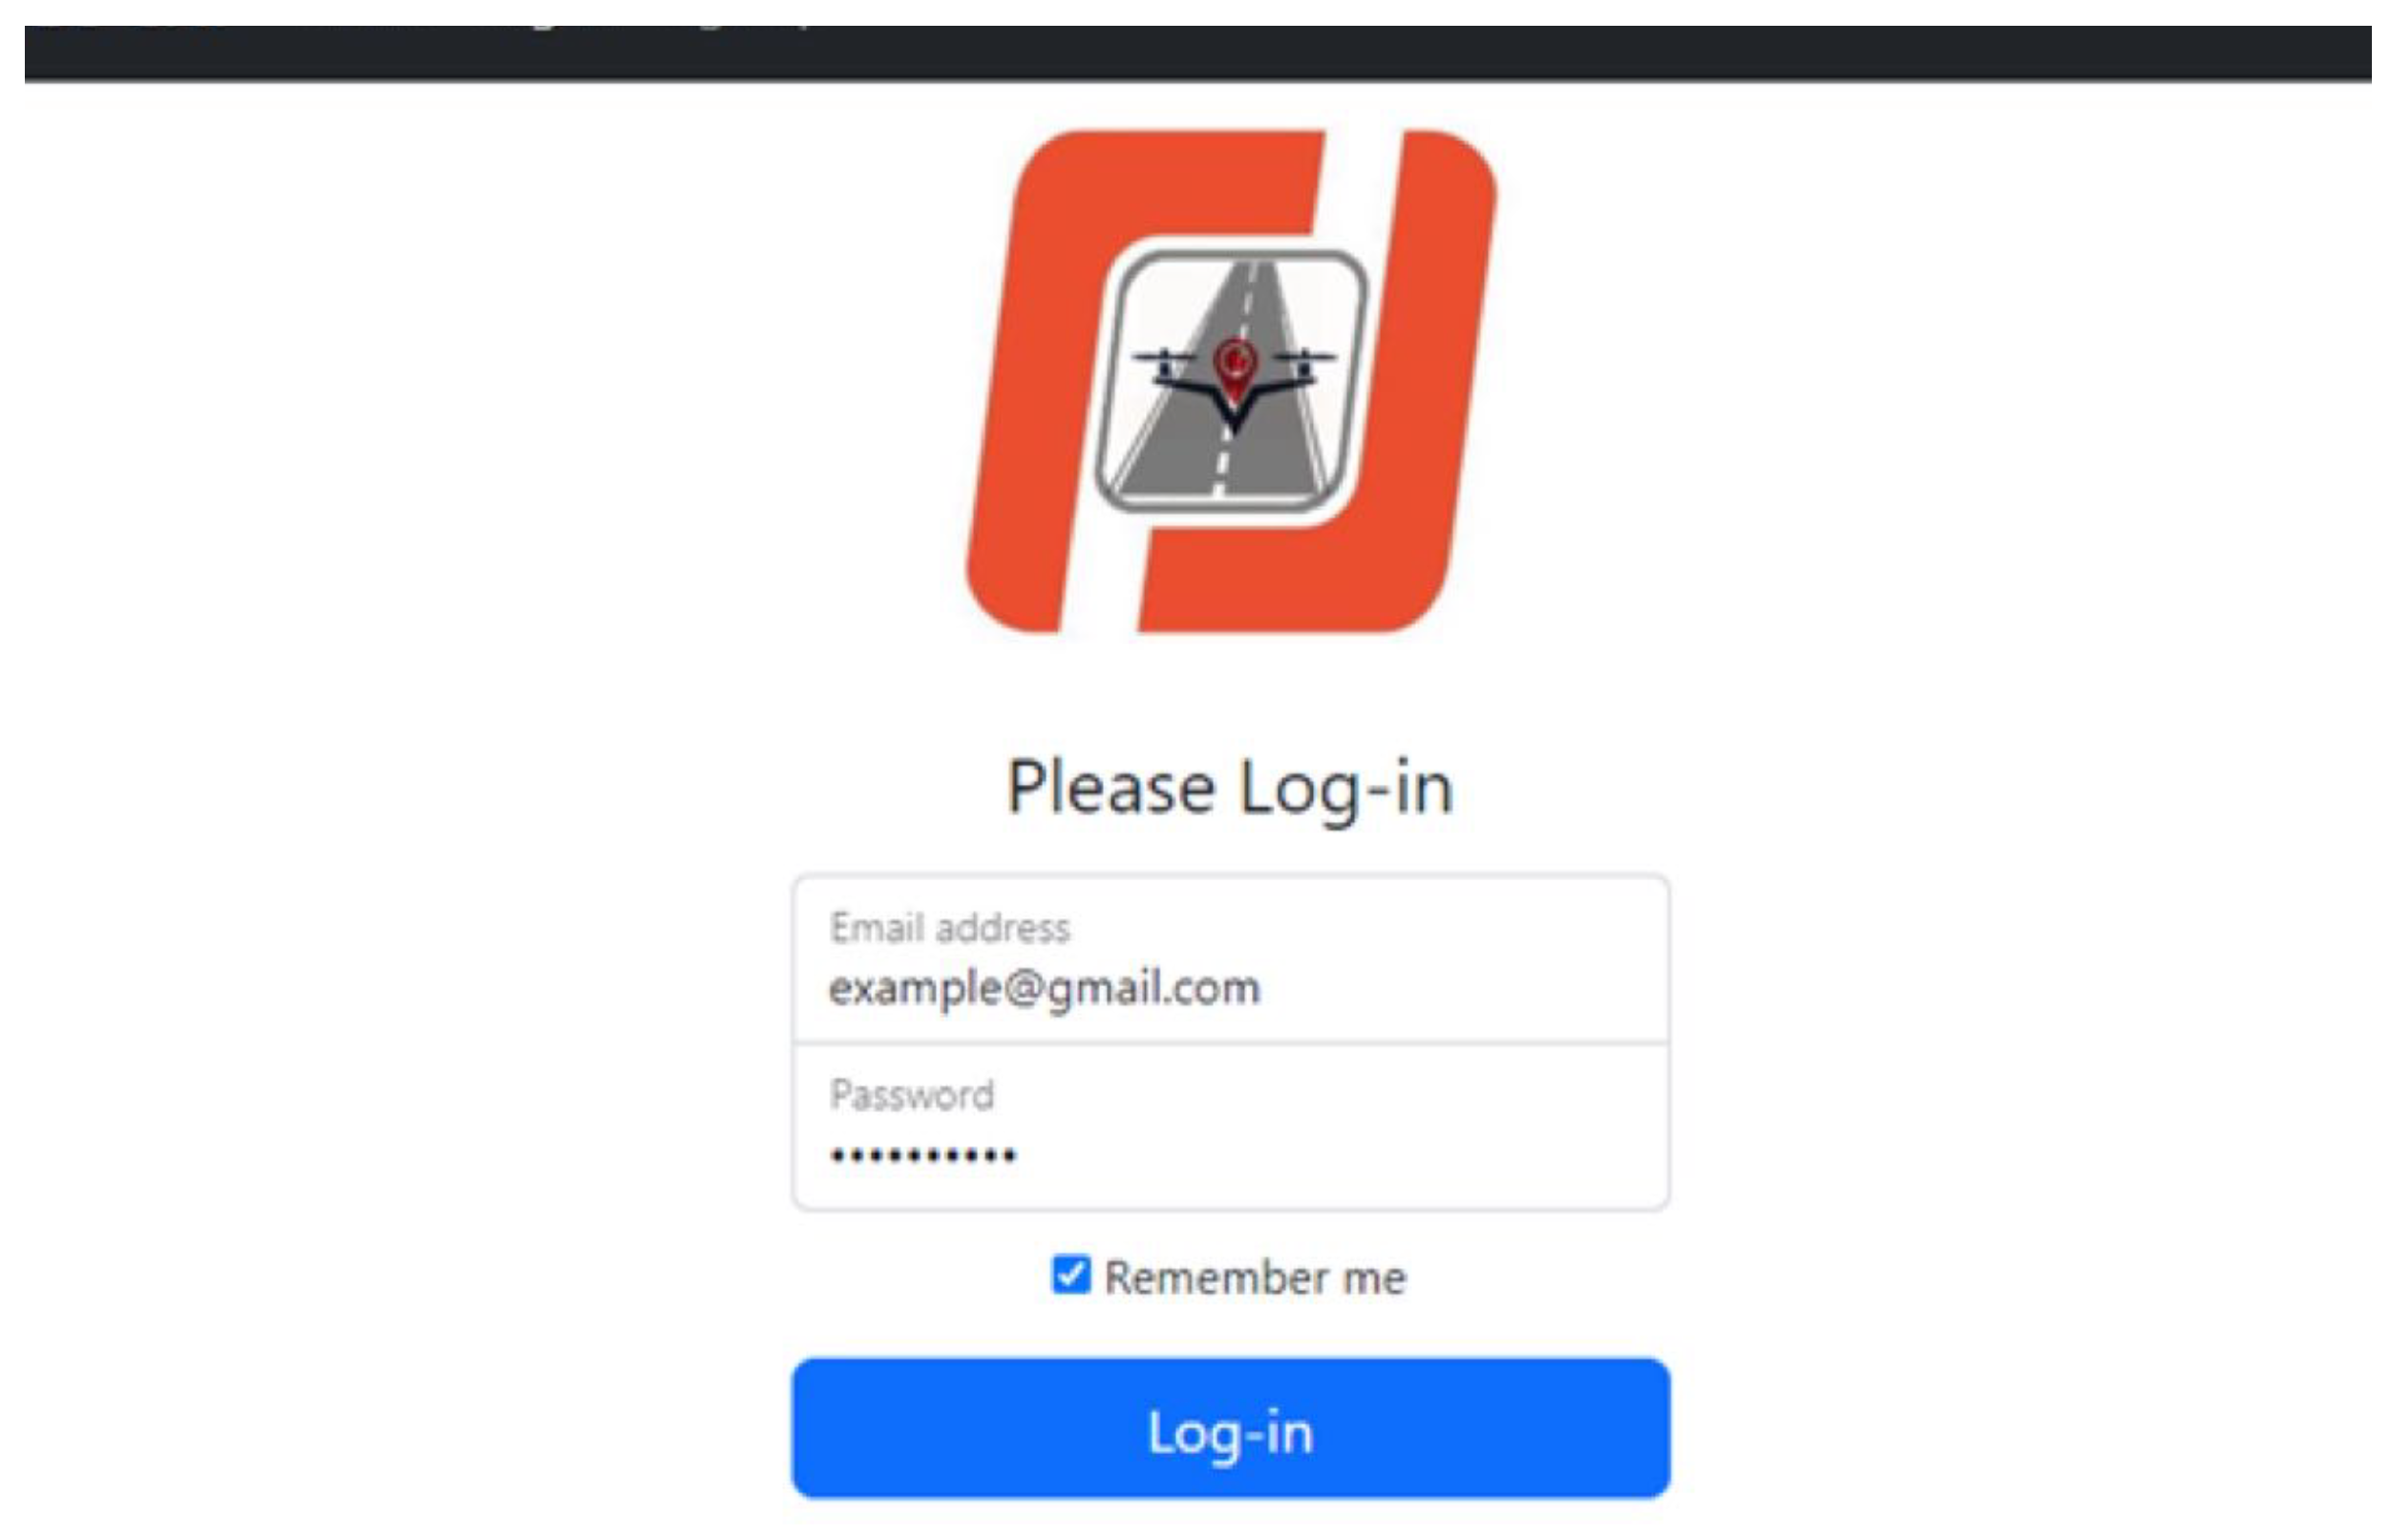
On the sign-in page, shown in
Figure 10, the RMEs enter their already registered e-mails and passwords to gain access to their accounts and use the application’s services, which include adding new potholes information and updating the status of stored potholes. If the entered email and password match a registered user in Firestore, the user is authenticated and granted access to the application. Otherwise, the user is denied from accessing the system.
Figure 11 shows the main home page of the RUs web application. The upper part shown in
Figure 11a includes statistics about the detected potholes, categorizing them into those that are waiting for repair, in-progress, or already repaired. Additionally, it features a map displaying the locations of detected potholes. This map is implemented using the Google Maps application programming interface (API), which is integrated into the system. To embed a Google map on the website, a JavaScript is used to interact with the Google Maps API. The API provides the necessary functions and methods to display the map, add markers, handle user interactions, and customize the map’s appearance and behavior. In addition, CSS is used to style the map container and ensure it fits correctly within the website’s layout. Potholes’ coordinates are retrieved from Firestore and represented using markers on the map. Users can update pothole information by clicking on each marker. This interactive functionality enable users to easily manage and monitor pothole statuses directly from the home page.
The lower part of the home page, shown in
Figure 11b, presents an HTML table, displaying the information about potholes currently stored in the Firestore database. This table helps present pothole information in a structured and organized manner, facilitating easy access and updates by the RMEs. The table includes details such as the pothole’s location, status, and relevant notes, allowing RMEs to efficiently manage and monitor the progress of pothole repairs. JavaScript is used to retrieve the potholes’ information from Firestore and create a table dynamically based on the retrieved data. This combined view of the map and table ensures that users have a comprehensive overview of the potholes and their statuses, enhancing the functionality and user experience of the home page.
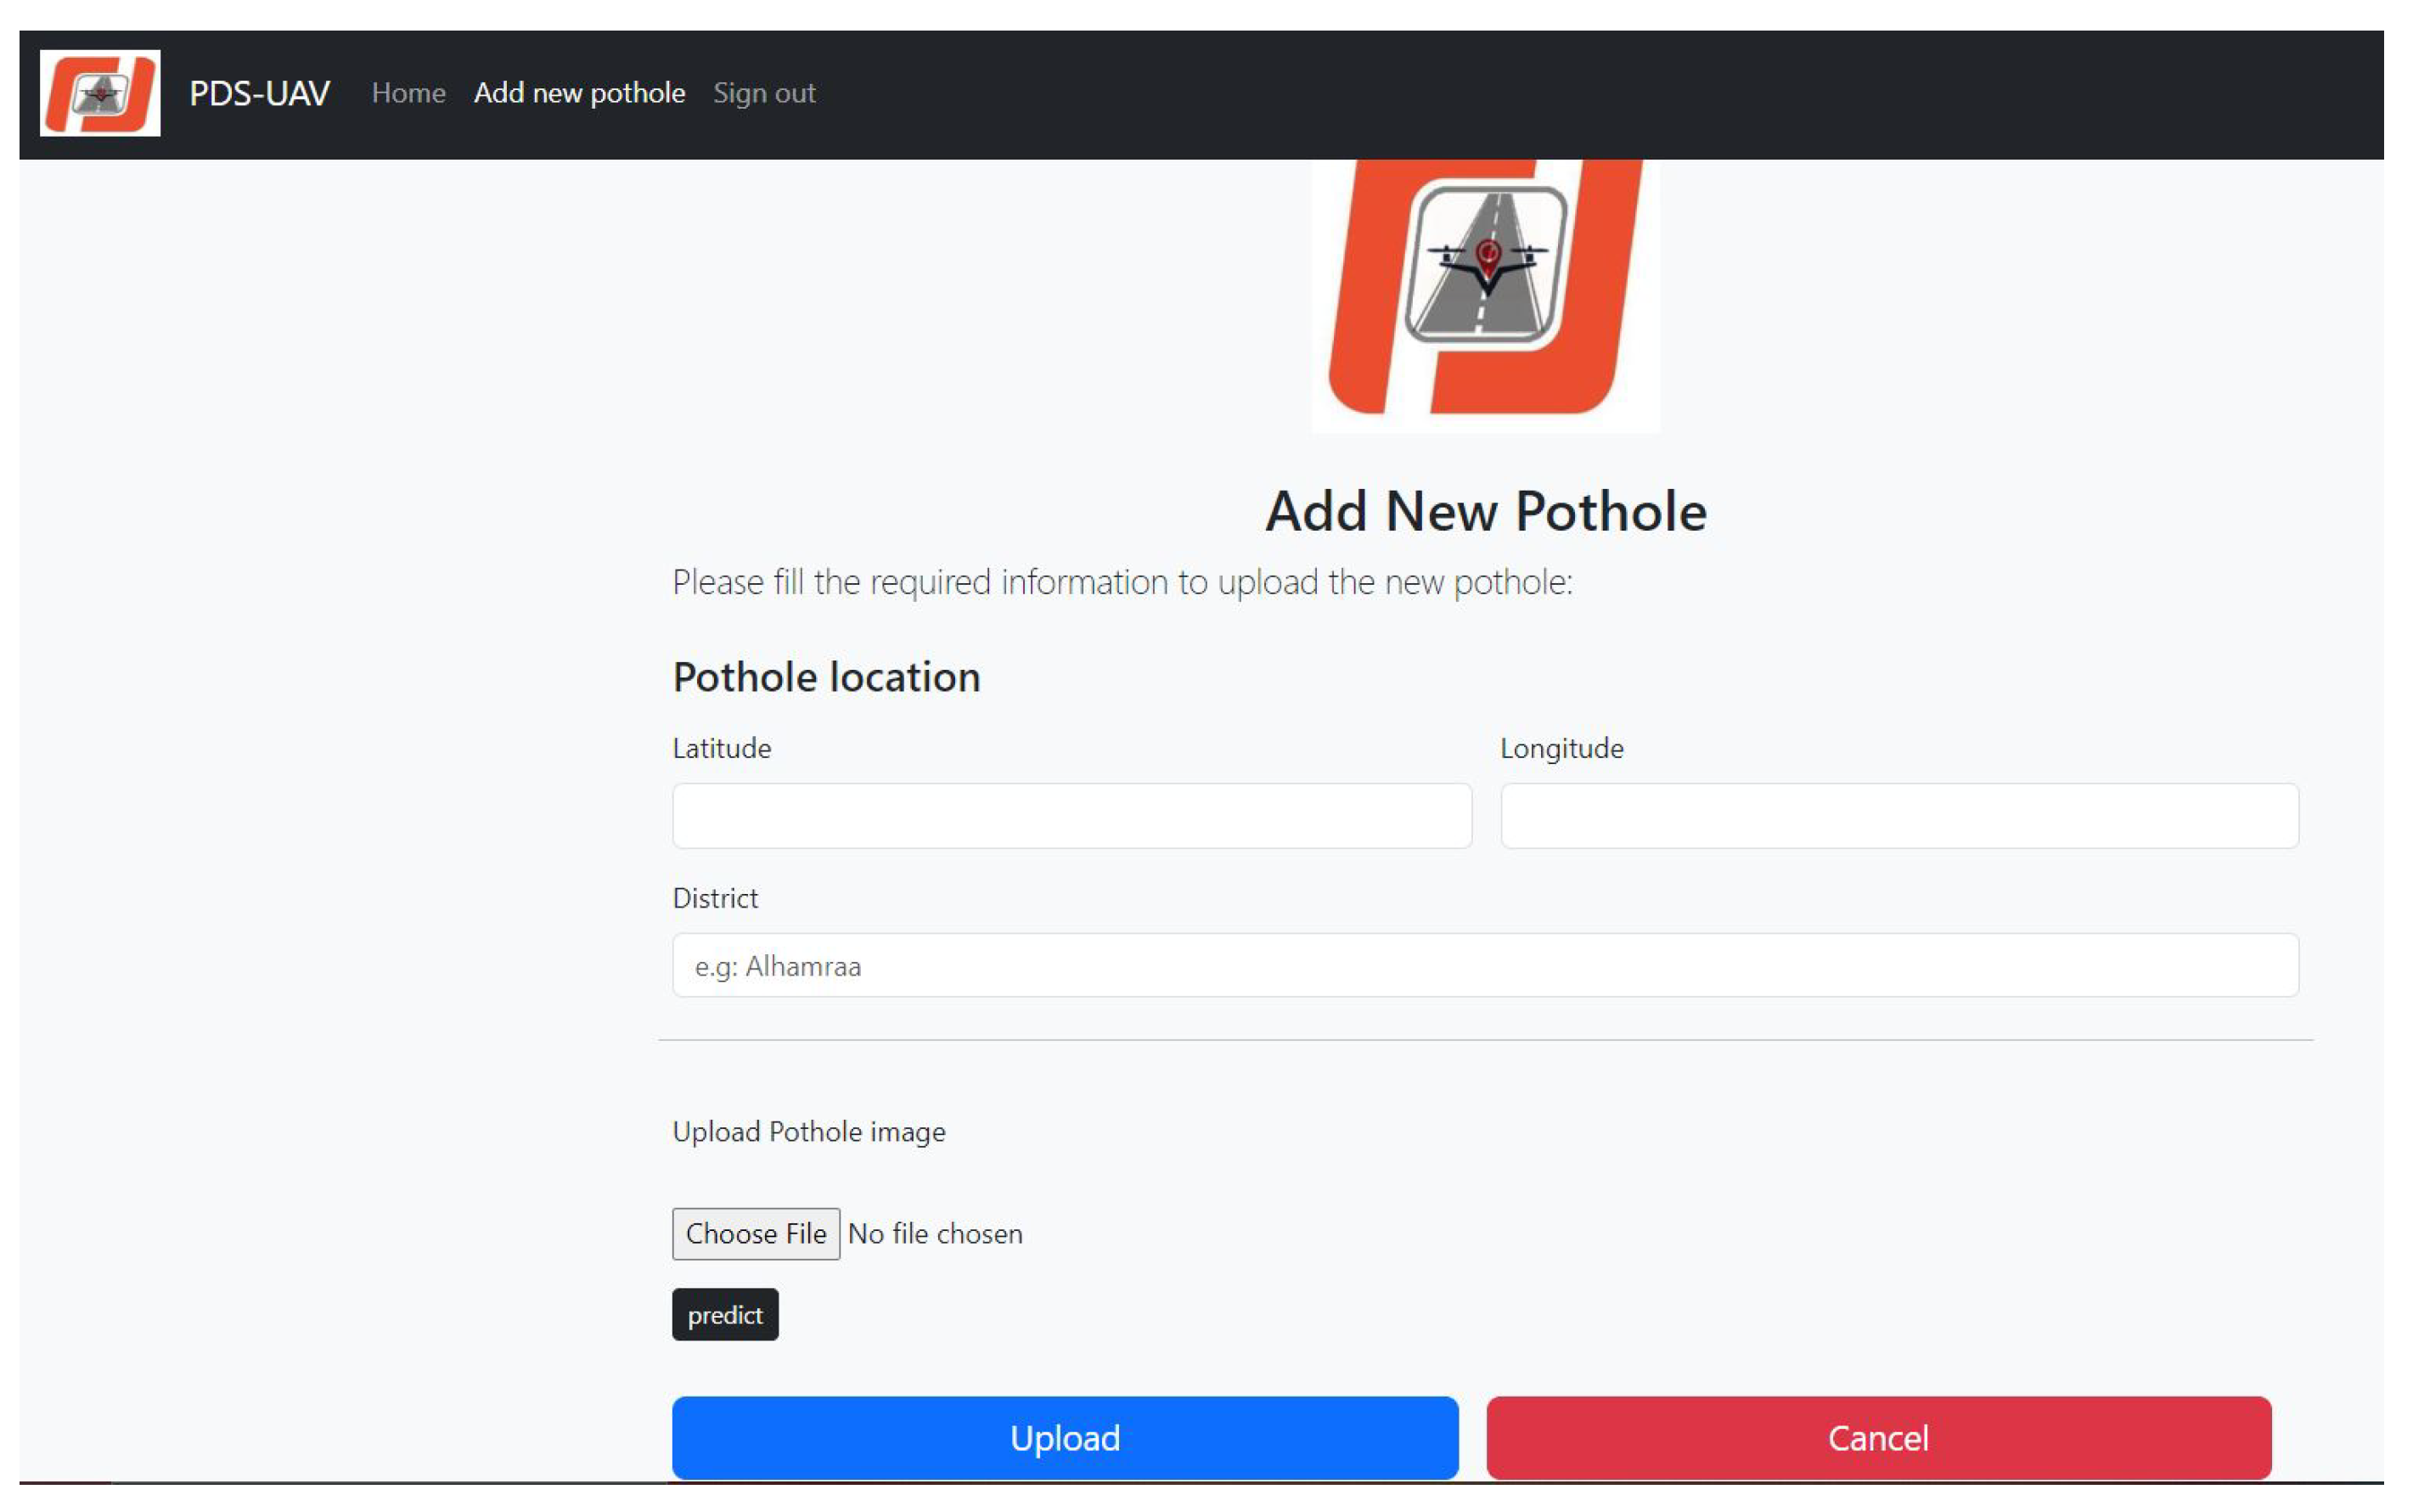
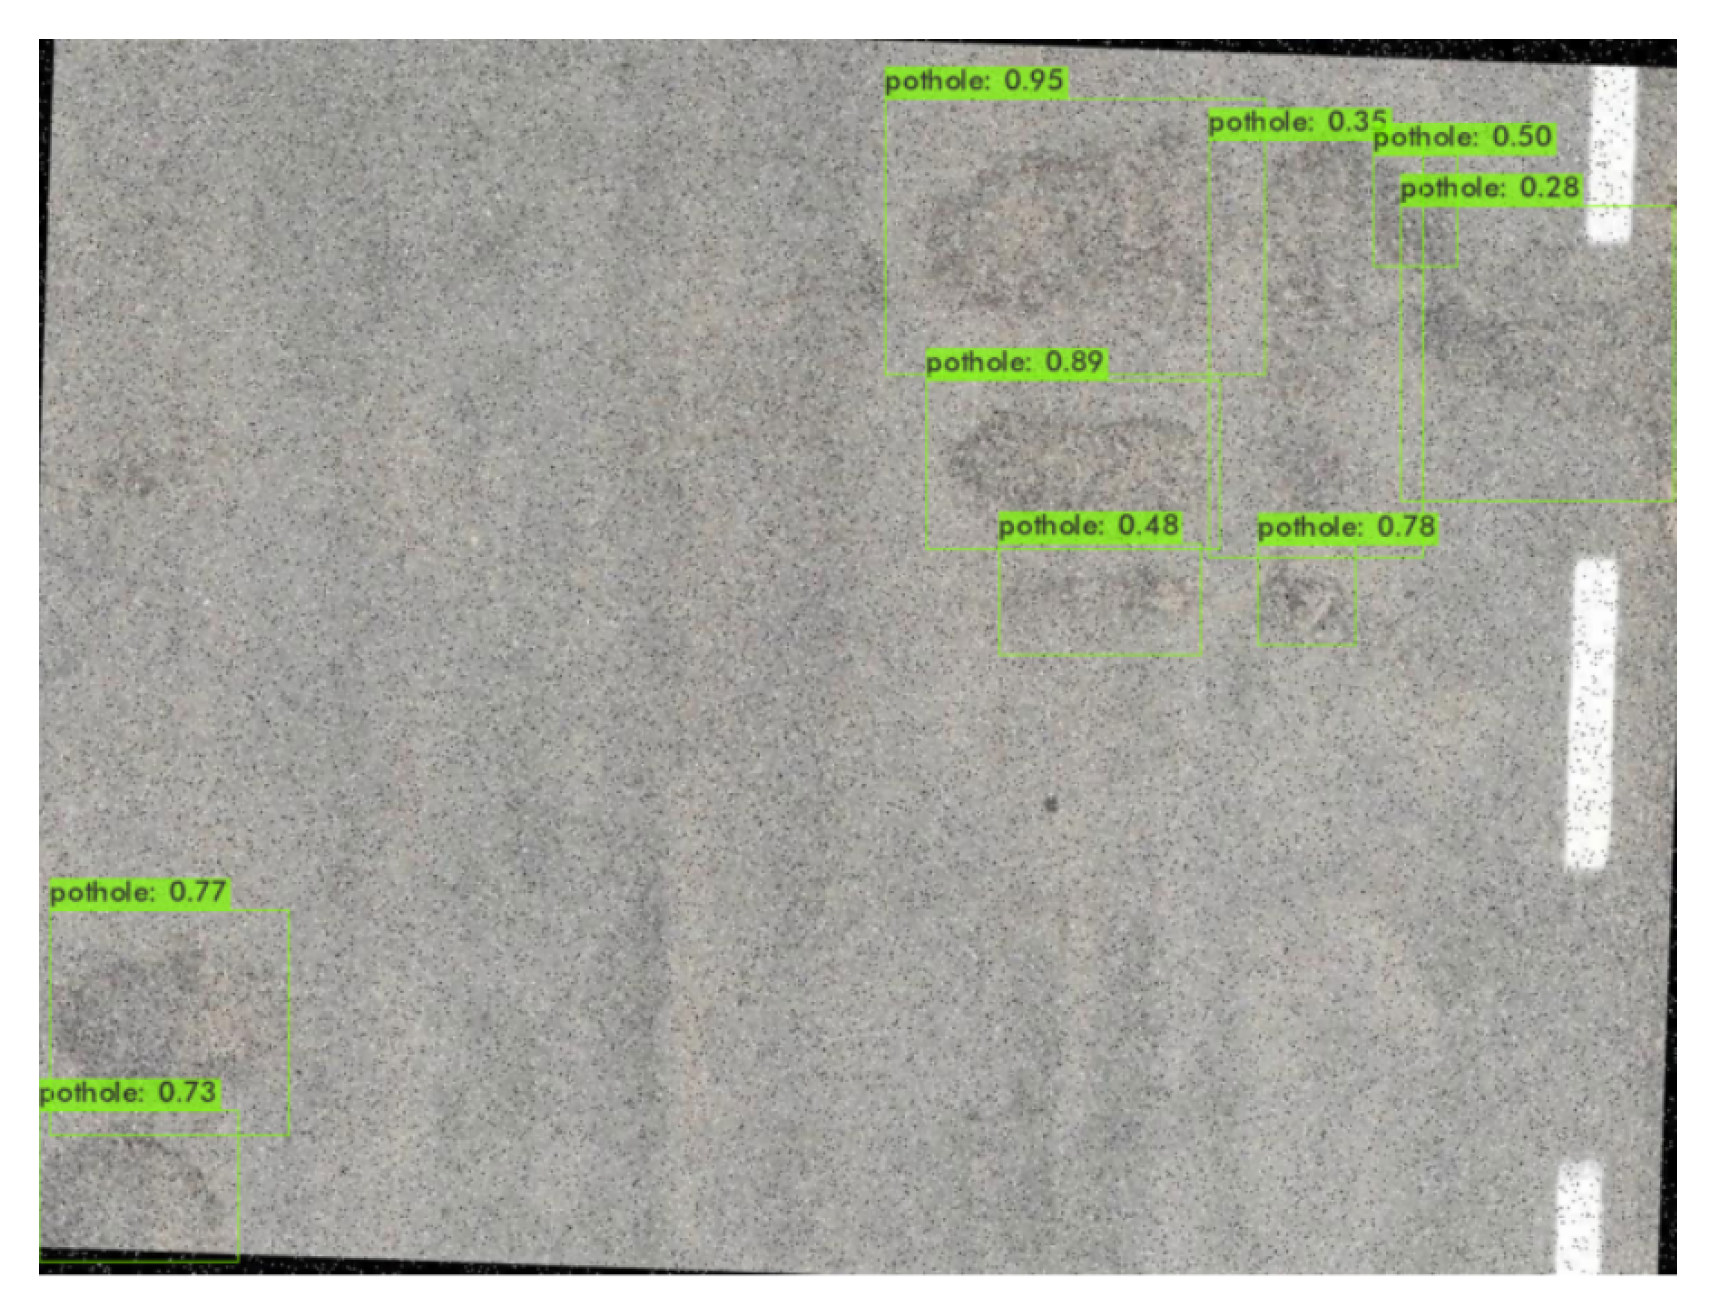
Figure 12 shows the interface for adding new pothole information. RMEs add new pothole information by entering the coordinates and district and uploading an image. When the user enters the pothole information and presses the predict button to classify the image using the deep learning model, the classified image will appear as shown in
Figure 13, with the pothole location marked on that image. The detected pothole information is stored in the database for further retrieval and processing. These potholes are then displayed on the map using markers and are presented in the potholes table for easy access and management.
In
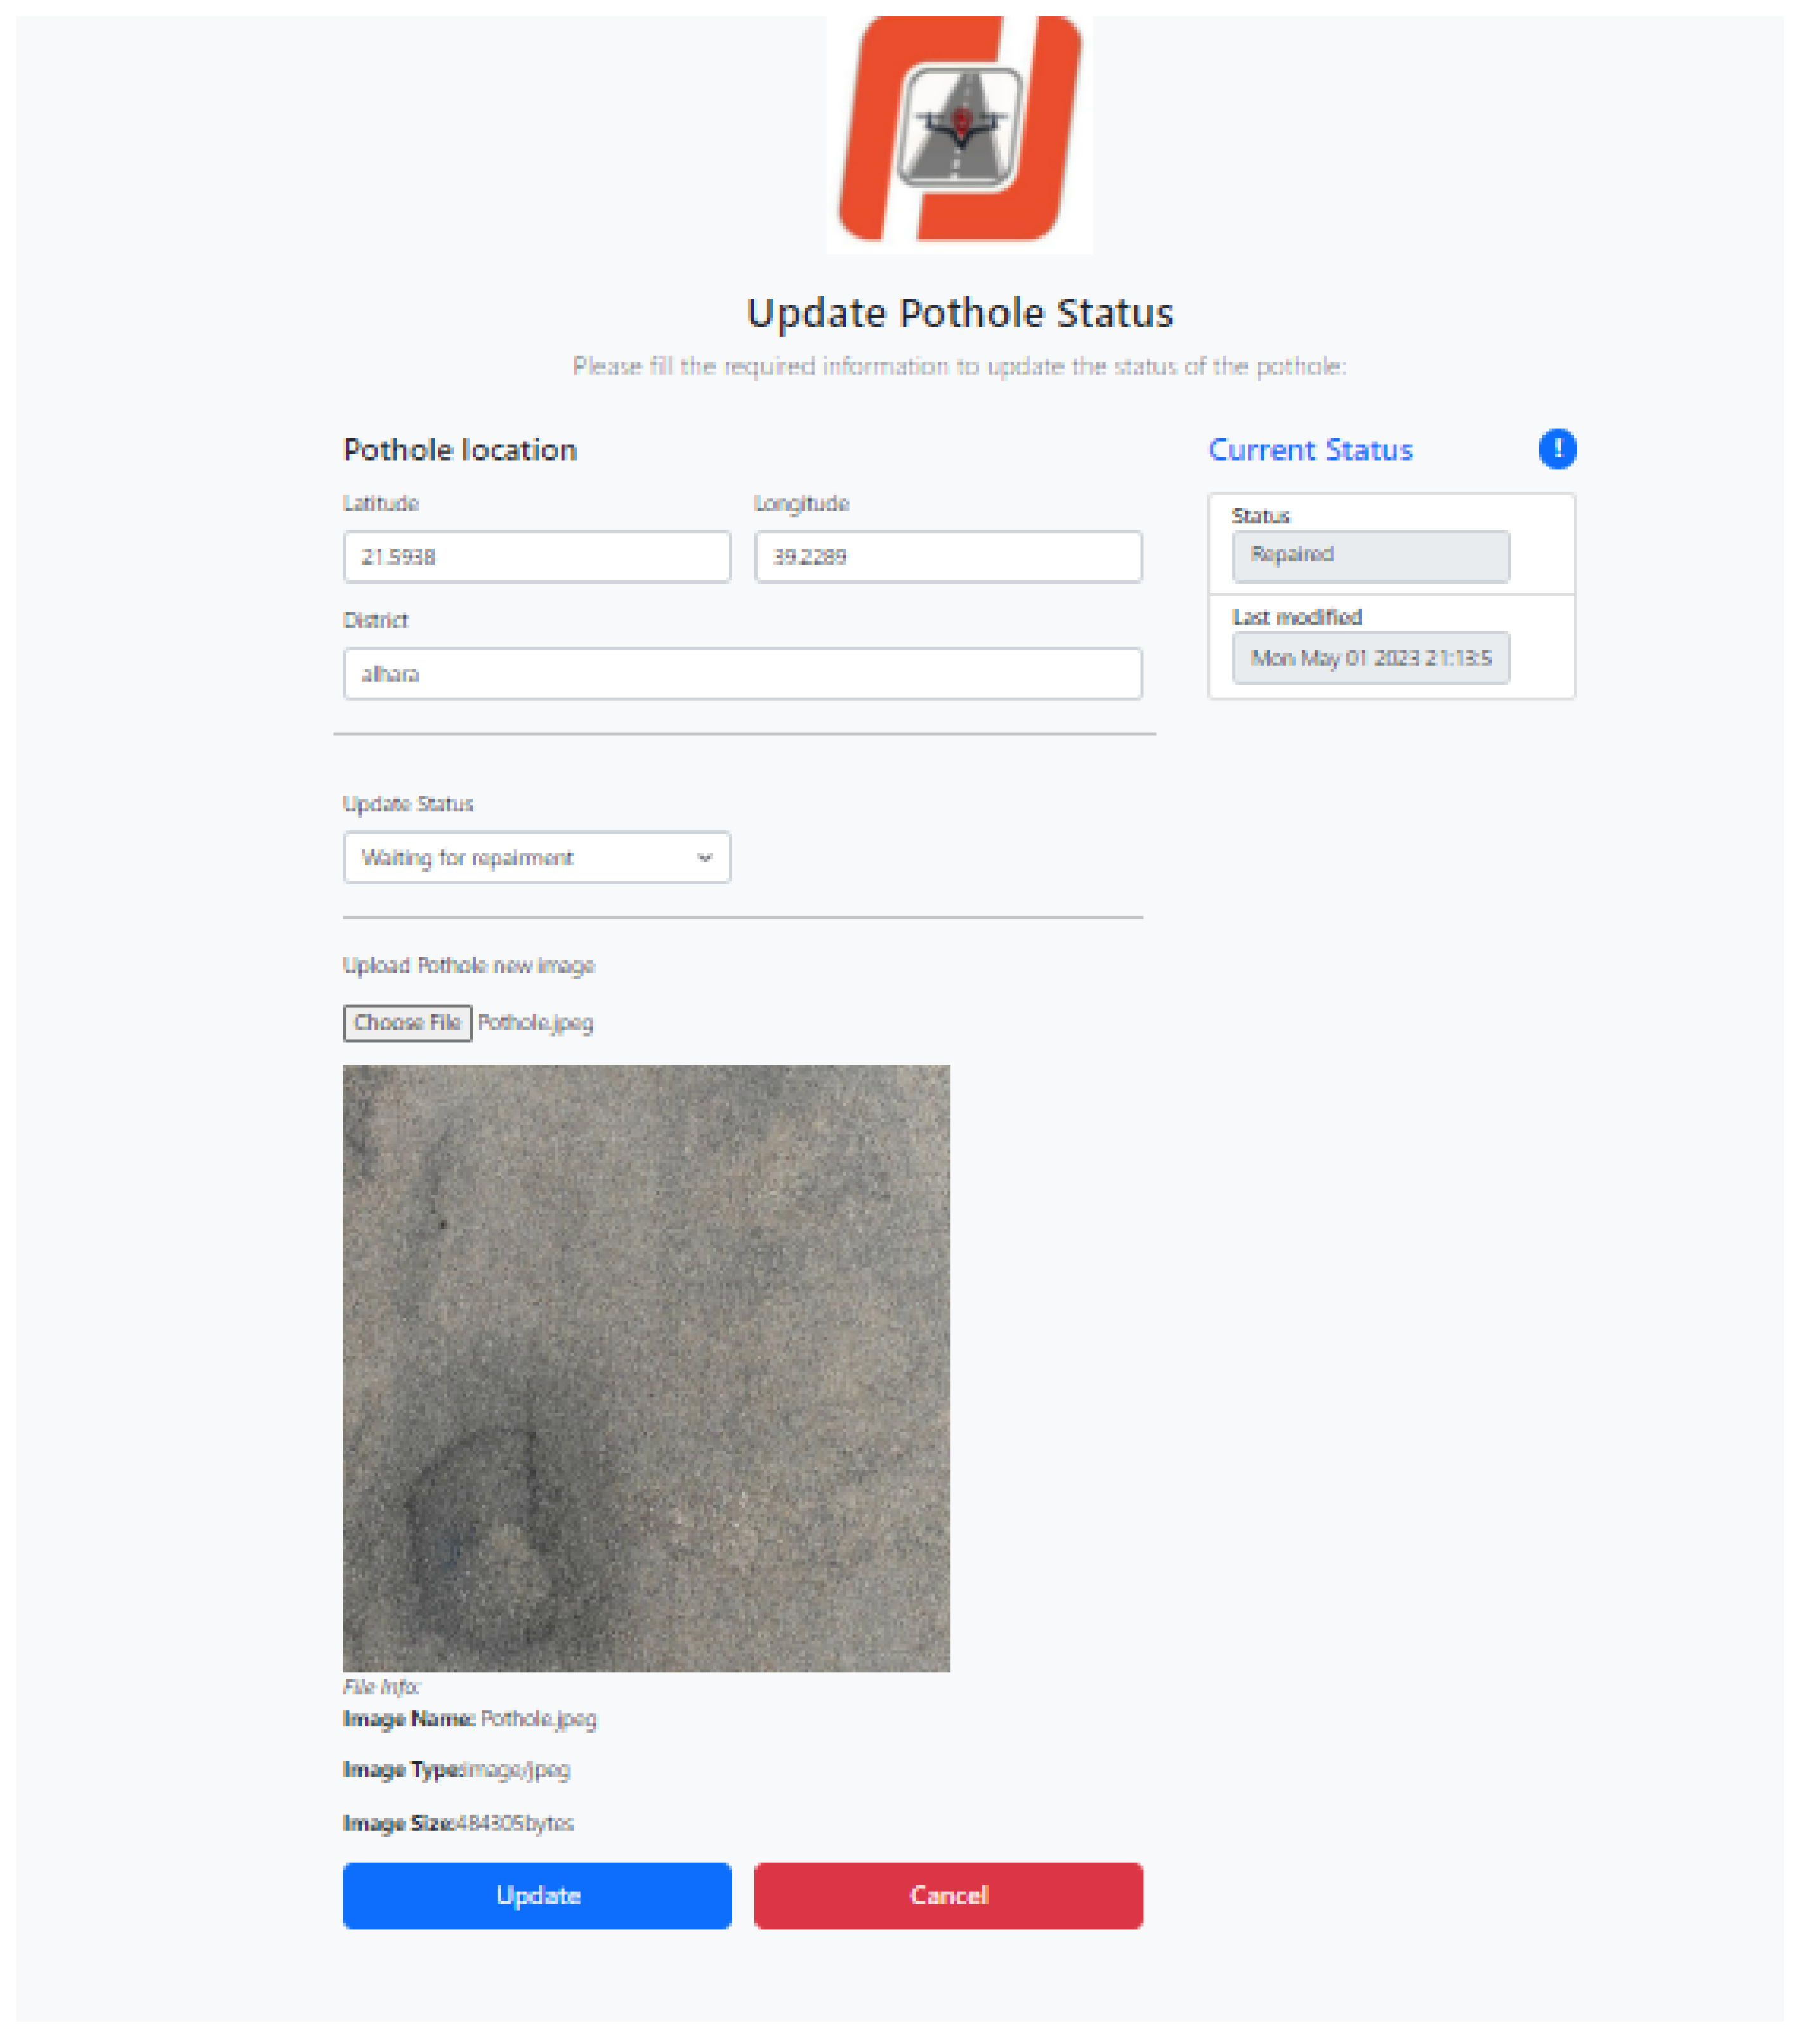
Figure 14, the pothole update page is shown. On this page, the user can change the pothole information. This page allows RMEs to update the details of existing potholes, including coordinates, district, image, and status. When the user clicks the update button, the potholes updates are saved to the database.
4.4.2. RUs Web Application
The front end of the RUs web application consists of two pages. The first page is the start page, and the second page is the main page, which includes the functions for showing the potholes on the map and informing RUs about existing potholes on their routes.
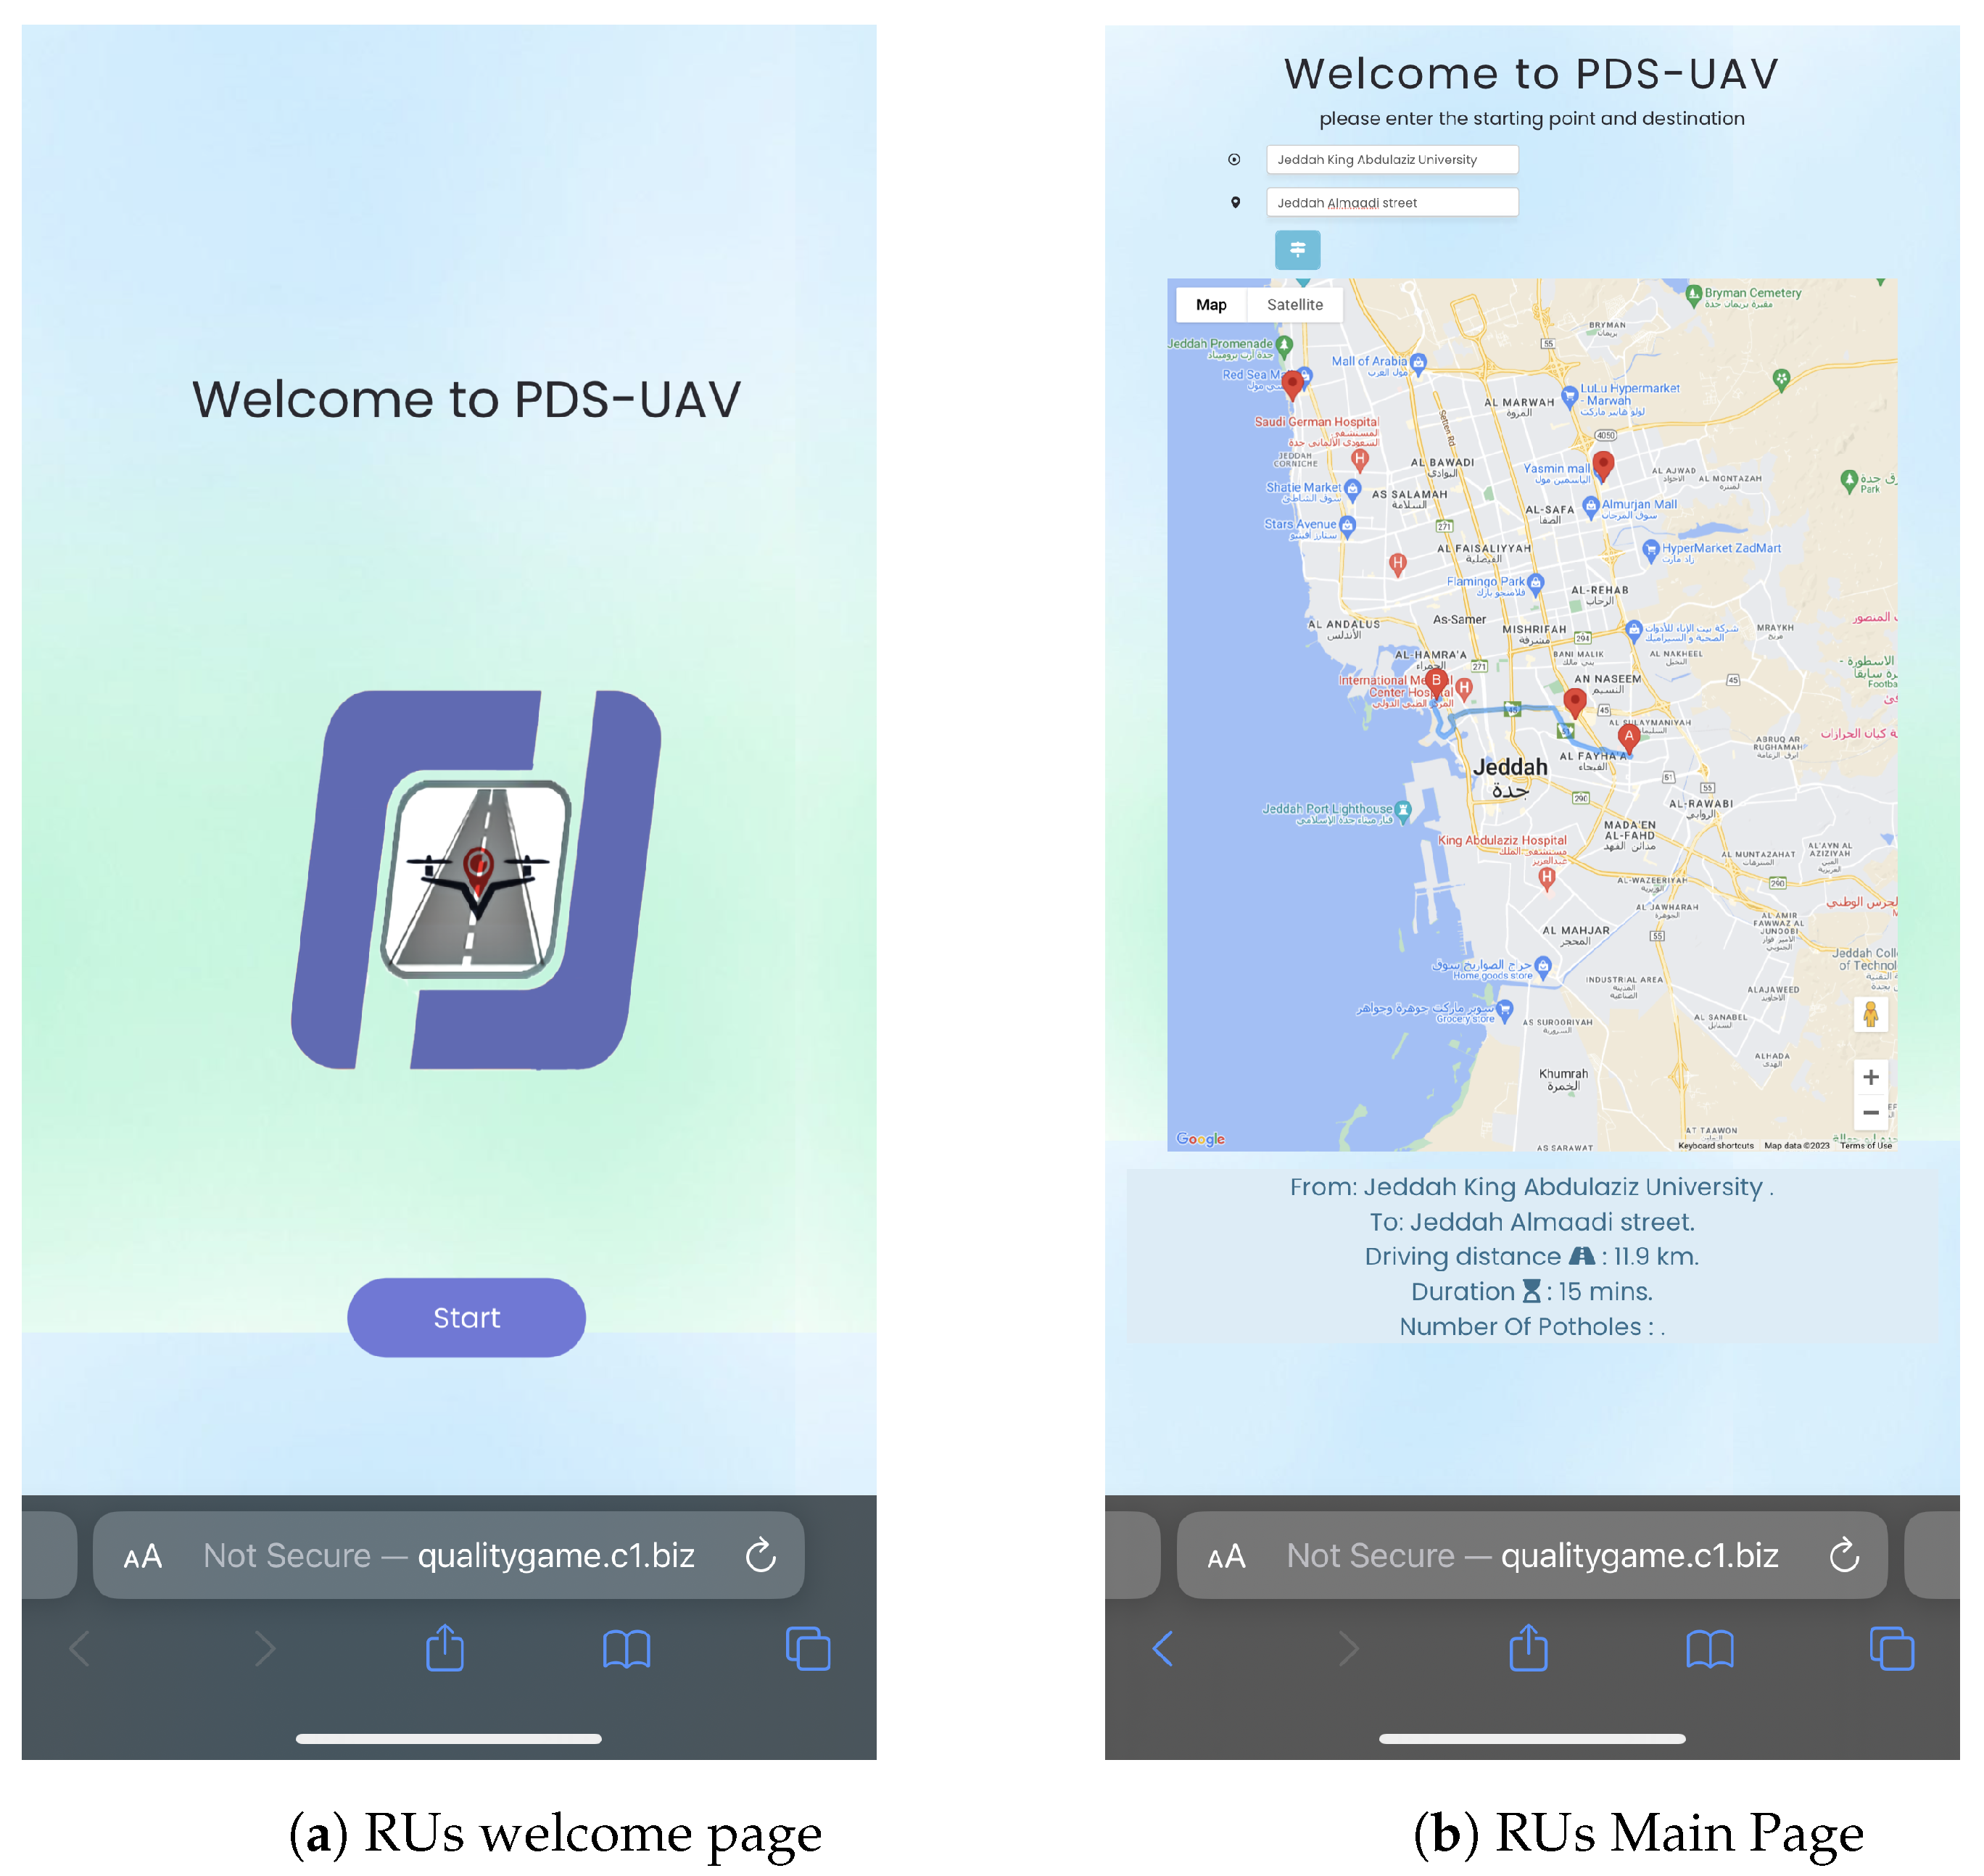
When opening the RUs web application, the welcome page appears. To start the application, RUs click the start button on the welcoming page as shown in
Figure 15a. Then, the user will be directed to the application’s main page, shown in
Figure 15b. The main page consists of two fields where the user can enter the starting point (A) and the destination point (B) and click on the button below to display the route between the points (A) and (B). Once the starting and destination points are entered, the system retrieves pothole information from Firestore documents and displays the locations of any existing potholes along the route on the map. The information presented to RUs includes the trip time from point (A) to point (B), the distance between the two points in Km, and the number of detected potholes that might be encountered on this route.
6. PDS-UAV Testing
To ensure the quality and effectiveness of the PDS-UAV system, different types of software testing were utilized, which include unit testing, integration testing, and usability testing. Each of the performed testing techniques is discussed in detail in the following subsections to ensure that every feature in the application works effectively and that the system has achieved its goals.
6.1. Unit Testing
Unit testing tests the components of the system code to validate their performance and ensure that each component is functioning as expected. This process helps identify flaws in each component of the system before full system integration. It also helps to reduce the chance of bugs and errors in the final product. Two samples of unit testing for the different components of the system are presented: sign-up unit testing and adding potholes unit testing.
Sign-up testing is conducted to ensure the validation of users’ email addresses, phone numbers, and passwords when signing up for the web application. The unit testing for the sign-up page ensures that every input from the user matches the correct format and that all the required fields are filled.
Table 4 shows a sample of the test cases and results for the sign-up page, where a test case is marked as passing if the testing results are the same as the expected results. The unit testing for adding the potholes functionality of the system is performed to ensure that every input from the user will match the correct format and that nothing is left empty, as shown in
Table 5.
6.2. Integration Testing
Integration testing aims to verify that all units and components work together as expected within the application. This testing phase is crucial as it helps identify and resolve errors that may arise from the interaction between the different parts of the system. The results of the integration testing, detailed in
Table 6, confirm that the application’s functions are working correctly, with all test cases producing the expected outcomes. The table outlines various test scenarios, including navigation between pages and interactions with different elements. All of these were successful, indicating a robust and well-integrated system.
6.3. Usability Testing
Usability testing involves engaging target users to assess the easiness and effectiveness of a system. For this purpose, five representative users were selected to test the PDS-UAV system. The participants had similar expertise with comparable systems and were subjected to identical testing conditions, tasks, and questions. Different devices were utilized for the usability testing. The RMEs website was tested on a Windows 11 desktop with an HD display and a high-speed wired Internet connection. Google Chrome was used to access the RMEs’ website. The RUs website was evaluated on an Android device with GPS and a 4G Internet connection. All testing sessions were conducted in a controlled physical environment, maintaining consistent room, lighting, and seating conditions. Data on users’ task performance and feedback were collected during the usability sessions.
Before the testing session, participants signed an informed consent form outlining the testing objectives, data usage, anonymity rights, and their right to withdraw at any time. Users were provided with six representative tasks to assess the usability of the system. Five of these tasks are related to the RMEs web application, and one task is related to the RUs web application. The assigned tasks and their scenarios were as follows:
Sign up: The user signs up to the system by filling in the required information, such as first name, last name, email, password, and phone number.
Sign in: The user signs in to the system using email and password.
Add new pothole: The user fills in the required information to add a new pothole in the add new pothole page. Information includes latitude, longitude, district, and image of the pothole, where the needed information, coordinates of the pothole, and its image are provided to the user before starting the test.
Update pothole status with ID number 1 to repaired: The user selects the edit option from the potholes table at the bottom of the home page and updates the pothole status to “repaired” in the update pothole status page.
Sign out: The user signs out of the system by pressing the sign-out button displayed in the header.
View potholes: The user enters the starting and destination points of the intended route and presses on the show route button to view detected potholes on the selected route.
During the usability testing, the task completion time for each participant was recorded. Additionally, participants were asked to rate the easiness of each performed task on a scale from 1 to 5, provide comments on the task, and specify any aspects they found confusing. This comprehensive approach ensures that quantitative and qualitative data are collected, allowing for a thorough analysis of usability and user satisfaction.
To ensure task success in the usability study, clear criteria should be established based on two parameters: completion within the specified time range and achieving a satisfaction score. Task success criteria are defined as follows:
Time range completion: Participants must complete each task within the specified time range. The targeted average times of each task were set in the planning of usability testing based on a pilot test performed with a small sample of representative users. The target times were set as follows: sign-up task = 120 s–180 s, sign-in task = 30 s–60 s, add new pothole task = 90 s–120 s, update pothole status with id number 1 to repaired = 100 s–130 s, view potholes on a route = 90 s–120 s, sign out = 5 s–20 s.
Rating of task easiness: Participants must rate the easiness of the task as at least 4 out of 5 on a satisfaction scale.
Table 7 shows the time taken by each participant to complete each task, the rating of each task’s easiness, and the average of times and rates for each task.
In general, the average time taken by the five participants to complete each task was within the targeted time. Additionally, the results show that the participants’ average rating of task easiness was 4.3 out of 5, indicating overall satisfaction with the system’s ease of use. Overall, the usability testing showed that PDS-UAV’s design was easy to use and was well accepted by its target users. Some participants also provided further comments and suggestions, such as placing the pothole table on the same screen as the pothole map, clarifying the pothole status on the ‘update’ pothole screen, and providing the interface in other languages, such as Array. Based on the users’ comments, the system was updated. For example, in the update pothole status page, the confusion about the current status field of a pothole was solved by moving the drop-box of status to a more recognizable place on the screen. Other users’ comments will be addressed in future work.
7. Discussion
The detection and maintenance of potholes are crucial for ensuring road safety and enhancing the quality of life for drivers and passengers. Traditional methods of pothole detection often rely on manual reporting by drivers or municipal employees, which can be inefficient and unreliable. This study introduces an innovative automated system for pothole detection using UAVs and AI. The proposed PDS-UAV system uses UAVs to capture images of road surfaces, then utilizes a deep neural network to analyze the captured images and detect potholes.
Previous research has explored various methods for pothole detection, including the use of smartphone cameras and in-vehicle cameras [
23,
24]. While useful, these methods often suffer from limited coverage and require manual intervention. In contrast, UAVs offer a broader sensing range, allowing for more extensive coverage and the ability to detect potholes in areas that are difficult to access by conventional means without endangering human lives. Thus, several recent studies in the literature have considered UAV images for pothole detection [
12,
13,
14,
15,
16,
17]. Some of the UAV approaches for pothole detection utilized machine learning techniques [
12,
17], while others utilized deep learning techniques with or without image processing [
13,
14,
15,
16]. The image processing techniques were utilized to reduce the error rate and increase the model’s ability to distinguish between classes [
14,
15]. Other approaches used deep learning for pothole detection. For instance, a multi-agent system using the YOLOv4-tiny algorithm was employed for real-time pothole detection using UAV images with accuracy rates of 96.54% and a precision of 98.45% [
16]. Similarly, UAV images were also used to improve road damage detection efficiency and accuracy by employing multiple YOLO versions (YOLOv4, YOLOv5, YOLOv5 with transformer, and YOLOv7), achieving precision rates of 26.86%, 59.9%, 65.7%, and 73.2%, respectively [
13].
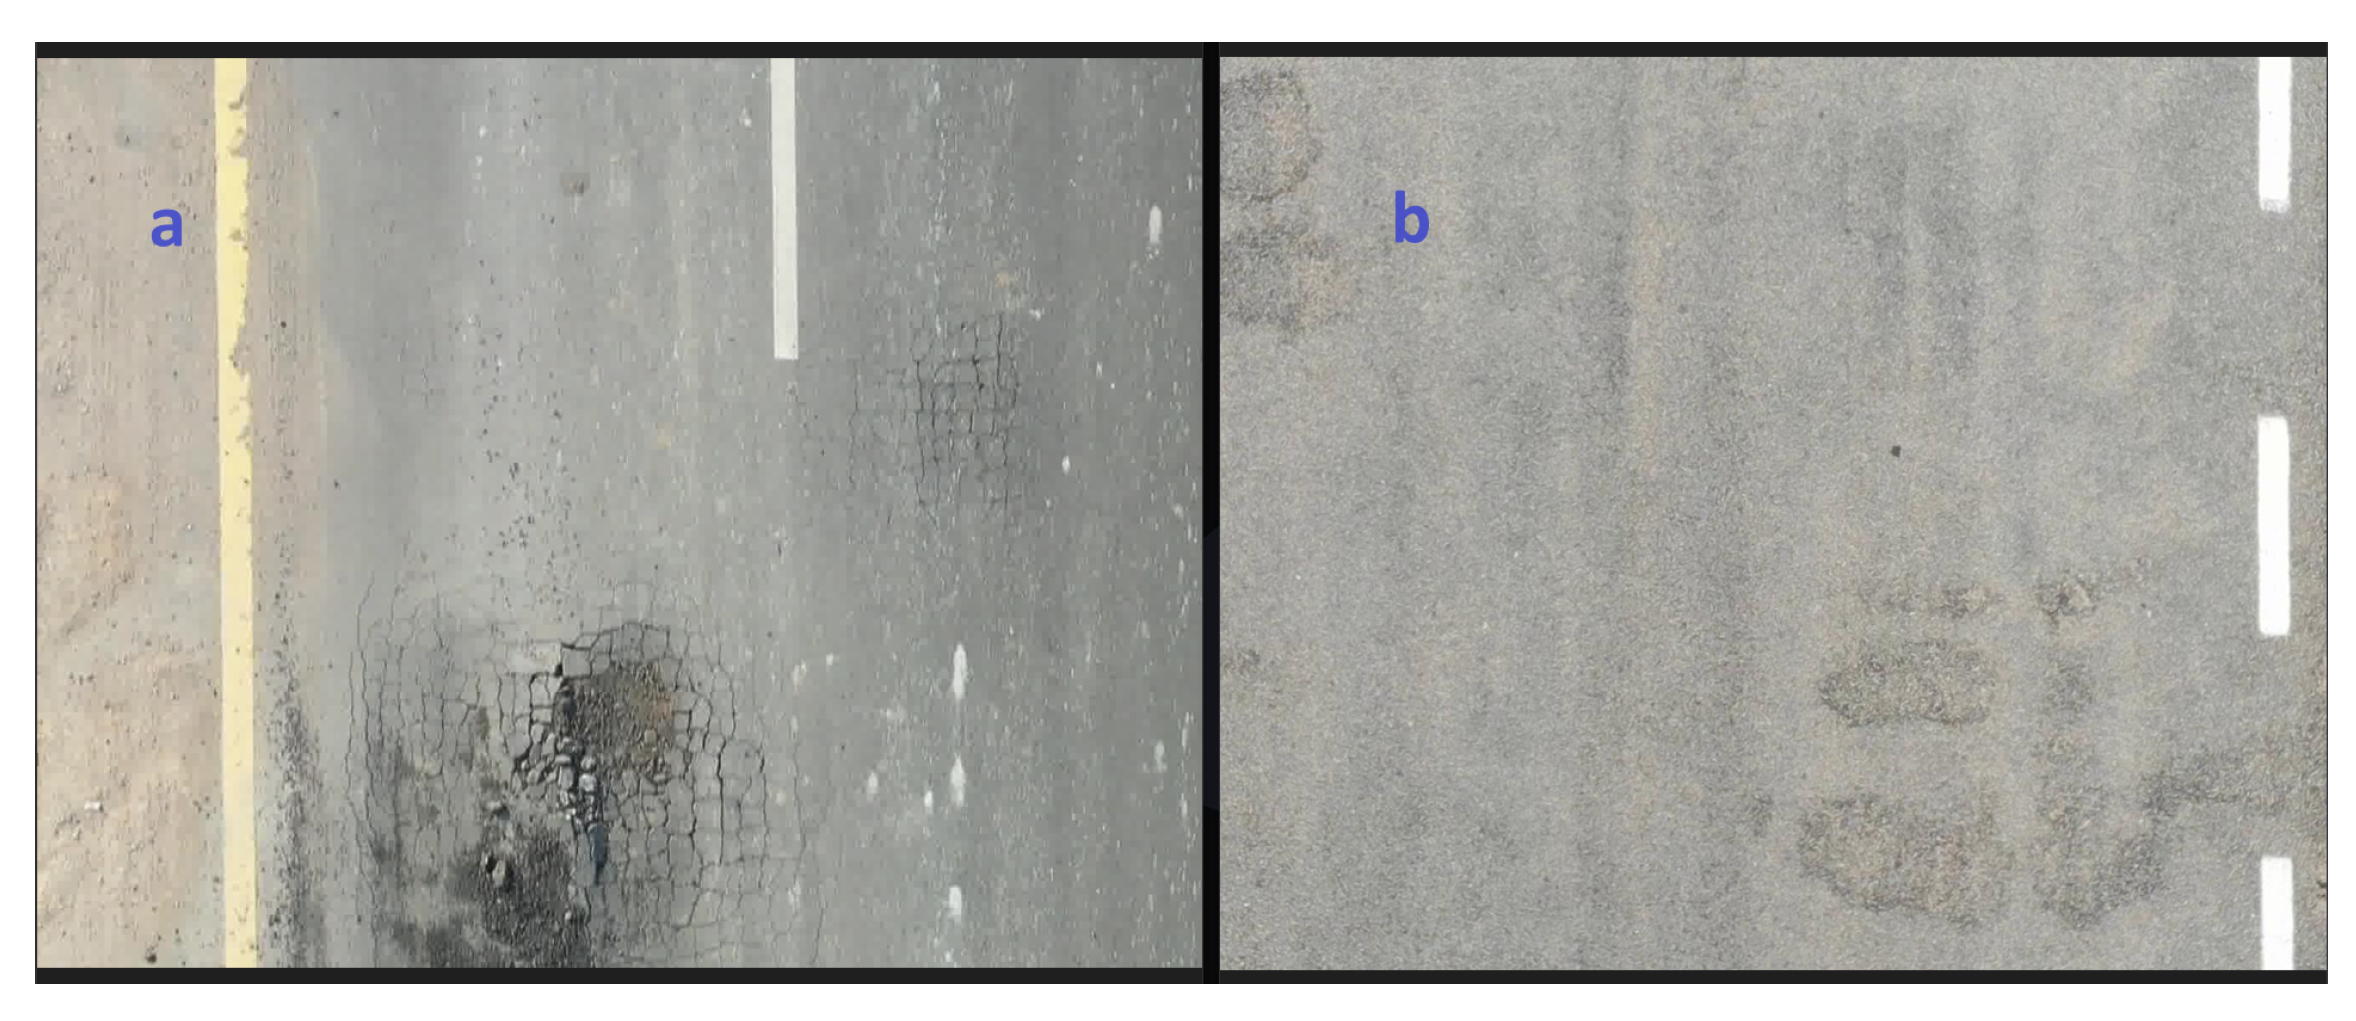
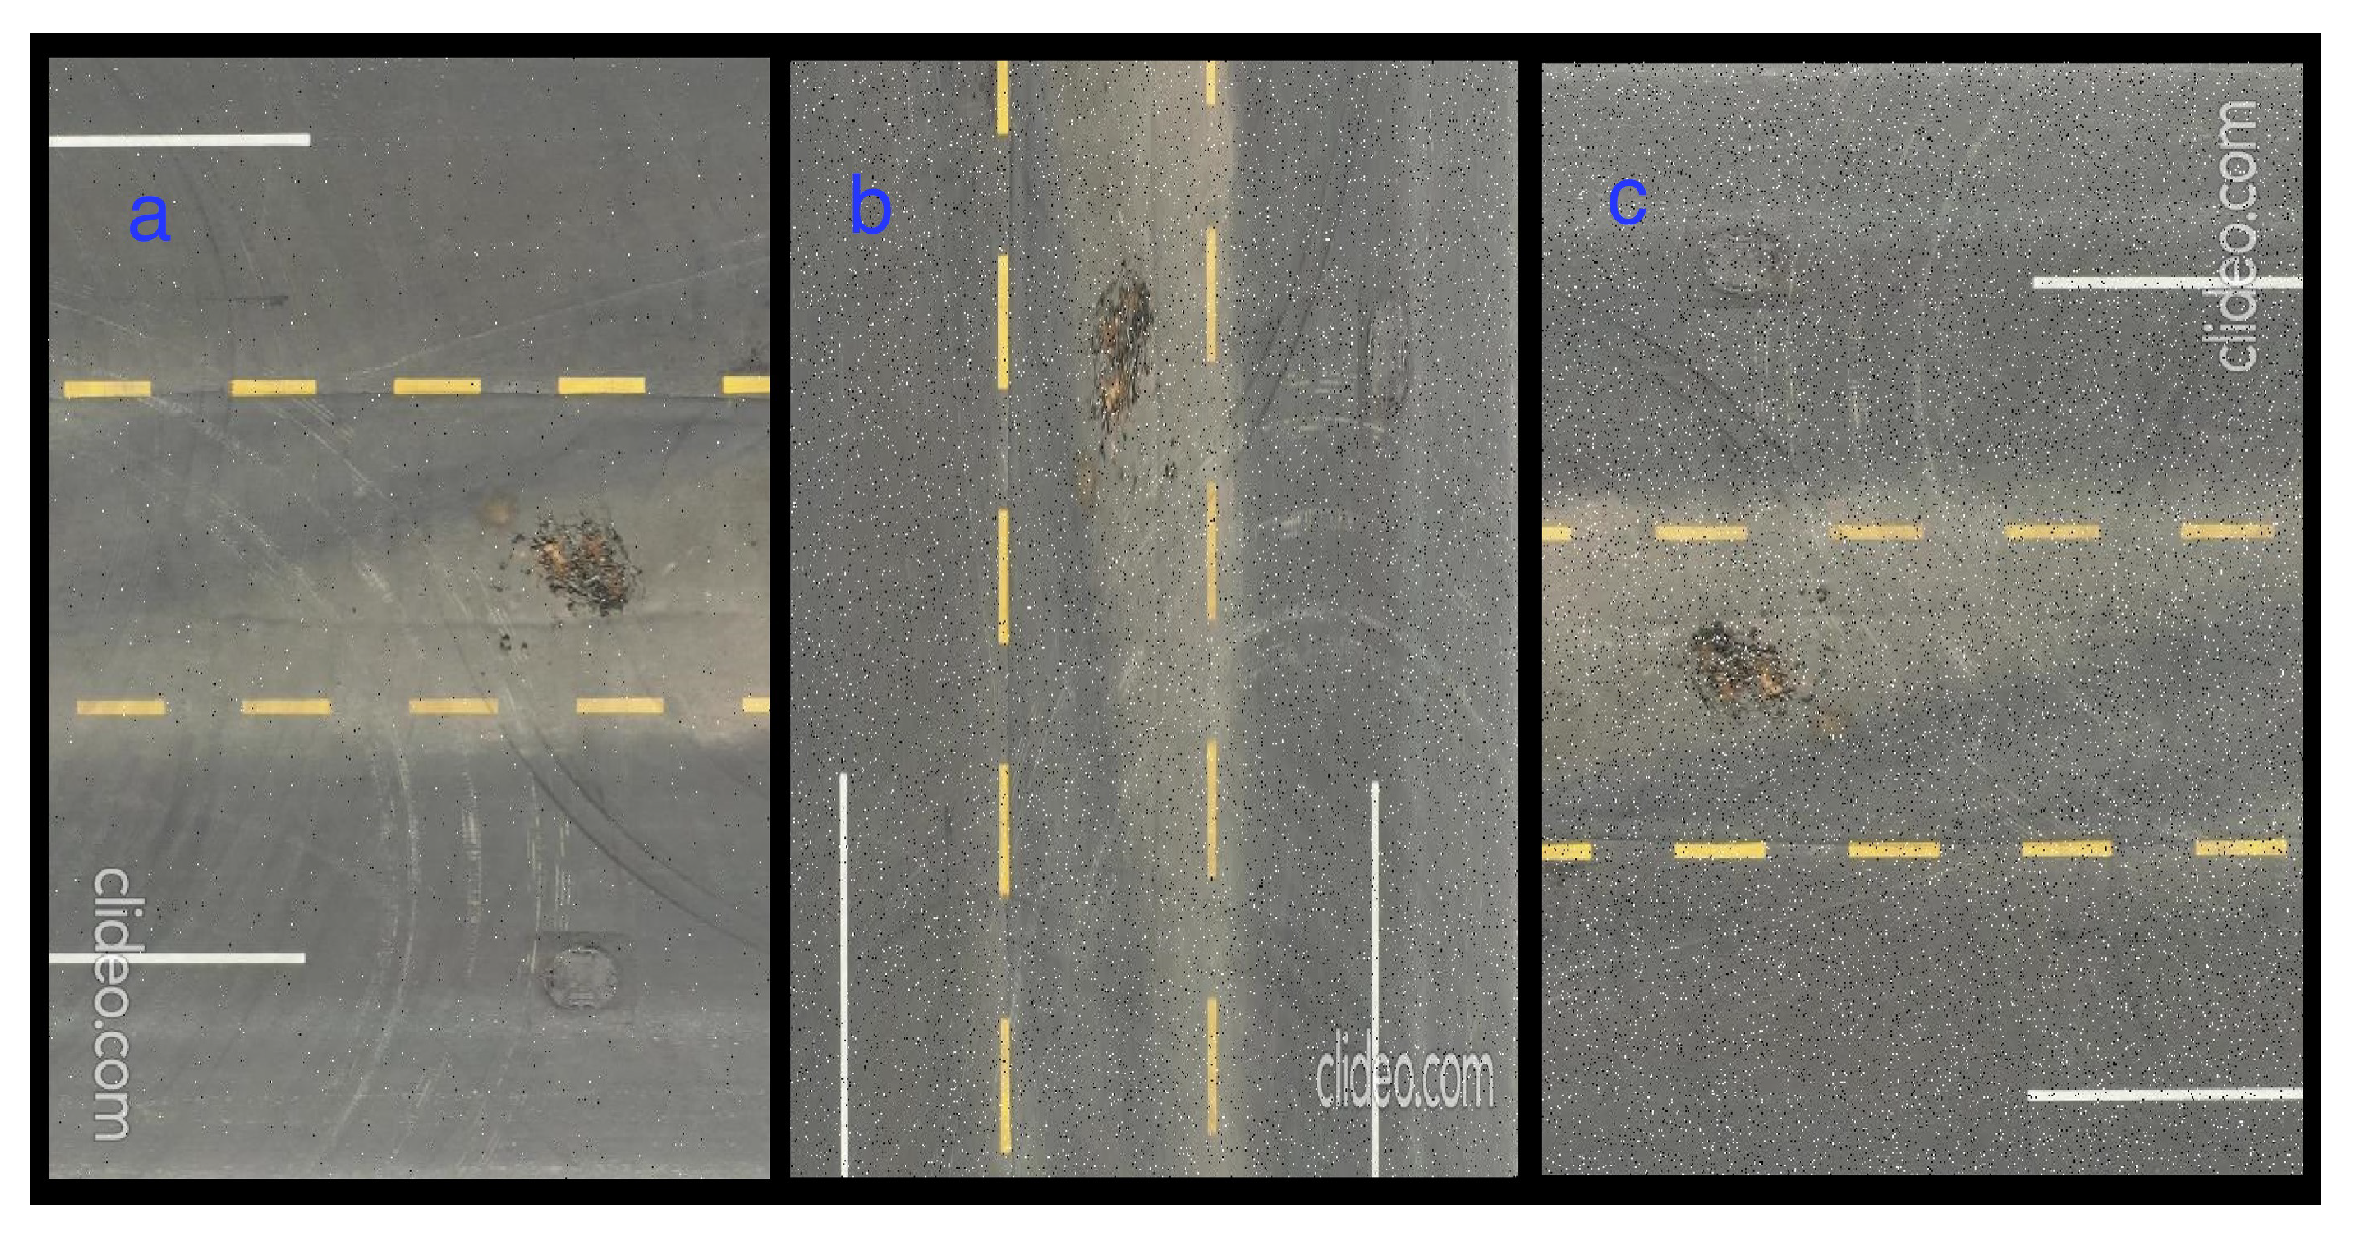
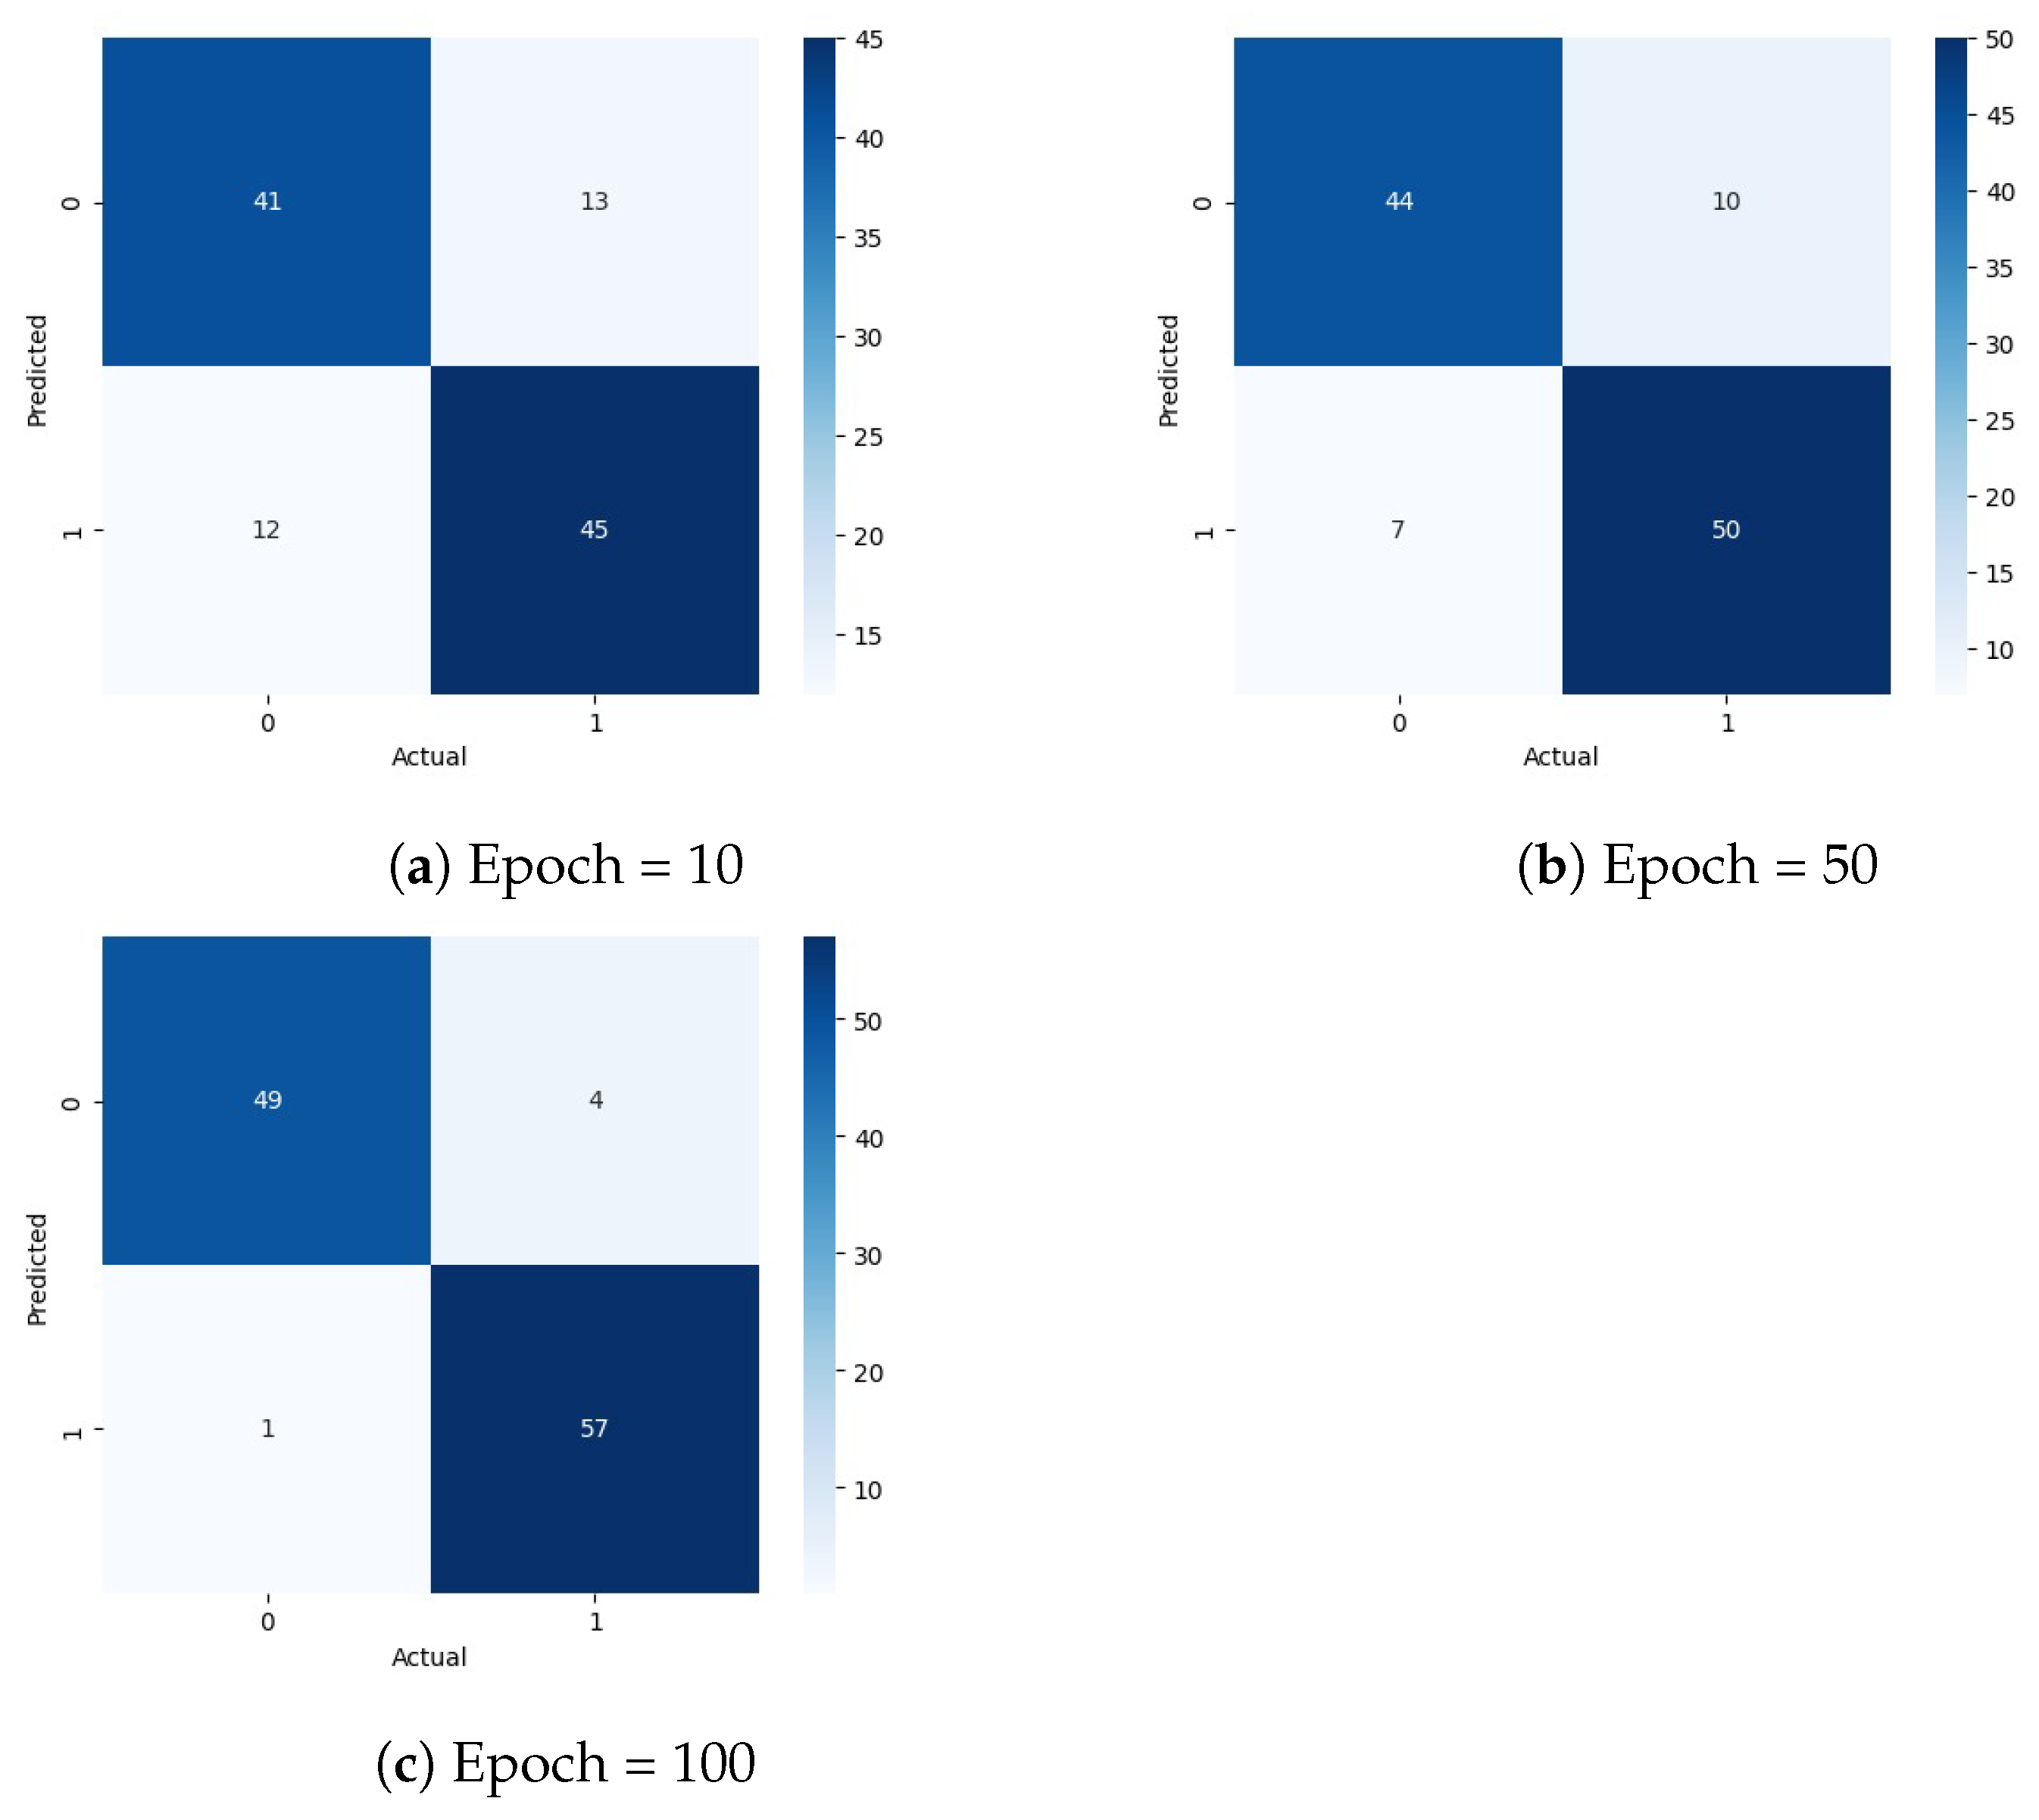
The PDS-UAV system extends the efforts of automating pothole detection by incorporating YOLO deep learning algorithm. Different variants of the YOLO model were tested for pothole detection in the proposed PDS-UAV system. The models were trained using a publicly available dataset collected from Spain and tested on a proprietary dataset collected from Jeddah, Saudi Arabia, for cross-domain generalization. The examined models included YOLOv4-tiny, YOLOv5, and YOLOv8. The best precision percentages for the models were achieved when the number of epochs was equal to 100 and the percentages were 82%, 82%, and 98%, respectively. Due to its significantly higher detection precision, YOLOv8 was selected as the best model for the system to increase the reliability and accuracy of pothole identification.
In [
16], the same dataset of the present study was employed to train the model exclusively on YOLOv4-tiny. In contrast, the present study utilized the same dataset to train three models: YOLOv4-tiny, YOLOv5, and YOLOv8, enabling a comparative analysis across different versions of the YOLO model. Although both studies used the same dataset, the YOLOv4-tiny model in [
16] achieved higher precision than this study (98.45% versus 82%). This discrepancy could be due to the model in [
16] being optimized and tested on a domain-specific dataset, which likely improved its performance. In contrast, this study tested the models on a dataset from a different domain (country), introducing more variability and possibly making the detection task more challenging. Another notable factor is that the authors in [
16] did not specify the number of training epochs, whereas in the current study, the number of epochs ranged between 10 and 100 for each model. A longer or more fine-tuned training process may have contributed to the higher precision in [
16]. While increasing the number of epochs can improve the model performance, it also raises the risk of overfitting, where the model performs well on training data but poorly on unseen data. To prevent this, the number of epochs in the present study was deliberately kept between 10 and 100, balancing training time and ensuring better generalization to unseen data.
The implementation of the PDS-UAV system demonstrated several key findings. The YOLOv8 model demonstrated high effectiveness in detecting potholes from UAV-captured images, achieving an F1 score of 95%, a precision of 98%, and a recall of 92%, underscoring its accuracy and efficiency. Usability testing with road maintenance employees and road users revealed a high average satisfaction rating of 4.3 out of 5, reflecting the system’s ease of use and acceptance among target users. The system’s operational benefits were also notable. It effectively informs drivers of nearby potholes on their routes by overlaying the detected potholes’ locations on the map.
Automating pothole identification using UAV images has a significant impact on infrastructure management, transportation efficiency, and road safety, benefiting various stakeholders, including road users, road maintenance employees, and city planners. For road users, such as drivers, bikers, and daily commuters, the technology offers safer routes by providing information on pothole locations, allowing them to avoid hazardous areas and reducing the risk of accidents and vehicle damage. Maintenance employees gain from enhanced safety due to reduced exposure to traffic and the elimination of manual inspections, which also cuts labor costs and allows for more efficient repairs. The system’s continuous monitoring capabilities ensure proactive maintenance, preventing costly road damage and enabling timely interventions. For city planners, the PDS-UAV system provides valuable data to prioritize road repair projects and allocate resources efficiently. Its integration with traffic management and emergency services enhances urban mobility and safety by maintaining critical routes in good condition. Furthermore, the precise data supports informed decision-making and smart city initiatives, contributing to better infrastructure management and environmental sustainability. Utilizing an advanced detection algorithm, YOLOv8, enhances the system’s reliability and accuracy, making it an essential tool for improving road maintenance and ensuring safer and more efficient transportation networks.
Despite the promising results of the proposed PDS-UAV system, several limitations can be highlighted. First, the performance of the YOLOv8 model relies heavily on the quality and diversity of the training dataset. In addition, potholes can vary depending on regions, road surfaces, lighting conditions, and weather, impacting the model’s detection accuracy. Second, while there are many benefits to using UAVs for data collection, there are also shortcomings. Deploying UAVs for pothole detection faces operational limitations such as battery life, which could result in restricted flight length (usually 30–40 min). In addition, the effects of bad weather conditions, such as heavy rain, strong winds, or low visibility, can limit UAV operations. These UAV-related variables may impact the dependability and consistency of data gathering across long periods or wide geographic areas. Third, the use of UAVs in urban contexts is restricted by stringent regulatory frameworks designed to ensure safety and privacy, making it time-consuming to obtain appropriate approvals and manage the danger of accidents with other airborne objects or structures. Addressing these limitations through future research and development will be crucial for enhancing the robustness, scalability, and practical applicability of the PDS-UAV system in diverse urban environments.
Future work will include developing a real-time system by integrating the system into the UAVs. In addition, it will focus on improving the website’s functionality and conducting further usability testing with a larger user base. Also, enabling a bilingual interface for the application using English and Arabic will make the web application more accessible to target users. Moreover, including real-time alerts for RUs based on their current location, and using banners and sounds would enhance their safety. The alerts should consider the safe distance that separates the RUs from the pothole based on their mobility mode (walking, driving, or cycling) so that they can take proper action at the right time to prevent the impact of these potholes on their safety. Furthermore, investigating the use of UAVs for other forms of infrastructure monitoring, such as traffic monitoring and control, might broaden the technology’s applications.

