Article

PDS-UAV: A Deep Learning-Based Pothole Detection System Using Unmanned Aerial Vehicle Images

1
Department of Computer Science, Faculty of Computing and Information Technology, King Abdulaziz University, Jeddah 21589, Saudi Arabia
2
Department of Information Systems, Faculty of Computing and Information Technology, King Abdulaziz University, Jeddah 21589, Saudi Arabia
*
Authors to whom correspondence should be addressed.
Sustainability 2024, 16(21), 9168; https://doi.org/10.3390/su16219168
Submission received: 17 July 2024 / Revised: 14 October 2024 / Accepted: 15 October 2024 / Published: 22 October 2024
(This article belongs to the Section Sustainable Transportation)

Abstract

:
Smart cities utilize advanced technologies to enhance quality of life by improving urban services, infrastructure, and environmental sustainability. Effective pothole detection and repair strategies are essential for improving quality of life as they directly impact the comfort and safety of road users. In addition to causing serious harm to residents’ lives, potholes can also cause costly vehicle damage. In this study, a pothole detection system utilizing unmanned aerial vehicles, called PDS-UAV, is developed. The system aids in automatically detecting potholes using deep learning techniques and managing their status and repairs. In addition, it allows road users to view an overlay of the detected potholes on the maps based on their selected route, enabling them to avoid the potholes and increase their safety on the roads. Two data collection methods were used, an interview and a questionnaire, to gather data from the target system users. Based on the data analysis, the system’s requirements, design, and implementation were completed. For the pothole detection, a deep learning model using YOLOv8 was developed, which achieved an overall performance of 95%, 98%, and 92% for F1 score, precision, and recall, respectively. Different types of testing has been performed on the target users to ensure the system’s validity, effectiveness, and ease of use, including unit testing, integration testing, and usability testing. As a future work, more features will be added to the system in addition to improving the deep learning model accuracy.

1. Introduction

Improving the quality of life is one of the main priorities for modern urban development. Maintaining the comfort and safety of drivers and passengers on the roads is crucial for improving life quality. By 2030, almost 60% of the world’s population is predicted to reside in cities. Given that millions of people depend on the road infrastructure for their daily transportation, road safety is critically important. This implies that the demand for transportation would surpass the capacity of most present transportation systems, placing a high load on the road infrastructure in these cities [1].
Ensuring that roads are maintained in good condition is critical for the safety and comfort of citizens. However, poor surface quality, aging infrastructure, heavy traffic, and natural events such as earthquakes and heavy rainfall can lead to significant road damage, including potholes and cracks [2]. Besides being detrimental to comfort and leading to costly vehicle damages, potholes and other road anomalies can be very dangerous, potentially causing accidents with serious injuries or fatalities. Thus, addressing this problem in a timely manner is essential for safeguarding drivers and passengers.
In Saudi Arabia, road traffic accidents account for about 5% of all fatalities [3]. Over the past decade, the rate of road deaths has risen from 17.4 to 24 per 100,000 people [3]. Additionally, Saudi Arabia experiences 19 fatalities and 4 injuries due to automobile accidents every hour, underscoring the significant public health risk posed by these incidents [3]. One of the primary elements leading to accidents and fatalities is the road infrastructure, which should be designed and maintained to eliminate or decrease hazards for all road users [1].
The current system used in Saudi Arabia for pothole detection is managed by the Saudi municipalities. The system requires that employees at the road maintenance department manually scan the roads, inspect the potholes, estimate the danger, and report the detected potholes. Thus, the reporting is subjective, relying on the employees’ expertise, and it is also opportunistic, depending on the potholes encountered during inspections. Additionally, this task can be labor-intensive, requiring many employees to cover extensive urban areas. It is particularly challenging in congested streets, posing a significant threat to the safety of the employees. Alternatively, drivers or citizens can report potholes. However, this depends on their willingness to take pictures of the potholes and upload them using a web portal or mobile application, a task that can be time-consuming and inconvenient for some drivers [4]. Moreover, the current system does not include any mechanism for informing drivers about nearby potholes.
Several research approaches have been proposed to automatically analyze road conditions for identifying potholes and other road anomalies [5]. These approaches can be categorized into two main categories, vision-based, and vibration-based [6]. While vibration-based approaches for road condition monitoring are cost-effective, easier to install, and more reliable under various environmental conditions, vision-based systems provide extensive and contextual information on road conditions. This information can lead to more comprehensive maintenance strategies and enhanced road safety.
This paper proposes a system that automates pothole detection using deep learning. The proposed system, PDS-UAV, uses unmanned aerial vehicles (UAVs), also known as drones, to capture images of potholes, providing a wide sensing range compared with drivers’ smartphones or in-vehicle cameras. Images are then uploaded to the system for analysis and classification using a deep neural network detection algorithm, specifically You Only Look Once (YOLO), known for its accuracy and speed. Thus, the proposed system allows for easier pothole detection without relying on the chance of encountering potholes or individuals’ perceptions and viewpoints.
The main contribution of this paper is the development of a pothole detection and management system that utilizes a deep learning model for detecting potholes from images captured by UAVs. Initially, a deep learning model for pothole detection is trained using a publicly available dataset. The model is then tested using a dataset collected for Jeddah city in Saudi Arabia to confirm its accuracy and reliability in identifying potholes by using cross-city testing as a method for cross-domain generalization. Additionally, two web applications are developed: one for the road maintenance employees (RMEs) to manage the repairs of the detected potholes, and another is used to inform drivers about nearby potholes based on their routes by utilizing map annotation.
The remainder of the paper is organized as follows: Section 2 reviews various approaches proposed in the literature for pothole detection using smartphones, in-vehicle cameras, or UAV images. Section 3 introduces the proposed PDS-UAV system. Section 4 elaborates on the development methodology of PDS-UAV. The PDS-UAV deep learning model for pothole detection is presented in Section 5. Section 6 covers the testing of the PDS-UAV system. Section 7 presents the discussion, and Section 8 concludes the paper.

2. Related Work

Different vision-based approaches have been proposed in the literature for pothole detection. These approaches can be classified based on the technology used for capturing images into approaches that use UAV cameras and approaches that use smartphones or in-vehicle cameras, which are discussed in the following subsections. Table 1 compares the reviewed pothole detection approaches. Approaches that utilize UAV images are depicted at the beginning of the table, and other approaches, using smartphones or in-vehicle cameras, are presented in the second part of the table.

2.1. Pothole Detection Using UAV

Using UAVs has become more popular over the last few years for many smart city applications. The availability of various types of sensors and the wide sensing range of UAVs enable them to be used effectively for remote sensing in many fields. For example, UAVs can be utilized in traffic monitoring where multiple road lanes can be simultaneously captured [7,8]. Also, they can be used in agriculture where farmers use UAVs for wide-field crop analysis [7,8]. UAVs have many other uses such as delivering packages, Internet services and environmental control and monitoring, gas pipes maintenance, and other construction and civil engineering projects in many countries such as Spain, South Korea, and Japan [9].
UAVs have been used as an enabling technology in intelligent transportation systems (ITSs), where UAV-captured images are utilized for monitoring the road infrastructure. One of the road monitoring applications in which UAVs have been used is the inspection of the transportation infrastructure pavement. A review of these applications and related approaches is available in [10]. Compared with traditional methods that use images captured by smartphones and in-vehicle cameras, utilizing UAV images for detecting potholes and road anomalies offers several advantages [10,11]. UAVs can be operated remotely without a human pilot on board, making them highly versatile. UAVs possess multiple advantages, including accessibility, high efficiency, and cost effectiveness, making them ideal devices for area monitoring and inspection. They can be equipped with various sensors and cameras to capture high-resolution images and videos from different angles, providing valuable insights into monitored sites. They can access hard-to-reach areas and provide close-up inspections that are difficult or impossible to obtain with traditional inspection methods. UAVs can cover large areas quickly and accurately, allowing for real-time monitoring and data collection. This makes it easier for decision-makers to make informed decisions and adjust plans accordingly based on the accurate, real-time collected data [11].
The authors in [12] investigated the effectiveness of decision tree classification (DT) in detecting road cracks. UAV images were split into smaller images, and the sub-images features were obtained for each pixel. A set of 24 possible features was selected from the gray-level co-occurrence matrix (GLCM). A total of only eight uncorrelated features were considered for categorization. Then, a classification tree was utilized to categorize the data into two basic categories, cracks and non-cracks. Morphological methods such as opening and closing were employed to improve the edges and separate the thin connections in the pictures, thus improving detection accuracy. The accuracy of the crack detection was 96% and the accuracy of the pothole detection was 94%. However, the authors did not mention the dataset size in this study.
In [13], using UAVs and artificial intelligence (AI) technologies to improve efficiency and accuracy road damage detection has been proposed. The authors utilized four different algorithms, YOLOv4, YOLOv5, YOLOv5 with transformer, and YOLOv7 for object detection and localization in UAV images. The models were trained on a subset of images selected from the RDD2022 dataset from China, in addition to a Spanish road dataset. The total number of images in the dataset is 2893. The mean average precision (mAP) at an intersection overlapping (IoU) threshold of 0.5 was 26.86%, 59.9%, 65.70%, and 73.2% for YOLOv4, YOLOv5, YOLOv5 with transformer, and YOLOv7, respectively.
In [14], an algorithm that combined traditional image processing and AI techniques, namely mask R-CNN, was proposed. The algorithm aims to enhance the accuracy of tiny object segmentation in UAV images used for pothole detection. The image processing techniques consisted of three main steps: multiple orientation edge detector (MOED) for extracting pothole edges, validation phase Of results (VAPOR) for assessing the normality of the extracted edges, and exception processing for edge detection and the refinement of abnormalities. The results of this study demonstrated that the error rate of the proposed algorithm was reduced by approximately 13%.
In [15], the authors proposed an approach for pothole detection using entropy thresholding segmentation combined with a sigmoid calibration function embedded in a multilayer perceptron (MLP) neural network. The used dataset includes a total of 500 sampled pixels of a pothole surface. The method achieved the highest area under the curve (AUC) value of 0.71, indicating improved accuracy in pothole detection compared with other approaches.
In [16], a multi-agent system architecture that utilizes drone images for pavement monitoring was built. The authors used the YOLOv4-tiny algorithm because of its time and cost effectiveness, which makes it suitable for real-time detection. A drone camera was used to collect a dataset of 1362 images. The drone flew in public locations with a speed range of 15–25 km/h and at a height of 50–70 m. The authors considered three different types of users: drone pilots, road maintenance agents, and road monitoring agents. The system showed good performance with a precision of 96.54% and a mAP of 98.45%, as reported by the best experiments’ results.
In [17], four supervised learning algorithms, K-nearest neighbor (KNN), support vector machine (SVM), artificial neural network (ANN), and random forest (RF), were used to detect potholes and cracks on the roads from high-resolution UAV images. Additionally, to extract potholes and cracks from images, a multi-resolution segmentation (MS) algorithm was used. Furthermore, the gray-level co-occurrence Matrix (GLCM) was also used to measure the variations between the distressed and non-distressed areas (damage-free pavement). The dataset consisted of 1430 sample images, containing three different classes: 221 images of potholes, 678 images of cracks, and 531 images of undamaged roads. The running times of all four algorithms on the same PC were recorded to compare their performance. The overall accuracy of the KNN, SVM, ANN, and RF algorithms were 98.81%, 98.95%, 98.81%, and 98.46%, respectively.

2.2. Pothole Detection Using Smartphones and In-Vehicle Cameras

A system for detecting road potholes in real time using crowdsourced data from smartphone accelerometers and in-vehicle video cameras was proposed in [18]. The system utilized a long short-term memory (LSTM) deep learning network to improve detection accuracy using fused accelerometer and video data. Spatial density-based clustering is used to aggregate multi-vehicle data, which improves the reliability and precision of identified road abnormalities. The achieved accuracy was 96.1%, and the achieved precision was 89.7%. However, the exact size of the dataset was not mentioned.
In [19], data was collected using a camera installed on a survey vehicle called road space information management system (RIM). The survey vehicle is equipped with a global positioning system (GPS) device, a motion mapping system (MMS), and surface-recording cameras that collect road surface information in a 3D perspective. Each captured image in the dataset is 2400 × 2000 pixels, and the light content is measured in RGB, with 0 meaning zero light and 255 meaning maximum light. A total of 5362 images were collected, which were divided into five different classes: 1676 for longitudinal cracks, 1035 for transversal cracks, 672 for alligator cracks, 11 for potholes, and 1968 for no cracks. The method for detecting and classifying road damages was developed using YOLOv3, which has achieved a precision value of 70%. However, the accuracy of pothole detection in this study was not confirmed because the dataset contained only a few images of this class.
The performances of three different YOLO versions—YOLOv4, YOLOv4-tiny, and YOLOv5—were evaluated and compared in [20]. The dataset in this study consisted of 665 images taken by smartphone cameras. After training and validation, the models’ performances were evaluated by mean average precision (mAP) at 50%, and the result for YOLOv4 was 77.7%, while YOLOv4-tiny was 78.7% and YOLOv5 was 74.8%. The results showed that YOLOv4-tiny was the best at detecting potholes.
The authors in [21] used an edge detection classification method to detect potholes from images captured using a smartphone camera. The method included three phases, which are: preprocessing of images, extraction of features for road damage, and classification of road damage. To reduce the computation cost, RGB (red, green, and blue) images were converted to gray scale. The YOLO algorithm was used for the detection and classification phases. When there is only one pothole in the images of the dataset, the results were 77.86% for accuracy and 83.45% for precision. However, when there are multiple potholes in the images or potholes in addition to other road anomalies, the results of the average accuracy of the model is about 74% and the average precision is about 75%.
A prototype for pothole detection and intelligent driving behaviors in autonomous vehicles was proposed in [22]. The dataset in this study consisted of 783 images captured by smartphone and Pi cameras installed on vehicles. The proposed system consisted of three modules: a module for detecting potholes, a module for data processing, and an autonomous-vehicle-system module. A convolutional neural network (CNN) model was used for pothole detection. The model performance achieved values of 99.02% and 98.03% for accuracy and precision, respectively.
In [23], a large-scale dataset of 18,345 road damage images was used. The images were captured from a smartphone camera mounted on a vehicle. They were obtained from several public datasets and augmented with crowdsourced images. Different object detection models were trained, which were: MobileNet, RetinaNet, and local binary patterns (LBPs) object detectors. The RetinaNet model is an AI-based object detection model used on smartphones, which was improved to suit the problem of road damage detection. It achieved the highest accuracy among the other compared models with a percentage of 98.23%. The authors concluded that their improved RetinaNet model outperformed the other models because it is more efficient and takes less memory, which is good for small devices like smartphones.
The authors in [24] used a smartphone camera installed inside a vehicle to build a low-cost and large-scale dataset of 9053 images. The collected images contained different weather and lightning conditions. The images were divided into different types of damages, and they were annotated manually. The single-shot multibox detector (SSD) was used to train the model by utilizing two frameworks: Inception V2 and SSD MobileNet. These frameworks can run on limited computational resource devices, such as smartphones, while maintaining acceptable accuracy. The best results for the class containing the potholes were obtained for the SSD MobileNet algorithm with an accuracy of 95% and a precision of 99%. However, the pothole class in this study includes other road damages, which are rutting, bump, and separation.
In summary, the reviewed pothole detection approaches utilize machine learning or deep learning for pothole detection from either UAV images or smartphones and in-vehicle cameras. The proposed system, PDS-UAV, advances pothole detection using a state-of-the-art deep learning model, particularly YOLOv8, for accurate identification from UAV images. YOLOv8 architecture includes multiple convolutional layers that automatically identify relevant features such as edges, textures, and shapes associated with potholes. It is known for its speed and accuracy, crucial for timely maintenance and safety precautions. Using cross-city testing, the ability of the proposed system model to be generalized across domains is demonstrated. This highlights the model’s high accuracy on datasets from different regions, setting it apart from prior approaches that typically focused on localized datasets. Additionally, the proposed system includes a web-based application for monitoring, reporting, and viewing detected potholes, helping to streamline the process for road maintenance employees and road users. Thus, PDS-UAV not only enhances detection accuracy but also offers significant operational benefits by automating data collection and analysis, reducing the need for manual inspections and increasing overall road safety for drivers and passengers.
Table 1. A comparison of pothole detection approaches.
ReferenceYearData TypeNumber of ImagesModelResults
[12]2024UAV Camera Images-Decision TreeAccuracy = 94%
[13]2023UAV Camera Images2893YOLOv4mAP = 26.86%
YOLOv5mAP = 59.9%
YOLOv5 with transformermAP = 65.7%
YOLOv7mAP = 73.2%
[14]2023UAV Camera Images686Mask R-CNN and Image ProcessingError reduction by 13%
[15]2023UAV Camera Images500Sigmoid calibration and Entropy Thresholding Segmentation in an MLP neural networkAUC = 0.71
[16]2020UAV Camera Images1362YOLOv4-tinyAccuracy = 96.54%, Precision = 98.45%
[17]2017UAV Camera Images1430K-Nearest NeighboursAccuracy = 98.81%
Support Vector MachineAccuracy = 98.95%
Artificial Neural NetworkAccuracy = 98.81%
Random ForestAccuracy = 98.46%
[18]2023Accelerometer and In-Vehicle Video-LSTMAccuracy = 96.1%, Precision = 89.7%
[19]2021In-Vehicle Camera Images5362YOLOv3Precision = 70%
[20]2021Smartphone
Camera Images
665YOLOv4mAP = 77.7%
YOLOv4-tinymAP = 78.7%
YOLOv5mAP = 74.8%
[21]2020Smartphone Camera (Global Road Damage Detection Challenge 2020 dataset)13,376YOLOAccuracy = 77.86%, Precision = 83.45%
[22]2020Smartphone and Pi Camera on Vehicles783Convolutional Neural NetworkAccuracy = 99.02%, Precision = 98.03%
[23]2020Smartphone
Camera Mounted
on Vehicle
18,345LPB-cascadeAccuracy = 74.76%
MobileNetAccuracy = 96.75%
RetinaNetAccuracy = 98.23%
[24]2018Smartphone Camera Images9053SSD with Inception V2Accuracy = 95%, Precision = 67%
SSD with MobileNetAccuracy = 95%, Precision = 99%

3. PDS-UAV System Overview

The target users of the system, PDS-UAV, can be divided into two main categories, which are:
  • Road maintenance employees (RMEs): This category includes the employees responsible for road maintenance who are working at city municipalities. In our scenario, we focus on employees at the Jeddah City municipality. These employees utilize the system to report pothole locations, monitor them, and update their status.
  • Road users (RUs): This category includes drivers, bicyclists, and pedestrians who utilize the proposed system to be informed about pothole locations on their routes. This system helps RUs avoid detected potholes, ensuring their safety and preventing potential vehicle damage.
The proposed system, PDS-UAV, consists of three main parts: (A) UAV, (B) deep learning model, and (C) web application. The UAV is used for capturing road surface images and includes the camera, GPS, and battery. The deep learning model is responsible for pothole detection using deep learning classification methods (e.g., YOLO). Finally, the web application includes two different versions of the system, (D) and (E), customized for the two users’ categories. Part (D) is the web application designed for RMEs. It includes three components, the map, potholes’ locations, and potholes images. In addition, it includes two functions, uploading pothole images and updating pothole status. Part (E) is the web application designed for RUs, including drivers, pedestrians, and bicyclists. The RU web application includes two components: a map displaying the selected route based on the entered starting and destination points and map annotations to indicate the locations of detected potholes. Figure 1 shows all the components of the system and the interactions between these components.
The system is operated as follows: the UAV captures video of the road surface, and frames (images) are extracted from this video. Then, the extracted images are uploaded to the system through the RME’s web application. The deep learning model performs the classification for pothole detection from the uploaded images. Classified images of potholes are stored in the system’s database along with their locations and relevant information. RMEs retrieve detected potholes’ information and view them on a map. Additionally, they can update the status of these potholes based on the progress of their repair. On the other hand, RUs retrieve potholes’ information and locations based on their routes by overlaying the pothole locations on the map and displaying information about the number of detected potholes on their routes, thereby allowing RUs to avoid these potholes and preventing their impact on safety or vehicle condition.

4. PDS-UAV Development Methodology

In this section, the steps of the PDS-UAV development methodology are discussed. These steps include data gathering from target system users, system design based on the gathered data from target users, the deep learning model development, and finally the PDS-UAV system implementation. Jeddah City was chosen as the empirical focus of this study to detect potholes due to its rapidly growing urban infrastructure and heavy traffic. The city’s diverse range of road conditions, from high-traffic highways to less-maintained suburban streets, provides a suitable testing ground for evaluating a pothole detection system.

4.1. Data Gathering Methods

In this research, two data collection methods, an interview and a questionnaire, were employed. The interview is designed for road maintenance department employees to obtain insights into the current pothole reporting system from an expert perspective, identify the issues employees face with the current system, determine their needs, and outline what the new system should include. On the other hand, the questionnaire aims to gather information from road users about pothole-related issues, the current pothole reporting system, needed services, and the appearance of the system’s interfaces.

4.1.1. Road Maintenance Department Interview

A semi-structured interview, which consists of open-ended questions, was conducted with an employee from the information technology department (IT) at Jeddah municipality. The interview questions are as follows:
  • What is the current system used for detecting and reporting potholes?
  • How do you rate the overall performance of the current system?
  • How long does it take to receive information about a detected pothole?
  • Are there any issues with the current system? If yes, what are these issues?
  • How do you solve the current issues of the system?
  • Would a system that uses AI to detect potholes from UAV images be beneficial?
  • If your answer to the previous question is yes, what would be the impact of the new system on potholes detection and management?
  • Do you think adding a feature that allows road users to view potholes’ locations on a map would be beneficial for avoiding them?
When asked about the current system used for pothole detection, the interviewee explained that the current system for detecting and reporting potholes is integrated into the asphalt pavement condition monitoring system. This system relies on manual human scanning conducted by Jeddah municipality employees during their inspections.
In response to rating the overall performance of the current system, the interviewee stated that the system’s performance is acceptable, although it might have some challenges. Regarding the timing of receiving information about detected potholes, it was revealed that field employees typically report their detected potholes at the end of the day, which depends on encountered potholes during their inspections. When addressing the issues and challenges of the current system, the interviewee acknowledged that even though the system is functioning adequately, it faces issues primarily due to human-induced delays and errors. Manual detection is limited by the number of available employees and their ability to efficiently scan large areas of the road network. The reliance on the chance of encountering potholes further limits the system’s effectiveness. Additionally, human errors can lead to decreased operational efficiency and potential inaccuracies in the detection. Additionally, the interviewee suggested that increasing the number of employees performing manual inspections could help to reduce detection delays.
Responding to the question about having a new system that detects potholes using AI and UAV images, the interviewee revealed that incorporating such a system would be highly beneficial. It was explained that such a system would aid employees by allowing them to cover larger areas of the road network quickly and safely, especially in big cities and congested main streets. This would accelerate pothole reporting and repairs. Moreover, using AI would help to minimize human errors associated with the current manual system. Furthermore, the interviewee expressed strong support for adding a feature that allows road users to view the locations of detected potholes in order to avoid them. A mobile interface for locating potholes would be particularly advantageous for road users, providing contextual information to enhance their travel safety.

4.1.2. Road Users Questionnaire

A questionnaire was distributed to road users to gather insights based on their daily experiences. This questionnaire was created using Google Forms and was composed of eight questions. Responses were received from 101 participants. The questions were categorized into three sections, each targeting a specific issue. An overview of the questionnaire and the collected data are shown in Table 2.
The survey data reveals that potholes are a significant concern for drivers, with 88.2% reporting that potholes cause damage to their vehicles and 99% believing that potholes can lead to accidents. Nearly 80% of the participants had recently encountered potholes, and 83.2% expressed interest in an application to view nearby potholes. Additionally, 75% of participants felt that they would benefit from such an application, with 59% preferring a mobile interface and suggesting features like ease of use, the ability to comment on potholes, warning signs, and reporting capabilities to the municipality.

4.2. PDS-UAV System Requirements

Based on the reviewed literature and the data gathered from the target users, this section outlines the main requirements necessary for the successful implementation and operation of the proposed system, PDS-UAV. It details the functional requirements for both road maintenance employees and road users. Additionally, the software, hardware, and database requirements necessary to support the system’s functionality are elaborated upon.

4.2.1. Functional Requirements

For RMEs, the proposed system will incorporate a deep learning model into a web-based application, designed to streamline pothole management. The system should allow authorized users to log in, upload pothole images, and store their locations using GPS. It should classify images to determine whether they depict potholes and store the classified images in a database for future reference. The system should display the locations of detected potholes on a map, count potholes based on their status, and provide a search function. Users should be able to update pothole statuses, ensuring up-to-date information. Finally, the system should include a logout function for user security. For the RUs, the system is a web-based application with specific features and requirements to improve the users’ experience and safety on the roads. The system should inform road users of nearby detected potholes based on their routes. It should display the locations of detected potholes on a map, allowing users to navigate from their current location to a chosen destination while avoiding potential hazards.

4.2.2. Software, Hardware, and Database Requirements

The PDS-UAV system includes three main components: the deep learning model, the web application, and the database. Python was used for the deep learning model, hypertext markup language (HTML), cascading style sheets (CSSs), JavaScript were used for the web application, and Firebase was used for the database. The hardware equipment needed for the proposed system includes a UAV to fly over roads and capture images to determine whether they contain potholes or not. A Laptop or PC is used to perform training and testing on the dataset. Additionally, a laptop (or PC) and a smartphone are required to run the applications. In the PDS-UAV system, a database is needed to store information and images of potholes, as well as the credential information for the employees at the road maintenance department in Jeddah municipality. The road maintenance department employees should have an email and password to access the system’s database. The data requirements for the RME include the employee’s first name, last name, password, phone number, and email. The pothole data requirements include latitude and longitude for geography, which describe the pothole location coordinates; an image of the pothole; the pothole’s district location name; and the pothole status.

4.3. System Design

The system design of PDS-UAV is presented in the following subsections using a use case diagram, activity diagrams, and sequence diagrams.

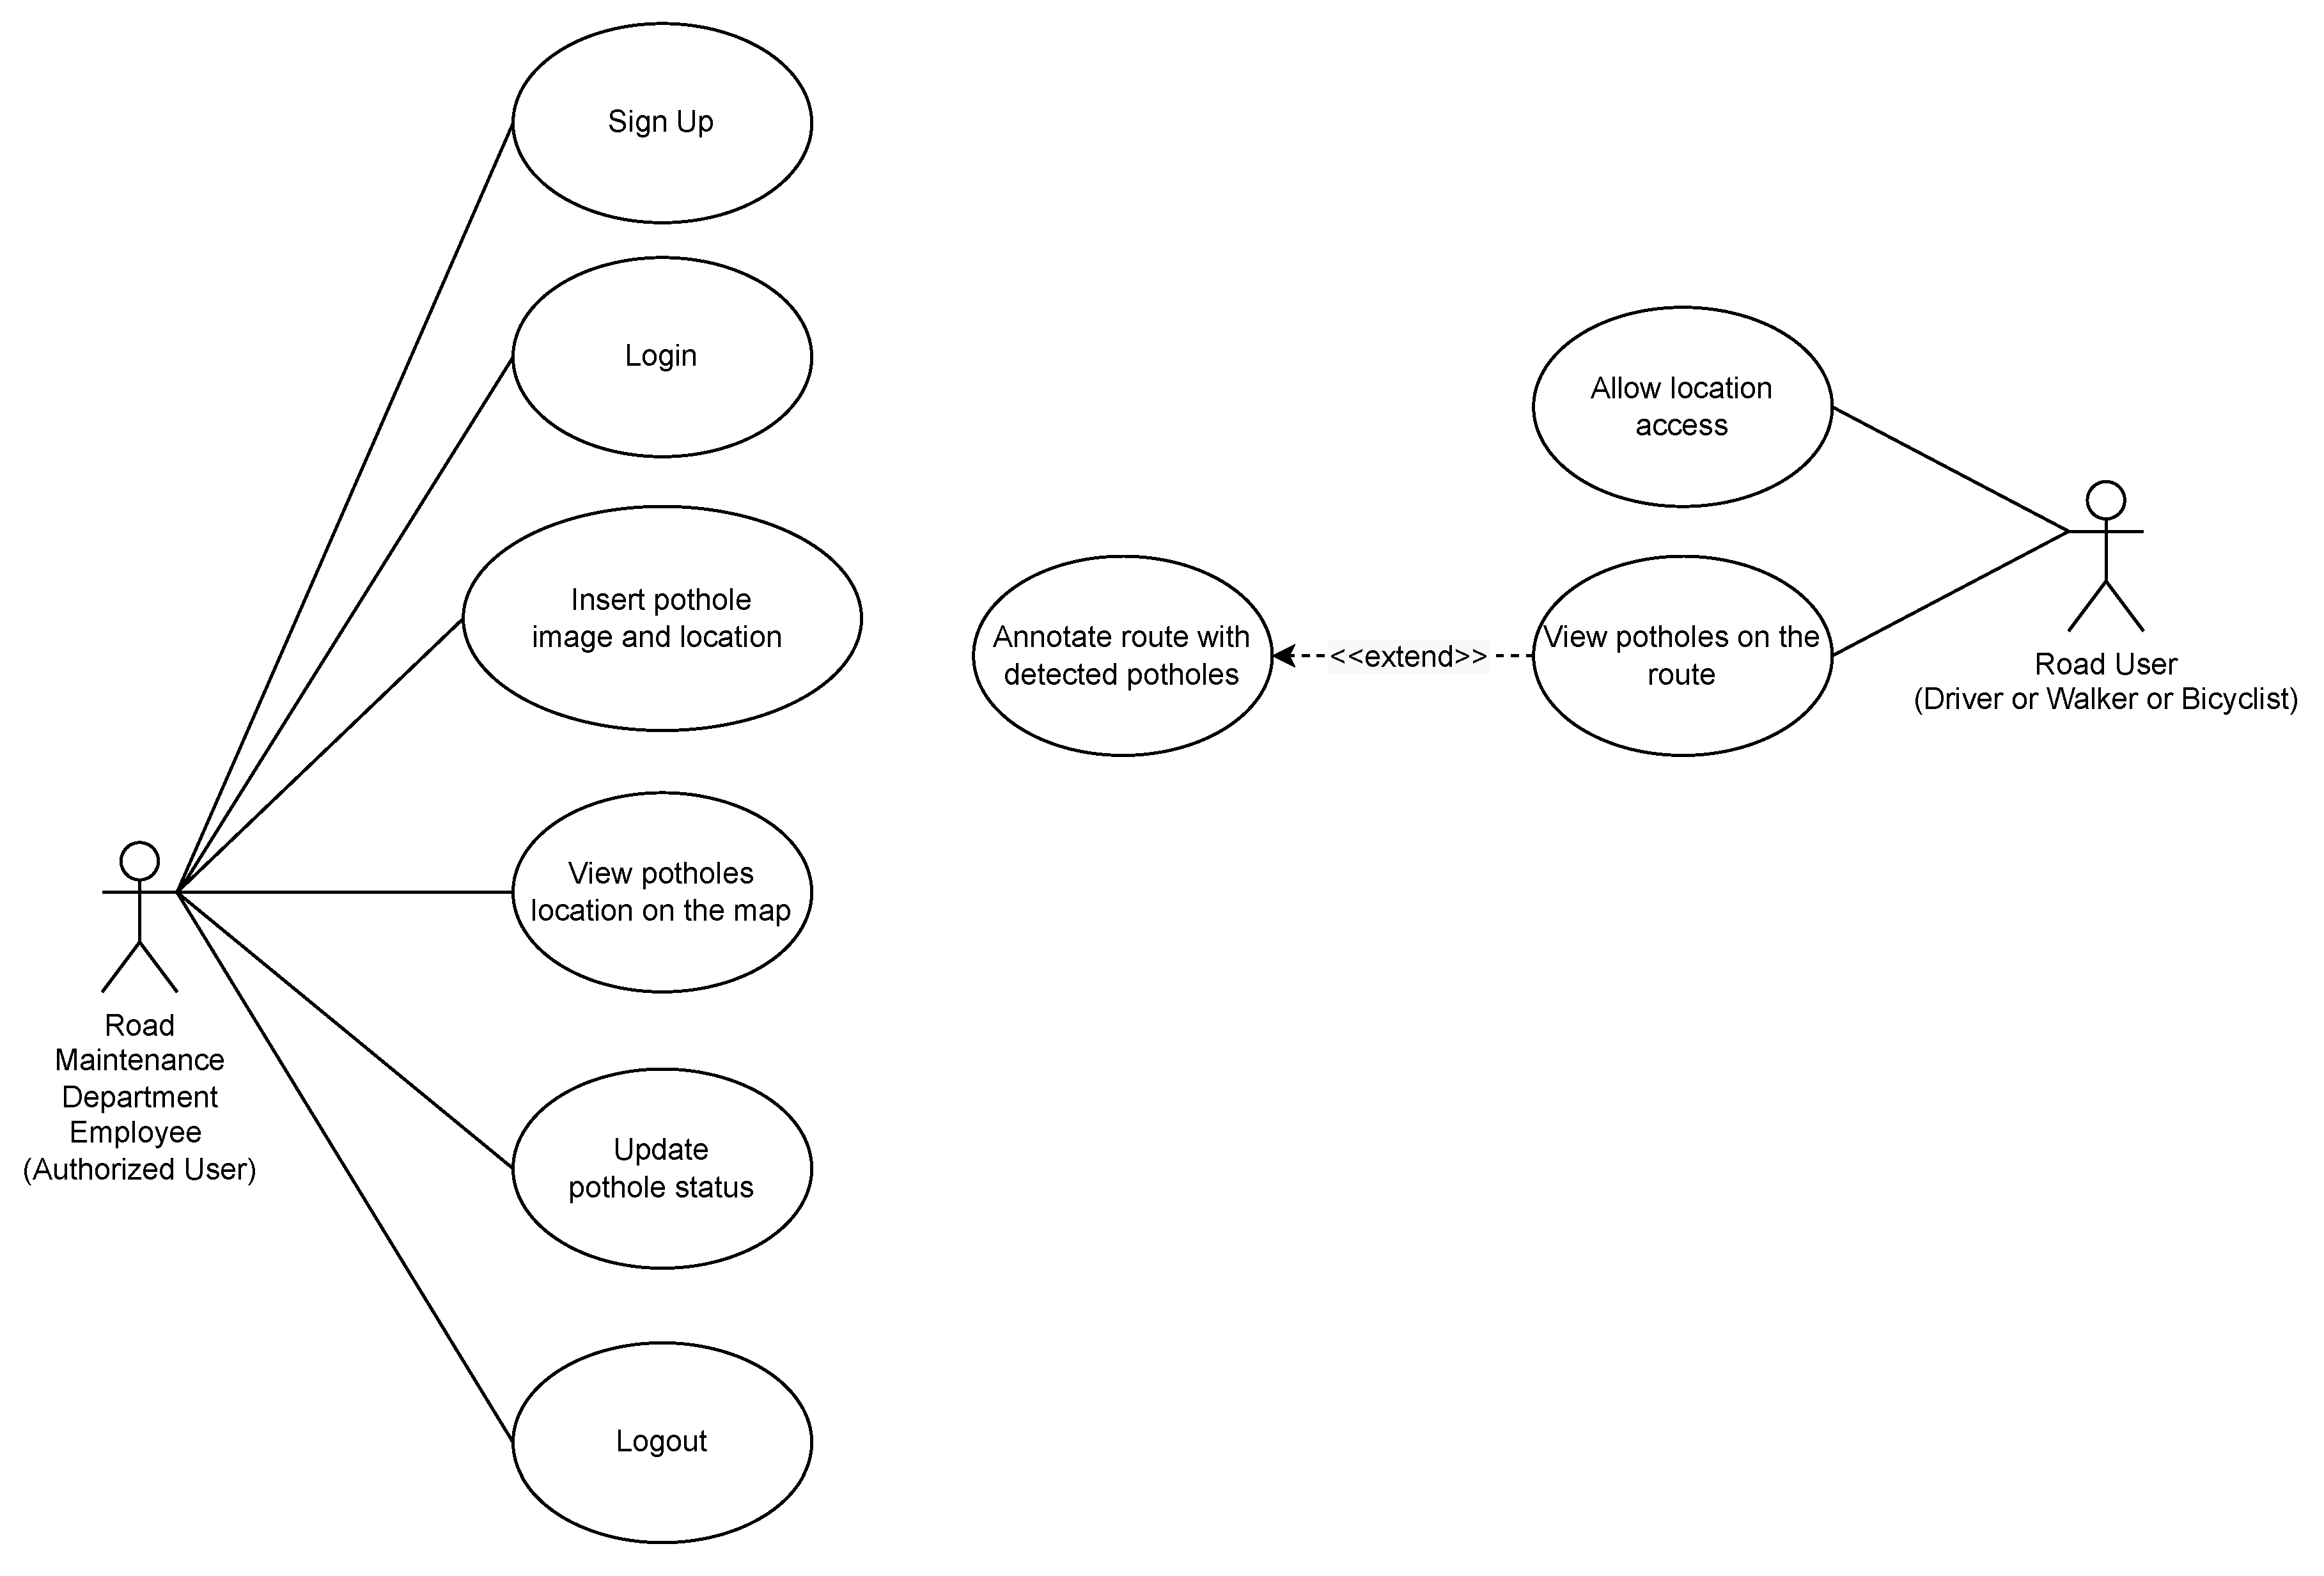
4.3.1. Use Case Diagram

Figure 2 illustrates the use case diagram for the PDS-UAV system, highlighting the interactions between the system and its users. There are two primary user types: the RMEs at Jeddah municipality, and the RUs (driver, walker, or bicyclist). Each has different processes to run the entire PDS-UAV system. The RMEs sign up, log into the system, upload images and locations of potholes they encounter, view the locations of detected potholes on a map, update the status of potholes after maintenance, and log out of the system. The RUs allow the system to access their locations and view information about nearby potholes.

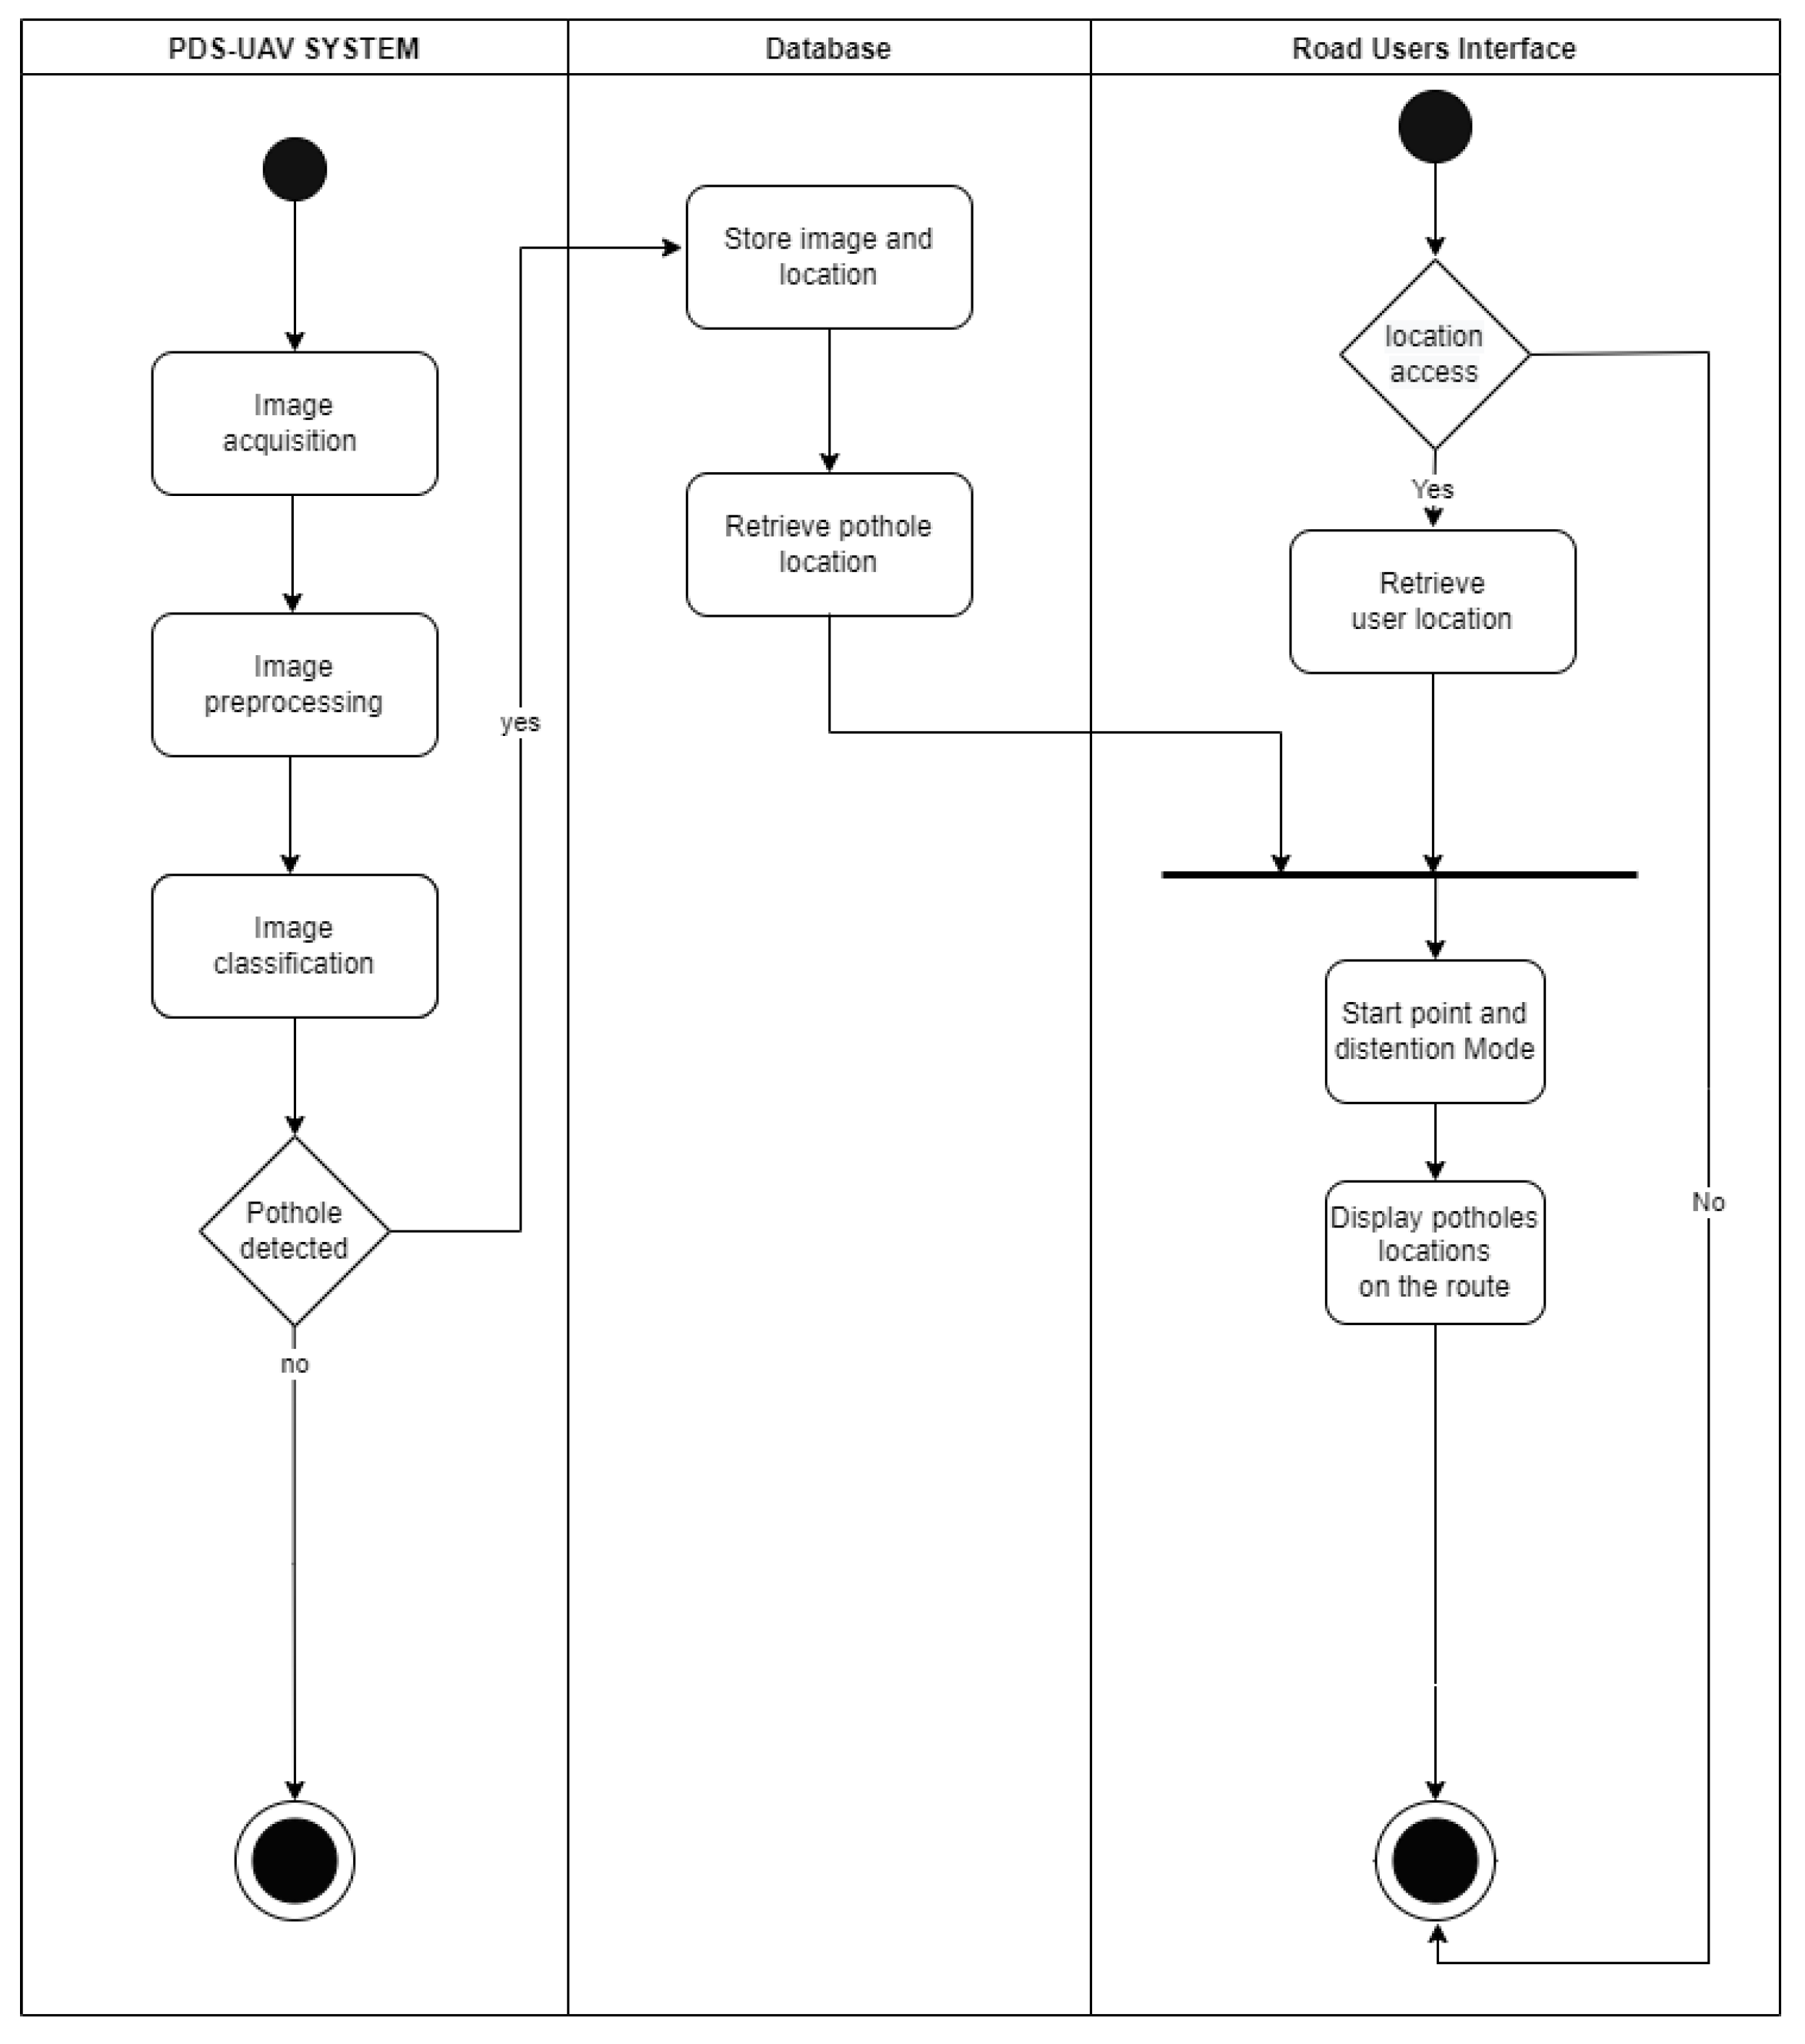
4.3.2. Activity Diagrams

Figure 3 and Figure 4 illustrate the activity diagrams of the system. In Figure 3, the system starts by acquiring images to determine whether they include potholes. Next, image preprocessing techniques are applied to ensure compatibility with the deep learning model. Then, the classification phase begins. If an image is classified as a pothole, it is stored in the database. Otherwise, it is discarded. In the RME’s interface, authorized users log in and can perform various functions within the application. These functions include viewing potholes on the map and updating pothole statuses, which range from ‘Waiting for repair’ to ‘Under progress’ to ‘Repaired’. Unauthorized users cannot access the application. Finally, when users log out, the system session ends.
In Figure 4, the user is asked to allow location access. If the user allows location access, the pothole locations are retrieved from the database. The RUs enter their starting and destination points. The system then displays a map showing the users’ route annotated with all the detected potholes.

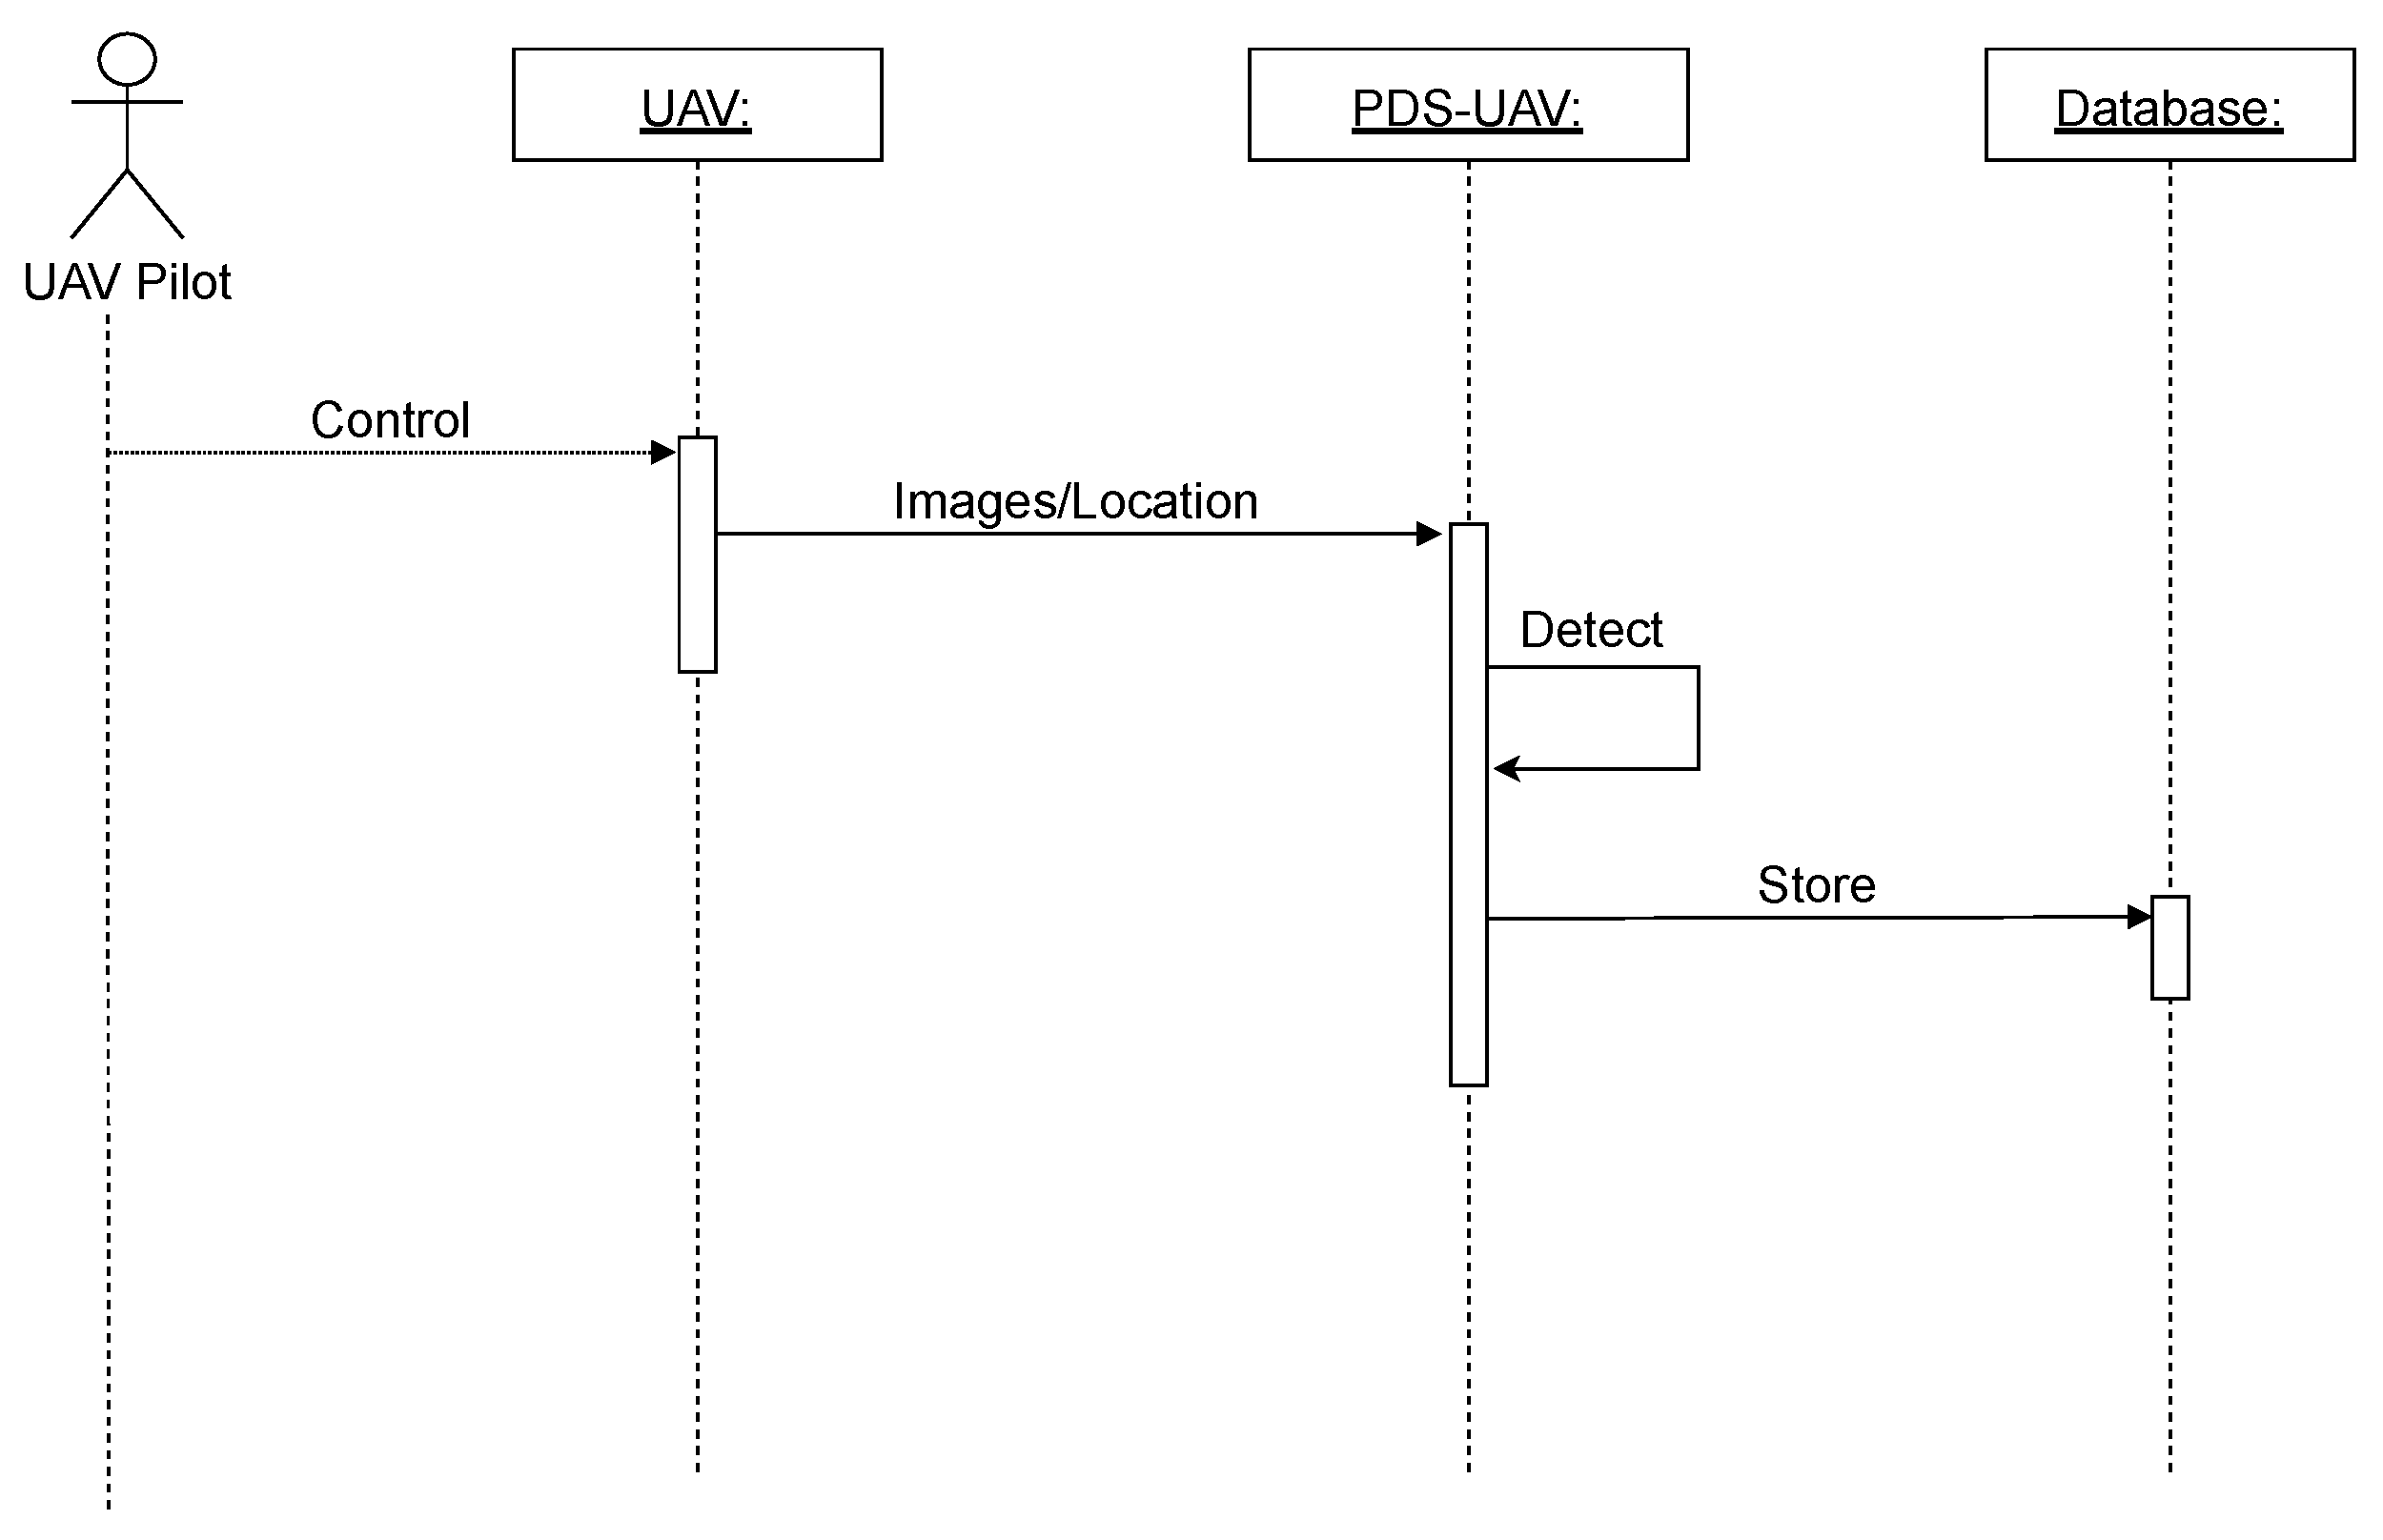
4.3.3. Sequence Diagrams

Figure 5 illustrates the sequence diagram of the PDS-UAV system. The UAV pilot is an RME, who controls the UAV flight and uploads images of the road surface to the system to detect potholes from these images. If a pothole is detected, its information, including the image and location, is stored in the database.
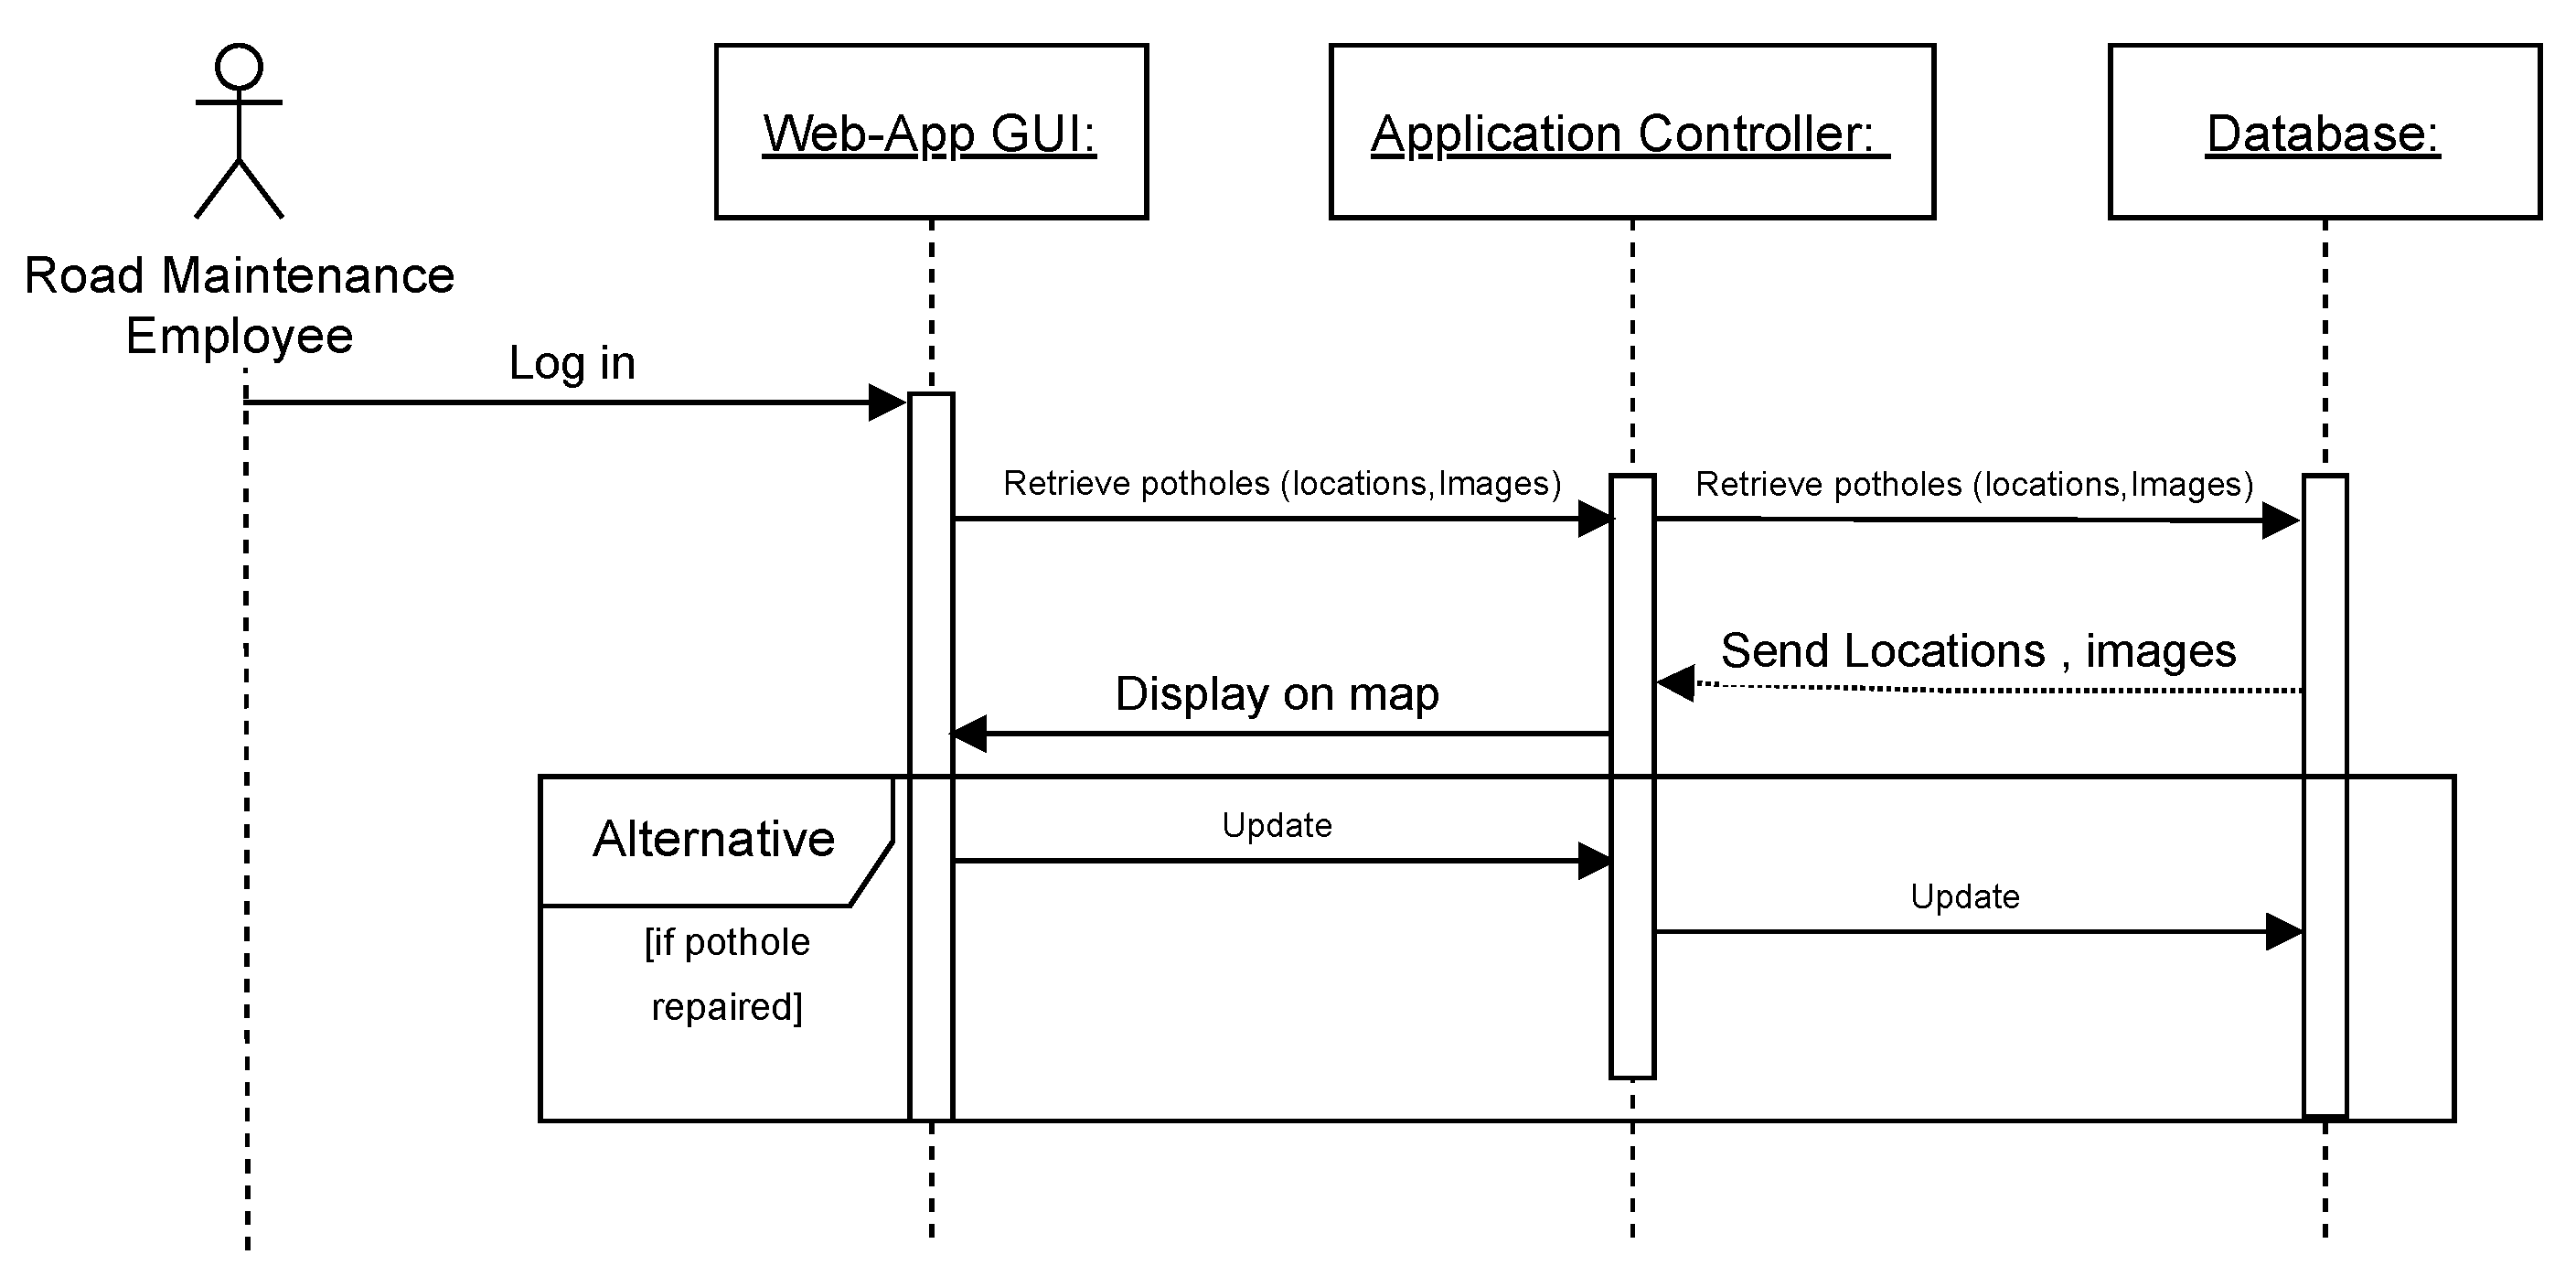
The RMEs log in and retrieve pothole information from the database, which can be viewed on the map or in the list view. In addition, they update the pothole statuses based on their repairs. The application controller enables the communication between the web app GUI and the database, as seen in Figure 6.
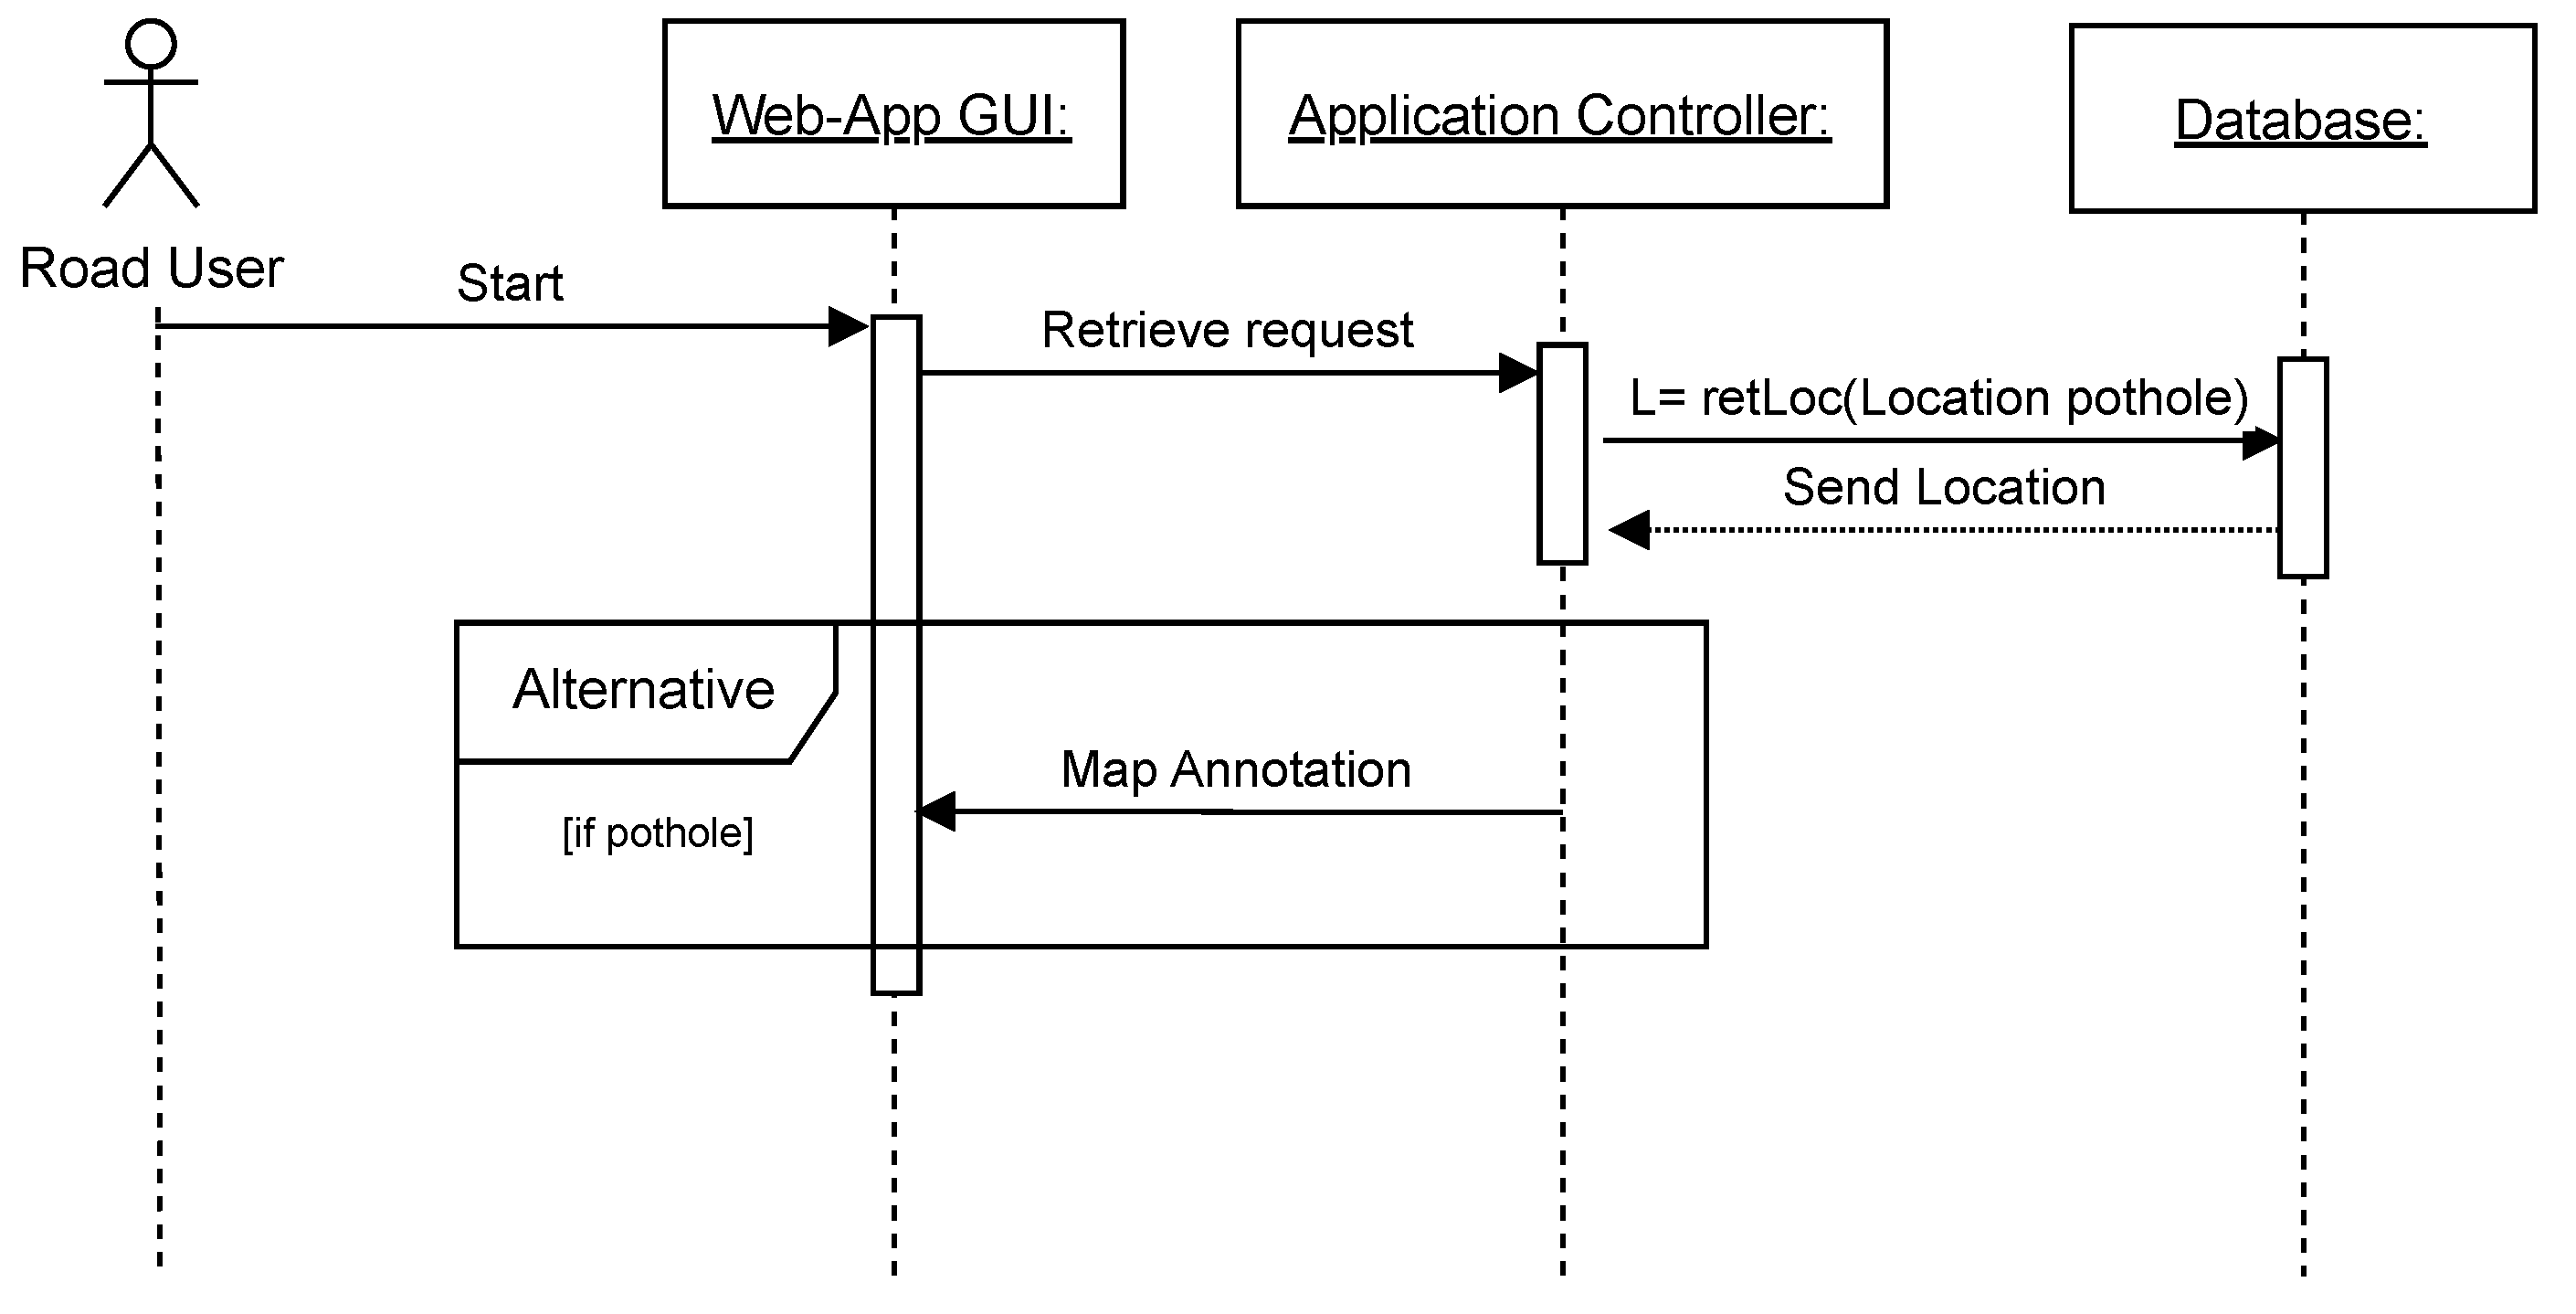
Figure 7 illustrates the sequence diagram for the RUs. The user begins by being asked to allow their location and entering the starting and destination points. If the user allows location access, the pothole locations are retrieved from the database. After retrieving the pothole locations, the system informs the user about detected potholes by annotating the map with the potholes’ locations.

4.4. PDS-UAV System Implementation

The development of the system required various technologies for both the front end and back end of the application. HTML and CSS are the main languages used for developing the front end of the web application. HTML is used for designing and structuring pages, while CSS is used for the styling and formatting. Additionally, Bootstrap is used as an add-on that provides easy-to-use templates to simplify styling and design. JavaScript (ES6) is employed for specific commands, such as inserting an interactive map on the interface. Finally, Python v3.9 and Flask v2.1 tools and libraries are used to build the web framework and link it with the deep learning model. These technologies have been used within Visual Studio Code, an application for coding and developing interfaces. In addition, Firebase is used as a back-end service that helps to gain access to the shared data and store the data in JSON documents. Firestore is utilized as a flexible NoSQL database within the cloud-based Firebase platform.
The welcome page shown in Figure 8 appears when the users enter the website. On this page, multiple options are displayed for the user to choose from. The user can view the system’s goals, sign up as RME, or use the system services as a road user.

4.4.1. RMEs Web Application

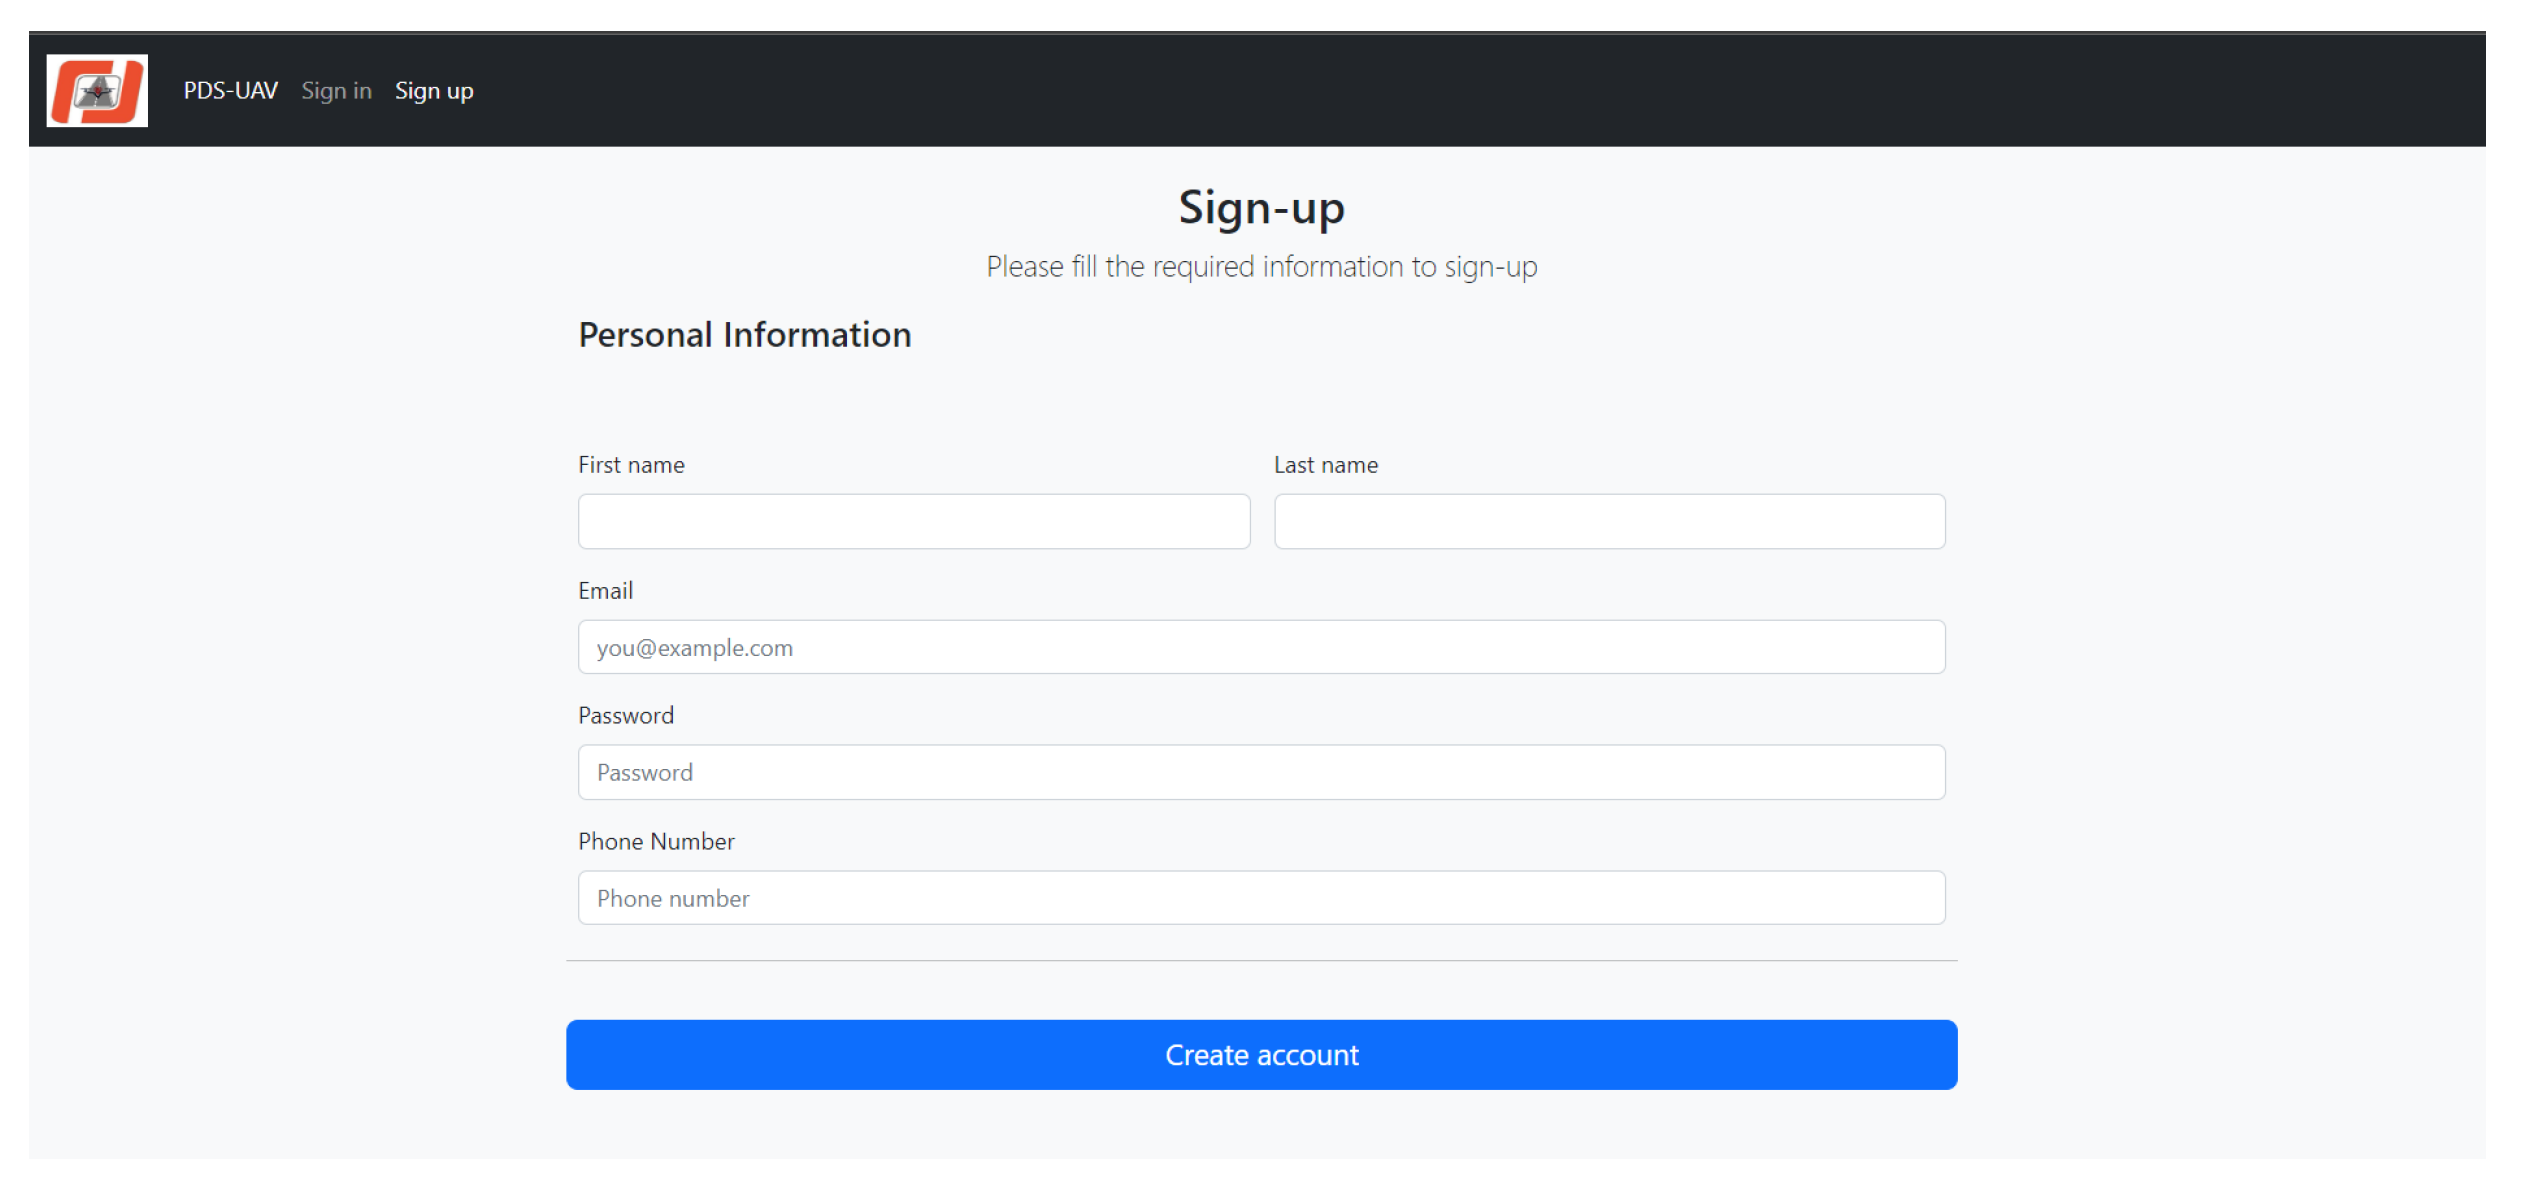
The web application is composed of the following components: sign up, sign-in, add a new pothole, and update. The sign up functionality, shown in Figure 9, allows RMEs to create a new account by filling out the required information. Validation of the user input is crucial to ensure that the entered data are correct and complete and meet the required format, thereby preventing errors and improving the overall user experience. Validation is implemented on both the client side and server side of the application. Client-side validation, performed using JavaScript, provides immediate feedback to the user and includes checks for required fields and correct data types. Server-side validation is performed on the server to confirm the data’s validity before saving it to the database. This dual-layer validation approach at the client and server sides helps maintain data integrity and enhances the reliability of the system.
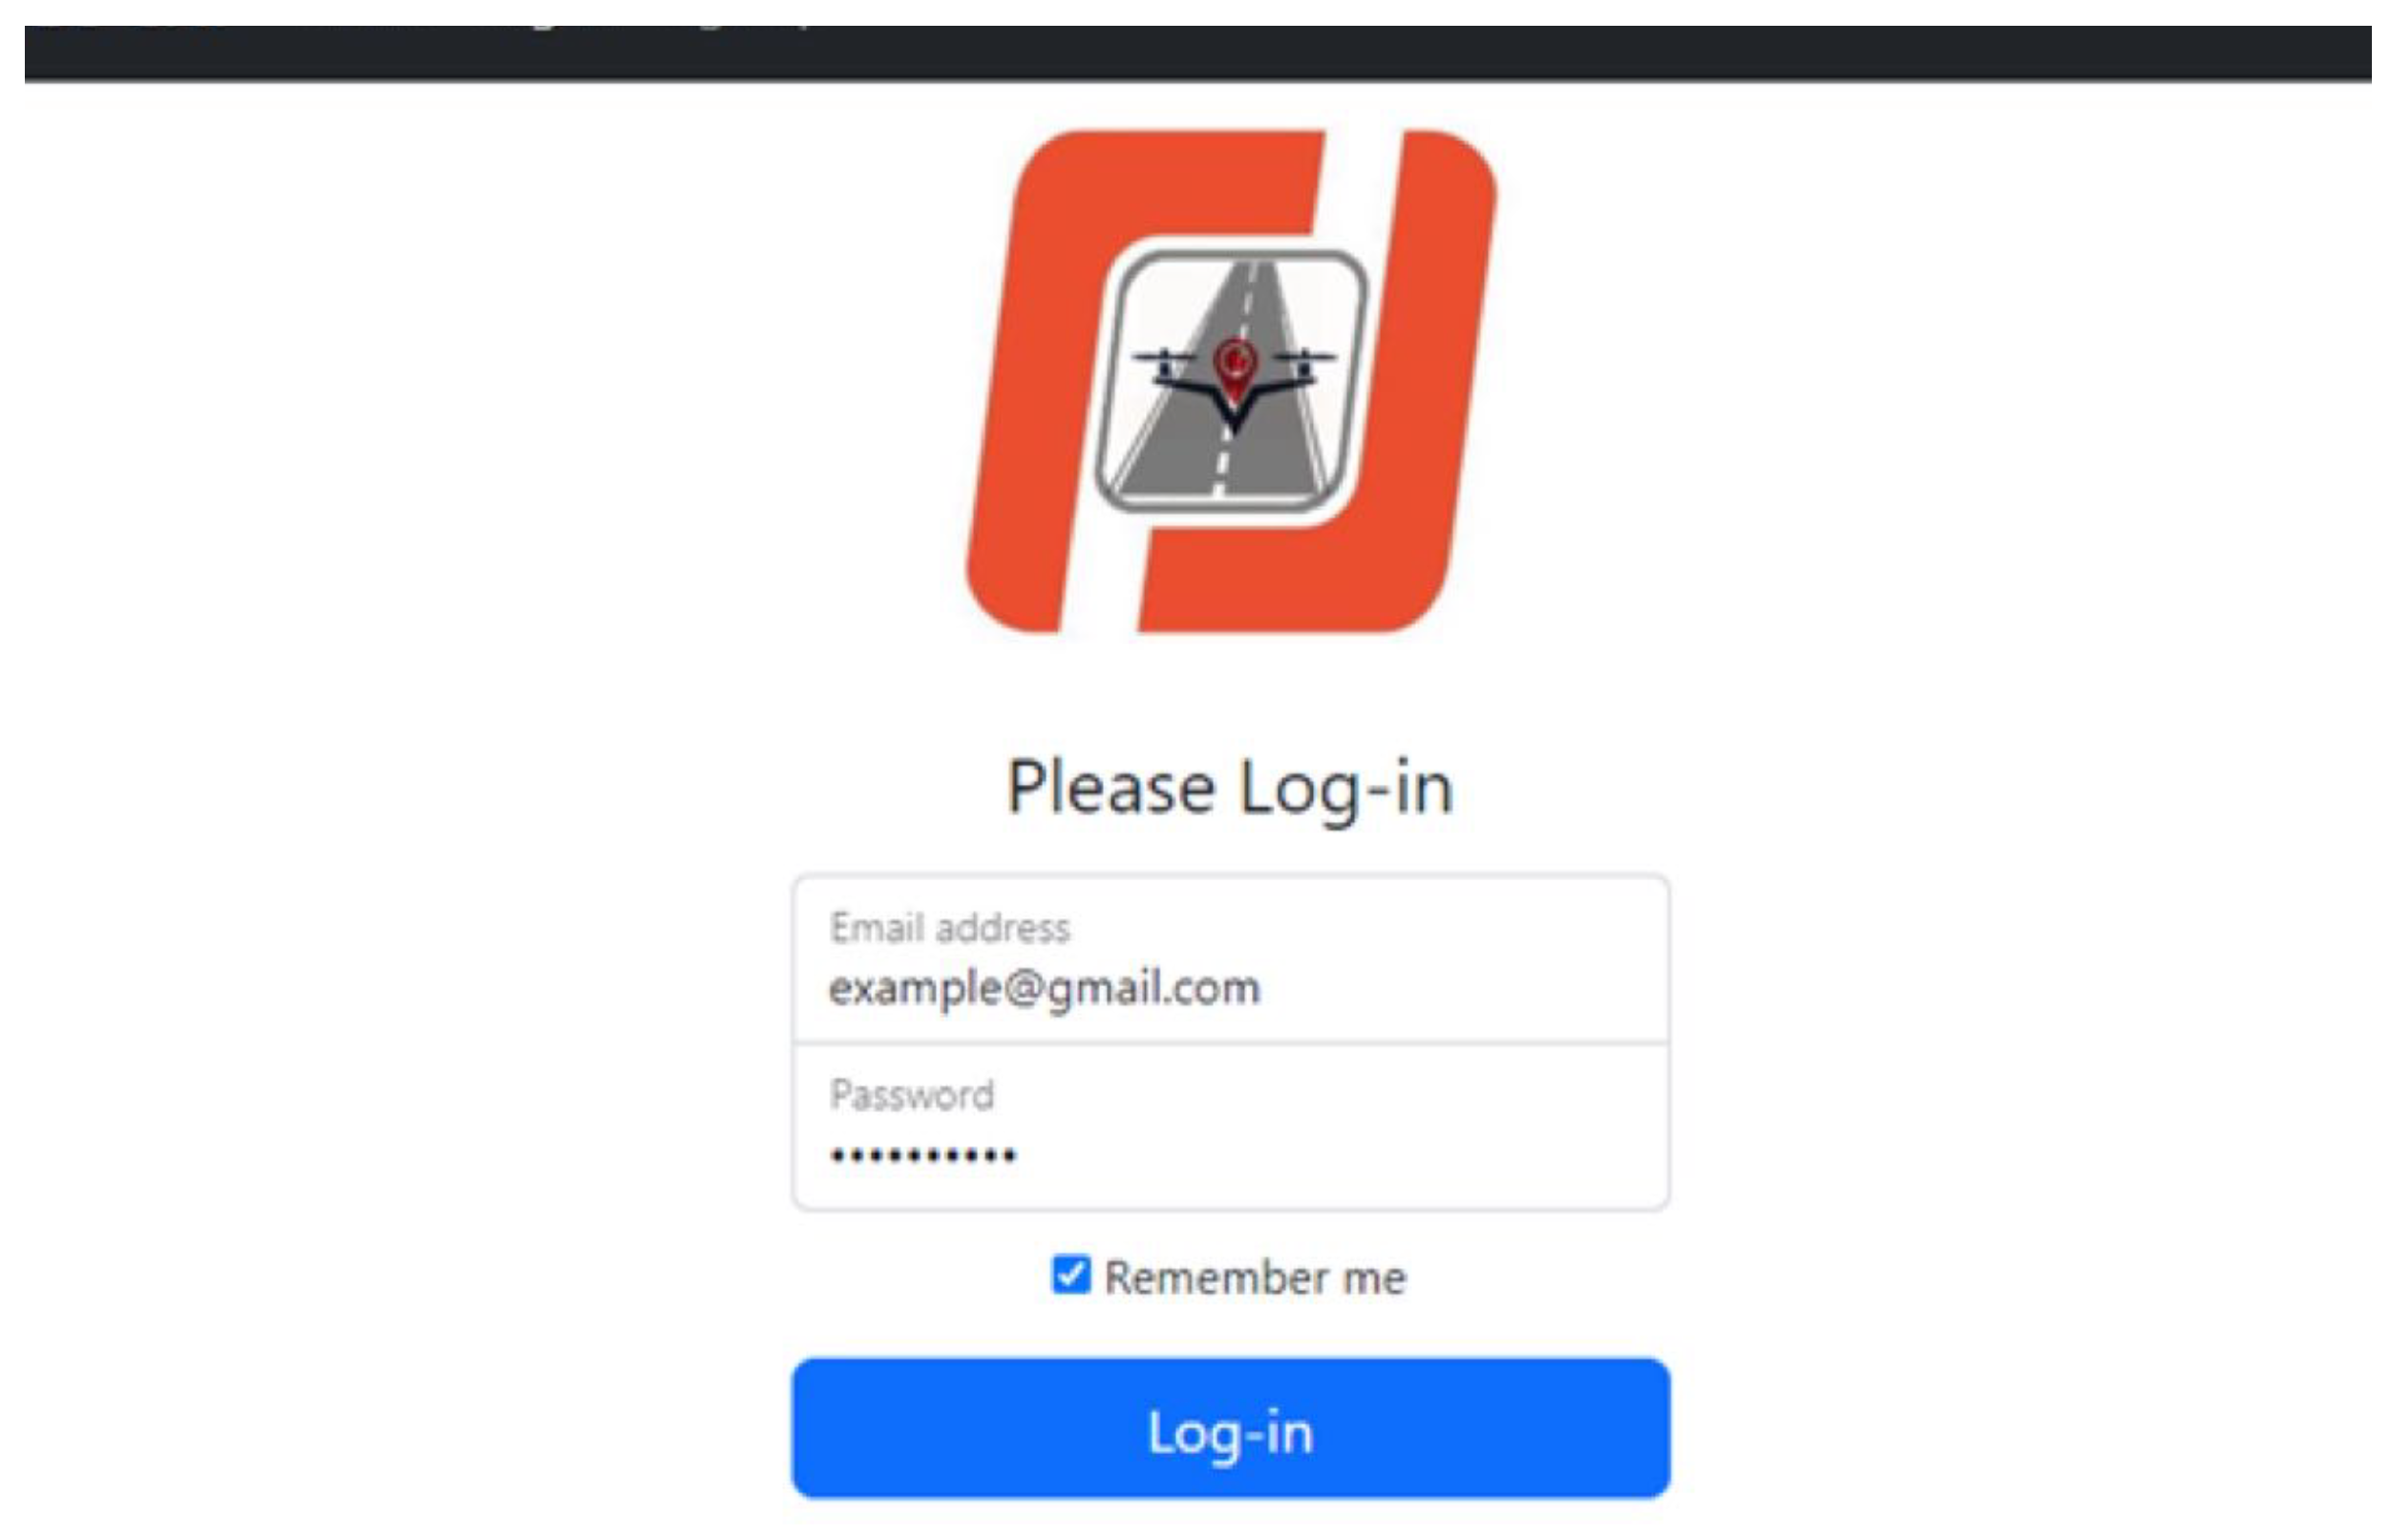
On the sign-in page, shown in Figure 10, the RMEs enter their already registered e-mails and passwords to gain access to their accounts and use the application’s services, which include adding new potholes information and updating the status of stored potholes. If the entered email and password match a registered user in Firestore, the user is authenticated and granted access to the application. Otherwise, the user is denied from accessing the system.
Figure 11 shows the main home page of the RUs web application. The upper part shown in Figure 11a includes statistics about the detected potholes, categorizing them into those that are waiting for repair, in-progress, or already repaired. Additionally, it features a map displaying the locations of detected potholes. This map is implemented using the Google Maps application programming interface (API), which is integrated into the system. To embed a Google map on the website, a JavaScript is used to interact with the Google Maps API. The API provides the necessary functions and methods to display the map, add markers, handle user interactions, and customize the map’s appearance and behavior. In addition, CSS is used to style the map container and ensure it fits correctly within the website’s layout. Potholes’ coordinates are retrieved from Firestore and represented using markers on the map. Users can update pothole information by clicking on each marker. This interactive functionality enable users to easily manage and monitor pothole statuses directly from the home page.
The lower part of the home page, shown in Figure 11b, presents an HTML table, displaying the information about potholes currently stored in the Firestore database. This table helps present pothole information in a structured and organized manner, facilitating easy access and updates by the RMEs. The table includes details such as the pothole’s location, status, and relevant notes, allowing RMEs to efficiently manage and monitor the progress of pothole repairs. JavaScript is used to retrieve the potholes’ information from Firestore and create a table dynamically based on the retrieved data. This combined view of the map and table ensures that users have a comprehensive overview of the potholes and their statuses, enhancing the functionality and user experience of the home page.
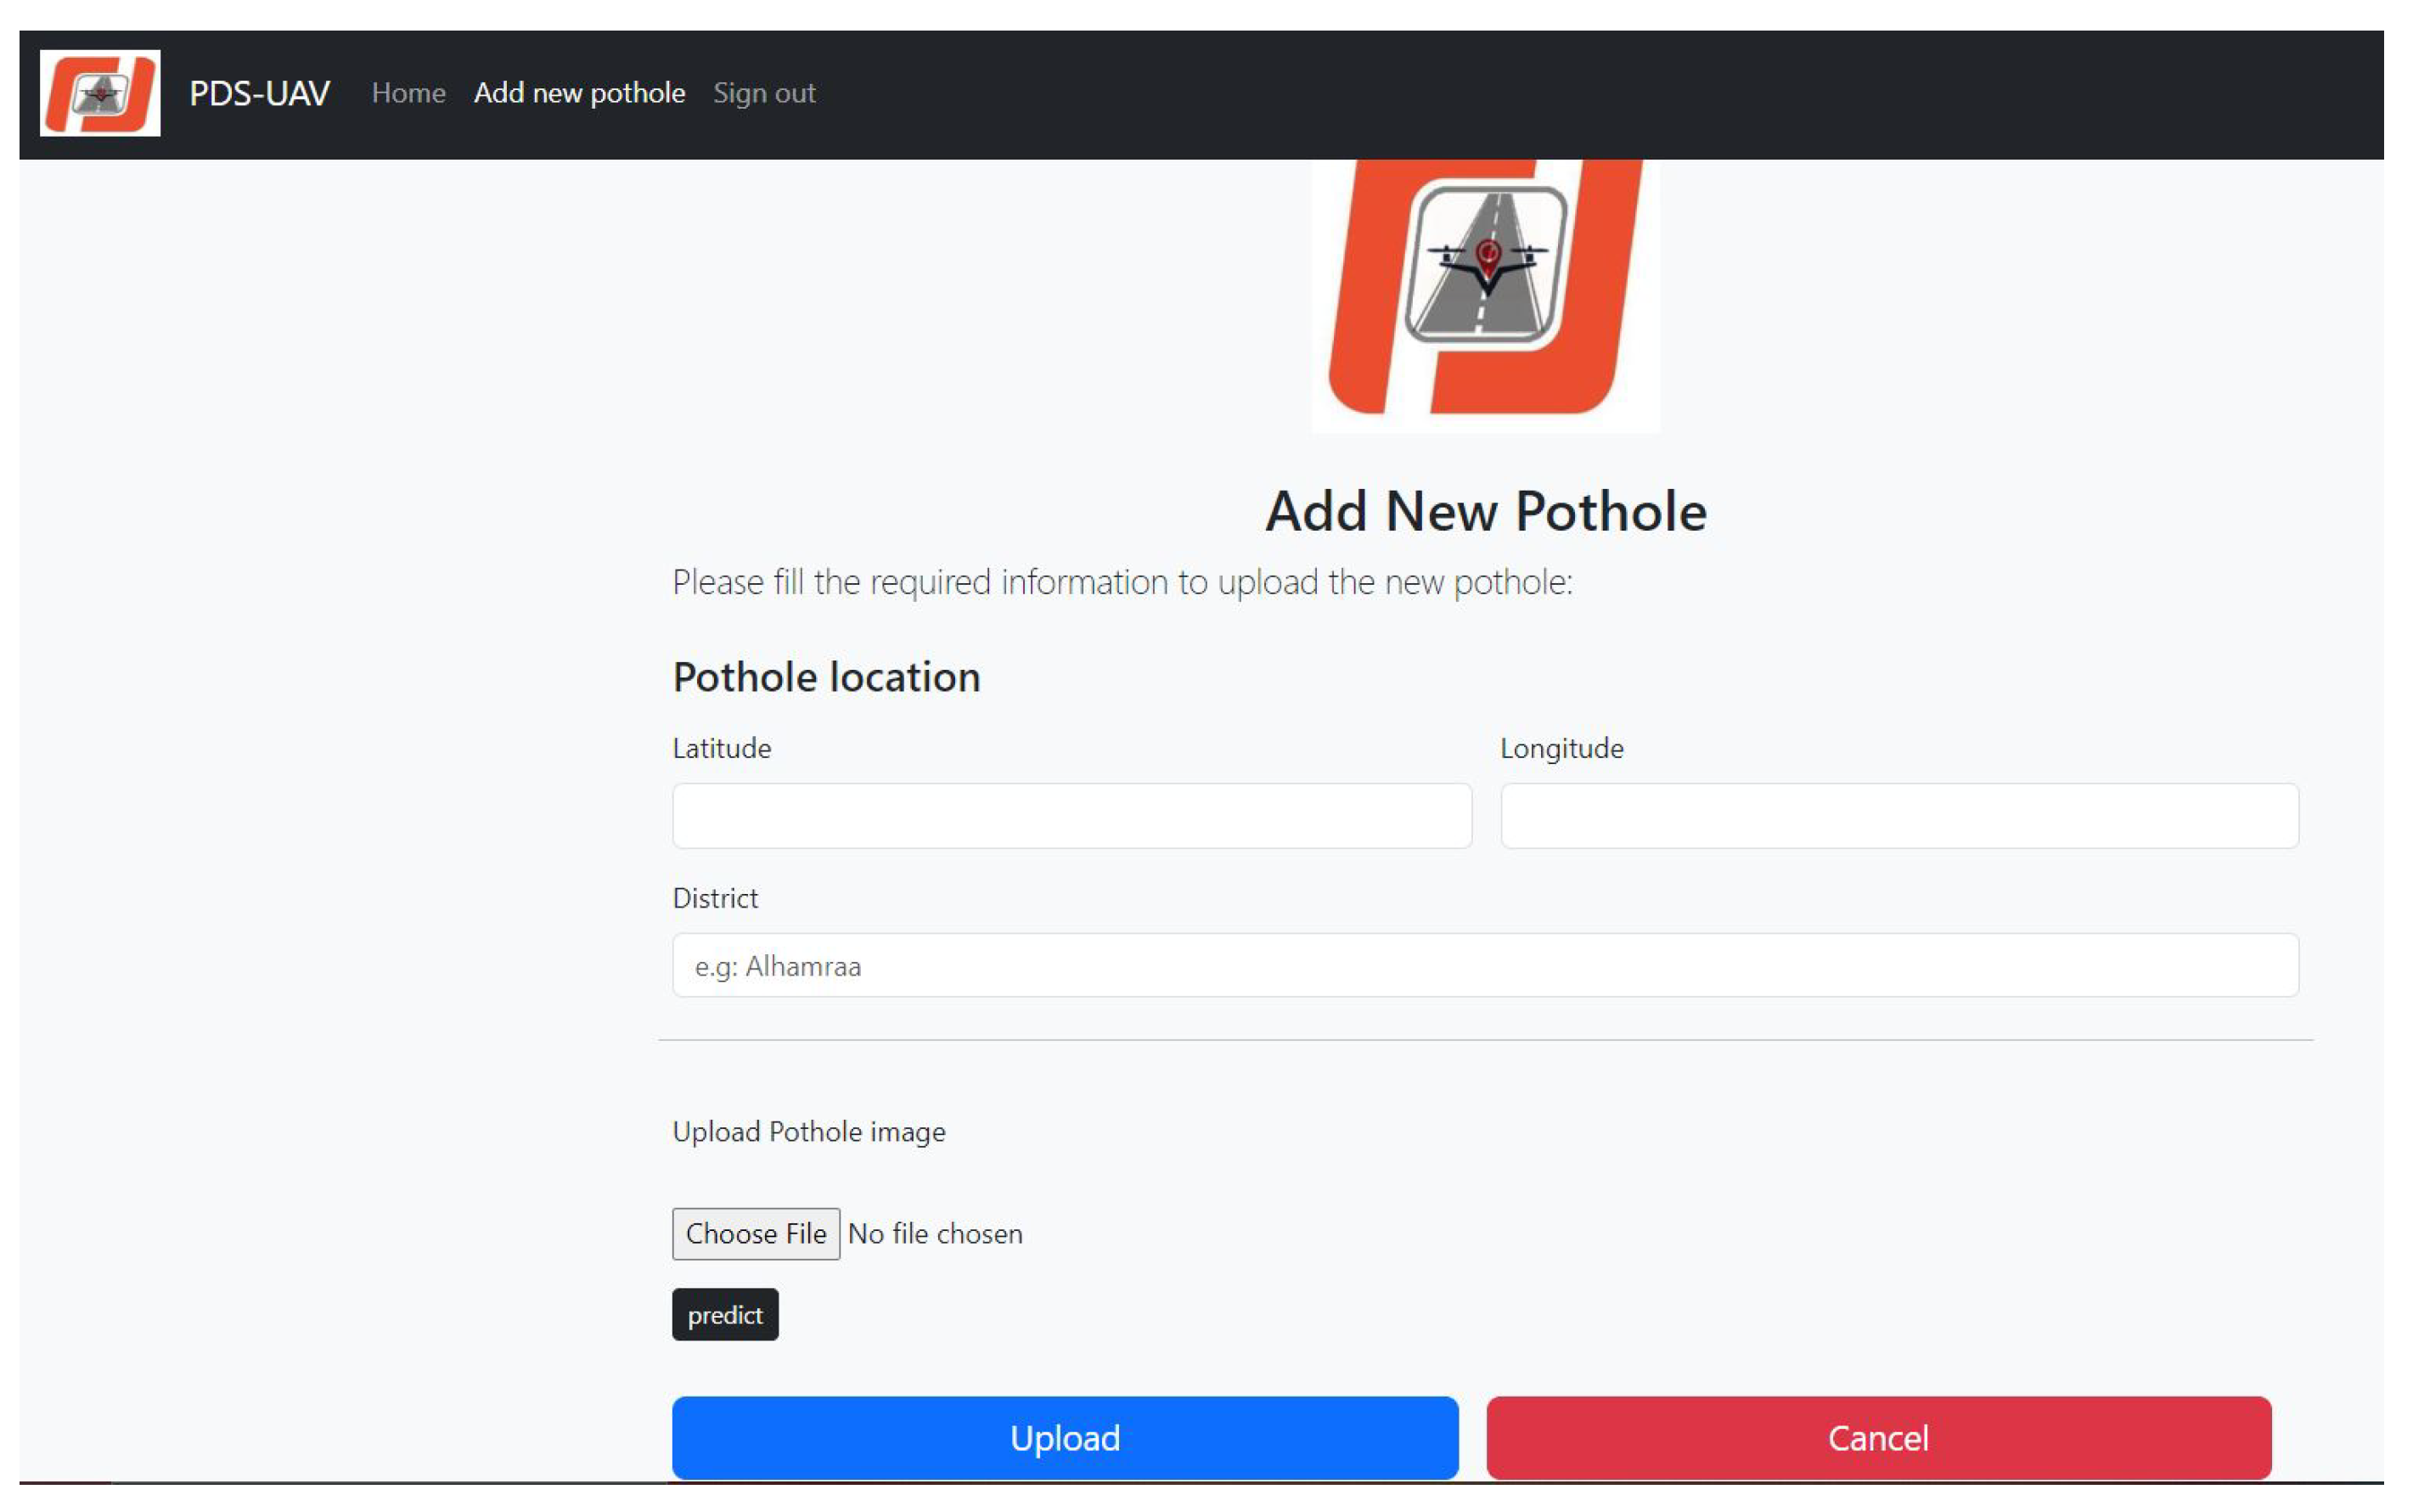
Figure 12 shows the interface for adding new pothole information. RMEs add new pothole information by entering the coordinates and district and uploading an image. When the user enters the pothole information and presses the predict button to classify the image using the deep learning model, the classified image will appear as shown in Figure 13, with the pothole location marked on that image. The detected pothole information is stored in the database for further retrieval and processing. These potholes are then displayed on the map using markers and are presented in the potholes table for easy access and management.
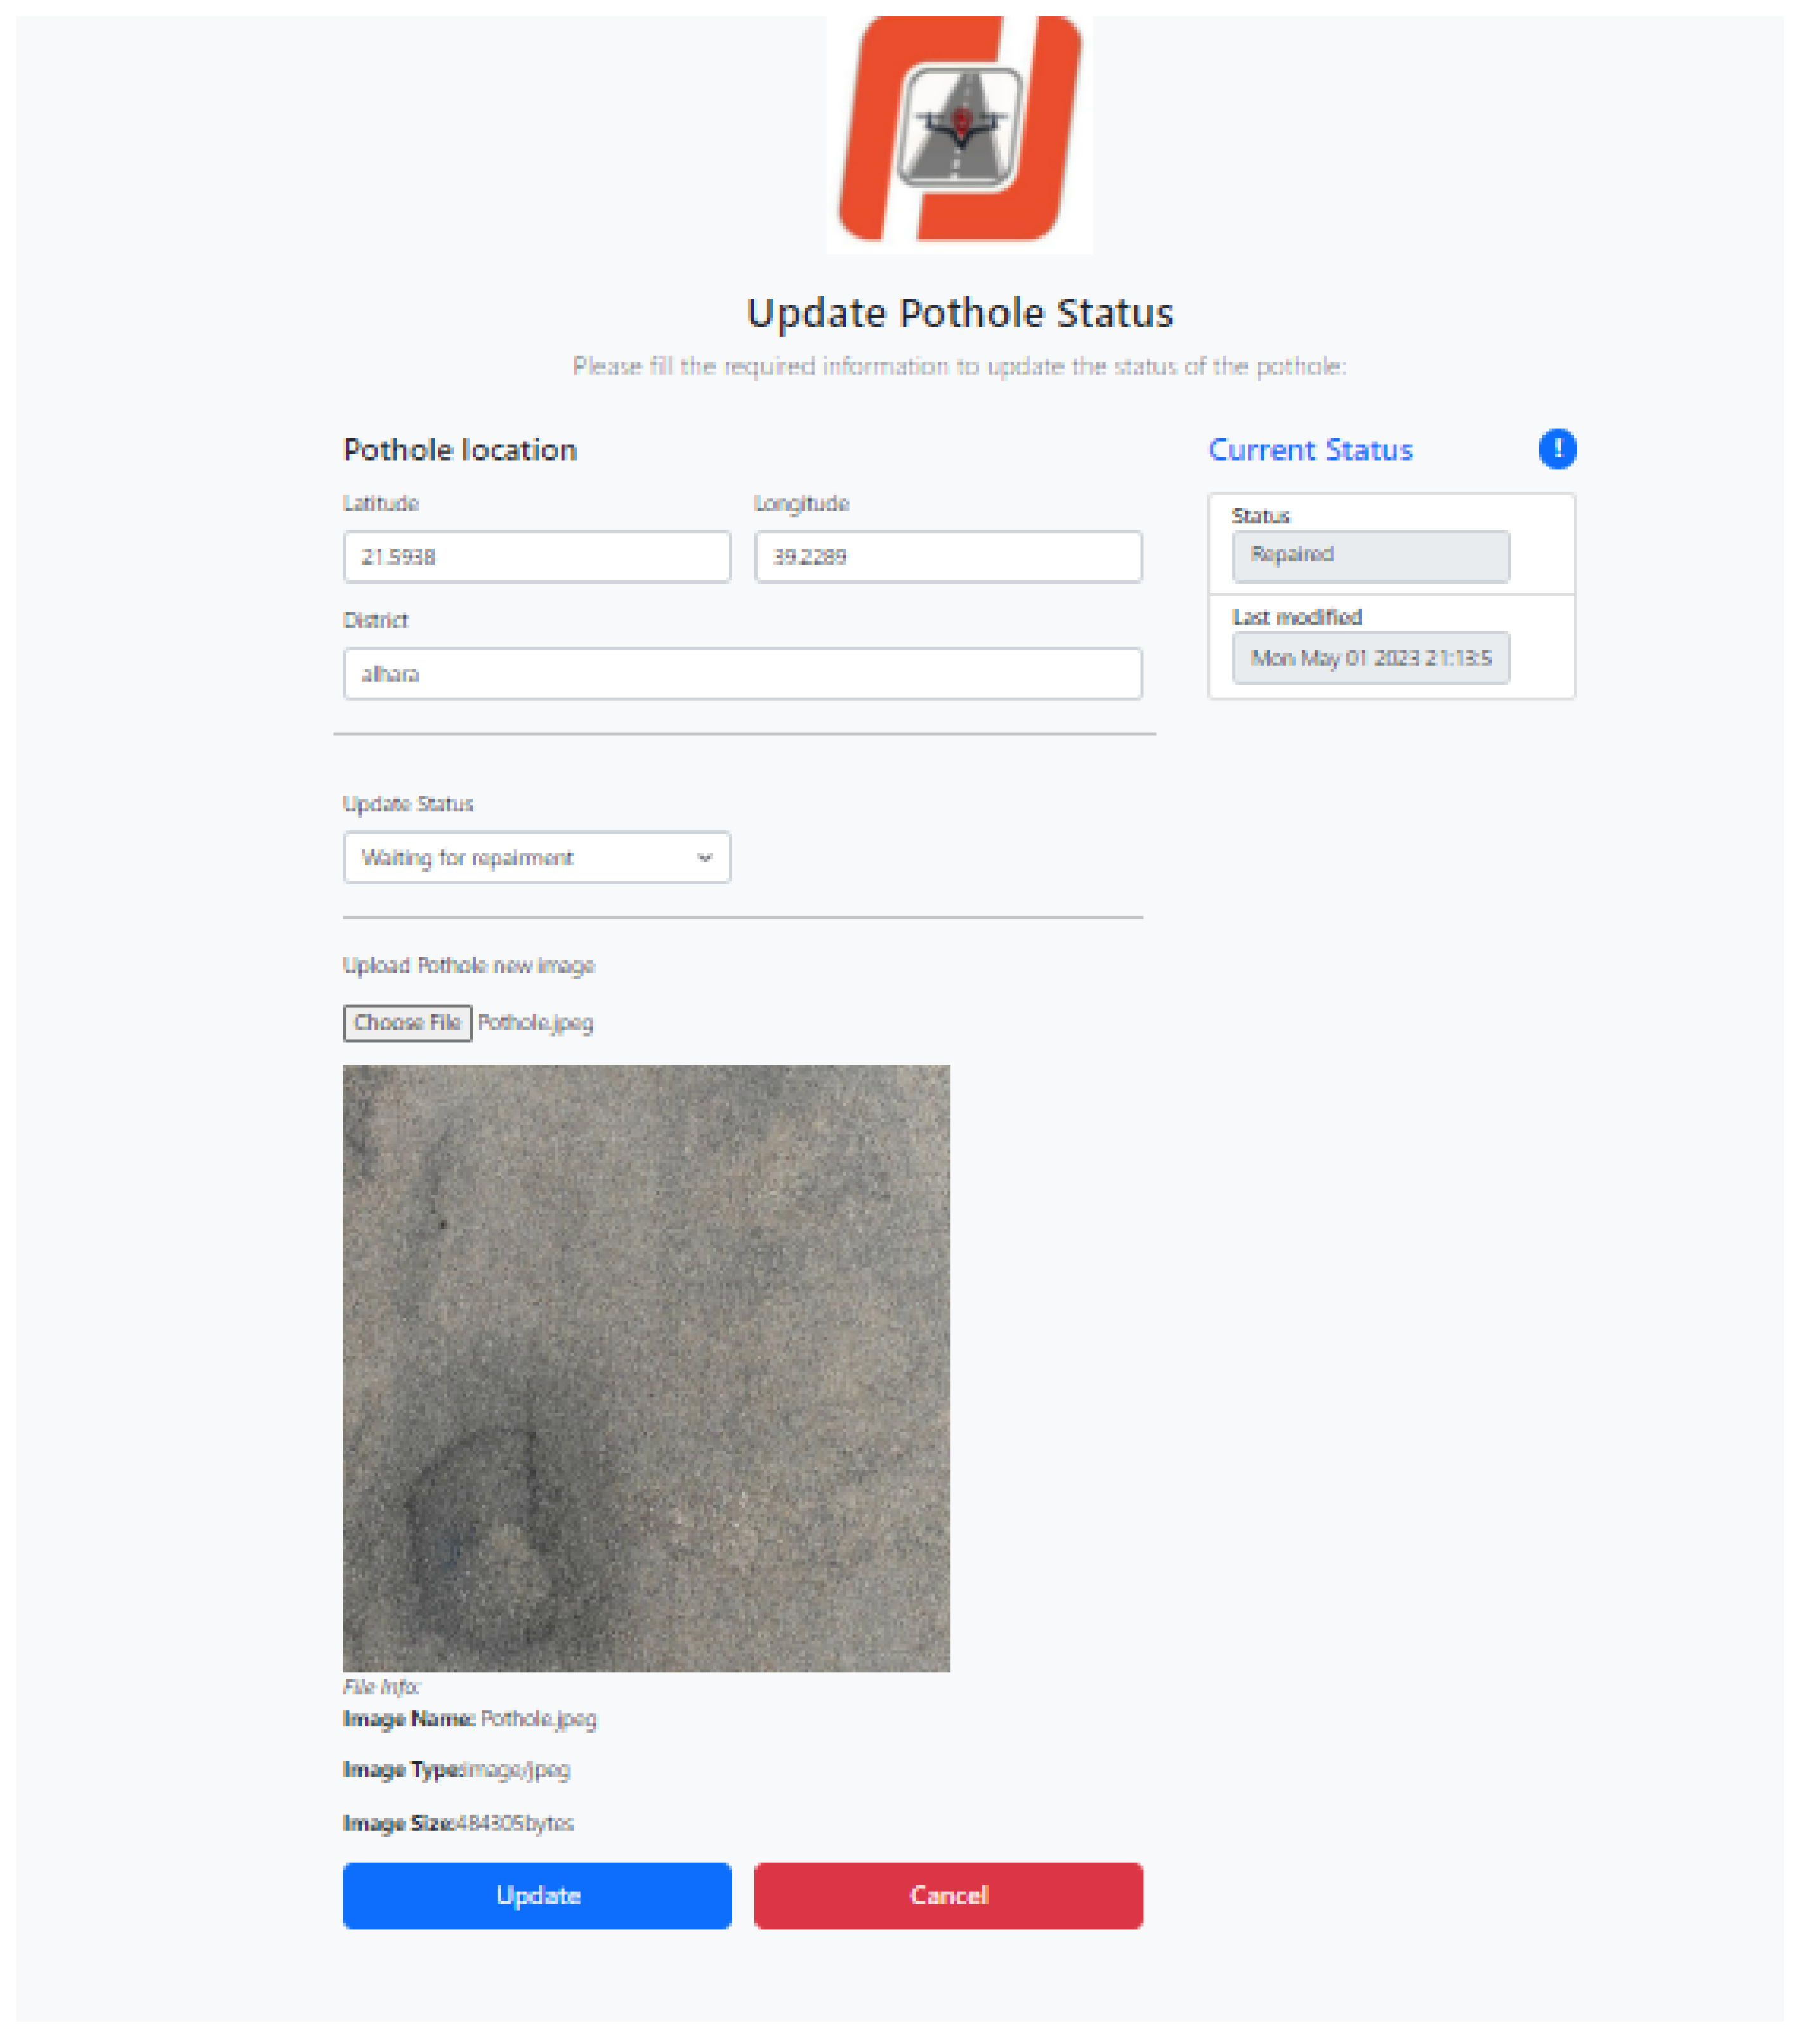
In Figure 14, the pothole update page is shown. On this page, the user can change the pothole information. This page allows RMEs to update the details of existing potholes, including coordinates, district, image, and status. When the user clicks the update button, the potholes updates are saved to the database.

4.4.2. RUs Web Application

The front end of the RUs web application consists of two pages. The first page is the start page, and the second page is the main page, which includes the functions for showing the potholes on the map and informing RUs about existing potholes on their routes.
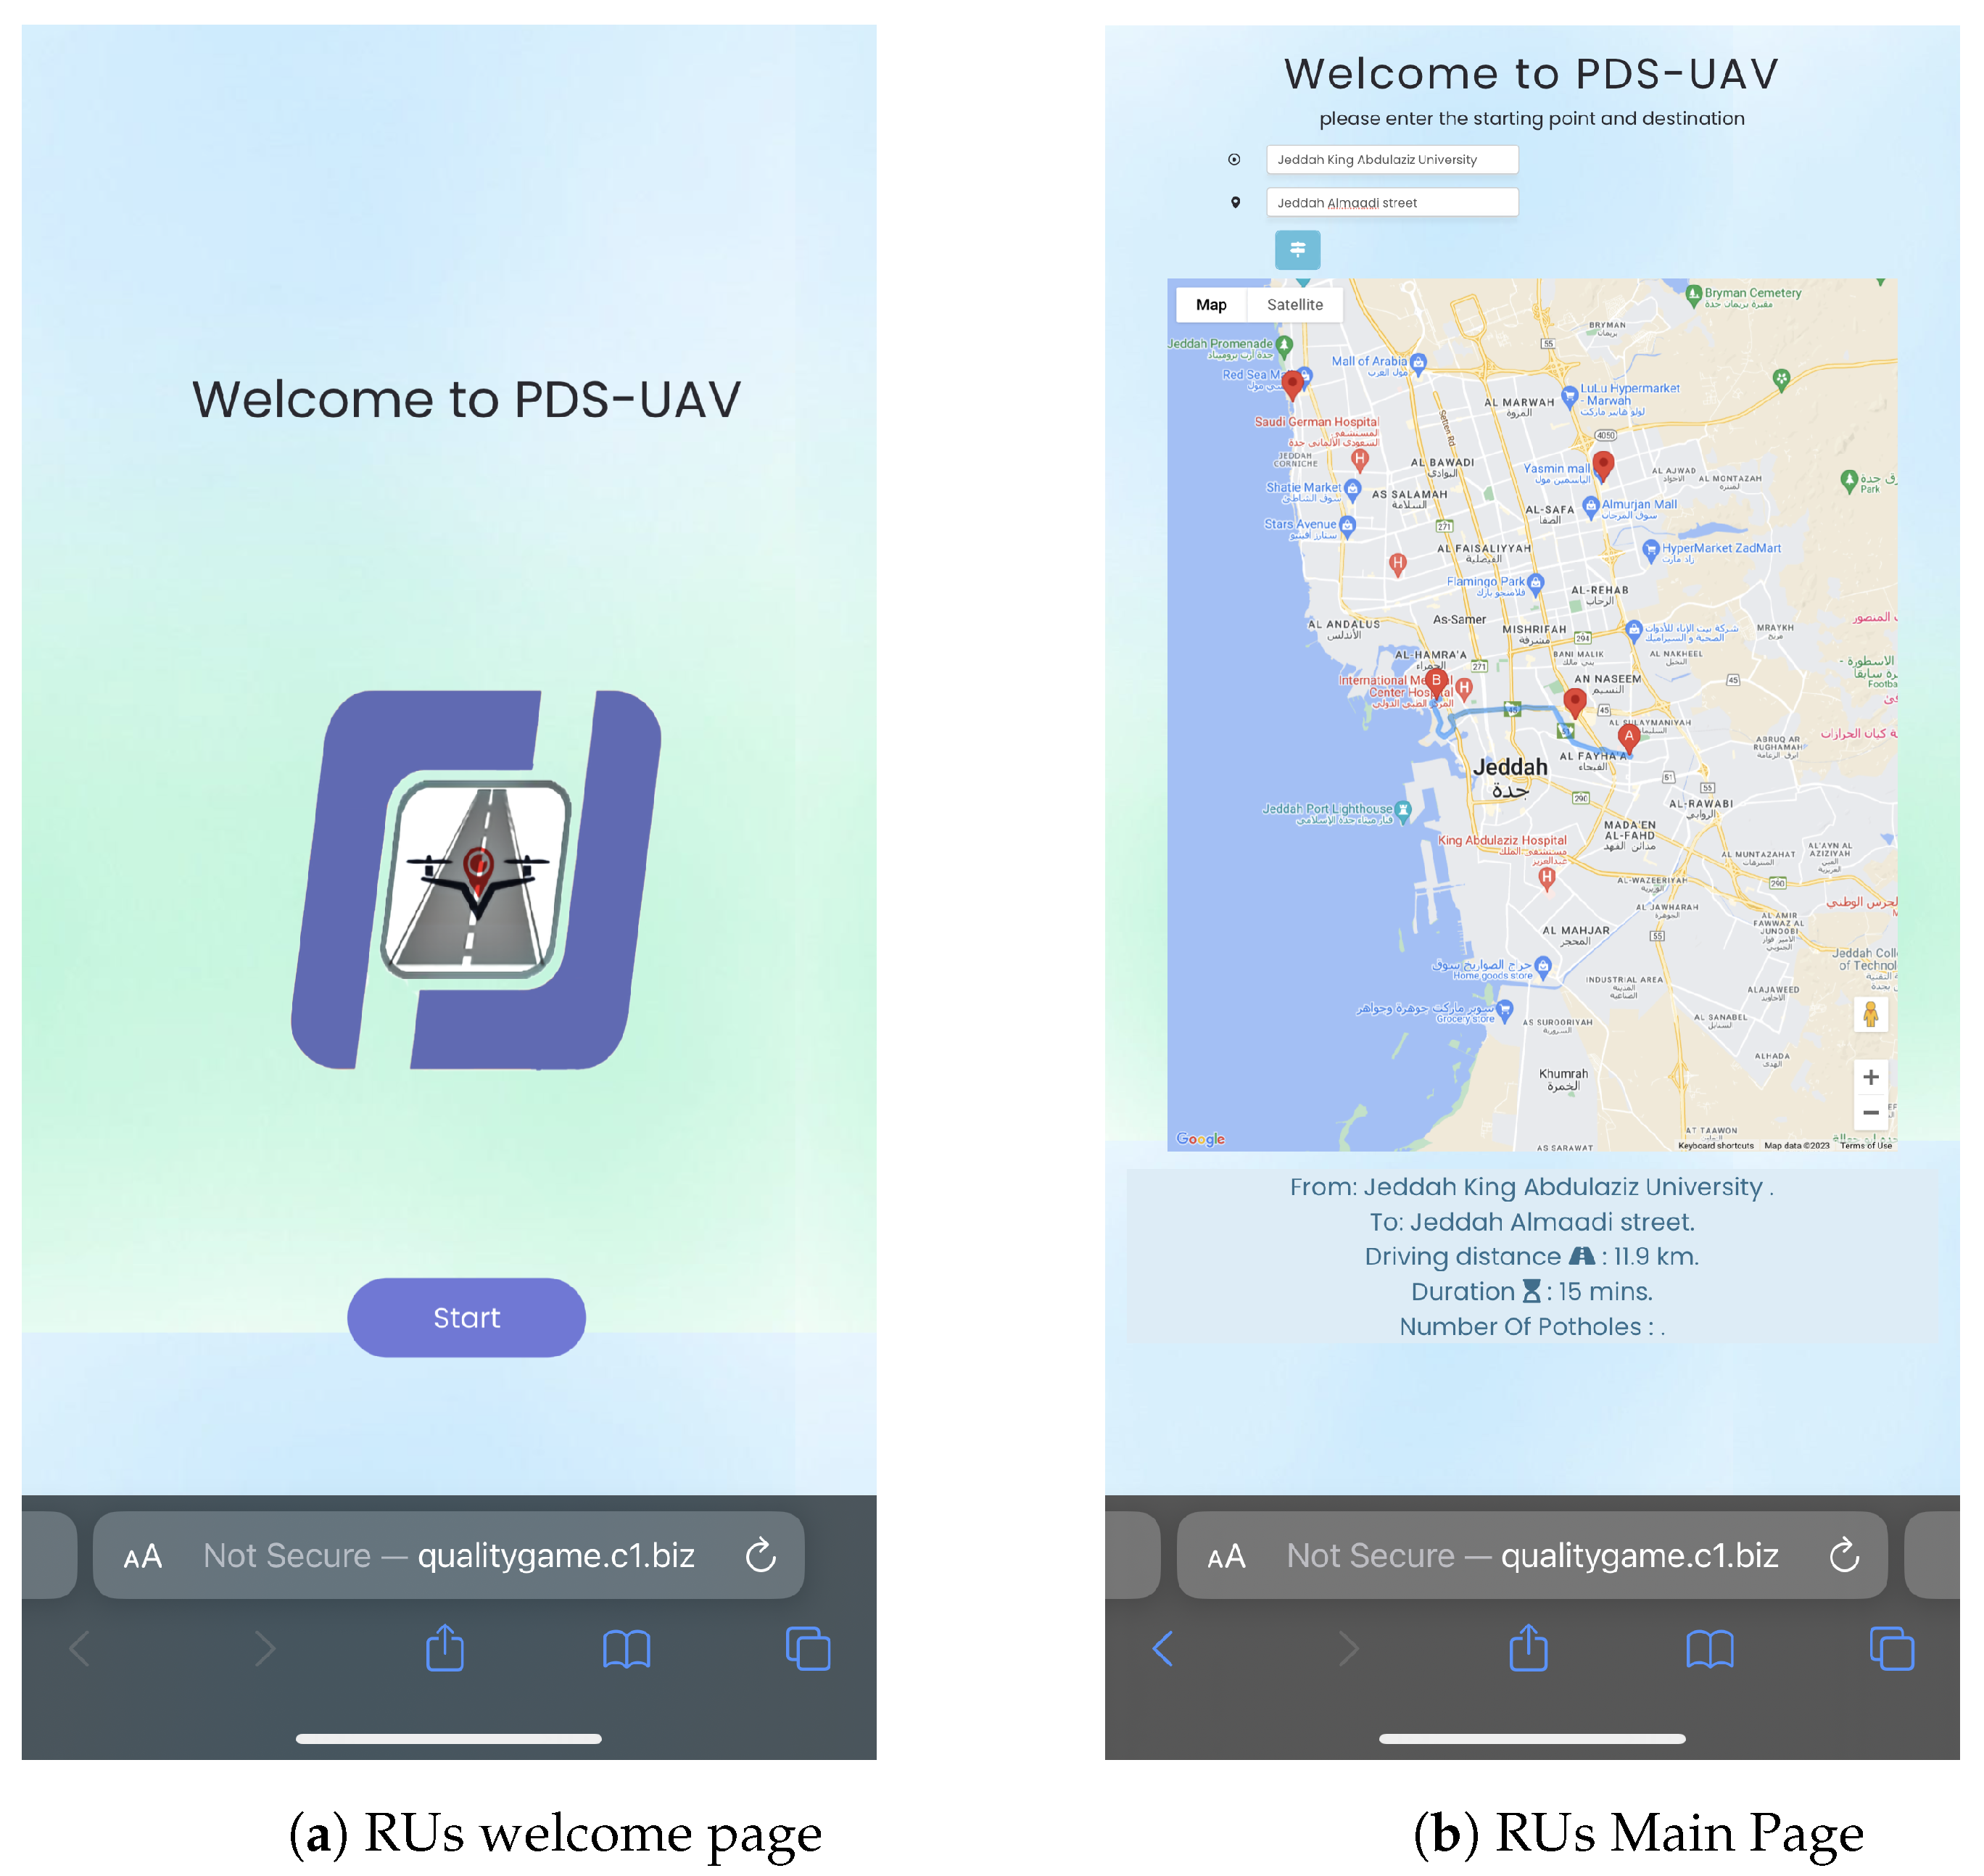
When opening the RUs web application, the welcome page appears. To start the application, RUs click the start button on the welcoming page as shown in Figure 15a. Then, the user will be directed to the application’s main page, shown in Figure 15b. The main page consists of two fields where the user can enter the starting point (A) and the destination point (B) and click on the button below to display the route between the points (A) and (B). Once the starting and destination points are entered, the system retrieves pothole information from Firestore documents and displays the locations of any existing potholes along the route on the map. The information presented to RUs includes the trip time from point (A) to point (B), the distance between the two points in Km, and the number of detected potholes that might be encountered on this route.

5. PDS-UAV Deep Learning Model for Pothole Detection

In this section, a discussion about the development of the deep learning model used in PDS-UAV for pothole detection is presented. The model development process involves multiple steps, including UAV image dataset collection, dataset annotation, data augmentation, feature extraction, and training and testing of the model. Each of these steps is discussed in more detail in the following subsections.

5.1. UAV Images Dataset Collection

The selected dataset for training the deep learning model is a publicly available dataset collected from Spain [16]. The used UAV in [16] was a DJI Mavic Air 2 quadcopter (DJI, Shenzhen, China). A 4K digital camera and location information were also utilized to capture the images. The 4K digital camera and GPS were utilized to capture the potholes’ images and record their location information. The images’ resolution is 3840 × 2160 pixels, and images were taken from a distance of 60 m above the ground. The UAV flight time was 34 min.
Cross-domain generalization [25], specifically cross-city testing [26,27], is utilized to assess how well the developed deep learning model, trained on the Spain dataset [16], performs on detecting potholes from unseen images collected from Jeddah, Saudi Arabia. Thus, in this study, the testing data were collected from Saudi Arabia using a DJI Mini 3 Pro quadcopter UAV, which is manufactured by DJI (Da-Jiang Innovations), a Chinese technology company based in Shenzhen, Guangdong. The DJI Mini 3 Pro quadcopter features 4K video capture resolution and an embedded GPS in the remote controller. Two UAV trips were conducted to collect the necessary images. Each trip lasted about 30 min. The total number of collected images was 59. Figure 16 shows a sample of the dataset collected from Saudi Arabia versus the dataset collected from Spain.

5.2. Dataset Annotation

Data annotation needs to be as accurate as possible because it directly impacts the performance of the deep learning model and, consequently, the detection accuracy. For annotating the testing dataset, an online tool called Computer Vision Annotation Tool (CVAT) was used https://github.com/opencv/cvat (accessed on 23 May 2023), which is a popular online tool offering free data-labeling services for videos and images, widely utilized across various medical specialties and other domains. Each of the 59 images was annotated using the free shape tool to ensure precision, as depicted in Figure 17. The annotated dataset was then downloaded, comprising annotated images and corresponding label text files.

5.3. Data Augmentation

Data augmentation involves expanding the dataset by creating additional copies of each image [28]. These copies include various modifications such as adding noise, flipping the image, zooming in or out, or stretching it [28]. Due to the limited size of the collected dataset from Saudi Arabia, data augmentation was performed to increase the test data size. Roboflow [29] was used for augmenting the data, which is an online tool designed to simplify computer vision tasks for deep learning. After augmentation, the testing dataset consisted of 111 images. Figure 18 illustrates various augmented versions of the same original image.

5.4. Feature Extraction

Feature extraction involves identifying the specific qualities that define an object. YOLO typically uses a CNN-based algorithm for feature extraction. The specific CNN architecture can vary depending on the version, but generally, it involves using a series of convolutional layers to extract hierarchical features from the input image. In our case, the most important features for identifying a pothole are its edges and texture. Edge detection involves comparing each pixel with its surrounding pixels to determine color variations. In pothole detection, a pixel is classified as an edge if the color of that pixel differs from neighboring pixels’ colors. Figure 19 illustrates an example showing how pixels of a pothole might appear during the feature extraction phase.

5.5. Building the Deep Learning Model

The proposed model for this system is a CNN-based model, specifically utilizing YOLO, which was proposed by Joseph Redmon et al. in May 2016 [30]. YOLO is known for its speed and minimal memory consumption in object detection. It is an object detection framework for identifying various objects within images or videos. During training, the YOLO model requires objects to be marked by bounding boxes and labeled with their corresponding class for detection. The YOLO architecture consists of three main components: the backbone, the neck, and the head, which can vary between different versions of YOLO. The backbone is a pre-trained CNN responsible for extracting useful features from the input image. The neck is another component that connects the backbone to the head. It merges the feature maps using path aggregation blocks like the feature pyramid network (FPN) and then passes them onto the head. The head is responsible for classifying objects and predicting bounding boxes based on the features provided by the backbone and neck.
The detection process is illustrated using a series of steps as shown in Figure 20. The detection process begins by taking the input image and passing it through the feature extraction phase, which enhances detection efficiency by reducing data redundancy. The CNN layers are responsible for detecting potholes by computing the probability of an image containing a pothole based on the learned patterns from the training dataset. Each layer contributes to the classification decision. The final decision of the deep learning algorithm confirms the detection. Ultimately, the output classifies an image as either containing a pothole or not.
The publicly available dataset discussed in the previous section was used to train the deep learning model, while the collected and annotated dataset from Jeddah, Saudi Arabia, was used for testing with the aim of cross-domain generalization. Different versions of the YOLO algorithm, YOLOv4-tiny, YOLOv5, and YOLOv8, were evaluated to determine which model produced the best results. The deep learning model for PDA-UAV was developed using Python on Google Colab.

5.6. Model Configuration and Training

The configuration step is one of the most critical aspects in building the deep learning model because it significantly impacts the performance of both the training and testing phases. The batch size determines how data are divided to minimize memory load, often selected as powers of two ranging from 16 to 1024. The number of epochs determines how many iterations the model will undergo during training and testing. In the evaluation experiments, the tested epoch sizes were 10, 50, and 100 for all evaluated YOLO models. The optimal configurations for all YOLO models were at 100 epochs and a batch size equal to 16. The final step is to train the deep learning model using the training set. The training set consists of 1362 UAV images of roads in Spain.

5.7. Model Testing and Evaluation

The tested dataset comprised 111 UAV images captured for roads in Jeddah, Saudi Arabia. Figure 21 displays an image from the testing dataset with detected potholes being marked in green. Although the model testing was performed on data collected from a different domain, which was a different city, it achieved good results. This could be attributed to the higher quality and clarity of the pothole images in the collected dataset using the UAV.
The various tested versions of the YOLO algorithm produced acceptable results. Table 3 outlines the experiments’ results with varying epoch number in each experiment. Confusion matrix metrics, including precision, recall, and F1 score, were utilized to evaluate the performance of the model. These metrics were based on counts of true positives (TPs), true negatives (TNs), false positives (FPs), and false negatives (FNs). TP represents the correct detection of potholes when there is a pothole, FP represents the detection of a pothole when there is no pothole, FN represents no detection of a pothole when there is a pothole, and TN represents the correct non-detection of potholes when there is no pothole. Precision, reflecting the accuracy of detected potholes, is calculated using Equation (1). Recall, which assesses the model’s ability to identify potholes across various road segments, is computed using Equation (2). The F1 score, which balances precision and recall, is calculated using Equation (3).
P r e c i s i o n = T P T P + F P ,
R e c a l l = T P T P + F N ,
F 1 = 2 × P r e c i s i o n × R e c a l l P r e c i s i o n + R e c a l l ,
Based on the results presented in Table 3, YOLOv8 yielded the best performance with a precision of 98%, recall of 92%, and F1 score of 95%. Therefore, it was selected to be deployed in the proposed PDS-UAV system. The confusion matrix shows the correlation between the predicted and actual classes using YOLOv8 for the different number of epochs, with zero representing potholes and one representing non-potholes, as depicted in Figure 22.

6. PDS-UAV Testing

To ensure the quality and effectiveness of the PDS-UAV system, different types of software testing were utilized, which include unit testing, integration testing, and usability testing. Each of the performed testing techniques is discussed in detail in the following subsections to ensure that every feature in the application works effectively and that the system has achieved its goals.

6.1. Unit Testing

Unit testing tests the components of the system code to validate their performance and ensure that each component is functioning as expected. This process helps identify flaws in each component of the system before full system integration. It also helps to reduce the chance of bugs and errors in the final product. Two samples of unit testing for the different components of the system are presented: sign-up unit testing and adding potholes unit testing.
Sign-up testing is conducted to ensure the validation of users’ email addresses, phone numbers, and passwords when signing up for the web application. The unit testing for the sign-up page ensures that every input from the user matches the correct format and that all the required fields are filled. Table 4 shows a sample of the test cases and results for the sign-up page, where a test case is marked as passing if the testing results are the same as the expected results. The unit testing for adding the potholes functionality of the system is performed to ensure that every input from the user will match the correct format and that nothing is left empty, as shown in Table 5.

6.2. Integration Testing

Integration testing aims to verify that all units and components work together as expected within the application. This testing phase is crucial as it helps identify and resolve errors that may arise from the interaction between the different parts of the system. The results of the integration testing, detailed in Table 6, confirm that the application’s functions are working correctly, with all test cases producing the expected outcomes. The table outlines various test scenarios, including navigation between pages and interactions with different elements. All of these were successful, indicating a robust and well-integrated system.

6.3. Usability Testing

Usability testing involves engaging target users to assess the easiness and effectiveness of a system. For this purpose, five representative users were selected to test the PDS-UAV system. The participants had similar expertise with comparable systems and were subjected to identical testing conditions, tasks, and questions. Different devices were utilized for the usability testing. The RMEs website was tested on a Windows 11 desktop with an HD display and a high-speed wired Internet connection. Google Chrome was used to access the RMEs’ website. The RUs website was evaluated on an Android device with GPS and a 4G Internet connection. All testing sessions were conducted in a controlled physical environment, maintaining consistent room, lighting, and seating conditions. Data on users’ task performance and feedback were collected during the usability sessions.
Before the testing session, participants signed an informed consent form outlining the testing objectives, data usage, anonymity rights, and their right to withdraw at any time. Users were provided with six representative tasks to assess the usability of the system. Five of these tasks are related to the RMEs web application, and one task is related to the RUs web application. The assigned tasks and their scenarios were as follows:
  • Sign up: The user signs up to the system by filling in the required information, such as first name, last name, email, password, and phone number.
  • Sign in: The user signs in to the system using email and password.
  • Add new pothole: The user fills in the required information to add a new pothole in the add new pothole page. Information includes latitude, longitude, district, and image of the pothole, where the needed information, coordinates of the pothole, and its image are provided to the user before starting the test.
  • Update pothole status with ID number 1 to repaired: The user selects the edit option from the potholes table at the bottom of the home page and updates the pothole status to “repaired” in the update pothole status page.
  • Sign out: The user signs out of the system by pressing the sign-out button displayed in the header.
  • View potholes: The user enters the starting and destination points of the intended route and presses on the show route button to view detected potholes on the selected route.
During the usability testing, the task completion time for each participant was recorded. Additionally, participants were asked to rate the easiness of each performed task on a scale from 1 to 5, provide comments on the task, and specify any aspects they found confusing. This comprehensive approach ensures that quantitative and qualitative data are collected, allowing for a thorough analysis of usability and user satisfaction.
To ensure task success in the usability study, clear criteria should be established based on two parameters: completion within the specified time range and achieving a satisfaction score. Task success criteria are defined as follows:
  • Time range completion: Participants must complete each task within the specified time range. The targeted average times of each task were set in the planning of usability testing based on a pilot test performed with a small sample of representative users. The target times were set as follows: sign-up task = 120 s–180 s, sign-in task = 30 s–60 s, add new pothole task = 90 s–120 s, update pothole status with id number 1 to repaired = 100 s–130 s, view potholes on a route = 90 s–120 s, sign out = 5 s–20 s.
  • Rating of task easiness: Participants must rate the easiness of the task as at least 4 out of 5 on a satisfaction scale.
Table 7 shows the time taken by each participant to complete each task, the rating of each task’s easiness, and the average of times and rates for each task.
In general, the average time taken by the five participants to complete each task was within the targeted time. Additionally, the results show that the participants’ average rating of task easiness was 4.3 out of 5, indicating overall satisfaction with the system’s ease of use. Overall, the usability testing showed that PDS-UAV’s design was easy to use and was well accepted by its target users. Some participants also provided further comments and suggestions, such as placing the pothole table on the same screen as the pothole map, clarifying the pothole status on the ‘update’ pothole screen, and providing the interface in other languages, such as Array. Based on the users’ comments, the system was updated. For example, in the update pothole status page, the confusion about the current status field of a pothole was solved by moving the drop-box of status to a more recognizable place on the screen. Other users’ comments will be addressed in future work.

7. Discussion

The detection and maintenance of potholes are crucial for ensuring road safety and enhancing the quality of life for drivers and passengers. Traditional methods of pothole detection often rely on manual reporting by drivers or municipal employees, which can be inefficient and unreliable. This study introduces an innovative automated system for pothole detection using UAVs and AI. The proposed PDS-UAV system uses UAVs to capture images of road surfaces, then utilizes a deep neural network to analyze the captured images and detect potholes.
Previous research has explored various methods for pothole detection, including the use of smartphone cameras and in-vehicle cameras [23,24]. While useful, these methods often suffer from limited coverage and require manual intervention. In contrast, UAVs offer a broader sensing range, allowing for more extensive coverage and the ability to detect potholes in areas that are difficult to access by conventional means without endangering human lives. Thus, several recent studies in the literature have considered UAV images for pothole detection [12,13,14,15,16,17]. Some of the UAV approaches for pothole detection utilized machine learning techniques [12,17], while others utilized deep learning techniques with or without image processing [13,14,15,16]. The image processing techniques were utilized to reduce the error rate and increase the model’s ability to distinguish between classes [14,15]. Other approaches used deep learning for pothole detection. For instance, a multi-agent system using the YOLOv4-tiny algorithm was employed for real-time pothole detection using UAV images with accuracy rates of 96.54% and a precision of 98.45% [16]. Similarly, UAV images were also used to improve road damage detection efficiency and accuracy by employing multiple YOLO versions (YOLOv4, YOLOv5, YOLOv5 with transformer, and YOLOv7), achieving precision rates of 26.86%, 59.9%, 65.7%, and 73.2%, respectively [13].
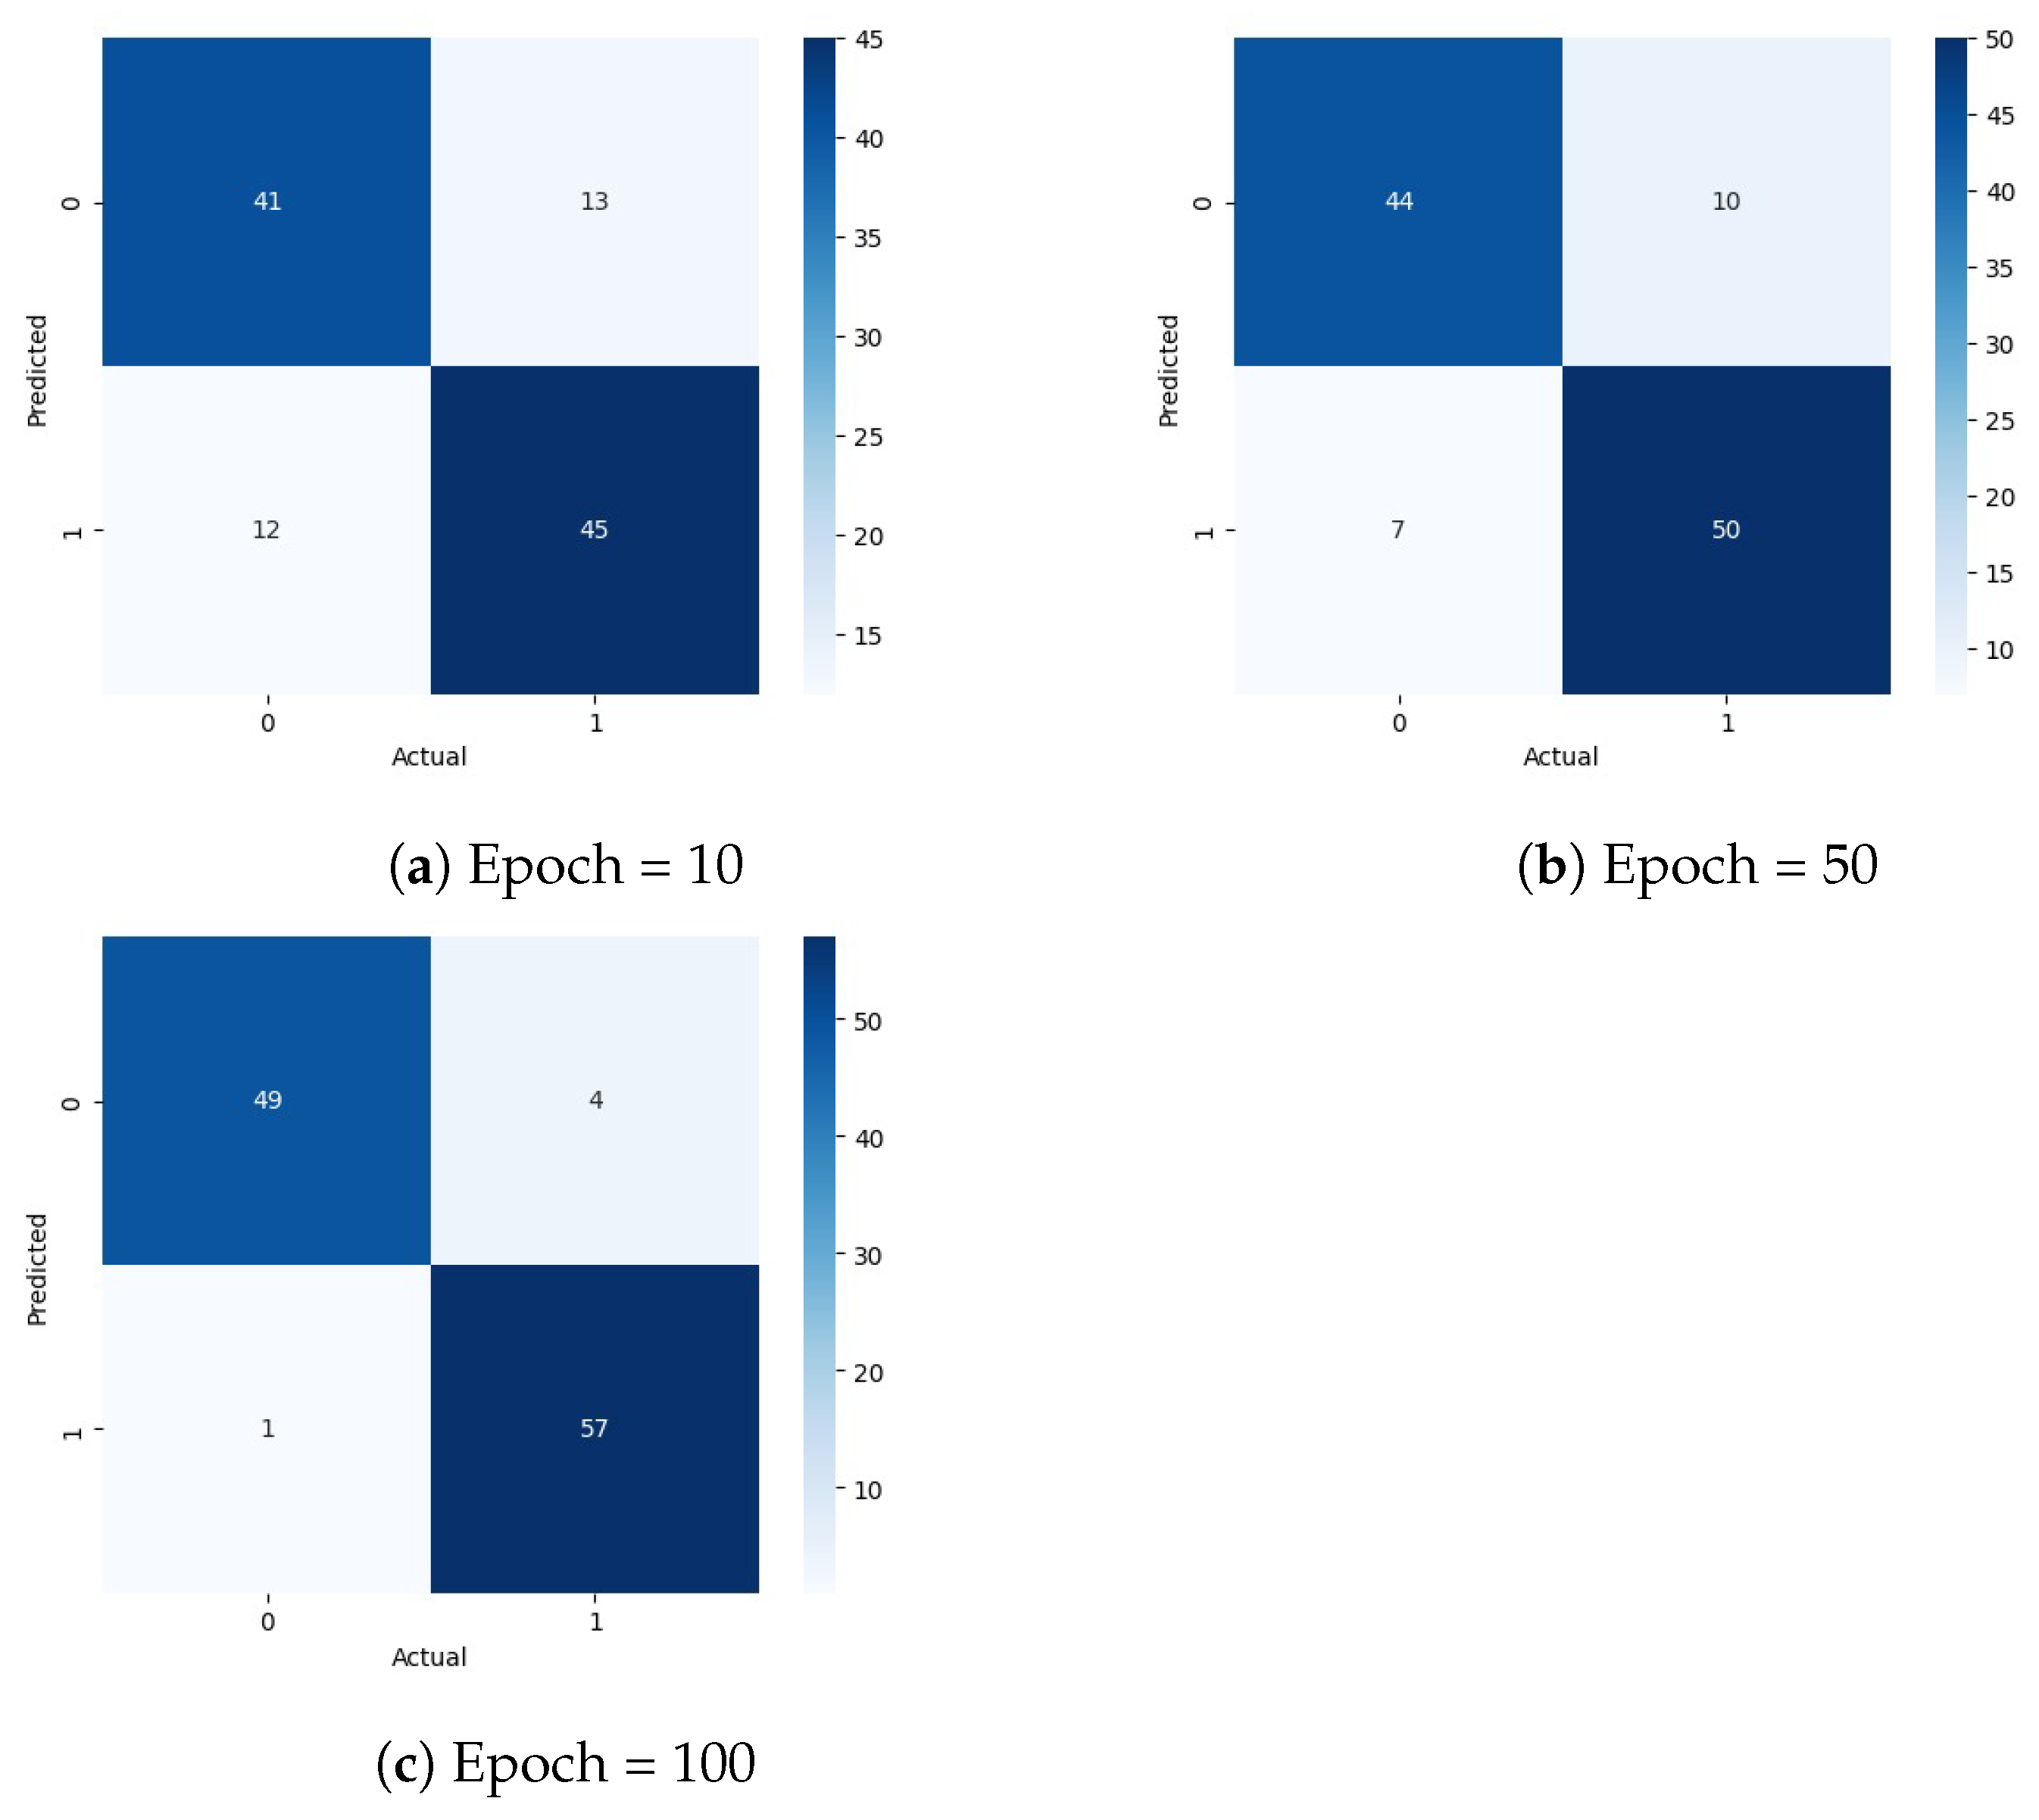
The PDS-UAV system extends the efforts of automating pothole detection by incorporating YOLO deep learning algorithm. Different variants of the YOLO model were tested for pothole detection in the proposed PDS-UAV system. The models were trained using a publicly available dataset collected from Spain and tested on a proprietary dataset collected from Jeddah, Saudi Arabia, for cross-domain generalization. The examined models included YOLOv4-tiny, YOLOv5, and YOLOv8. The best precision percentages for the models were achieved when the number of epochs was equal to 100 and the percentages were 82%, 82%, and 98%, respectively. Due to its significantly higher detection precision, YOLOv8 was selected as the best model for the system to increase the reliability and accuracy of pothole identification.
In [16], the same dataset of the present study was employed to train the model exclusively on YOLOv4-tiny. In contrast, the present study utilized the same dataset to train three models: YOLOv4-tiny, YOLOv5, and YOLOv8, enabling a comparative analysis across different versions of the YOLO model. Although both studies used the same dataset, the YOLOv4-tiny model in [16] achieved higher precision than this study (98.45% versus 82%). This discrepancy could be due to the model in [16] being optimized and tested on a domain-specific dataset, which likely improved its performance. In contrast, this study tested the models on a dataset from a different domain (country), introducing more variability and possibly making the detection task more challenging. Another notable factor is that the authors in [16] did not specify the number of training epochs, whereas in the current study, the number of epochs ranged between 10 and 100 for each model. A longer or more fine-tuned training process may have contributed to the higher precision in [16]. While increasing the number of epochs can improve the model performance, it also raises the risk of overfitting, where the model performs well on training data but poorly on unseen data. To prevent this, the number of epochs in the present study was deliberately kept between 10 and 100, balancing training time and ensuring better generalization to unseen data.
The implementation of the PDS-UAV system demonstrated several key findings. The YOLOv8 model demonstrated high effectiveness in detecting potholes from UAV-captured images, achieving an F1 score of 95%, a precision of 98%, and a recall of 92%, underscoring its accuracy and efficiency. Usability testing with road maintenance employees and road users revealed a high average satisfaction rating of 4.3 out of 5, reflecting the system’s ease of use and acceptance among target users. The system’s operational benefits were also notable. It effectively informs drivers of nearby potholes on their routes by overlaying the detected potholes’ locations on the map.
Automating pothole identification using UAV images has a significant impact on infrastructure management, transportation efficiency, and road safety, benefiting various stakeholders, including road users, road maintenance employees, and city planners. For road users, such as drivers, bikers, and daily commuters, the technology offers safer routes by providing information on pothole locations, allowing them to avoid hazardous areas and reducing the risk of accidents and vehicle damage. Maintenance employees gain from enhanced safety due to reduced exposure to traffic and the elimination of manual inspections, which also cuts labor costs and allows for more efficient repairs. The system’s continuous monitoring capabilities ensure proactive maintenance, preventing costly road damage and enabling timely interventions. For city planners, the PDS-UAV system provides valuable data to prioritize road repair projects and allocate resources efficiently. Its integration with traffic management and emergency services enhances urban mobility and safety by maintaining critical routes in good condition. Furthermore, the precise data supports informed decision-making and smart city initiatives, contributing to better infrastructure management and environmental sustainability. Utilizing an advanced detection algorithm, YOLOv8, enhances the system’s reliability and accuracy, making it an essential tool for improving road maintenance and ensuring safer and more efficient transportation networks.
Despite the promising results of the proposed PDS-UAV system, several limitations can be highlighted. First, the performance of the YOLOv8 model relies heavily on the quality and diversity of the training dataset. In addition, potholes can vary depending on regions, road surfaces, lighting conditions, and weather, impacting the model’s detection accuracy. Second, while there are many benefits to using UAVs for data collection, there are also shortcomings. Deploying UAVs for pothole detection faces operational limitations such as battery life, which could result in restricted flight length (usually 30–40 min). In addition, the effects of bad weather conditions, such as heavy rain, strong winds, or low visibility, can limit UAV operations. These UAV-related variables may impact the dependability and consistency of data gathering across long periods or wide geographic areas. Third, the use of UAVs in urban contexts is restricted by stringent regulatory frameworks designed to ensure safety and privacy, making it time-consuming to obtain appropriate approvals and manage the danger of accidents with other airborne objects or structures. Addressing these limitations through future research and development will be crucial for enhancing the robustness, scalability, and practical applicability of the PDS-UAV system in diverse urban environments.
Future work will include developing a real-time system by integrating the system into the UAVs. In addition, it will focus on improving the website’s functionality and conducting further usability testing with a larger user base. Also, enabling a bilingual interface for the application using English and Arabic will make the web application more accessible to target users. Moreover, including real-time alerts for RUs based on their current location, and using banners and sounds would enhance their safety. The alerts should consider the safe distance that separates the RUs from the pothole based on their mobility mode (walking, driving, or cycling) so that they can take proper action at the right time to prevent the impact of these potholes on their safety. Furthermore, investigating the use of UAVs for other forms of infrastructure monitoring, such as traffic monitoring and control, might broaden the technology’s applications.

8. Conclusions

Smart cities use modern technology to enhance urban services, infrastructure, and environmental sustainability. Ensuring the safety and comfort of drivers and passengers is crucial for improving quality of life. This study aimed to develop a system using a deep learning model to detect potholes from UAV images. Data were collected from target users via interviews with a RME from Jeddah’s IT department and a questionnaire distributed to road users. Two web applications were developed for RMEs and RUs. The deep learning model, trained on a public dataset of UAV pothole images, was tested on a dataset collected in Jeddah, Saudi Arabia. The YOLOv8 model achieved 95% on the F1 score, 98% on precision, and 92% on recall. Unit testing validated individual system functions while integration testing ensured that all components worked together, and the deep learning model was integrated with the RME web application. Usability testing with representative users showed overall satisfaction with the system. In practice, the proposed PDS-UAV system can significantly reduce road maintenance costs by automating detection and monitoring processes, thereby reducing the need for frequent and risky manual inspection. Furthermore, the system’s ability to deliver timely information to drivers about pothole locations improves traffic safety, potentially reducing accidents caused by hazardous road conditions. Future research will focus on developing a real-time system for UAVs, improving the website’s functionalities, and conducting further usability testing with a larger user base.

Author Contributions

O.A.: Conceptualization, methodology, validation, formal analysis, writing—original draft preparation, writing—review and editing, visualization, supervision, project administration, resources; A.B.: methodology, validation, writing—original draft preparation, visualization, writing—review and editing, resources; W.B.: conceptualization, methodology, software, validation, formal analysis, data curation, writing—original draft, visualization, resources; L.A.K.: methodology, validation, visualization, writing—review and editing, resources. All authors have read and agreed to the published version of the manuscript.

Funding

This research received no external funding.

Institutional Review Board Statement

Not applicable.

Informed Consent Statement

Informed consent was obtained from all subjects involved in the study.

Data Availability Statement

The data collected in this study are available upon request from the authors.

Acknowledgments

The authors would like to acknowledge Rahaf Mulla, Joud Jabalawi, and Samaher Alazmi for their participation in the development of the system used in this study.

Conflicts of Interest

The authors declare no conflicts of interest.

References

  1. World Health Organization. Global Status Report on Road Safety 2023; Technical Report; World Health Organization: Geneva, Switzerland, 2023.
  2. Ranyal, E.; Sadhu, A.; Jain, K. Road condition monitoring using smart sensing and artificial intelligence: A review. Sensors 2022, 22, 3044. [Google Scholar] [CrossRef] [PubMed]
  3. Alenezi, E.Z.; AlQahtani, A.M.; Althunayan, S.F.; Alanazi, A.S.; Aldosari, A.O.; Alharbi, A.M.; Alanazi, S.T.; Alanazi, S.S.S.; Tubayqi, H.G.A.; Taheri, T.A. Prevalence and determinants of road traffic accidents in Saudi Arabia: A systematic review. Cureus 2023, 15, e51205. [Google Scholar] [CrossRef] [PubMed]
  4. HemaMalini, B.; Padesur, A.; Manoj, V.; Shet, A. Detection of Potholes on Roads using a Drone. EAI Endorsed Trans. Energy Web 2021, 9, e4. [Google Scholar]
  5. Rathee, M.; Bačić, B.; Doborjeh, M. Automated Road Defect and Anomaly Detection for Traffic Safety: A Systematic Review. Sensors 2023, 23, 5656. [Google Scholar] [CrossRef]
  6. Ozoglu, F.; Gökgöz, T. Detection of Road Potholes by Applying Convolutional Neural Network Method Based on Road Vibration Data. Sensors 2023, 23, 9023. [Google Scholar] [CrossRef]
  7. Butilă, E.V.; Boboc, R.G. Urban traffic monitoring and analysis using unmanned aerial vehicles (UAVs): A systematic literature review. Remote Sens. 2022, 14, 620. [Google Scholar] [CrossRef]
  8. Byun, S.; Shin, I.K.; Moon, J.; Kang, J.; Choi, S.I. Road traffic monitoring from UAV images using deep learning networks. Remote Sens. 2021, 13, 4027. [Google Scholar] [CrossRef]
  9. Dewan, R.; Rahman, K.F. A Survey on Applications of Unmanned Aerial Vehicles (UAVs). In Recent Innovations in Computing; Springer: Berlin/Heidelberg, Germany, 2022; pp. 95–110. [Google Scholar]
  10. Feitosa, I.; Santos, B.; Almeida, P.G. Pavement Inspection in Transport Infrastructures Using Unmanned Aerial Vehicles (UAVs). Sustainability 2024, 16, 2207. [Google Scholar] [CrossRef]
  11. Liang, H.; Lee, S.C.; Bae, W.; Kim, J.; Seo, S. Towards UAVs in construction: Advancements, challenges, and future directions for monitoring and inspection. Drones 2023, 7, 202. [Google Scholar] [CrossRef]
  12. Ibrahim, H.B.; Salah, M.; Zarzoura, F.; El-Mewafi, M. Smart monitoring of road pavement deformations from UAV images by using machine learning. Innov. Infrastruct. Solut. 2024, 9, 1–18. [Google Scholar] [CrossRef]
  13. Silva, L.A.; Leithardt, V.R.Q.; Batista, V.F.L.; Villarrubia González, G.; De Paz Santana, J.F. Automated Road Damage Detection Using UAV Images and Deep Learning Techniques. IEEE Access 2023, 11, 62918–62931. [Google Scholar] [CrossRef]
  14. Kim, S.; Seo, D.; Jeon, S. Improvement of Tiny Object Segmentation Accuracy in Aerial Images for Asphalt Pavement Pothole Detection. Sensors 2023, 23, 5851. [Google Scholar] [CrossRef] [PubMed]
  15. Nomqupu, S.; Sali, A.; Nyamugama, A.; Ndou, N. Integrating Sigmoid Calibration Function into Entropy Thresholding Segmentation for Enhanced Recognition of Potholes Imaged Using a UAV Multispectral Sensor. Appl. Sci. 2024, 14, 2670. [Google Scholar] [CrossRef]
  16. Silva, L.A.; Sanchez San Blas, H.; Peral García, D.; Sales Mendes, A.; Villarubia González, G. An architectural multi-agent system for a pavement monitoring system with pothole recognition in UAV images. Sensors 2020, 20, 6205. [Google Scholar] [CrossRef]
  17. Pan, Y.; Zhang, X.; Sun, M.; Zhao, Q. Object-based and supervised detection of potholes and cracks from the pavement images acquired by UAV. Int. Arch. Photogramm. Remote Sens. Spat. Inf. Sci. 2017, 42, 209–217. [Google Scholar] [CrossRef]
  18. Xin, H.; Ye, Y.; Na, X.; Hu, H.; Wang, G.; Wu, C.; Hu, S. Sustainable Road Pothole Detection: A Crowdsourcing Based Multi-Sensors Fusion Approach. Sustainability 2023, 15, 6610. [Google Scholar] [CrossRef]
  19. Opara, J.N.; Thein, A.B.B.; Izumi, S.; Yasuhara, H.; Chun, P.J. Defect Detection on Asphalt Pavement by Deep Learning. Geomate J. 2021, 21, 87–94. [Google Scholar]
  20. Park, S.S.; Tran, V.T.; Lee, D.E. Application of various yolo models for computer vision-based real-time pothole detection. Appl. Sci. 2021, 11, 11229. [Google Scholar] [CrossRef]
  21. Baek, J.W.; Chung, K. Pothole classification model using edge detection in road image. Appl. Sci. 2020, 10, 6662. [Google Scholar] [CrossRef]
  22. Dewangan, D.K.; Sahu, S.P. PotNet: Pothole detection for autonomous vehicle system using convolutional neural network. Electron. Lett. 2021, 57, 53–56. [Google Scholar] [CrossRef]
  23. Ochoa-Ruiz, G.; Angulo-Murillo, A.A.; Ochoa-Zezzatti, A.; Aguilar-Lobo, L.M.; Vega-Fernández, J.A.; Natraj, S. An asphalt damage dataset and detection system based on retinanet for road conditions assessment. Appl. Sci. 2020, 10, 3974. [Google Scholar] [CrossRef]
  24. Maeda, H.; Sekimoto, Y.; Seto, T.; Kashiyama, T.; Omata, H. Road damage detection and classification using deep neural networks with smartphone images. Comput.-Aided Civ. Infrastruct. Eng. 2018, 33, 1127–1141. [Google Scholar] [CrossRef]
  25. Wang, J.; Lan, C.; Liu, C.; Ouyang, Y.; Qin, T.; Lu, W.; Chen, Y.; Zeng, W.; Yu, P.S. Generalizing to Unseen Domains: A Survey on Domain Generalization. IEEE Trans. Knowl. Data Eng. 2023, 35, 8052–8072. [Google Scholar] [CrossRef]
  26. Saremi, F.; Abdelzaher, T. Combining Map-Based Inference and Crowd-Sensing for Detecting Traffic Regulators. In Proceedings of the 2015 IEEE 12th International Conference on Mobile Ad Hoc and Sensor Systems, Dallas, TX, USA, 19–22 October 2015; pp. 145–153. [Google Scholar] [CrossRef]
  27. Zourlidou, S.; Sester, M. Traffic Regulator Detection and Identification from Crowdsourced Data—A Systematic Literature Review. ISPRS Int. J. Geo-Inf. 2019, 8, 491. [Google Scholar] [CrossRef]
  28. Hao, X.; Liu, L.; Yang, R.; Yin, L.; Zhang, L.; Li, X. A review of data augmentation methods of remote sensing image target recognition. Remote Sens. 2023, 15, 827. [Google Scholar] [CrossRef]
  29. Theophilus, S. Roboflow: Converting Annotations for Object Detection. 3 September 2021. Available online: https://medium.com/analytics-vidhya/converting-annotations-for-object-detection-using-roboflow-5d0760bd5871 (accessed on 5 December 2022).
  30. Redmon, J.; Divvala, S.; Girshick, R.; Farhadi, A. You Only Look Once: Unified, Real-Time Object Detection. In Proceedings of the IEEE Conference on Computer Vision and Pattern Recognition (CVPR), Las Vegas, NV, USA, 27–30 June 2016. [Google Scholar]
Figure 1. System architecture.
Sustainability 16 09168 g001
Figure 2. PDS-UAV use case diagram.
Sustainability 16 09168 g002
Figure 3. RME activity diagram.
Sustainability 16 09168 g003
Figure 4. RU activity diagram.
Sustainability 16 09168 g004
Figure 5. PDS-UAV sequence diagram for pothole uploading and detection.
Sustainability 16 09168 g005
Figure 6. PDS-UAV sequence diagram for the RME web application.
Sustainability 16 09168 g006
Figure 7. PDS-UAV sequence diagram for the RUs web application.
Sustainability 16 09168 g007
Figure 8. The welcoming page of the web application.
Sustainability 16 09168 g008
Figure 9. Sign up page of the web application.
Sustainability 16 09168 g009
Figure 10. Log-in page of the web application.
Sustainability 16 09168 g010
Figure 11. Home page of RUs web application.
Sustainability 16 09168 g011
Figure 12. Adding new potholes page of the web application.
Sustainability 16 09168 g012
Figure 13. Add new pothole prediction image.
Sustainability 16 09168 g013
Figure 14. Updating the pothole status page of the web application.
Sustainability 16 09168 g014
Figure 15. RUs web application.
Sustainability 16 09168 g015
Figure 16. Pothole image samples: (a) Jeddah, Saudi Arabia. (b) Spain.
Sustainability 16 09168 g016
Figure 17. An example of dataset annotation.
Sustainability 16 09168 g017
Figure 18. Augmentation: (a) Original image. (b) Noise, stretching, and flipping. (c) Noise and flipping.
Sustainability 16 09168 g018
Figure 19. A pothole image in the feature extraction phase.
Sustainability 16 09168 g019
Figure 20. Pothole detection process.
Sustainability 16 09168 g020
Figure 21. Random sample for the deep learning model testing results.
Sustainability 16 09168 g021
Figure 22. Confusion matrix for YOLOv8.
Sustainability 16 09168 g022
Table 2. Overview of the road users questionnaire: questions and answers.
CategoryQuestionsKey Answers
Pothole damagesQ1: Has your car ever been damaged by potholes on the road?- About 88.2% of respondents, who were drivers, reported that their cars had been damaged by potholes.
Q2: Do you think potholes may cause accidents?- About 99% affirmed that they believe potholes can cause accidents.
Q3: Do you think potholes can damage cars and cause injuries?- About 92.1% answered “Yes”, and 7.9% answered ”Maybe”.
Feedback about PDS-UAVQ4: Have you recently encountered any potholes on the road?- Almost 80% of participants had encountered potholes.
Q5: Would you prefer to use an application that allows you to view nearby potholes on your route?- About 83.2% answered “Yes”, and 11% “Partly”.
Q6: Do you think you will benefit from this application?- Almost 75% indicated they would benefit from the proposed system.
Q7: What is the preferred interface for the application?- Almost 59% of the participants preferred the mobile interface.
Q8: What other safety services would you like to be included in the new pothole application?- Participants suggested features such as ease of use, the ability to comment on potholes and the damage caused, displaying warning signs before potholes, and sending information about potholes to the municipality.
Table 3. Results of algorithm-testing experiments.
AlgorithmEpoch No.PrecisionRecallF1 Score
YOLOv4-tiny1064%76%69%
5066%62%63%
10082%76%79%
YOLOv51073%62%67%
5069%74%71%
10082%83%82%
YOLOv81077%75%75%
5086%82%83%
10098%92%95%
Table 4. Sign-up unit testing.
Test IDTest Case DescriptionInput DataExpected ResultsActual ResultsPass or Fail
1Tests if the user enters an existing email on the sign-up pageEmail: samaher@gmail.comWeb app will show this message: “email-already-in-use”As expectedPass
2Test if the user inputs incomplete information for signing upEmail: Not providedWeb app will show this message: “Enter valid email”As expectedPass
3Test if the user inputs wrong informationEmail: samaher@gmailWeb app will show this message: “Invalid email address”As expectedPass
4Test if the user enters a wrong passwordPassword: 12345Web app will show this message: “Password must be composed of characters and numbers and must be at least 6 characters”As expectedPass
5Test if the user enters a wrong first name or last name formatFirst Name: samaher3Web app will show this message: “the name should only contain alphabets”As expectedPass
6Test if the user enters a wrong phone numberphone number: 55703456Web app will show this message: “Phone number must be 9 numbers“As expectedPass
Table 5. Adding potholes unit testing.
Test IDTest Case DescriptionInput DataExpected ResultsActual ResultsPass or Fail
1Test if the user enters the wrong location information for the portholeDistrict: 12345Web app will show this message: “the district should only start with alphabets”As expectedPass
2Test if the user enters a valid longitudeLongitude: Not ProvidedWeb app will show this message: “Longitude Field is required”As expectedPass
3Test if the user enters a valid LatitudeLatitude: 0.26333Web app will show this message: “Please enter a valid Latitude”As expectedPass
4Test if the user uploaded a pothole imageNo Image is uploadedWeb app will show this message: “Please upload the pothole image”As expectedPass
Table 6. Integration testing.
Test IDTest Case ObjectiveTest Case DescriptionExpected ResultsActual ResultsPass or Fail
1Test the link between welcoming page and sign-up page.If the user clicks on the sign-up on the welcoming page, the sign-up page will be displayed.The sign-up page will be shown.As expectedPass
2Test the link between welcoming page and log-in page.If the user clicks on log-in on the welcoming page, the log-in page will be displayed.The log-in page will be shown.As expectedPass
3Test the link between the log-in page and home page.If the user enters the correct email and password, the home page will be displayed.The home page will be displayed if the entered credentials are correctAs expectedPass
4Test the interface link between the homepage and the map.The map is displayed in the center with markers showing detected potholes.The map with clickable potholes markers will be displayedAs expectedPass
5Test the interface link between the marker on the map and the update page.If the user clicks on a specific marker on the map, the pothole update page will be displayed.The user will be directed to the pothole update page for the selected marker on the map.As expectedPass
6Test the interface link between the homepage and the pothole upload page.If the user clicks on upload pothole on the homepage, the upload pothole page will be displayed.The user will be directed to the pothole uploadAs expectedPass
7Test the interface link between the pothole upload page and the homepage.If the user fills in pothole information, click on upload, and if the upload is successful, the homepage will be displayed.The user will be directed to the home page if uploading the pothole information is successful.As expectedPass
8Test the interface link between the pothole upload page and the model prediction page.If the user uploads a pothole image and then clicks ’Predict,’ the prediction results will be displayed.The model prediction result of the uploaded pothole image will be displayed.As expectedPass
Table 7. Usability testing results.
Participant No.Sign UpSign InAdd New PotholeUpdate Pothole StatusSign OutView PotholesTask Rating
1120 s45 s90 s90 s5 s80 s4.8
2240 s60 s120 s50 s8 s110 s4.4
3180 s31 s182 s95 s15 s112 s3.8
464 s15 s53 s75 s2 s133 s4.0
5103 s42 s133 s82 s11 s97 s4.7
Average141.4 s38.6 s115.6 s78.4 s8.2 s106.4 s4.3
Disclaimer/Publisher’s Note: The statements, opinions and data contained in all publications are solely those of the individual author(s) and contributor(s) and not of MDPI and/or the editor(s). MDPI and/or the editor(s) disclaim responsibility for any injury to people or property resulting from any ideas, methods, instructions or products referred to in the content.

