Abstract
The aspiration to reach the net zero carbon target has initiated new ideas for the sustainable development of the world economy. However, it has also accelerated the formation of stranded assets in high-carbon-emitting companies. Taking a Chinese thermal power company as an example, this paper proposes a model to estimate the degree of impairment loss for thermal power companies by integrating the net present value model with forward-looking carbon emission pathways under different policy intervention scenarios. The results show that under the low-carbon transition scenario with different policy interventions, the percentage of impairment loss of thermal power companies reaches up to 64.09%. Furthermore, impairment losses formed by stranded assets in the thermal power sector impose a severe shock on the national economy, as most of the impairment losses will ultimately be borne by the state treasury. Compared with conventional thermal power generation, new-energy power generation has a weak performance in delaying company bankruptcy caused by stranded assets. Therefore, in the process of a low-carbon transition, governmental departments should focus on the impairment loss of thermal power companies caused by stranded assets and should further integrate “green support” and “brown punishment” policies to effectively promote the low-carbon transition of thermal power companies.
1. Introduction
The warming climate has recently become an issue of global concern, and countries around the world are actively implementing countermeasures. The Paris Agreement, signed in 2015, stipulates the commitment to limit the rise in global average temperature to less than 2 °C above preindustrial levels by 2100, which is to be achieved by controlling carbon emissions. In response, countries around the world have proposed different low-carbon transition targets. In 2020, China also announced that it will reach peak carbon emissions by 2030 and achieve net zero carbon emissions by 2060.
The power sector is currently the largest carbon-emitting sector in the world. Therefore, the time when the peak carbon emissions of the power sector are reached determines whether low-carbon transition can be achieved within the stipulated time frame. The power sector produces more than 40% of total Chinese carbon emissions. In 2021, the Chinese total power generation was about 8112 billion kWh, of which thermal power generation accounted for 71.13%. Therefore, reducing carbon emissions generated by thermal power companies and transforming conventional power generation are crucial measures for achieving the low-carbon transition and high-quality development of the Chinese economy.
The huge amount of carbon emissions resulting from thermal power generation cannot be ignored. With the proposal of a low-carbon transition target and relevant policies, conventional power companies engaged in thermal power generation face early obsolescence of high-carbon related assets, which thus become so-called stranded assets. This stranding of assets poses a challenge to the sustainable operation of thermal power companies and affects investors’ expectations of their solvency. Modern company assessments focus not only on the current financial performance and risk but also on the sustainable operation of the company. Consequently, it is essential to estimate the stranded asset impairment losses of thermal power companies.
Because of the difficulty associated with predicting the forward-looking low-carbon transition pathway of thermal power companies, quantitative studies on the revaluation of stranded assets and impairment losses are rare [1,2]. To provide further insight, this study examined a Chinese thermal power company named Huayin Electric Power Co., Ltd. (short form, Huayin), located in Changsha, Hunan Province, China, as an example in order to develop a case study. The carbon emission pathways of the shared socioeconomic pathways (SSP) and net present value (NPV) model are integrated to estimate the possible impairment losses of the thermal power company caused by stranded assets in the low-carbon transition. Accordingly, the shocks of impairment losses and drivers affecting the achievement of low-carbon transition are analyzed. The results of this study help to assess the impact of the net zero carbon target on the future production and operation of conventional thermal power companies. This study also provides a reference for power companies to cope with often considerable stranded asset impairment losses and achieve the low-carbon transition. In addition, given the indebtedness of most power plants, the results show how the allocation of funds in the financial market can be optimized and how financial stability can be maintained.
The main contributions of the study are as follows: A stranded asset revaluation model for thermal power companies is proposed that integrates carbon emission pathways and the NPV model under different low-carbon transition scenarios. Then, a comprehensive analysis of shocks formed by stranded asset impairment of thermal power companies in the Chinese market is presented. Finally, drivers affecting the participation of thermal power companies in the low-carbon transition are also explored.
The rest of this paper is structured as follows: Section 2 presents a review of related literature. Section 3 proposes a stranded asset revaluation model for the impairment loss estimation of thermal power companies. Section 4 takes the company Huayin as an example to estimate the impairment loss of this thermal power company caused by stranded assets. Section 5 provides further analysis of the market effect of impairment loss in the thermal power sector. Section 6 presents the conclusions and offers insights for both thermal power companies and governments.
2. Literature Review
The low-carbon transition of the economy has received increasing attention because of the severity of the global environmental situation. Although low-carbon transition is closely related to sustainable company development, it also increases the financial risk of companies over a short period [3,4,5]. Research has shown that excessive costs resulting from environmental investments negatively affect the business performance of companies and increase their financial risk [6,7]. At the same time, part of the investments cannot generate earnings during the low-carbon transition, which puts increasing pressure on the capital flow of companies [8].
Moreover, if companies fail to adequately anticipate the impacts of factors such as climate policies, technological innovation, and consumption upgrading in their low-carbon transition [9,10,11], their businesses that rely on conventional fossil energy will be subject to a shock and stranded assets will be created [12,13]. The write-off of extensive stranded assets also imposes a serious shock on the finances of these companies [14,15]. However, companies usually neglect the effect of stranded assets.
If the carbon emissions caused by the use of fossil fuels exceed the carbon budget set in the low-carbon transition pathway to meet the Paris Agreement, the usage of fossil fuels will be subject to a forced reduction by policy interventions. Consequently, the value of stranded fossil fuel assets will be lost [16]. According to McGlade and Ekins [17], to meet the climate goals stipulated by the Paris Agreement, one-third of oil reserves, half of the natural gas reserves, and nearly 90% of coal reserves would become stranded assets. In the absence of market expectations, the short-term value loss of these enormous stranded assets in the conventional fossil fuel sector will likely cause turmoil in global financial markets [18,19,20].
Many studies have measured stranded fossil fuel assets in low-carbon transition scenarios under the net zero carbon target [21,22]. These studies mainly used complex systems to predict forward-looking carbon emission pathways under different low-carbon transition scenarios and estimated stranded fossil fuel assets based on their carbon emissions [9,23,24]. However, few studies have revalued stranded assets from the perspective of companies involved in the extraction, production, and transportation of fossil fuels, and power generation using fossil fuels [1,2,25]. Research has shown that the market value of fossil fuel reserves is equivalent to the present value of the expected cumulative net revenues from their extraction [26]. Riedl [2] has examined the valuation and transition risk of the oil producer ExxonMobil under different low-carbon transition policy intervention scenarios using a discounted cash flow model. Hansen [25] also used a discounted cash flow model to estimate the size and loss distribution of stranded assets in the fossil-fuel-extraction sector. Based on the same methodology, Hickey et al. [1] applied a stranded asset revaluation model to electric utilities that consume fossil fuels and proposed a new measure of forced impairment losses for electric utilities caused by carbon emission restrictions based on a database of power plants. The present study complements the estimation of impairment losses caused by the revaluation of stranded assets from a company perspective.
This work further extends the methodology of Hickey et al. [1] for the stranded assets revaluation of power companies by integrating the carbon emission pathways of different low-carbon transition scenarios. This integration allows us to determine the timing of early obsolescence of thermal power plants and, thus, to estimate the devaluation of thermal power companies resulting from different low-carbon transition scenarios.
3. Methodology
3.1. Impairment Loss Estimation
Assuming that all assets of a thermal power company are used for thermal power plants, then the market value of the thermal power plant is determined by the NPV of its expected net revenue. Using 2021 as the initial time for investments, the following equation is used according to the NPV model:
where d is the required return on investments, A is the market value of the thermal power plants, Ry is the net revenue in year y, and Y is the expected lifetime of the thermal power plant.
The power plants will continue thermal power generation for their expected lifetimes if the thermal power company runs normally. However, the probability of forced early obsolescence of thermal power plants increases when the net zero carbon target is proposed. In the case of early obsolescence, the expected market value of the thermal power plants is expressed as follows:
where NA is the market value of the thermal power company under the low-carbon transition scenario; NY represents the actual lifetime of thermal power plants in the case of early obsolescence, which is determined by the actual power generation under the low-carbon transition scenario. Assuming that the target management is based on the total thermal power generation capacity of thermal power plants in the case of the low-carbon transition, the number of years that thermal power plants can maintain thermal power generation under normal operation is deduced backward according to the determined total power generation. That is the calculation of NY. Using 2021 as the initial time for investments in conventional thermal power plants, the actual lifetime can be calculated as follows:
where Gny represents the actual thermal power generation per year (2060 for China according to its government target) during the net zero carbon transition period for thermal power companies under different low-carbon transition scenarios, which is determined according to the carbon emission pathway under different low-carbon transition scenarios. Gy represents that the thermal power generation under normal operation of thermal power companies during the low-carbon transition is not considered in the life cycle, which is determined according to the carbon emission pathway in the absence of policy intervention. Data for the carbon emission pathways were obtained from the SSP database.
The market value difference in both low-carbon transition and normal scenarios is the impairment loss of the thermal power plants caused by stranded assets. The impairment loss LA of the thermal power company is expressed as:
The annual net revenue of the thermal power company is calculated as the product of the thermal power generation in the normal scenario and the marginal net revenue generated per unit of power generation [1]:
where the annual thermal power generation Gy is determined by the carbon emission pathway without policy intervention, and the marginal net revenue MRy is calculated by the capital recovery approach. The capital recovery approach stipulates that the initial capital is recovered at a determined discount rate on investments over the lifetime of assets. Based on the assumption that all assets of the thermal power company are used for investment in thermal power generation plants, the process of recovering the initial capital can be expressed as follows:
where C is the capital cost of the thermal power plant, Ry is the net revenue of the thermal power company in year y, Y is the expected lifetime of assets, and d is the expected discount rate.
The net revenue of a thermal power company is determined by the product of generated power and marginal net revenue, while the power generation of a thermal power company is determined by the product of the installed capacity Q, the annual generation time H, and the unit utilization rate U of the thermal power generation plant.
Then MRy can be calculated from Equation (7):
Substituting MRy expressed in Equation (8) into Equation (5) obtains the expression for the annual net revenue of a thermal power company in normal operation.
Accordingly, market values of the thermal power plants in both the low-carbon transition and normal scenarios, and the impairment loss of the thermal power company caused by stranded assets are calculated further.
Table 1 summarizes the key symbols introduced in this section for the estimation of impairment loss.

Table 1.
Key symbols used for the estimation of impairment loss.
3.2. Low-Carbon Transition Scenarios
Governmental interventions are often used to force the transition of high-carbon companies to achieve the net zero carbon target. The pathway to the low-carbon transition may differ in relation to the different levels of governmental intervention [27,28,29]. Therefore, different low-carbon transition scenarios need to be assessed to determine the impairment losses of thermal power companies with respect to stranded assets. This paper uses the SSP database to determine different low-carbon transition scenarios and corresponding carbon emission pathways. Then, the forward-looking power generation of the thermal power company is estimated based on these carbon emission pathways.
The four scenarios SSP1–19, SSP2–45, SSP4–60, and SSP5–85 (abbreviated by SSP1, SSP2, SSP4, and SSP5, respectively) are used in this study; these represent the scenarios of 1.9 W/m2 radiation forcing in 2100 with stringent policy intervention, 4.5 W/m2 radiation forcing in 2100 with general policy intervention, 6.0 W/m2 radiation forcing in 2100 with mitigated policy intervention, and 8.5 W/m2 radiation forcing in 2100 without policy intervention, respectively. The statistics of carbon emission pathways for different low-carbon transition scenarios are shown in Table 2. In addition, the SSP5 pathway, a low-carbon transition scenario without governmental intervention, is used to estimate the power generation and net revenue of thermal power companies under normal conditions.
Table 2.
Carbon emissions under four different low-carbon transition scenarios (Unit: Mt).
4. Estimation of Impairment Losses on Stranded Assets
4.1. Data and Parameters
The case study examines the company Huayin, which is affiliated with the second-largest power generation company in China. Its main business is conventional thermal power generation, which is highly affected by low-carbon transition policies. In addition, Huayin is actively responding to the low-carbon transition, thus providing an effective sample for exploring the estimation of impairment loss caused by stranded assets for thermal power companies.
As shown in Table 3, the capital expenditure and unit utilization rate for power plants using different fuels is set in reference to Hickey et al. [1], based on which the expected net revenue of the company is calculated. Given that the main fuel Huayin uses to generate thermal power is coal, its capital expenditure is defined as CNY 14,600/kW, the interest rate is 5%, and the unit utilization rate of the power plant is 61.33%. According to financial statements of 2021, Huayin has an installed capacity of 5240 MW and generates 24 h of power per day. Therefore, the marginal net revenue of Huayin is CNY 158.41/kWh per year, and the marginal net revenue of other fuels is calculated in the same way.
Table 3.
Parameters of different power generation fuels.
4.2. Impairment Losses of the Thermal Power Company
According to the progress of China’s low-carbon transition, the impairment loss of Huayin caused by stranded assets between 2022 and 2060 is examined, using 2030 as the time of peak carbon emissions and 2060 as the time for achieving net zero carbon emissions. The annual power generation of Huayin under the net zero carbon target is estimated based on the carbon emissions of different scenarios, and the results are shown in Table 2. SSP1 peaks earlier and successfully achieves the net zero carbon target; therefore, the following parts of this study focus on the impairment loss analysis using the SSP1 pathway. SSP2 and SSP4 achieved the peak carbon goal for China but failed to achieve the net zero carbon target. SSP5 reflects the carbon emission pathway for normal operations without any policy intervention, which continuously follows an upward trend.
4.2.1. Impairment Losses on Coal Fuel
Using 5 years as phase duration, the power generation of Huayin from 2022 to 2060 is estimated based on its carbon emissions under different low-carbon transition pathways. Taking SSP1 as an example, the year of early obsolescence of conventional thermal power plants is calculated. The sum of the present value of net revenue from 2022 to the year of early obsolescence under the SSP5 pathway is used as the impaired market value. Further, the present value of the net revenue from 2022 to 2060 is calculated based on the power generation of the SSP5 pathway and is used as the normal market value. Then, the impairment loss caused by stranded assets is derived, as shown in Table 4.
Table 4.
Impairment loss of Huayin under the SSP1 pathway.
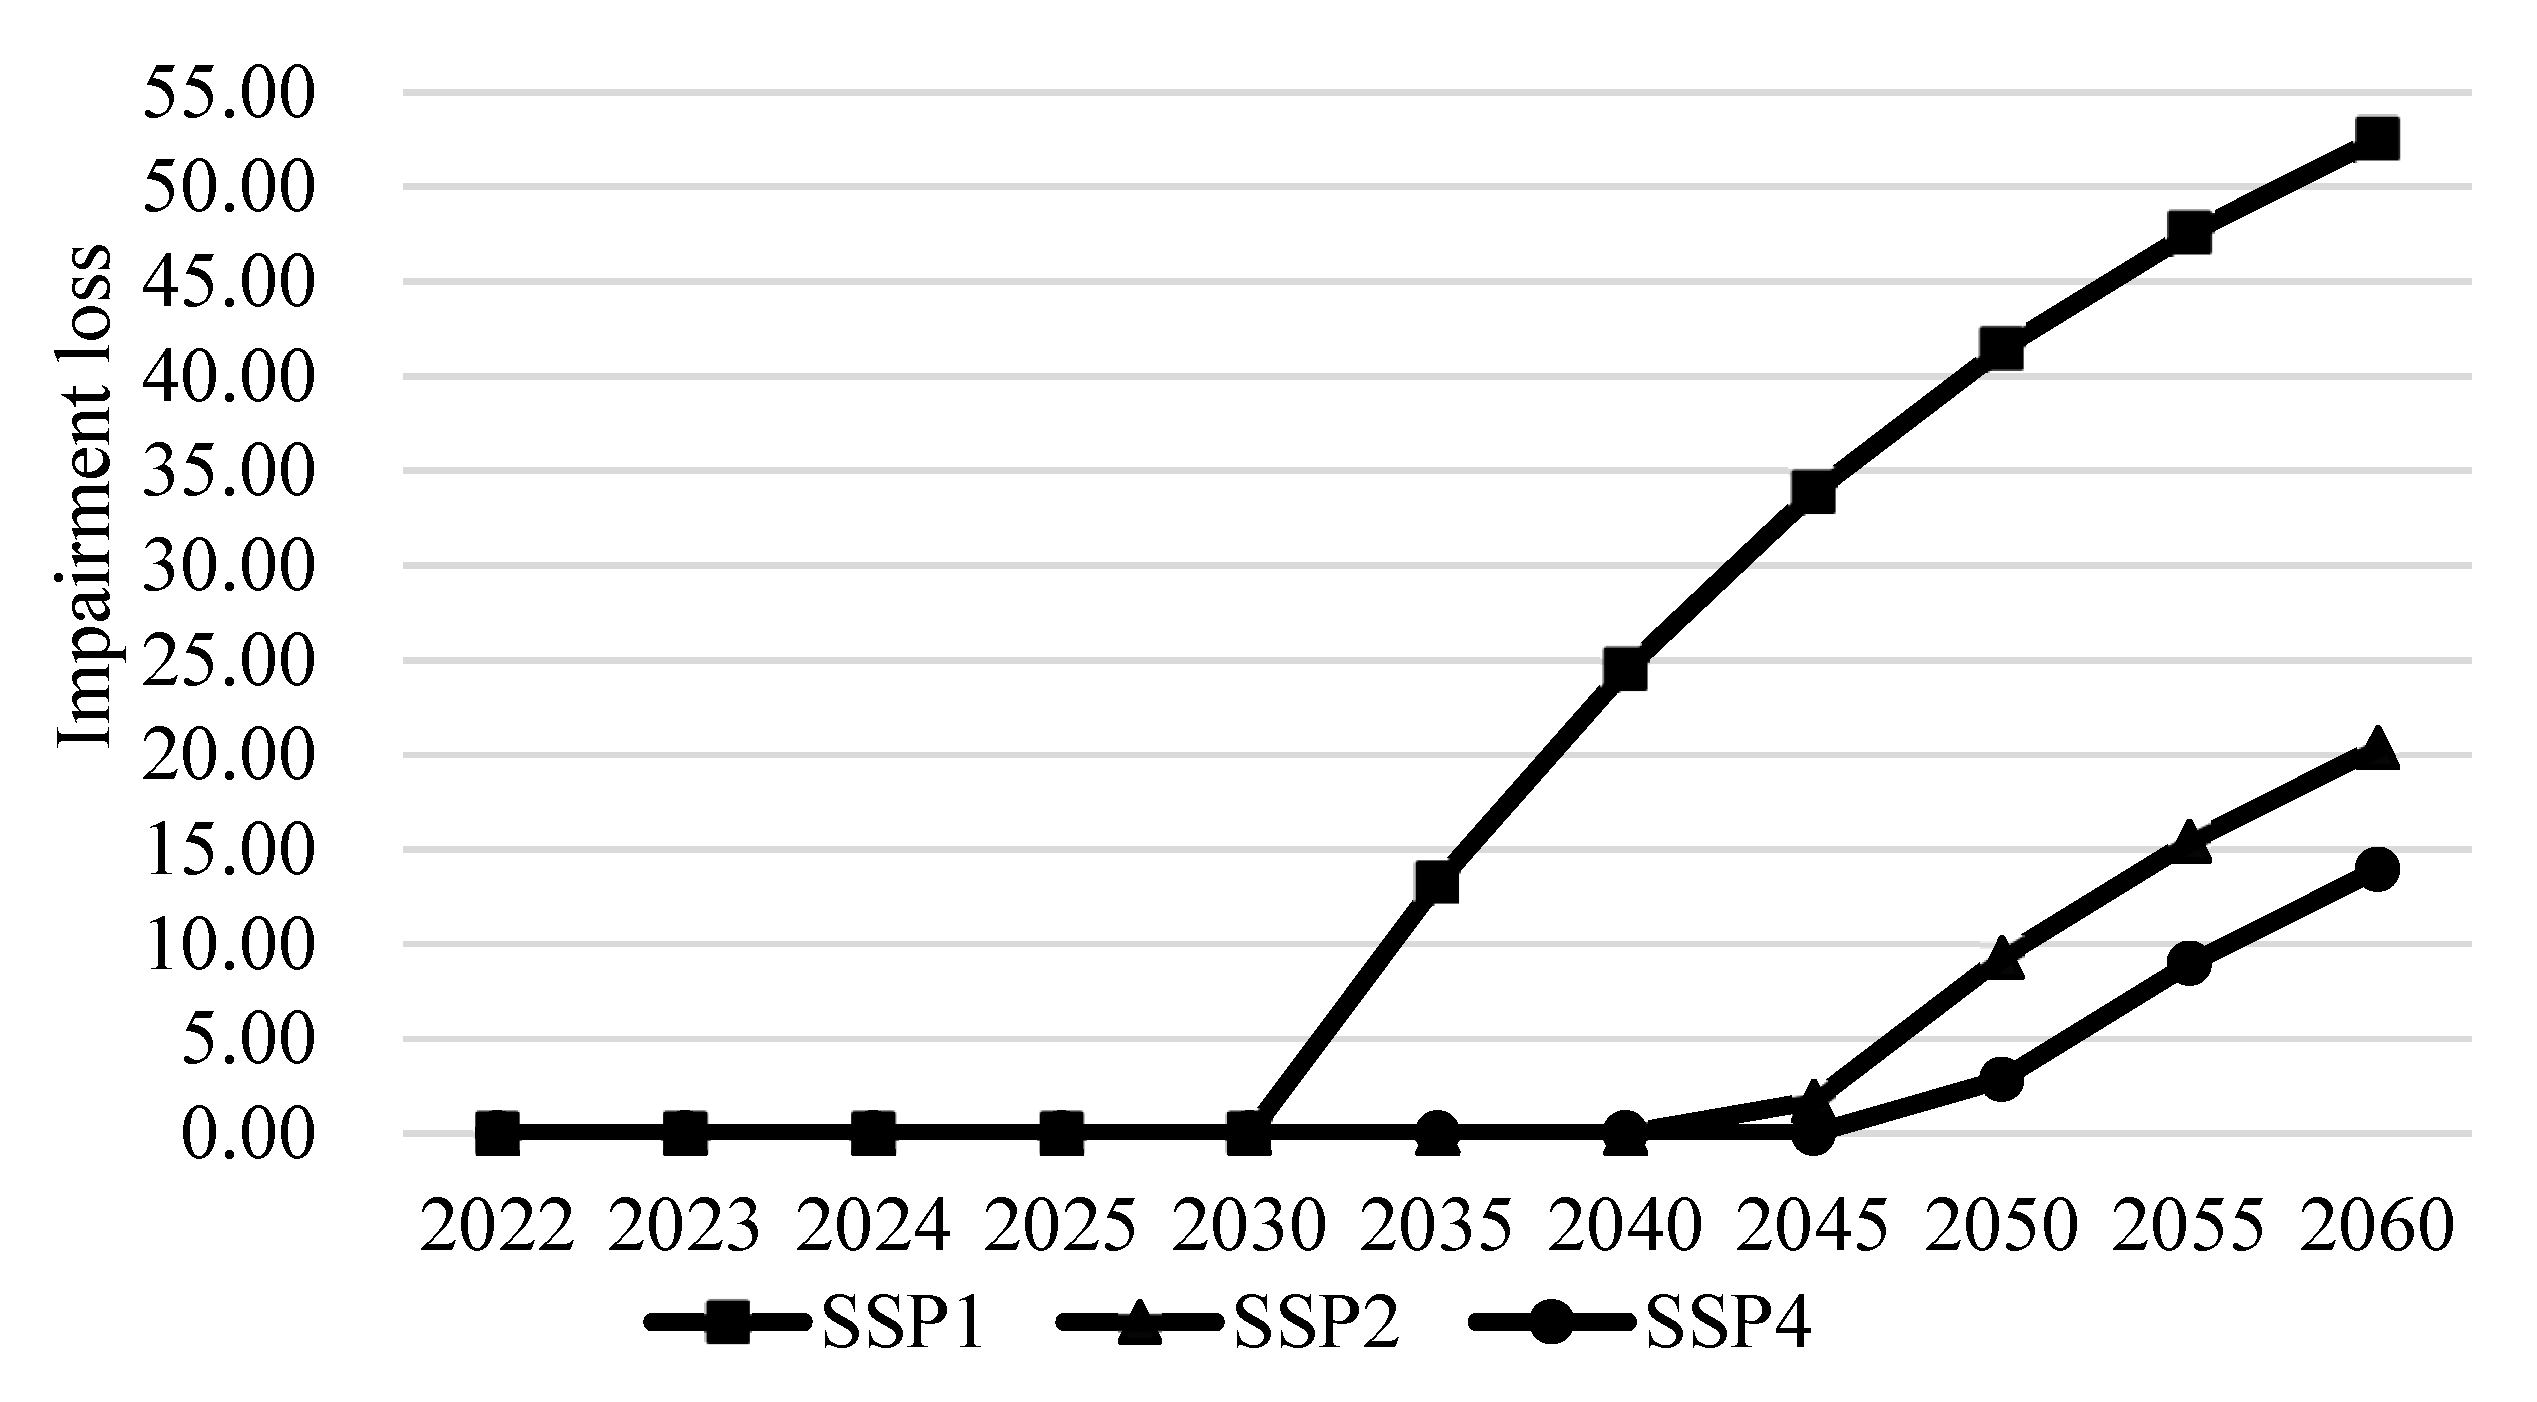
Based on the above methodology, the impairment loss of Huayin under different low-carbon transition pathways and the ratio of impairment loss to the market value of the company is calculated as shown in Table 5 and Figure 1. The impairment loss of Huayin under the SSP1 pathway (with stringent policy intervention) is serious, with the highest impairment loss reaching 64.09%. As SSP1 meets the carbon emissions under the net zero carbon target, normal operation will be harmed in 2060 if Huayin does not make its low-carbon transition in time. Under the SSP2 and SSP4 pathways, although the impairment loss of Huayin is significantly reduced, the pressure to achieve the net zero carbon target is greater. Figure 1 further shows the annual cumulative impairment loss trend of Huayin under different pathways. It shows that the impairment loss curve of Huayin under the SSP1 pathway, a sustainable path with strict policy intervention, is steeper, while the annual increase of impairment loss under the SSP2 or SSP4 pathways is relatively gentle. It indicates that under the SSP1 pathway, the impairment of stranded assets of Huayin is more severe. Thus, stringent policy interventions are still required for the low-carbon transition. This is the reason why the stringent policy intervention pathway SSP1 is chosen for this study.
Table 5.
Impairment loss of Huayin under different pathways.
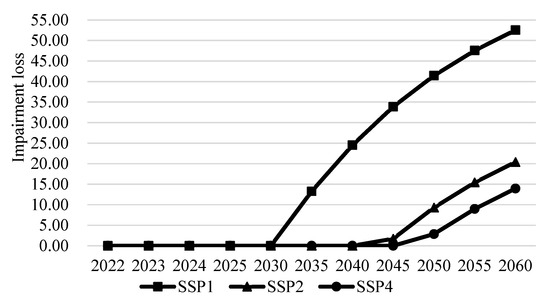
Figure 1.
Impairment loss of Huayin under different pathways (billion CNY).
4.2.2. Impairment Losses on Other Fossil Fuels
Although Huayin uses coal as the main fuel for thermal power generation, thermal power companies may also use gas, oil, and biomass as fuels. The impairment loss of stranded assets under the SSP1 pathway is shown in Table 5 for scenarios where Huayin uses each of these three fossil fuels for thermal power generation. A comparison of Table 5 and Table 6 shows that the impairment loss is the most severe when oil and coal are used, followed by gas. Despite differences, the ratios of impairment loss for power generation from conventional fossil fuels exceed 60%, while the ratio for power generation from biomass is only 43.53%. Therefore, coal, gas, and oil are heavily affected by the low-carbon transition, while biomass fuels are less affected. Thermal power companies should actively transfer their use of fossil fuels by developing clean energy such as biomass to reduce impairment losses of stranded assets caused by policy interventions imposed to achieve net zero carbon targets [30].
Table 6.
Impairment loss for different fossil fuels under the SSP1 pathway.
4.2.3. Impairment Losses on Other Companies
Different thermal power companies have different responses in the process of the low-carbon transition. Their characteristics, such as the operating performance and energy structure, will have impacts on the process of low-carbon transition. The differences are further demonstrated by comparing their impairment loss in the process of low-carbon transition. In this paper, two companies with different characteristics are selected for comparative analysis, respectively named Wintime Energy Group Co., Ltd. (short form, Wintime), located in Jinzhong City, Shanxi Province, China, and GCL Energy Technology Co., Ltd. (short form, GCL), located in Suzhou City, Jiangsu Province, China. GCL is a gas-fueled power company, while Wintime’s total assets are about five times that of Huayin. The same method is adopted to estimate the stranded asset impairment losses of these two companies under the SSP1 pathway. The proportion of accumulated impairment losses in their total assets is used to describe the impairment scale of the company. The data in Table 7 shows that both GCL and Wintime have smaller impairment scales than Huayin. In indicates that companies that choose clean energy are less affected by the impairment of stranded assets, and carrying out new-energy transformation in advance is conducive to the long-term development of companies. Although Wintime is mainly dependent on traditional fossil energy power generation, large companies usually have more adequate financial support. The stronger risk resistance ability helps to cope with the negative impact of stranded asset impairment loss. In addition, the current profitability indicators of Wintime and GCL, represented by ROA and gross profit margin, are better than those of Huayin. This highlights the comparative advantages of operating performance and energy structure in addressing the low-carbon transition.
Table 7.
Impairment loss for different companies under the SSP1 pathway.
4.3. Shock of Impairment Losses
Large impairment losses on stranded assets may affect the normal operation of Huayin and could even lead to insolvency. The impairment losses of Huayin are further compared with its net worth to explore the ability of Huayin to cope with shocks originating from stranded assets. The changes in net worth are presented in Table 8, showing that Huayin will be bankrupt in 2048 under the stringent low-carbon transition policy intervention scenario, which means that Huayin faces serious pressure to make the low-carbon transition. Therefore, Huayin needs to achieve its low-carbon transition as soon as possible to withstand stringent policy intervention and ensure normal operation.
Table 8.
Change in net worth of Huayin under the SSP1 pathway.
5. Further Analysis of Impairment Loss
5.1. Impairment Losses in the Thermal Power Sector
According to the case study of Huayin and data on the national thermal power generation of China in 2021, the impairment loss of the thermal power sector can be estimated. Taking the SSP1 pathway as an example, the impairment loss of the entire thermal power sector from 2022 to 2060 is shown in Table 9. The average year of obsolescence of thermal power plants in China is 2037. The market value of the thermal power sector is CNY 19,640.15 billion, while the impairment loss caused by stranded assets is CNY 8837.15 billion, accounting for 45.00% of the market value. A comparison of the average annual impairment loss in the thermal power sector with the national GDP in 2021 shows that the proportion is about 0.20%. This result indicates that the impairment loss in the thermal power sector formed by stranded assets during the low-carbon transition will impose a serious shock on the Chinese economy.
Table 9.
Impairment loss in the thermal power sector under the SSP1 pathway.
5.2. Heterogeneity Analysis of Impairment Losses
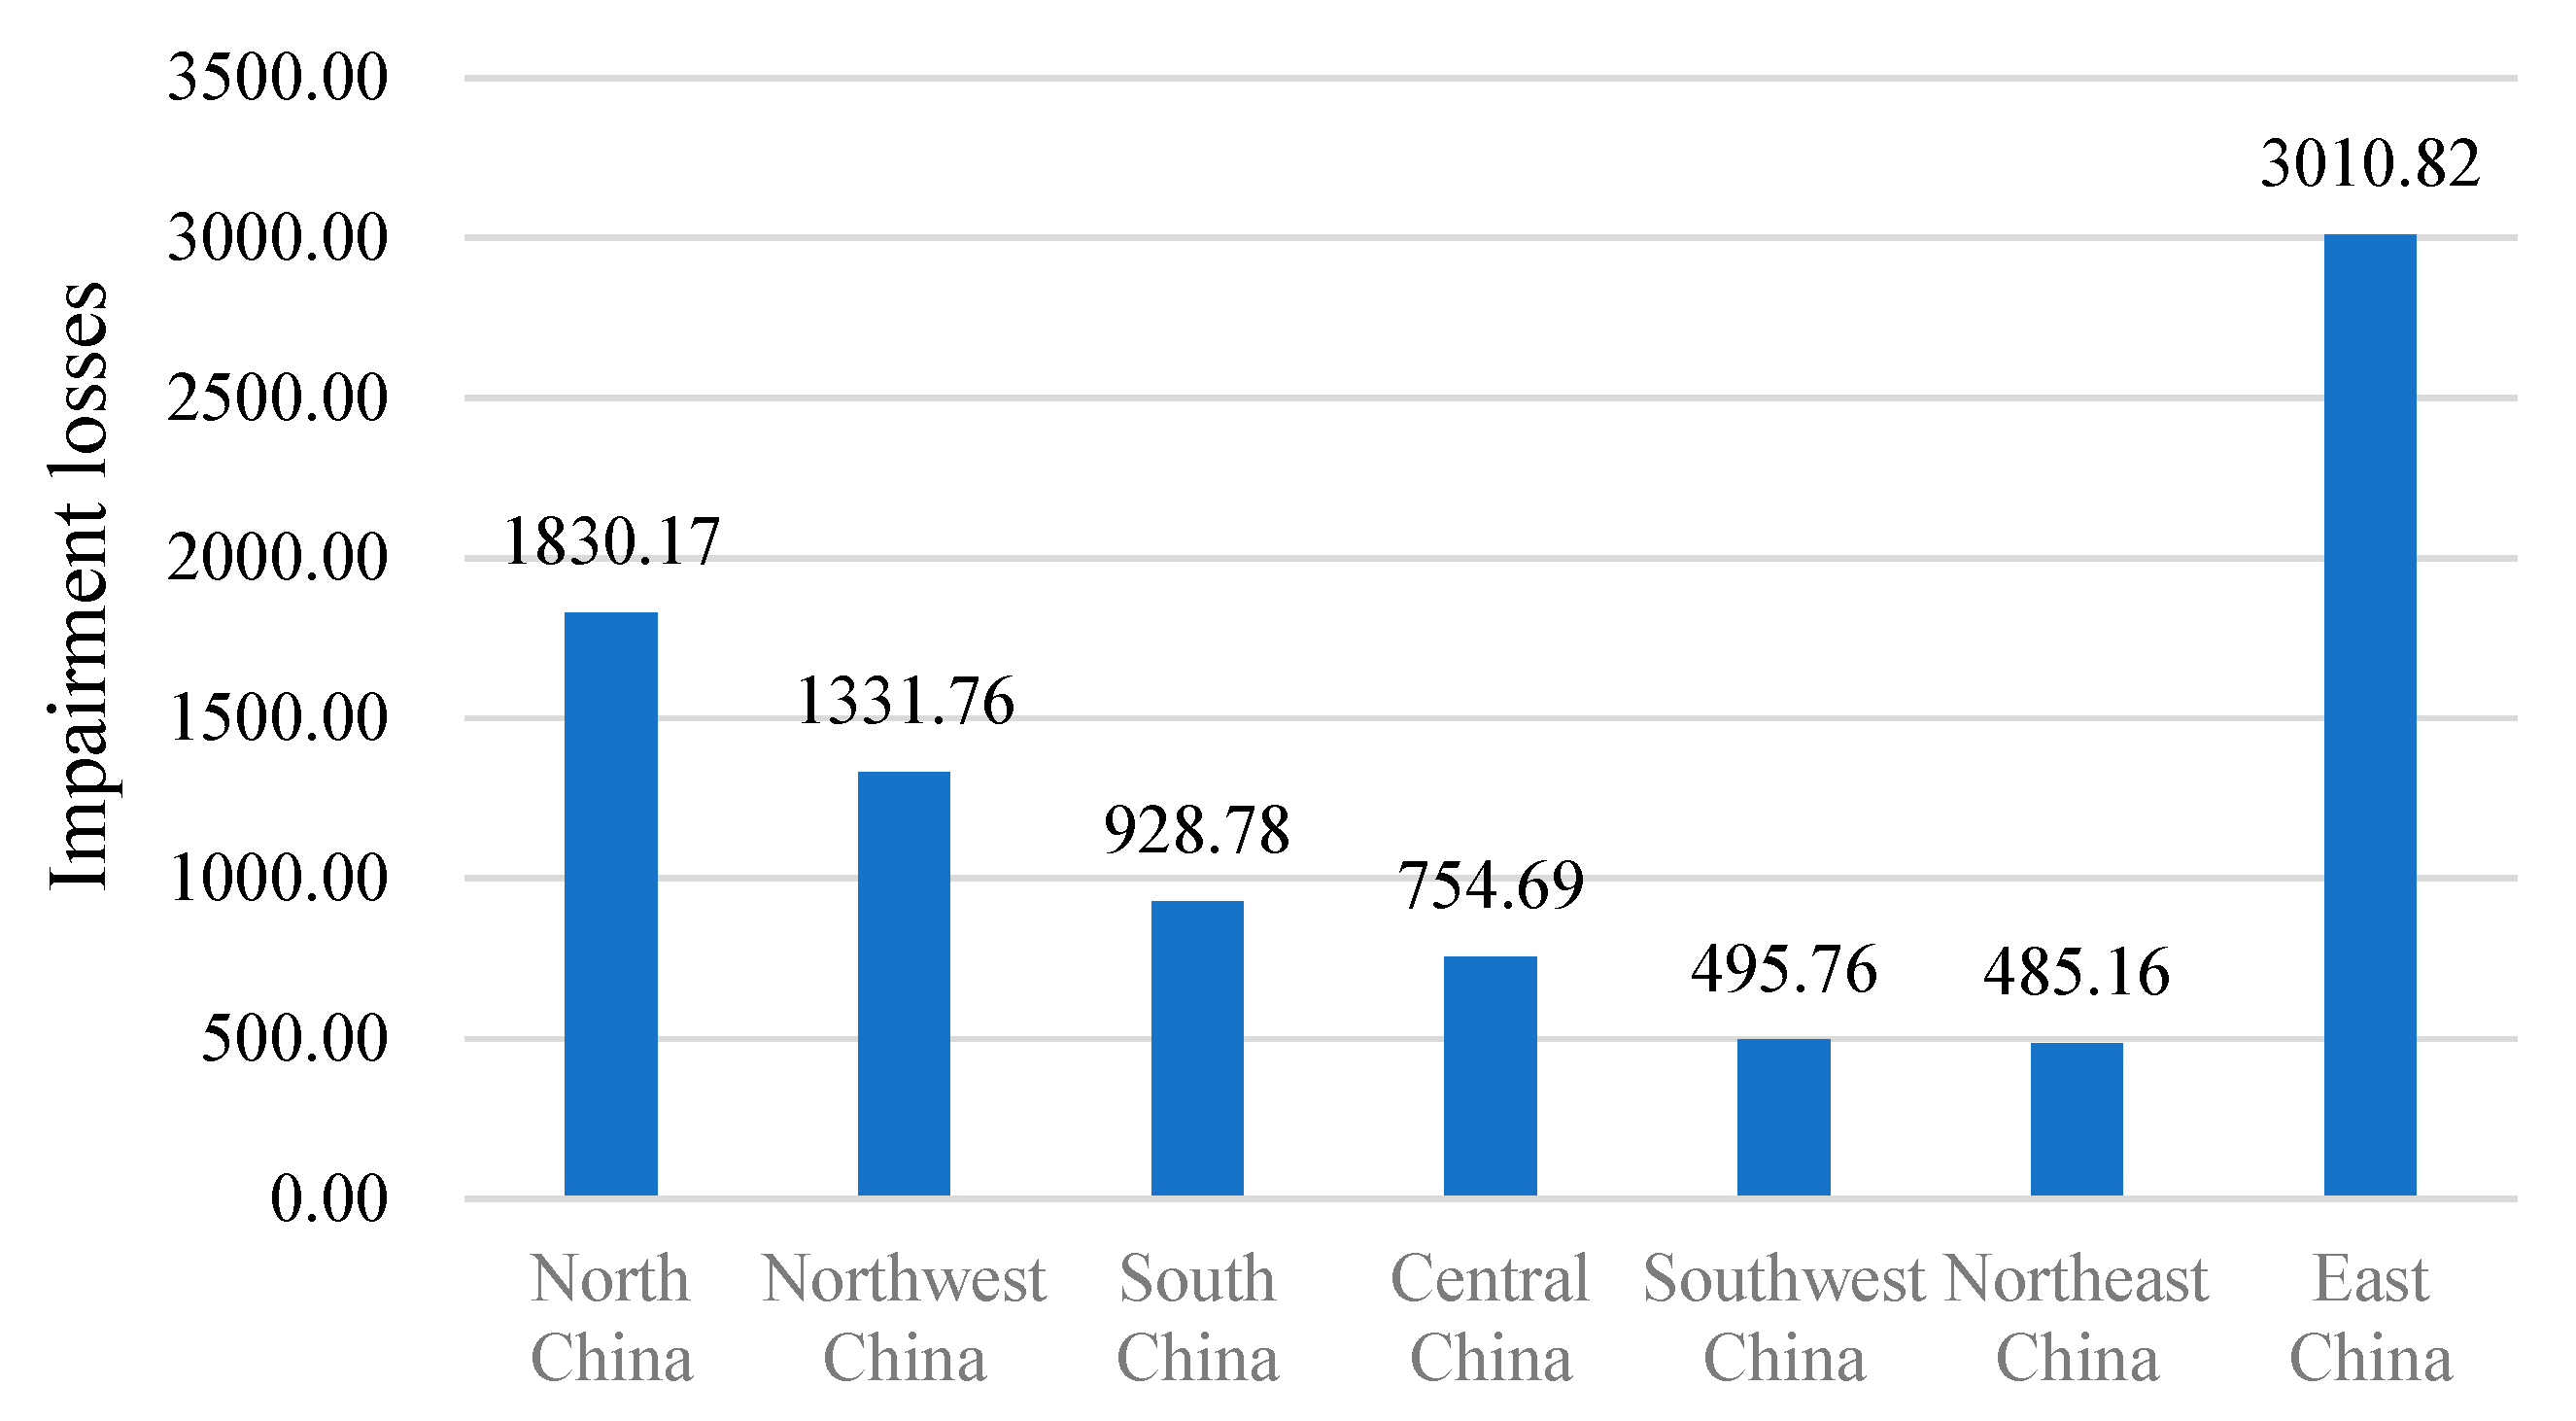
The geography and ownership heterogeneity of impairment losses caused by stranded assets in the thermal power sector are analyzed. In China, thermal power generation is geographically dispersed. The resulting geographic heterogeneity of impairment losses in the thermal power sector is presented in Figure 2, subdivided into thermal power generation levels of different regions. East China has the highest impairment losses compared to other regions because of the larger population and resulting higher power demand, which has led to the emergence of more thermal power companies. Therefore, East China faces more urgent challenges in the process of achieving a low-carbon transition.
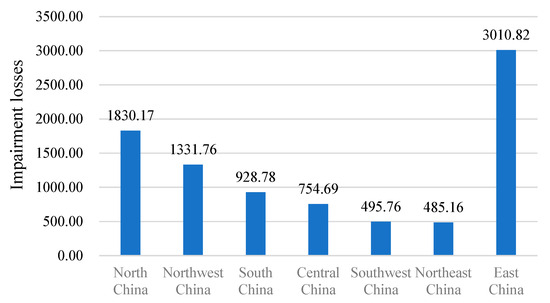
Figure 2.
Impairment losses in the thermal power sector of China according to different regions (billion CNY).
In addition to this geographic heterogeneity, thermal power companies in China also differ in terms of their ownership. State-owned companies generally dominate the power sector because of historical factors. Therefore, 26 A-share thermal power generation companies listed on the Shanghai exchange are used as a sample for the ownership heterogeneity analysis. The results are shown in Table 10. The total power generation of these 26 companies in 2021 was 1797.28 billion kWh, accounting for 31.72% of the national thermal power generation. Among them, only one company is a private enterprise, while all others are state-owned companies. The thermal power generation of these state-owned companies accounts for 98.26% of all chosen thermal power companies. Furthermore, the impairment losses of state-owned companies account for 96.72%. Most of the impairment losses of thermal power companies caused by the net zero carbon target are, therefore, ultimately borne by the government. Consequently, Chinese finance may be subject to a serious shock in the future if thermal power companies fail to make effective low-carbon transitions in time. In fact, achieving the net zero carbon target requires a lot of capital and technology investment from the economy and society, and the cycle is also slow. Therefore, taking into account the interests of most thermal power companies, the government needs to assume more responsibilities in the process of promoting social low-carbon transition and assist thermal power companies in reasonable transition.
Table 10.
Impairment losses of A-share listed thermal power companies in China.
5.3. Drivers of the Low-Carbon Transition
The pressure imposed by policy interventions under the net zero carbon target will cause impairment losses on investments in conventional power plants in the thermal power sector. This disadvantage will be mitigated by the transition from fossil fuels to new energy. Therefore, thermal power needs to be transformed into low-carbon new-energy generation, using resources such as wind, solar, and tidal energy as well as modern biomass [31]. However, this new-energy generation is less profitable than conventional thermal power generation because of the high investment costs needed for unstable generating units, limited environmental conditions, and problems with energy storage. As shown in Figure 3, fossil fuels such as oil, gas, and coal all yield higher profits than new energy. The average profit of new-energy generation from 2011 to 2020 was only 0.1%. Even for big companies, the average profit could not be increased beyond 3.0%, which is much lower than the average profit of thermal power. This result suggests that this difference in profits may be a key factor undermining the active transition from conventional thermal power to new-energy generation.
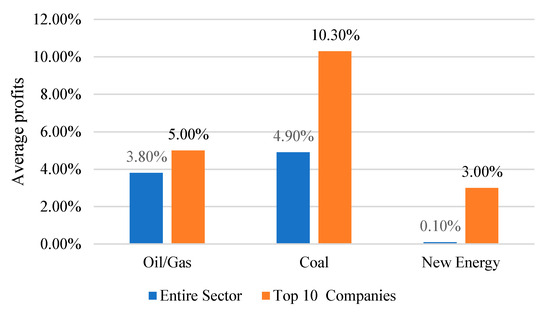
Figure 3.
Average profits of fossil fuels and new energy in 2011–2020.
According to the shock imposed by impairment losses on the operation of thermal power companies (as shown in Table 8), in this paper, it is further assumed that the stranded assets are replaced by new-energy generation. This assumption is made to explore the drivers affecting the low-carbon transition of thermal power companies. In this case, stranded assets will continue to generate profits in the form of new-energy generation. Based on the profits obtained from new-energy generation shown in Figure 3, the lifetime of the thermal power company when replacing stranded assets with new-energy generation is 2050. However, without the low-carbon transition of stranded assets, the lifetime is 2048. This result highlights that the bankruptcy of thermal power companies will be slowed down if the new-energy transition of stranded assets is carried out in an orderly manner.
Table 11 further compares the lifetime of thermal power companies when power continues to be generated with conventional fossil fuels such as coal, oil, and gas. The results show that the lifetime increases considerably with fossil fuels, especially coal. This result highlights that the profits generated by new energy are relatively low compared to those generated by fossil fuels, and therefore, conventional thermal power generation companies are generally not willing to make the low-carbon transition. Therefore, the government needs to introduce policies to support new-energy generation by providing financial support for new-energy power plants as well as subsidies and incentives for new-energy power generation.
Table 11.
Lifetimes with low-carbon transition using different energy sources.
6. Conclusions
This paper presents a case study to explore the impairment loss of thermal power companies caused by stranded assets in the process of the low-carbon transition required to meet climate targets. This paper analyzes forward-looking carbon emission data provided by SSP according to different low-carbon transition scenarios using the NPV model. Impairment losses in the thermal power sector are also analyzed, an analysis of the economic consequences of stranded asset impairment is provided, and the drivers affecting the low-carbon transition of thermal power companies are examined. The main findings are summarized as follows:
First, the highest impairment loss for Huayin is 64.09% under different shared socioeconomic pathways. This means that under the SSP1 pathway (the only examined pathway that reaches the net zero carbon target), over 60% of capital expenditures will become stranded assets if the transition from conventional thermal power generation is not completed in time. If thermal power is generated using different fossil fuels, the use of biomass will result in the least amount of stranded asset impairment losses.
Second, under the low-carbon transition SSP1 pathway with stringent policy intervention, the average stranded asset impairment loss of the thermal power sector from 2022 to 2060 is about 0.20% of the Chinese GDP. This will impact the national economy. The results of equity heterogeneity analysis show that almost all the impairment losses in the thermal power sector caused by stranded assets will ultimately be borne by the state treasury. In addition, compared to other regions, the impairment losses of the thermal power sector are more severe in East China, suggesting that the need for a low-carbon transition is more urgent in East China.
Finally, thermal power companies will experience bankruptcy because of impairment losses caused by stranded assets. The high returns of conventional thermal power generation help delay these bankruptcies. However, given the difference in profitability between conventional thermal power generation and new-energy power generation, the latter has a relatively weak performance on bankruptcy improvements. As a result, most thermal power companies are still pursuing high-yielding power generation that relies on conventional fossil fuels.
These findings provide the following insights and suggestions to address the stranded asset impairment losses faced by thermal power companies in the low-carbon transition process:
Thermal power companies should focus on the impairment losses caused by stranded assets in the process of their low-carbon transition. They should respond to these impairment losses by replacing conventional thermal power generation with clean thermal energy and new energy ahead of time.
Governmental departments should provide guidance for the low-carbon transition of the thermal power sector and gradually upgrade the energy structure by introducing “brown punishment” measures to restrict power generation relying on conventional fuels. At the same time, “green support” measures need to be strengthened in terms of capital and technology to promote the development of new-energy power generation companies and help solve problems associated with the storage of new energy.
Investors should pay attention to the impact of climate transition risks on investment and financing and reasonably evaluate the value of investment projects with potential stranded risks. They need to change their investment preferences, reduce their investment in traditional energy assets, gradually shift to clean energy assets, and adopt diversified investment strategies to reduce the risks associated with stranded assets. In addition, investors should dynamically adjust investment strategies according to the green and low-carbon development status of the company through public information such as ESG reports disclosed by the listed company.
Author Contributions
Conceptualization, L.W.; methodology, L.W.; software, C.S.; validation, C.W.; formal analysis, C.S.; investigation, C.S.; resources, L.W.; data curation, L.W.; writing—original draft preparation, C.S.; writing—review and editing, C.W.; visualization, C.W.; supervision, C.W.; project administration, C.W.; funding acquisition, C.W. All authors have read and agreed to the published version of the manuscript.
Funding
This research was funded by the Ministry of Education of Humanities and Social Science, grant number 21YJC790108.
Data Availability Statement
The data that support the findings of this study are available from the corresponding author upon reasonable request.
Conflicts of Interest
The authors declare no conflicts of interest.
References
- Hickey, C.; O’Brien, J.; Caldecott, B.; McInerney, C.; Gallachóir, B.Ó. Can European electric utilities manage asset impairments arising from net zero carbon targets? J. Corp. Financ. 2021, 70, 102075. [Google Scholar] [CrossRef]
- Riedl, D. The magnitude of energy transition risk embedded in fossil fuel company valuations. Heliyon 2021, 7, e08400. [Google Scholar] [CrossRef] [PubMed]
- Walley, N.; Whitehead, B.W. It’s not easy being green. Harv. Bus. Rev. 1994, 72, 46–51. [Google Scholar]
- Palmer, K.; Oates, W.E.; Portney, P.R. Tightening environmental standards: The benefit-cost or the no-cost paradigm? J. Econ. Perspect. 1995, 9, 119–132. [Google Scholar] [CrossRef]
- Lee, K.H.; Min, B. Green R&D for eco-innovation and its impact on carbon emissions and firm performance. J. Clean. Prod. 2015, 108, 534–542. [Google Scholar] [CrossRef]
- Hart, S.L.; Ahuja, G. Does it pay to be green? An empirical examination of the relationship between emission reduction and firm performance. Bus. Strategy Environ. 1996, 5, 30–37. [Google Scholar] [CrossRef]
- Ambec, S.; Lanoie, P. Does it pay to be green? A systematic overview. Acad. Manag. Perspect. 2008, 22, 45–62. [Google Scholar]
- Song, L.; Lieu, J.; Nikas, A.; Arsenopoulos, A.; Vasileiou, G.; Doukas, H. Contested energy futures, conflicted rewards? Examining low-carbon transition risks and governance dynamics in China’s built environment. Energy Res. Soc. Sci. 2020, 59, 101306. [Google Scholar] [CrossRef]
- Mercure, J.F.; Pollitt, H.; Viñuales, J.E.; Edwards, N.R.; Holden, P.B.; Chewpreecha, U.; Salas, P.; Sognnaes, I.; Lam, A.; Knobloch, F. Macroeconomic impact of stranded fossil fuel assets. Nat. Clim. Chang. 2018, 8, 588–593. [Google Scholar] [CrossRef]
- Bos, K.; Gupta, J. Stranded assets and stranded resources: Implications for climate change mitigation and global sustainable development. Energy Res. Soc. Sci. 2019, 56, 101215. [Google Scholar] [CrossRef]
- Roncoroni, A.; Battiston, S.; Escobar-Farfán, L.O.; Martinez-Jaramillo, S. Climate risk and financial stability in the network of banks and investment funds. J. Financ. Stab. 2021, 54, 100870. [Google Scholar] [CrossRef]
- van der Ploeg, F.; Rezai, A. The risk of policy tipping and stranded carbon assets. J. Environ. Econ. Manag. 2020, 100, 102258. [Google Scholar] [CrossRef]
- Battiston, S.; Dafermos, Y.; Monasterolo, I. Climate risks and financial stability. J. Financ. Stab. 2021, 54, 100867. [Google Scholar] [CrossRef]
- Stolbova, V.; Monasterolo, I.; Battiston, S. A financial macro-network approach to climate policy evaluation. Ecol. Econ. 2018, 149, 239–253. [Google Scholar] [CrossRef]
- Semieniuk, G.; Campiglio, E.; Mercure, J.F.; Volz, U.; Edwards, N.R. Low-carbon transition risks for finance. Wiley Interdiscip. Rev. Clim. Chang. 2021, 12, e678. [Google Scholar] [CrossRef]
- Firdaus, N.; Mori, A. Stranded assets and sustainable energy transition: A systematic and critical review of incumbents’ response. Energy Sustain. Dev. 2023, 73, 76–86. [Google Scholar] [CrossRef]
- McGlade, C.; Ekins, P. The geographical distribution of fossil fuels unused when limiting global warming to 2 C. Nature 2015, 517, 187–190. [Google Scholar] [CrossRef]
- Carney, M. Breaking the tragedy of the horizon–climate change and financial stability. Speech Given Lloyd’s London 2015, 29, 220–230. [Google Scholar]
- Batten, S.; Sowerbutts, R.; Tanaka, M. Let’s Talk About the Weather: The Impact of Climate Change on Central Banks; Bank of England: London, UK, 2016; Staff Working Paper No. 603. [Google Scholar]
- Monasterolo, I. Climate change and the financial system. Annu. Rev. Resour. Econ. 2020, 12, 299–320. [Google Scholar] [CrossRef]
- Curtin, J.; McInerney, C.; Gallachóir, B.Ó.; Hickey, C.; Deane, P.; Deeney, P. Quantifying stranding risk for fossil fuel assets and implications for renewable energy investment: A review of the literature. Renew. Sustain. Energy Rev. 2019, 116, 109402. [Google Scholar] [CrossRef]
- Cahen-Fourot, L.; Campiglio, E.; Godin, A.; Kemp-Benedict, E.; Trsek, S. Capital stranding cascades: The impact of decarbonisation on productive asset utilisation. Energy Econ. 2021, 103, 105581. [Google Scholar] [CrossRef]
- Linquiti, P.; Cogswell, N. The Carbon Ask: Effects of climate policy on the value of fossil fuel resources and the implications for technological innovation. J. Environ. Stud. Sci. 2016, 6, 662–676. [Google Scholar] [CrossRef]
- Rozenberg, J.; Vogt-Schilb, A.; Hallegatte, S. Instrument choice and stranded assets in the transition to clean capital. J. Environ. Econ. Manag. 2020, 100, 102183. [Google Scholar] [CrossRef]
- Hansen, T.A. Stranded assets and reduced profits: Analyzing the economic underpinnings of the fossil fuel industry’s resistance to climate stabilization. Renew. Sustain. Energy Rev. 2022, 158, 112144. [Google Scholar] [CrossRef]
- Caldwell, R.; Chodorow, D.; Dorobantu, F. Valuing Natural Resources Investments. In Contemporary and Emerging Issues on the Law of Damages and Valuation in International Investment Arbitration; Brill Nijhoff: Leiden, Boston, 2018; pp. 293–322. [Google Scholar]
- O’Neill, B.C.; Kriegler, E.; Riahi, K.; Ebi, K.L.; Hallegatte, S.; Carter, T.R.; Mathur, R.; Van Vuuren, D.P. A new scenario framework for climate change research: The concept of shared socioeconomic pathways. Clim. Chang. 2014, 122, 387–400. [Google Scholar] [CrossRef]
- Riahi, K.; Van Vuuren, D.P.; Kriegler, E.; Edmonds, J.; O’neill, B.C.; Fujimori, S.; Bauer, N.; Calvin, K.; Dellink, R.; Fricko, O.; et al. The Shared Socioeconomic Pathways and their energy, land use, and greenhouse gas emissions implications: An overview. Glob. Environ. Chang. 2017, 42, 153–168. [Google Scholar] [CrossRef]
- Rogelj, J.; Popp, A.; Calvin, K.V.; Luderer, G.; Emmerling, J.; Gernaat, D.; Fujimori, S.; Strefler, J.; Hasegawa, T.; Marangoni, G.; et al. Scenarios towards limiting global mean temperature increase below 1.5 C. Nat. Clim. Chang. 2018, 8, 325–332. [Google Scholar] [CrossRef]
- Guo, P.; Wang, T.; Li, D.; Zhou, X. How energy technology innovation affects transition of coal resource-based economy in China. Energy Policy 2016, 92, 1–6. [Google Scholar] [CrossRef]
- Lu, Z.Y.; Li, W.H.; Xie, B.C.; Shang, L.F. Study on China’s wind power development path—Based on the target for 2030. Renew. Sustain. Energy Rev. 2015, 51, 197–208. [Google Scholar] [CrossRef]

Disclaimer/Publisher’s Note: The statements, opinions and data contained in all publications are solely those of the individual author(s) and contributor(s) and not of MDPI and/or the editor(s). MDPI and/or the editor(s) disclaim responsibility for any injury to people or property resulting from any ideas, methods, instructions or products referred to in the content. |
© 2024 by the authors. Licensee MDPI, Basel, Switzerland. This article is an open access article distributed under the terms and conditions of the Creative Commons Attribution (CC BY) license (https://creativecommons.org/licenses/by/4.0/).