Article

Perceived Responses of International Tourists to Transportation and Tourism Services During Typhoons Faxai and Hagibis in Japan

by
Sunkyung Choi
*,
Kexin Liu
and
Shinya Hanaoka
Department of Transdisciplinary Science and Engineering, School of Environment and Society, Tokyo Institute of Technology, Tokyo 152-8550, Japan
*
Author to whom correspondence should be addressed.
Sustainability 2024, 16(20), 9114; https://doi.org/10.3390/su16209114
Submission received: 2 August 2024 / Revised: 9 October 2024 / Accepted: 14 October 2024 / Published: 21 October 2024

Abstract

:
There is a limited understanding on the information-seeking behavior of international tourists during disaster response scenarios due to the lack of empirical studies on crisis communication in Japan. This study clarifies the topics generated from both international tourists and official Twitter accounts by applying the embedding Bidirectional Encoder Representations from Transformers (BERT) topic model and examines the temporal sentiment changes toward transportation and tourism using the sentiment scores obtained from topic-based Valence Aware Dictionary and sEntiment Reasoner (VADER) sentiment analysis during disasters. A case study was conducted using Twitter data on Typhoons Faxai and Hagibis, which struck Japan in 2019. This study found differences in the topics generated among international tourists and officials in response and a continuous negative sentiment toward specific transportation services. The managerial implications of these findings regarding the use of social media in crisis communication in tourism are also discussed.

1. Introduction

Natural disasters have had a significant impact on transportation and tourism in recent years. Individuals seek information to understand the risks they face and to decide subsequent disaster response actions based on the obtained information [1,2]. As information seeking is one of the first responses to disasters, international tourists seek it themselves or receive information provided by tourism destinations via various channels such as TVs, mobile phones, and tablets. However, international tourists are especially vulnerable to crises, since they exhibit distinct information-searching behaviors due to insufficient understanding of the destination, possible hazards, and language barriers [3,4,5]. Moreover, international tourists face heightened vulnerability due to their unique disaster experiences, differing risk perceptions, limited disaster knowledge, restricted access to crisis information, unfamiliarity with the surroundings, and lack of awareness regarding shelter locations and evacuation routes [4,6,7,8,9]. These vulnerabilities make it difficult for international tourists to respond effectively to disasters, often leading to panic behavior or evacuation delays [10].
Risk communication in tourism crisis management comprises providing consistent and exact information to the public through all phases of a disaster [11]. Multiple parties, such as government agencies, local authorities, tourism suppliers, and destination management organizations, are involved in tourism crisis communication during disasters [12,13,14]. Effective risk communication allows organizations to make informed decisions about managing risks and reducing the impact on the environment, society, and economy in achieving their sustainability goals [15]. Due to uncertainties involved in disasters which present challenges in sustainability, it is imperative to investigate possible strategies to overcome challenges in social media use as a disaster tool for diverse and inclusive vulnerable groups in the community [16].
Information technology developments have especially triggered a rise in user-generated content such as social media and online reviews in the tourism and hospitality industry, resulting in enhancing its use as a crucial information resource for tourists in communications [17,18]. Digital tools and technological advancements such as VR have enriched tourist experiences and provided an alternative option for tourism during crises such as the COVID-19 pandemic [19,20]. Previous studies on crisis and risk communication have explored the importance and utilization of social media during disasters and considered Twitter (now rebranded as X) as a means of emergency communication as it provides real-time content, sentiment, and trends of public attention and behavior [21,22,23,24,25].
While efforts to enhance disaster management continue, as noted in the 2022 “White Paper on Disaster Management” by the Cabinet Office [26], the development of a comprehensive tourism crisis management strategy for international tourists remains limited. Some initiatives utilizing digital tools by Japan’s Tourism Agency, under the Ministry of Land, Infrastructure, Transport and Tourism (MLIT), such as disaster information websites, multilingual digital dictionaries, and the Safety Tips mobile app, have been introduced in Japan to disseminate relevant information to tourists during their travels [27]. However, the effectiveness of these measures in supporting international tourists during disasters remains uncertain.
Past disasters in Japan have shed light on the negative perceptions of international tourists toward transportation and tourism services regarding crisis communication. However, limited research has explored the information needs of foreign populations [5,11] and the kind of information provided by suppliers during or after a disaster. Limited studies have considered social aspects of risk perception and vulnerability in social media communication focusing on foreign populations or tourists [28,29]. Understanding public perception toward various disasters is important for governments and policymakers [15]. Although social media during disasters can reflect public perspectives, there is also limited research analyzing how both officials and the public communicate during extreme weather events [30,31]. Thus, it is confirmed that most prior studies focused on the United States, Australia, the United Kingdom, Germany, China, and others among 72 selected publications [16]. Furthermore, research on typhoons only accounted for 5% of the selected publications [16]. Although existing research has been conducted in the countries mentioned above, no similar studies have been done in Japan, especially during typhoons. As a result, this study has the potential to offer new insights to the current body of literature [21].
To bridge the gaps identified in the existing literature and practice, this study examines international tourists’ perceived responses and their temporal changes toward transportation and tourism services for effective crisis communication measures in responding to typhoons in Japan. First, the study clarifies the topics generated by officials (Japan Tourism Agency, local authorities, embassy, tourism suppliers, and mass media) and the public as international tourists’ accounts using Twitter data using Bidirectional Encoder Representations from Transformers (BERT) [32]. Second, it examines the temporal changes of sentiment scores toward transportation and tourism services using the topic-based Valence Aware Dictionary and sEntiment Reasoner (VADER), a lexicon- and rule-based sentiment analysis tool [33]. Since extreme events of natural disasters have had a serious significant impact on transportation infrastructure in recent years in Japan, which is vulnerable to various disasters such as earthquakes, typhoons, heavy rains, and others, it is not negligible that international tourists may face more challenges in aftermath of disasters in terms of transport and tourism information and services. This study selects a case study in Japan with two typhoons, Typhoons Faxai and Hagibis, which struck the Tokyo metropolitan area in 2019.
The key research question is defined as the following: What were the perceived responses of international tourists to transportation and tourism services during the typhoons in Japan? The following questions are used to explore the study: (1) What were the topics raised by the public as international tourists during the typhoons in Japan? (2) What were the topics raised by the officials? Are there differences between the public and the officials? (3) How did topic-based sentiments of international tourists change over time? To the best of our knowledge, this study is one of the first studies to examine the perceived responses of the public as international tourists during disasters in Japan via topic modeling and sentiment analysis of Twitter data. It also explores the temporal changes of the public sentiment toward the topic through a case study of previous typhoons in Japan.
The remainder of the paper is structured as follows. Section 2 reviews the extant literature on social media analysis for disaster and transportation and text mining methods. Section 3 presents a framework to interpret international tourists’ perceived responses toward transportation information and services and illustrates the technical details of each step of the framework. Section 4 discusses the case study on Typhoons Faxai and Hagibis by implementing the framework presented previously. Finally, Section 5 summarizes the research outputs with implications and their applicability in future disaster events.

2. Literature Review

2.1. Tourism Crisis Management and Crisis Communication

Over the past decades, numerous studies have been conducted on tourism crisis management and crisis communication [21,34]. In tourism crisis management, effectively managing the crisis communication to provide exact and necessary information to the public is critical [11]. Mair et al. [35] point out that destinations need to provide information and guidance to tourists during disasters. In this aspect, the media plays an important role in information provision [36]. However, the complex media monitoring with social media usage among stakeholders has not been empirically investigated [35].
Although suppliers recognize the importance of an efficient crisis communication system, they are hesitant to provide risk information to tourists [14]. Case studies of the United States and Fiji [4,12,37] exist; however, limited studies have been undertaken in Japan [13,14,37]. Future directions such as an audience-centered approach in crisis communication [21], the role of suppliers, and tailored information provision for tourists [13,38] imply the need for a holistic viewpoint. Therefore, this gap needs to be filled by investigating tourism crisis communication in past disasters in Japan from the perspective of tourists.

2.2. Social Media Use in Disasters

Numerous authors have studied the relationship between social media and disaster management and have highlighted several benefits of using such platforms in this domain [24]. For example, regarding the utility of social media in cases of disaster, it is crucial to have access to situational information to inform the people in charge of critical decision-making [39]. Meanwhile, government members have been increasingly using social media, together with blogs, to communicate with citizens [40]. Social media is used passively to disseminate information and receive users’ feedback via incoming messages [41]. Other studies have found it to be a source of real-time or near-real-time data, especially in the case of accidents and crises [42,43]. The importance of using Twitter as an additional source of transportation-related information has been discussed [44]. Thus, Twitter data can be used not only in detecting early disaster signs but also in grasping the news and understanding the perceived responses of the people [45]. Hence, a deeper understanding on both senders and receivers in crisis communication in hospitality and tourism is necessary [21]. Therefore, this study leverages Twitter data to effectively and quantitatively examine the public’s perceived responses as well as those of the officials.

2.3. Text Mining Approaches

Text mining attempts to extract meaningful information from unstructured textual data and identify hidden patterns, rules, or trends in them [46,47]. Owing to the powerful capabilities of text mining, its application to social media data can yield interesting findings on information dissemination as well as human behavior and interaction [48,49]. A review of topic modeling methods highlighted Latent Dirichlet Allocation (LDA) as one of the earliest and most frequently used methods in the field [50]. LDA, the most commonly used topic model, is a generalization of Probabilistic Latent Semantic Analysis, which was initially developed as a probabilistic framework [51]. BERT is conceptually simple and empirically powerful. It obtains state-of-the-art results on 11 natural language processing tasks, especially social media. Therefore, using the pre-trained BERT model for topic modeling can improve the performance of topic extraction in Twitter data mining. Only a handful of studies have employed semantic embeddings such as BERT in topic modeling.
Sentiment analysis, also known as opinion mining or emotion AI, automates the mining of attitudes, opinions, views, and emotions from texts, speech, tweets, and databases through a natural language process to determine positive, negative, or neutral sentiments. Sentiment analysis algorithms fall into one of three buckets based on the data type and availability: rule-based, automatic, and hybrid. Sentiment analysis, specifically applied to transportation and tourism, has been employed to use sources such as Facebook, Twitter, and TripAdvisor to understand opinions more accurately. Both sentiment analysis and topic modeling have been employed to capture bus user experiences on the network in Santiago, Chile [52]. The authors found these techniques effective for representing the opinions of bus commuters in this context. Several studies have investigated the collection and analysis of transportation-related data using sentiment analysis from social media [53]. A systematic review of sentiment analysis applications in hospitality identified early researchers who contributed significantly to the field [54,55]. While studies have focused on the usual situation in tourism [56,57,58,59], little attention has been paid to sentiment analysis during tourism crises.
Research on sentiment analysis and tourism crisis is ongoing. The Facebook posts of hotels before and after Tropical Cyclone Winston in Fiji [37] were analyzed, adopting the model of social-mediated disaster resilience over time [60,61]. The early sentiments of tourists during COVID-19 were examined based on public Twitter data and news articles adopting the social-mediated crisis communication model [62]. Other crises such as Hurricane Sandy and Hurricane Irene were explored using sentiment analysis of Tweets during the events [63,64].
Although there has been a wide range of research in tourism crisis management and crisis communication with regards to topic modeling and sentiment analysis in social media use, there has been less attention in empirical investigations in Asian contexts, especially in Japan, which is a disaster-prone country yet has experienced exponential growth for international tourists [21,65]. Following the context, considering the fact that there has been little attention in exploring international tourists’ perceived responses to transportation and tourism services during disasters in Japan, this study extends the fundamental understanding on crisis communication of this vulnerable population during disasters. The use of X data helps extract relevant tourism crisis information and serves as an indicator for investigating how the content posted by the stakeholders could be improved and what services need to be enhanced during disasters. This study can thus enhance the understanding of crisis communication during disasters in Japan and provide actionable policy implications.

3. Materials and Methods

3.1. Methodological Framework Using Topic Modeling and Sentiment Analysis

We present a framework to interpret international tourists’ perceived responses toward transportation information and service performance using their opinions expressed on Twitter (Figure 1). To analyze the perceived responses of international tourists, this study adopted text mining techniques to extract meaningful information from textual data [66]. The overall methodological framework used in this study is inspired by previous research that integrated topic modeling and sentiment analysis to effectively and quantitatively assess public opinions, responses, and risk perceptions using Twitter data [31,66,67].
In the systematic review of topic modeling usage in social media analysis, the application of topic modeling has experienced exponential growth in the field of natural language processing (NLP) research [68]. Based on a detailed survey of contextualized word embedding techniques, BERT consistently delivers better results due to its ability to handle various NLP tasks, including text similarity detection, next sentence prediction, and text classification [69]. Therefore, this study chose BERT for topic modeling since it has the capability to capture both syntactic and semantic meanings in the text [69].
Sentiment analysis has been widely applied to analyze public concerns and opinions during crisis situations in the past [70]. In Hutto and Gilbert [33], VADER outperformed human raters, achieving a classification accuracy of 0.96, compared to 0.84 for human raters, based on measures such as overall precision, overall recall, and overall F1 score. VADER is widely recognized for its precision and ability to capture the nuances of both polarity and intensity in informal text, which is especially useful in the context of our dataset.
It is assumed that information shared on Twitter in English is meant for consumption by non-Japanese people [71]. We assume that these non-Japanese people are international tourists. Therefore, English-language tweets were selected that included keywords related to transport and tourism. This section illustrates the technical details of each step of the framework. The methodological framework consists of the following major steps: data collection, data extraction, data pre-processing, topic modeling, and topic-based sentiment analysis.
First, tweets in an area over a defined period of time are collected using web crawler. The output data of this step comprise the raw and unfiltered texts that users post and are referred to as “raw data”. Second, extracted tweets are initially pre-processed to clean erroneous and redundant information. The generated data are called “useable data”. Third, the usable tweets are divided into public and official categories based on users’ ID. Fourth, the tweets are processed for content analysis, including basic text mining and embedding BERT topic modeling. In this step, the generated topics from both categories are matched with information released by the officials’ and international tourists’ accounts. Fifth, public tweets are further analyzed after content analysis. Topic-based VADER sentiment analysis is implemented to evaluate the perceived service quantified by the average daily sentiment score of different topics.

3.2. Data Extraction

Twitter provides Application Programming Interfaces (APIs) that enable users to access various types of data from the previous seven days, including tweet content, retweet numbers, and user profiles. A web crawler is a user-defined web data extraction tool that can automatically fetch and extract information from specific websites. Moreover, Twitter Advanced Search [72] is a website that provides filtering options, such as keyword limit, language limit, geographical limit, and time limit, that can help find very specific content and data that are open to the public. In this study, a web crawler was developed to automatically download the filtered tweets from the Twitter Advanced Search website. The developed web crawler can not only avoid the issues of rate and time limits set by the Twitter APIs but also guarantee that the tweets that meet the preset requirements are downloaded.

3.3. Data Pre-Processing

Pre-processing is one of the most critical steps in text mining. In this study, pre-processing aimed to reduce the semantic dimension of tweets. A tweet text includes multiple parts, such as emoticons, user mentions, and words. Figure 2 shows a tweet shared by Japan Safe Travel, a public Twitter account managed by the Japan National Tourism Organization that provides international tourists safety tips and latest information in case of natural disasters. Some components of tweets, such as user mentions and the Uniform Resource Location (URL) address, were removed. The URLs were removed due to irregular concatenated words which increase the complexity in data features and reduce the topic model’s efficiency. The hashtags were included since they could be important indicators of the semantic meaning of tweets. Stop words (e.g., a, an, and the) were also not retained since they do not contribute to NLP, especially for the sentiment analysis of the tweets. Furthermore, it is also necessary to normalize the words that have the same meaning for further analysis. Therefore, the data pre-processing steps for this study were as follows: (1) Delete duplicate, empty, or only picture and video tweets; (2) Remove URLs, emojis, and punctuation; (3) Clean special characters; and (4) Restore character entity references.

3.4. Embedding BERT Topic Modeling

The workflow of embedding BERT topic modeling (BERTopic) contains three stages [73]: (1) Embed documents: Extract document embeddings with BERT or any other embedding technique, (2) Cluster documents: Uniform Manifold Approximation and Projection (UMAP) to reduce the dimensionality of embeddings; Hierarchical Density-Based Spatial Clustering of Applications with Noise (HDBSCAN) to cluster reduced embeddings and create clusters of semantically similar documents, and (3) Create topic representation: Extract and reduce topics with class-based Term Frequency–Inverse Document Frequency (c-TF-IDF) and improve the coherence of words with Maximal Marginal Relevance.
This study used pre-trained Sentence Embedding Models that have been tuned to embed sentences and short paragraphs up to 128 words long and UMAP to lower dimensionality as it preserves local structure well [74]. This study uses a pre-trained Sentence Embedding Model named paraphrase-multilingual-mpnet-base-v2 which has the best performance in Tweet paraphrase testing. Next, it employs HDBSCAN to cluster similar documents. HDBSCAN is a clustering algorithm that extends DBSCAN by converting it into a hierarchical clustering algorithm and extracting a flat clustering based on the stability of the clusters [75].
TF-IDF is a numerical statistic that reflects how important a word is to a document in a collection or corpus. It is often used as a weighting factor in searches of information retrieval, text mining, and user modeling. BERTopic treats all documents in a single category (e.g., a cluster) as a single document and then applies TF-IDF. The results are importance scores for the words within a cluster. The more important words there are within a cluster, the more it is representative of that topic. This model is called class-based TF-IDF. The formula is as follows:
c T F I D F i = t i w i × l o g m j n t j
Each cluster is converted to a single document instead of a set of documents. The frequency of word t is extracted for each class i and divided by the total number of words w . This action can be seen as a form of regularization of frequent words in the class. Next, the average number of words per class m is divided by the total frequency of word t across all classes n . The embedding model provided by BERTopic is used to improve the coherence of words within a topic. After generating the c-TF-IDF representations, we have a set of words that describe a collection of documents. Technically speaking, this collection of documents describes a coherent topic.

3.5. Topic-Based Sentiment Analysis

Aspect-Based Sentiment Analysis [76] has been suggested as a novel computational approach to understanding the perceived responses of a user about specific entities and their corresponding topics. In this study, these topics were determined by embedding BERT topic modeling. The lexicon-based approach estimates the sentiment of each document by scoring each word based on a collection of positive and negative words. Researchers first create a sentiment lexicon by compiling sentiment word lists, using manual, lexical, and corpus-based approaches, and then determine the polarity score of the given review based on the positive and negative indicators identified in the lexicon.
To prove the feasibility of sentiment analysis using VADER, the subjectivity and polarity of each tweet must be obtained using TextBlob 0.15.3, a Python 3.7 library that provides text mining, analysis, and processing modules for Python developers. TextBlob conducts sentence-level analysis. First, it takes a dataset as the input; then, it considers each tweet as a sentence. A common way of determining polarity for a tweet is to decide whether a response is positive or negative based on the total number of positive and negative sentences. The polarity and subjectivity of a given tweet can be found using the sentiment() function, which returns a named tuple with two parameters called polarity and subjectivity. In polarity, a value changes between −1 to 1, which shows how positive or negative a given sentence is, where −1 is most negative and 1 is most positive. In subjectivity, a value changes between 0 to 1, which shows whether a sentence comprises a fact or opinion (objective or subjective), where 0 is most objective and 1 is most subjective.
In this study, VADER 3.3.2 was implemented to obtain the sentiment score of each tweet, which is an open source program under the MIT license developed by George Berry, Ewan Klein, and Pier Paolo [30]. VADER uses a combination of sentiment lexicons, which are lists of lexical features that are generally labelled according to their semantic orientation as either positive or negative. VADER has been quite successful when dealing with social media texts. It analyzes a piece of text to check if any of the words are present in the VADER lexicon. It can find the polarity indices using the polarity_scores() function. This returns the metric values of the negative, neutral, positive, and compound scores for a given sentence. The compound score is a metric that calculates the sum of all the lexicon ratings that have been normalized between −1 and +1, where −1 indicates most extreme negative and +1 indicates most extreme positive.

4. Case Study

4.1. Typhoons Faxai and Hagibis in Japan

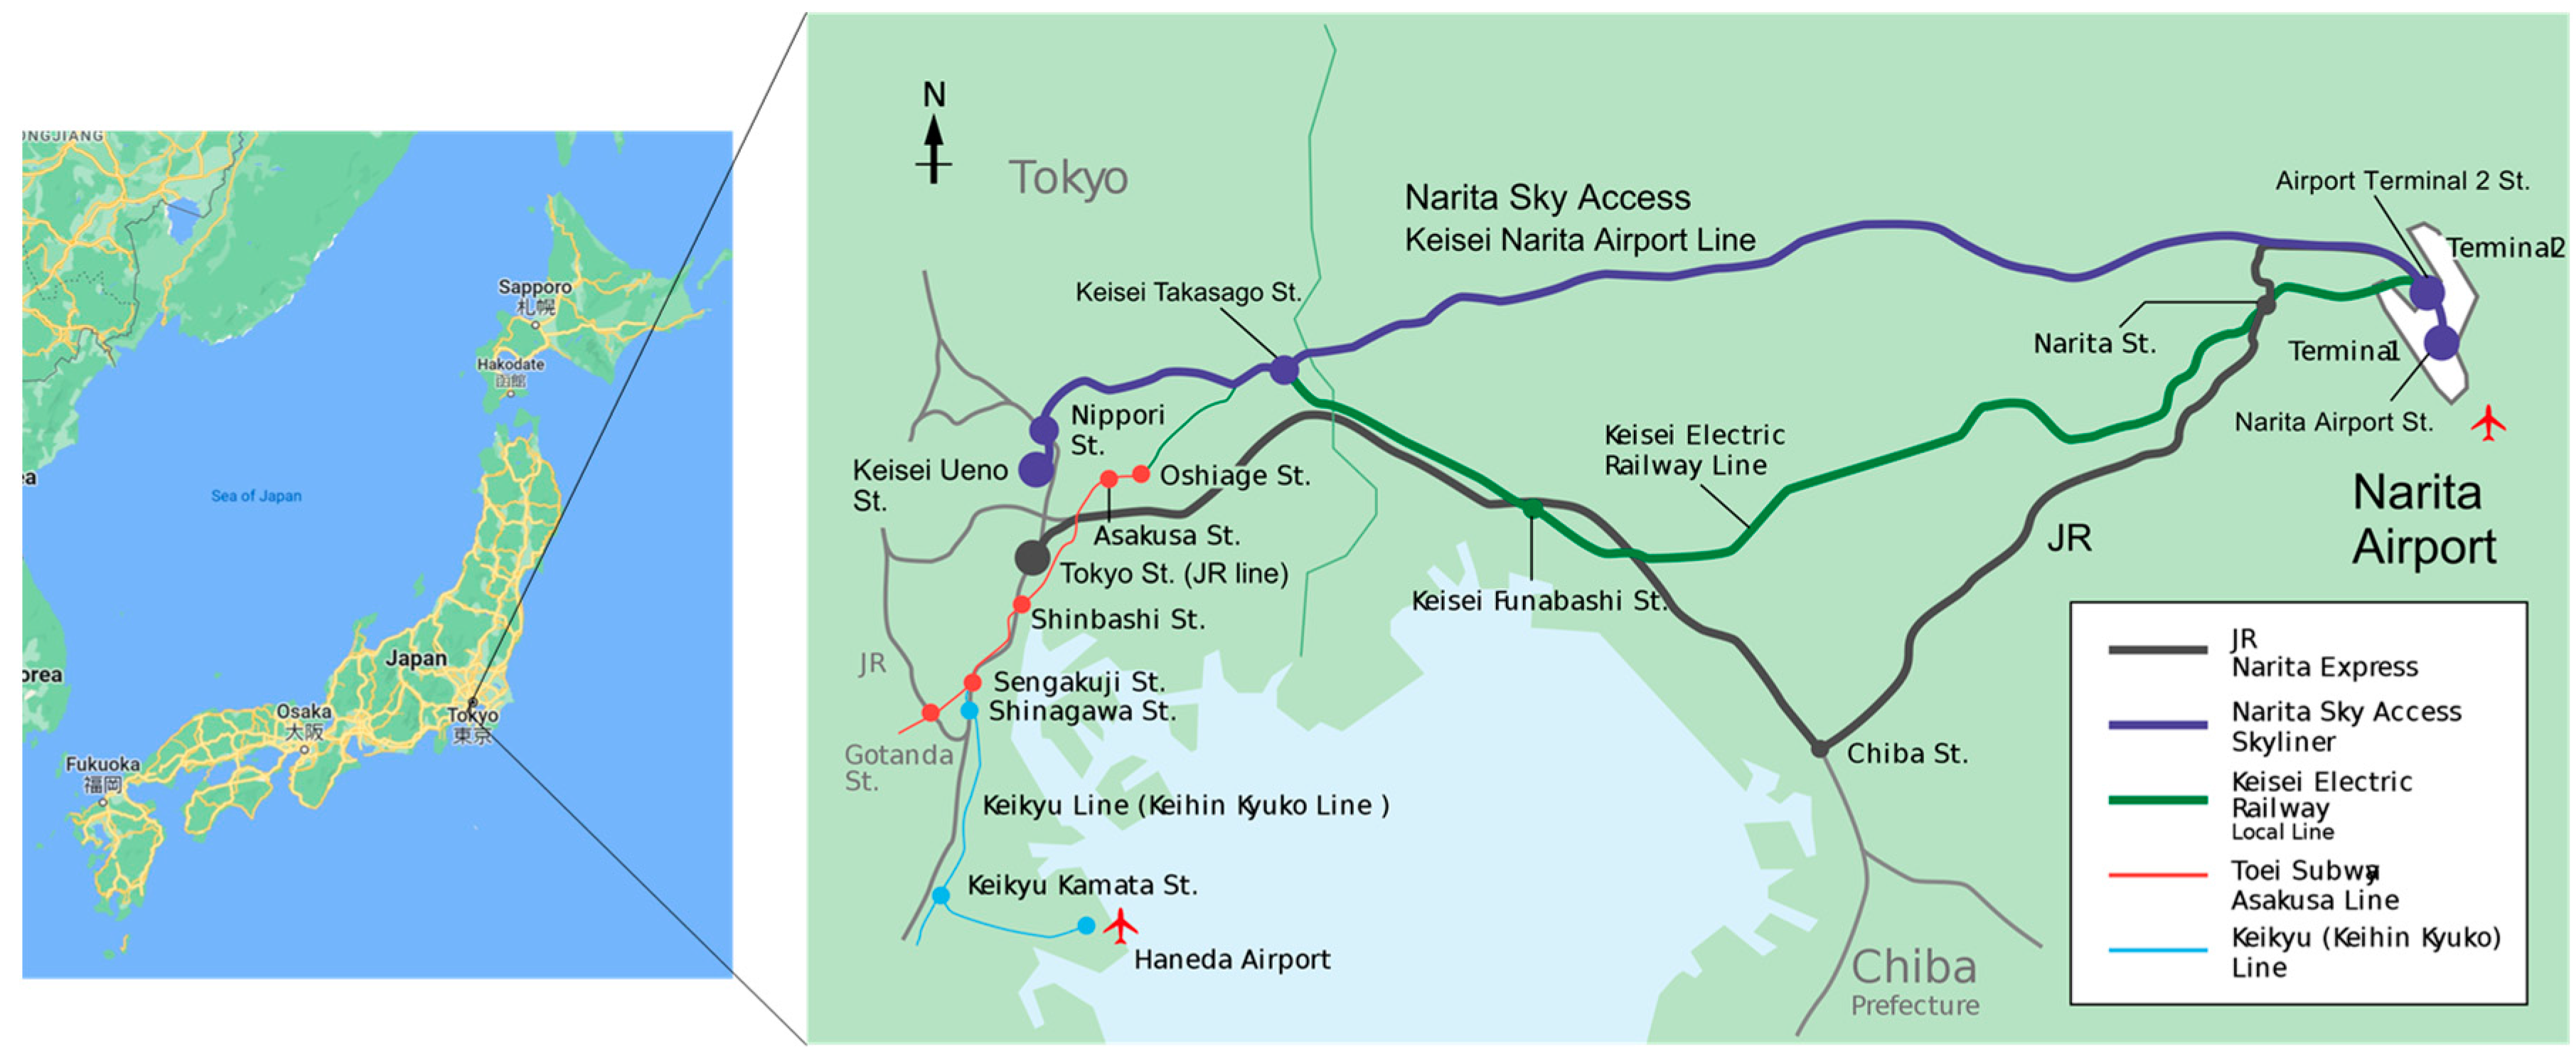
This case study was conducted by considering Typhoons Faxai and Hagibis, which hit the Tokyo metropolitan region in 2019 and had major impacts on transportation and tourism services. The Tokyo metropolitan region was affected seriously. The location of the Tokyo metropolitan area and two major airports, Haneda Airport and Narita Airport, are depicted in Figure 3. In particular, Hagibis inflicted the largest amount of damage, in terms of fatalities and the collapse of houses, during the last 30 years in Japan [77]. These cases were regarded as major crises with regard to international tourists and yet remain empirically less investigated. Typhoon Faxai, also known as Typhoon No. 15, formed on 5 September 2019 near Minami-Torishima Island (approximately 1800 km southeast of the main island of Japan) and moved west across the Pacific Ocean. It moved northwestward to the southwest of Tokyo Bay and then turned to the northeast. Typhoon Faxai made landfall on the Miura peninsula on 9 September at 3:00 local time, UTC + 9:00. It traveled through the middle of Tokyo Bay and struck the shore of Chiba Prefecture at 5:00 [78]. It was the strongest typhoon to strike the Kanto region since 2004, and seriously affected the normal operations of Japan Railway and Narita Airport. According to the news, over 13,000 people were stranded overnight on 9 September 2019 at Narita Airport [79]. More than 100 flights had to be cancelled and road and rail links to the airport were also badly affected, leaving many with no transportation options to the central city.
Typhoon Hagibis, also known as Typhoon No. 19, formed on 4 October 2019, a few hundred miles north of the Marshall Islands. On 12 October, Hagibis made landfall on Japan at 19:00 JST on the Izu Peninsula near Shizuoka. An hour later, it made its second landfall on the Greater Tokyo Area. On 13 October, Hagibis became an extratropical low cyclone and the Japan Meteorological Agency and Joint Typhoon Warning Center issued their final advisories on the system. However, the extratropical remnant of Hagibis was persistent for more than a week, before dissipating on 22 October. Hagibis caused catastrophic destruction across much of eastern Japan. Flights departing and arriving from both the Tokyo airports (Haneda and Narita) on 12 October had to be canceled, affecting at least 1187 flights and nearly 190,000 passengers. More than 13,000 passengers were stranded at Narita Airport. The Central Japan Railway Company announced that it had canceled nearly all bullet trains departing from Tokyo and Osaka on 12 October, comprising approximately 400 departures. The East Japan Railway Company announced that operations of the conventional lines and Shinkansen were suspended on 12 and 13 October due to Typhoon Hagibis. Several roads in and around the capital were also closed, affecting the movement of buses and taxis.

4.2. Data Collection and Pre-Processing

We collected Twitter data from 7 to 15 September 2019 for Typhoon Faxai and from 7 to 21 October 2019 for Typhoon Hagibis, which dissipated on 22 October 2019. The research aimed to collect data pre-arrival, at arrival, and post-arrival of the typhoons using the keywords mentioned below. The dataset period was decided after removing tweets and screening irrelevant content. Python code was written to search for tweets on Twitter and automatically save those publicly available on the Twitter Search browser, comprising the web crawler method. The search query and language were set as English, location as Japan, and keywords as typhoon (hotel OR flight OR train OR bus OR station OR airport OR shinkansen). The resulting dataset contained 7437 tweets, called raw data. Since very few tweets contained geolocation data when reviewed within the raw data, the study mainly focused on text data.
After deleting duplicated tweets to deal with retweets, the number of tweets dropped from 7437 to 2558. Moreover, empty or only picture and video tweets were deleted for text mining. Consequently, the number of tweets dropped from 2558 to 2430. Data pre-processing via NLP techniques was executed next, as introduced in Section 3.3.
After cleaning erroneous and redundant information, the “usable data” were generated. These usable data were then divided into public and official categories based on users’ IDs. Finally, the number of public tweets was 2057 and that of official tweets was 373. The number of public and official tweets for Typhoon Faxai was 655 and 73, respectively. There were 1402 public tweets and 300 official tweets for Typhoon Hagibis. The total number of public and official tweets used for topic modeling was 2057 and 373, respectively. The statistics of the number of tweets for 10 official accounts selected from the above are presented in Table 1.

4.3. Topics Generated by Public and Official Tweets

The Google Colaboratory, also known as Colab, was used to conduct embedding BERT topic modeling, as it allows users to write and execute Python code in their browser. It is a free Jupyter notebook environment that runs on cloud and stores data on Google Drive. The Jupyter notebook is a popular user interface for cloud computing.
The intertopic distance maps for the public and official tweets are depicted in Figure 4. A closer distance between each circle means that more words are had in common. The circle area is proportional to the amount of the words. The public and official tweets vary in their number of generated topics. The public has generated 42 topics, whereas the officials have generated 8 topics. In this study, we focus on the top 7 topics for finding differences in topics.
The overview of the top seven topics identified for public and official tweets is summarized in Table 2. The topic names were assigned based on keywords included in the generated topic. Topics generated by the public were related to air transportation such as airports, airlines, and flights; staying at a hotel; train operation; bus and taxi operation; and typhoon-related information. Regarding the typhoon-specific topics, providing assistance by disseminating information about the typhoon as well as its damage was discussed more by the officials. Some keywords in Topic 1 and Topic 4 for public were repeated (e.g., “flight” and “cancelled”) and these were named together as “flight cancel”. Likewise, keywords of Topic 4 and Topic 7 for officials were similar (e.g., “warning”, “notice”) and therefore combined as one topic. Thereafter, the top seven topics for both categories were reduced to the top six topics for further analysis.
The number of tweets was the largest on the two days when Typhoons Faxai and Hagibis made landfall, which has been marked in detail in Figure 5. On the third day of Typhoon Faxai, information about flight cancellations plummeted, indicating that flights were gradually operating normally. For Typhoon Hagibis, this occurred on the fourth day. As Typhoon Faxai made landfall in the early hours of the morning, the number of tweets about staying at a hotel on 9 September was the largest, which implies that international tourists needed to cancel their plans and stay indoors. For Typhoon Hagibis, which made landfall at 19:00 on 12 October, the number of tweets (57 tweets) was found to be the largest on 13 October. During typhoon disasters, the number of tweets about train operation was the largest (819 tweets), indicating that train operation was most affected by the typhoon. For Typhoon Faxai, the number of tweets was more than 100 on 9 September. For Typhoon Hagibis, the number of tweets exceeded 50 for six days after landfall. According to the news on Typhoon Faxai, the airport situation was critical and affected more than 16,000 people. The three days from 9 to 11 September showed a high number of tweets (exceeding 50). For Typhoon Hagibis, the maximum number of tweets was 40 on October 12, followed by 30 tweets on October 11. The number of tweets about typhoon information was the largest on days close to landfall, that is, 9 September and 12 October, while the sentiment score was mostly between 0 and 0.05 (32 out of 170 tweets). During the typhoon disasters, there were a few tweets about bus and taxi operation. Considering that international tourists were stranded at airports, they wanted to know whether they could leave the airport by bus or taxi as the railway had been suspended as well. The number of tweets about bus and taxi operation was the largest on the days of the typhoon landfalls.
In the study, we propose the Relative Percentage to represent the ratio of each topic generated among the newly reduced top six topics. The formula is as follows:
R e l a t i v e   P e r c e n t a g e % = n u m b e r   o f   t o p i c   c o u n t n u m b e r   o f   a l l   s i x   t o p i c s   c o u n t × 100
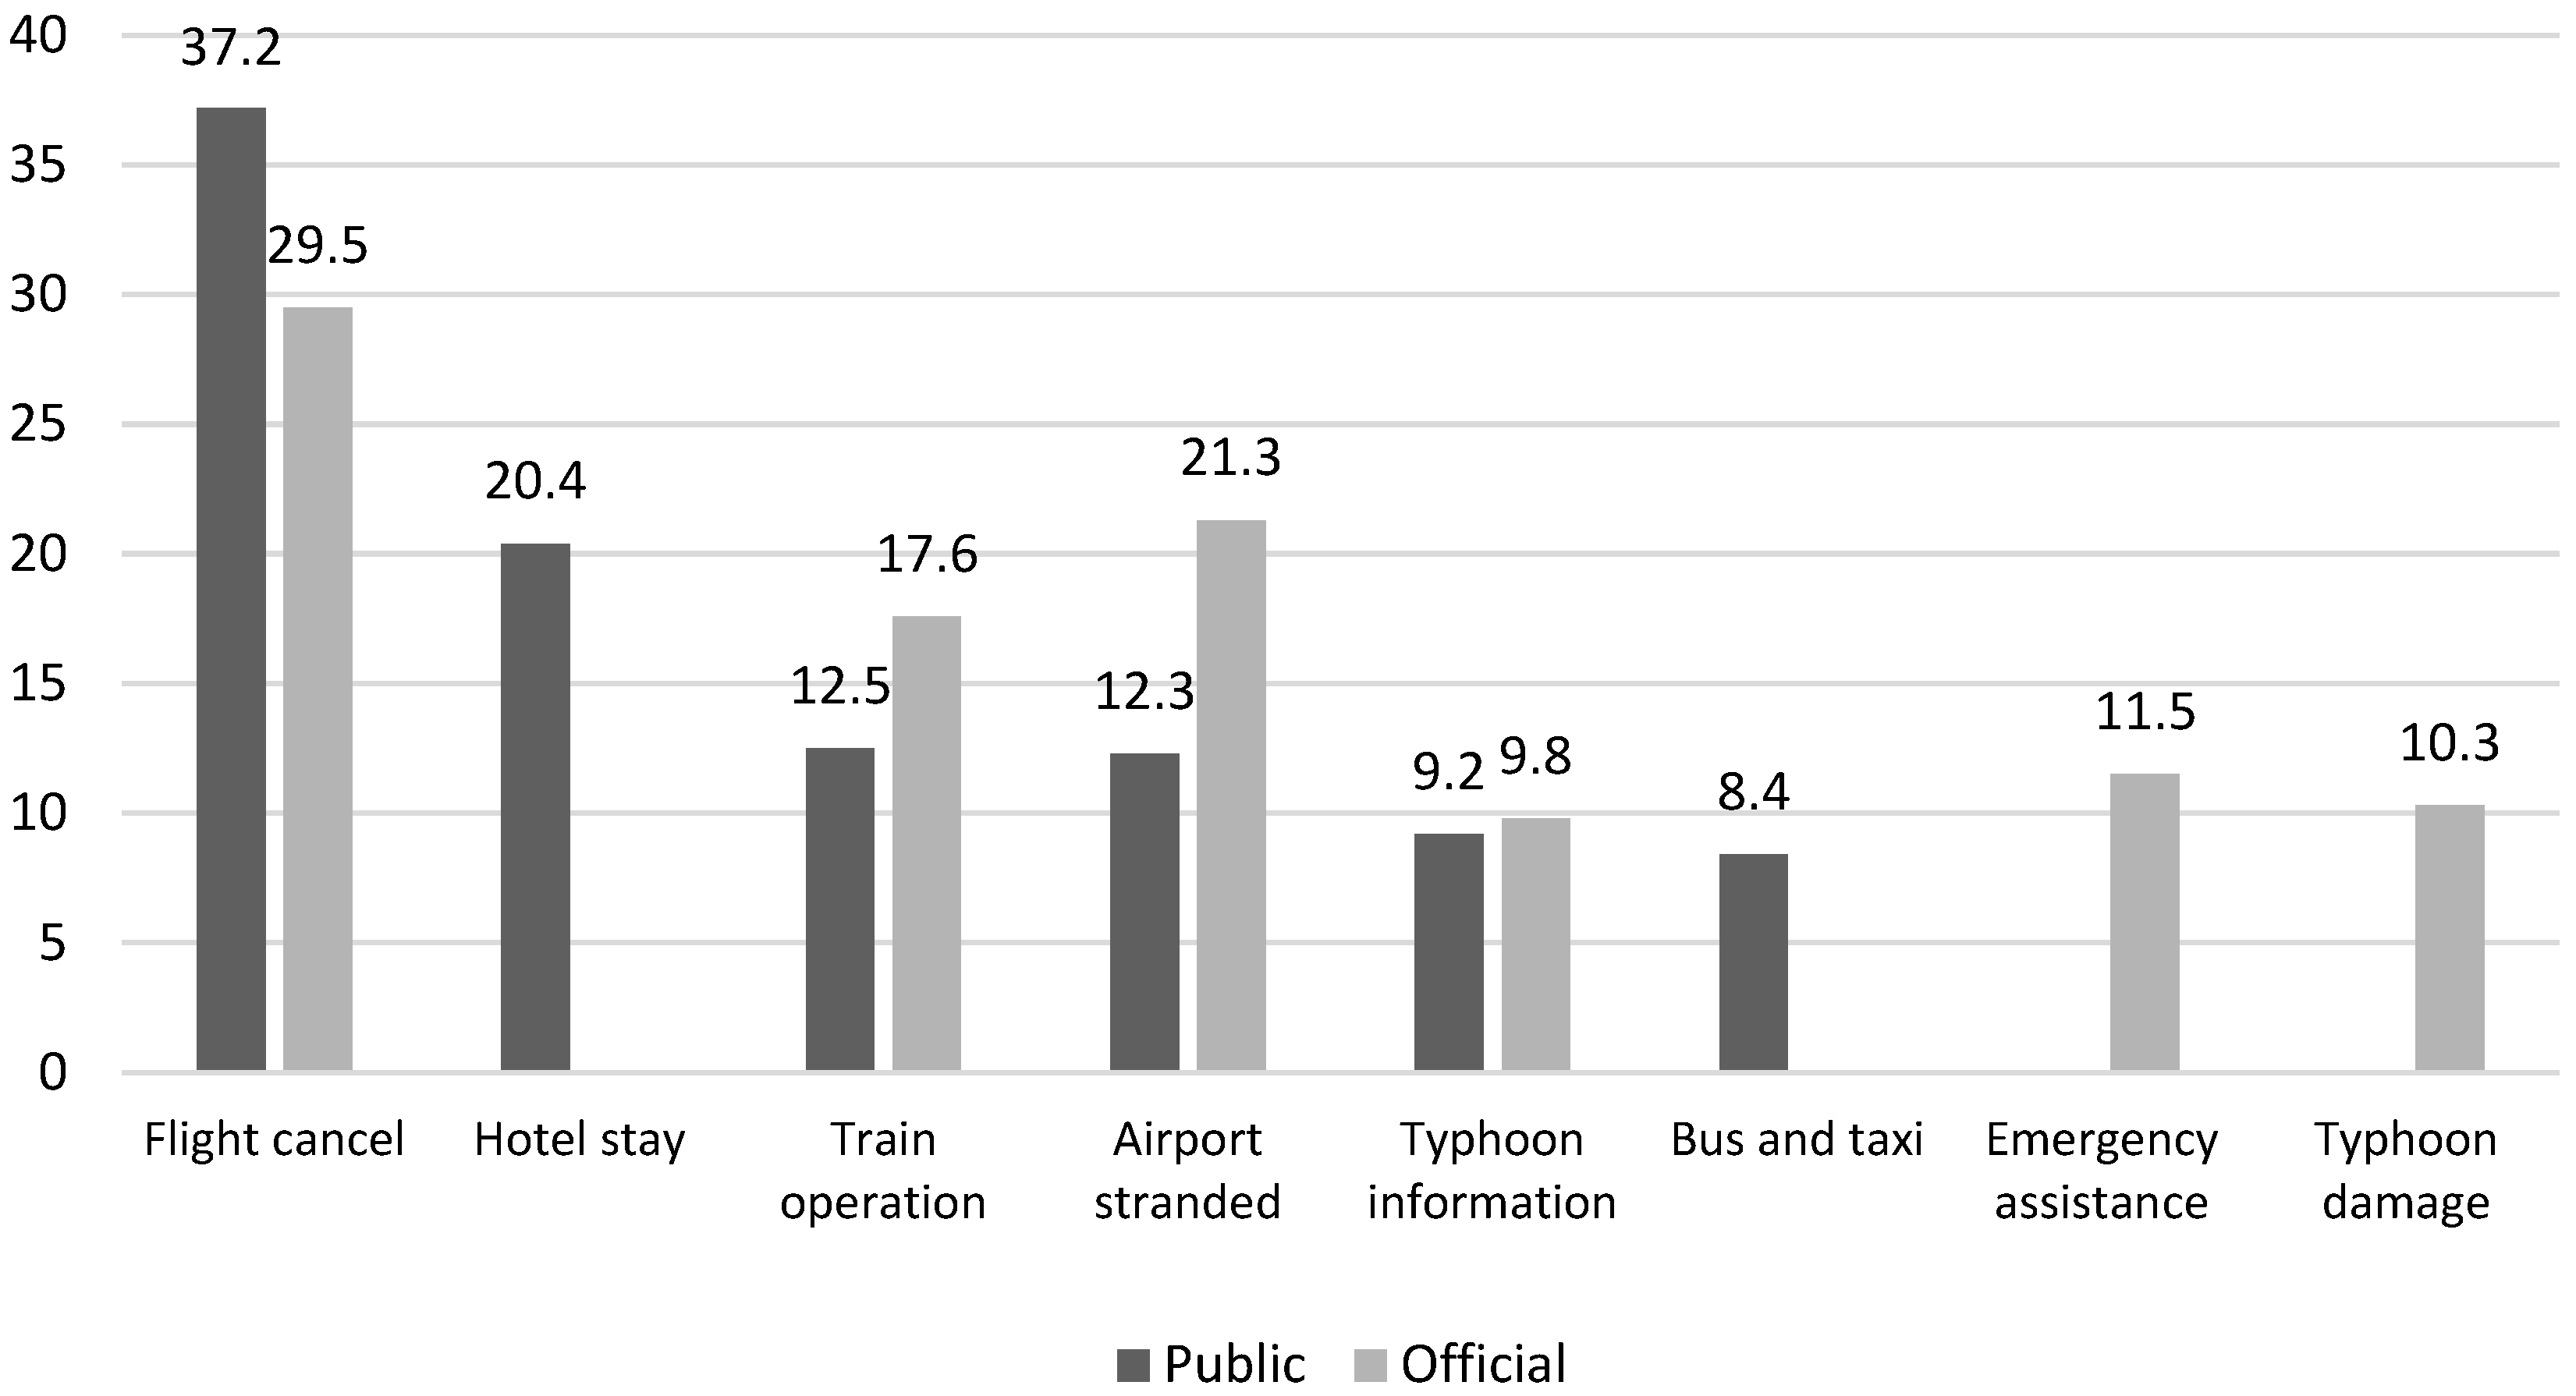
The comparison of public and official categories is illustrated in Figure 6 to clarify the differences among the topics generated. Understandably, both sides released much information about transportation, such as flights, trains, and airports during the typhoon disaster. The highest relative percentage for the public was 37.2% (for flight cancelation) and that for officials was 29.5%. The topics regarding hotel stay and bus and taxi were not generated from official accounts, whereas those regarding typhoon damage and assistance were not generated from public accounts.
Public topics not only mentioned information on air transportation but also on access to the airport or other places. It is interesting that public tweets frequently mentioned hotel stay (20.4%), which is understandable since people needed to change their travel plans and seek shelter in accommodation facilities. However, the officials focused more on providing factual issues regarding typhoons.

4.4. Temporal Changes of Public Sentiments

To conduct the topic-based sentiment analysis, it is necessary to calculate how many tweets each topic contains. However, some tweets included different topics, such as “flight cancel” and “airport stranded”. In this regard, the number of tweets in each topic was calculated again as 580 for flight cancel, 287 for hotel stay, 819 for train operation, 393 for airport stranded, 170 for typhoon information, and 153 for bus and taxi. Public sentiments regarding these six topics are presented in a later section.
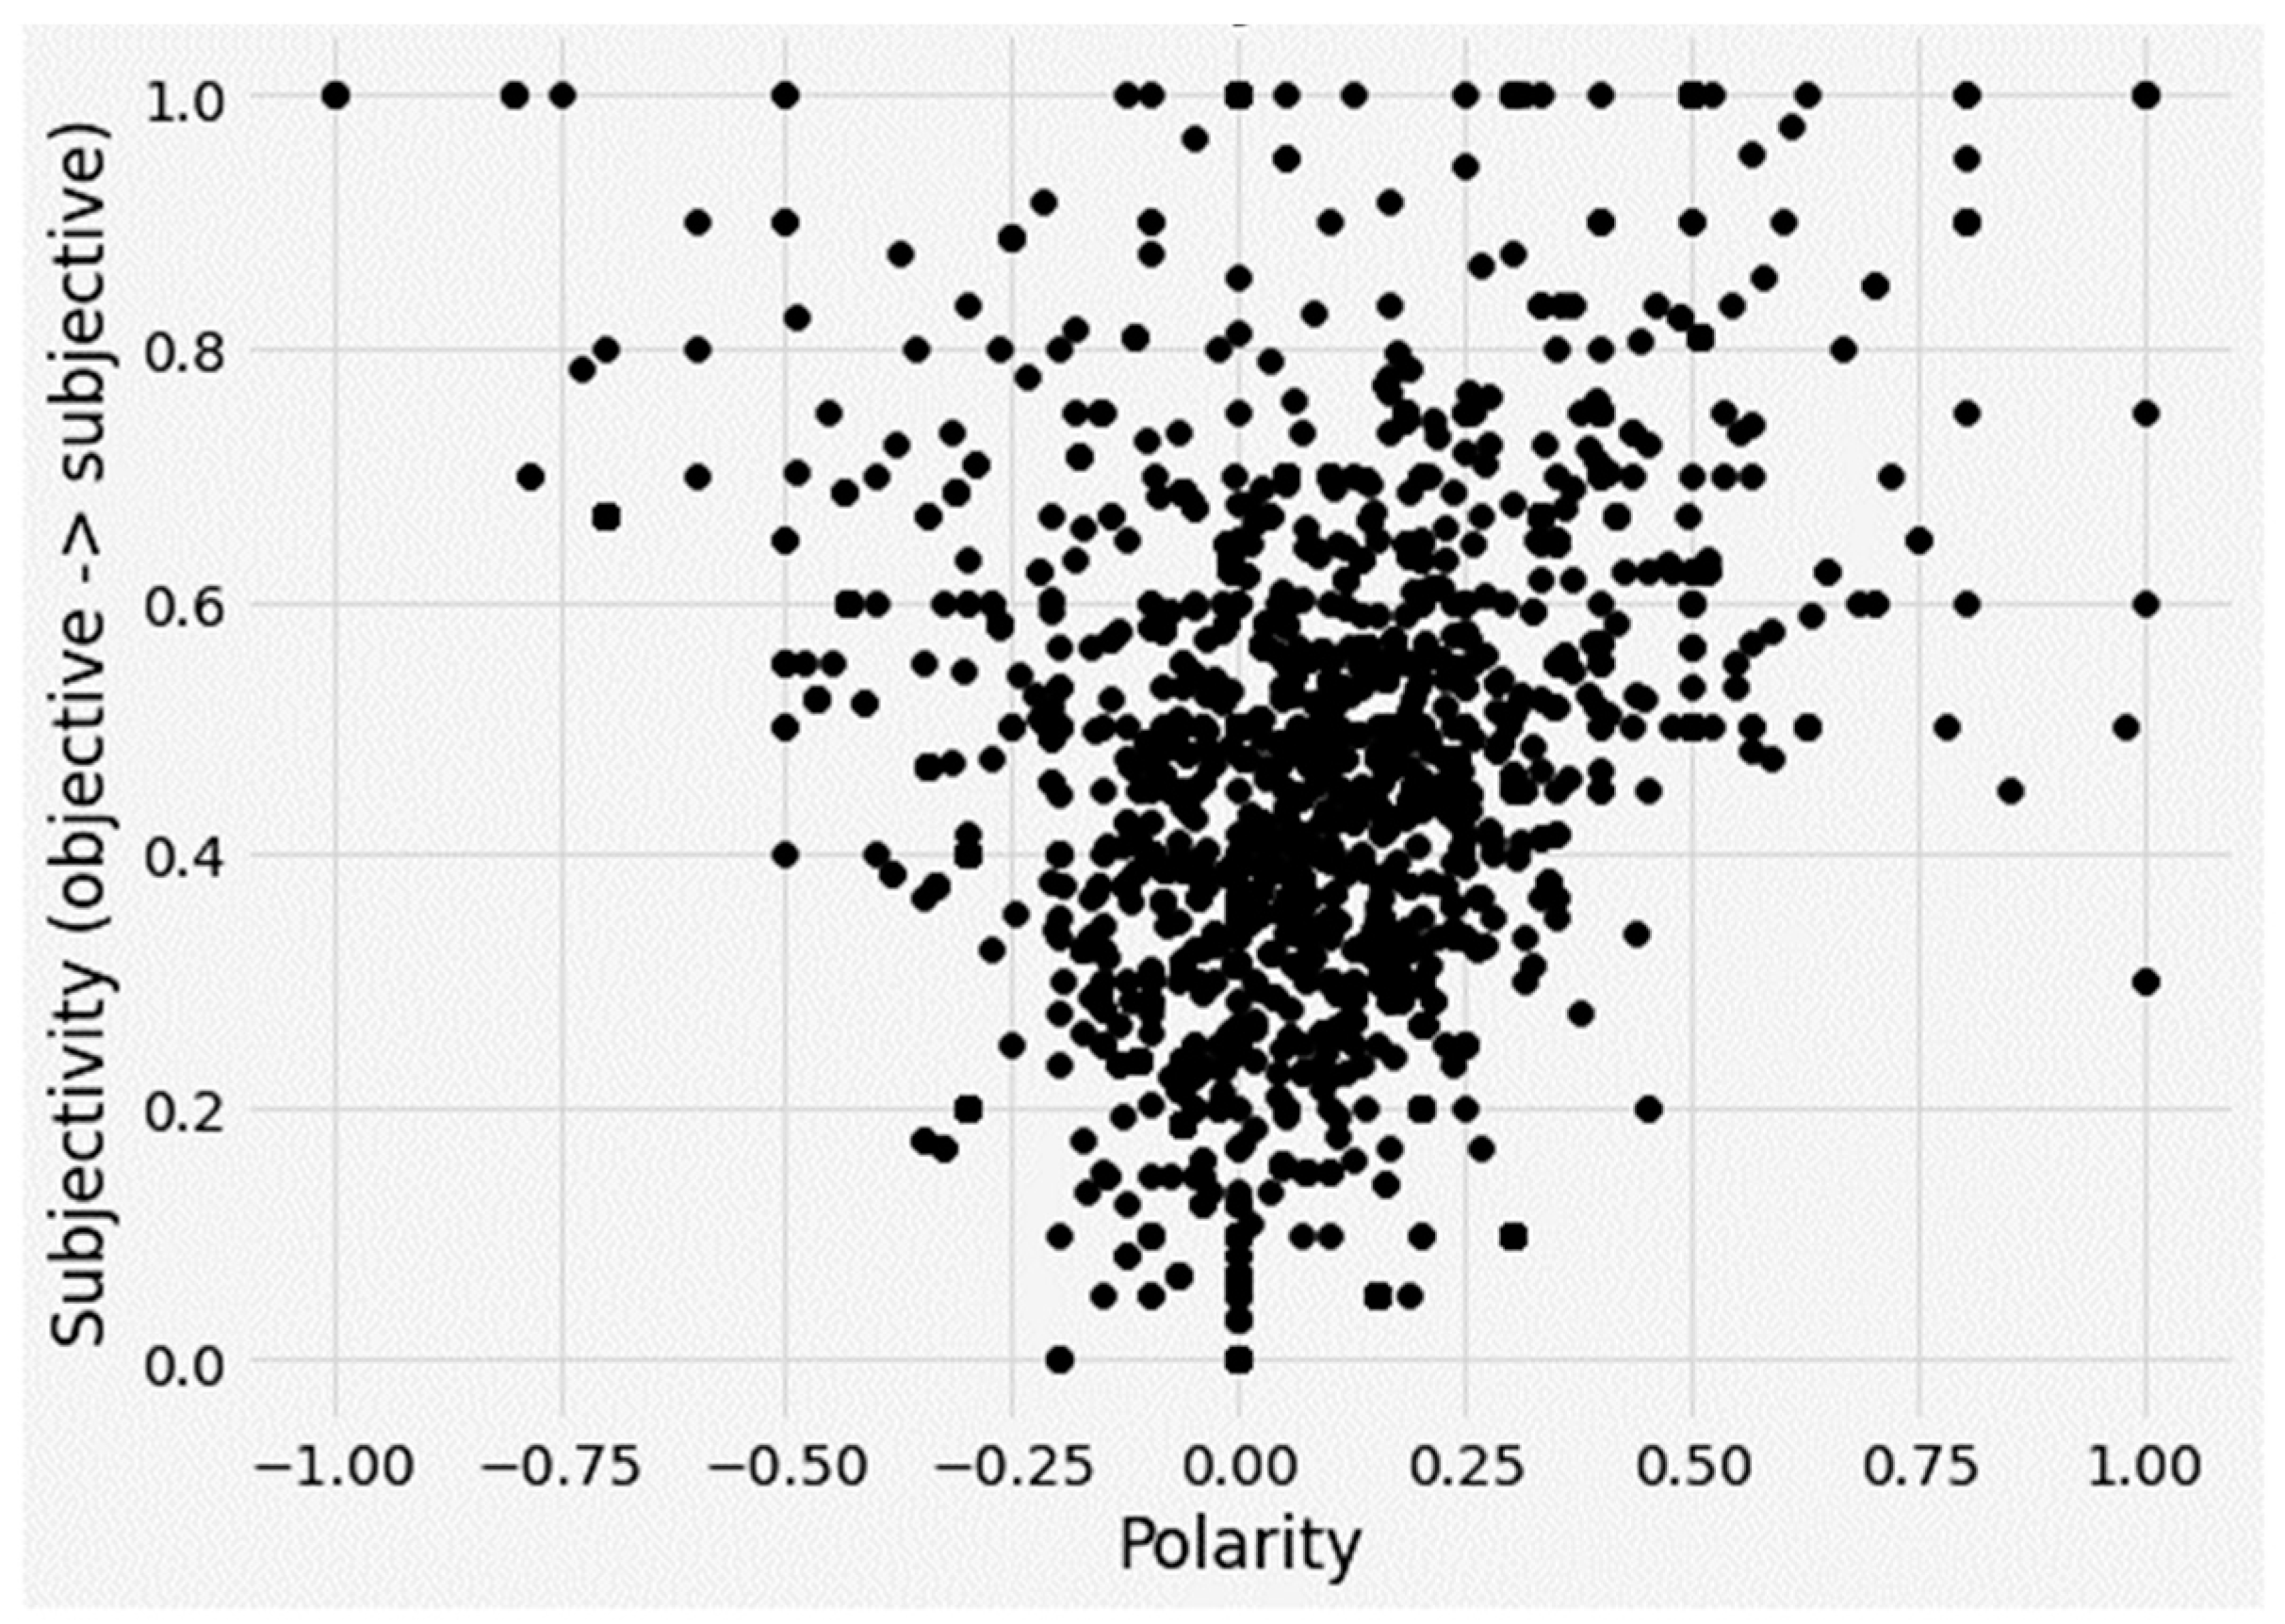
Before conducting the sentiment analysis, it was necessary to check the subjectivity and polarity of each tweet by using TextBlob to confirm the feasibility of sentiment analysis. TextBlob was employed to obtain the subjectivity and polarity of each tweet as shown in Figure 7. First, it takes a dataset as the input then it considers each tweet as sentences. A common way of determining polarity for a tweet is to count the number of positive and negative sentences and decide whether the response is positive and negative based on total number of positive and negative sentences. The polarity and subjectivity of a given tweet can be known using the sentiment() function in the study. It returns a named tuple with two parameters called polarity and subjectivity. The polarity value changes between −1 to 1, which shows us how positive or negative the sentence given is, where −1 is most negative and 1 is most positive. The subjectivity is a value that changes between 0 to 1, which shows us whether the sentence is about a fact or opinion (objective or subjective), where 0 is most objective and 1 is most subjective.
As in Figure 7, the scattered points are mostly concentrated in the middle and upper parts of the graph, which denotes that the content of these tweets is subjective. There are few points where the polarity is equal to 0, which denotes that the content of these tweets is polarized. Therefore, the dataset was subjected to further sentiment analysis.
The tweet sentiments were classified with metric values of the negative, neutral, positive, and compound scores. For example, the first tweet mentioning flight cancelation due to the typhoon had a negative compound score of −0.6956 (Table 3). In the study, we used the compound value to interpret overall sentiment, which is a metric that calculates the sum of all the lexicon ratings that have been normalized between −1 and +1, where −1 indicates “most extreme negative” and +1 indicates “most extreme positive”.
The number of public tweets for Typhoon Faxai was 655 and that for Typhoon Hagibis was 1402. Based on the compound sentiment score, three classifications were labeled as negative (−1 to −0.05), neutral (−0.05 to 0.05), and positive (0.05 to 1), following the typical threshold values. Topic-based sentiment analysis allows practitioners and academics to observe sentiments toward specific topics. The topic generated in the previous section reflects transportation and tourism services and thus enables the evaluation of perception toward the specific service provided. The lower the score, the worse the perception created by the public. The average daily sentiment score for each topic was summarized for Typhoons Faxai and Hagibis. However, since there were very few tweets on some topics, days with more than 10 tweets in each topic were selected for analysis to minimize bias.
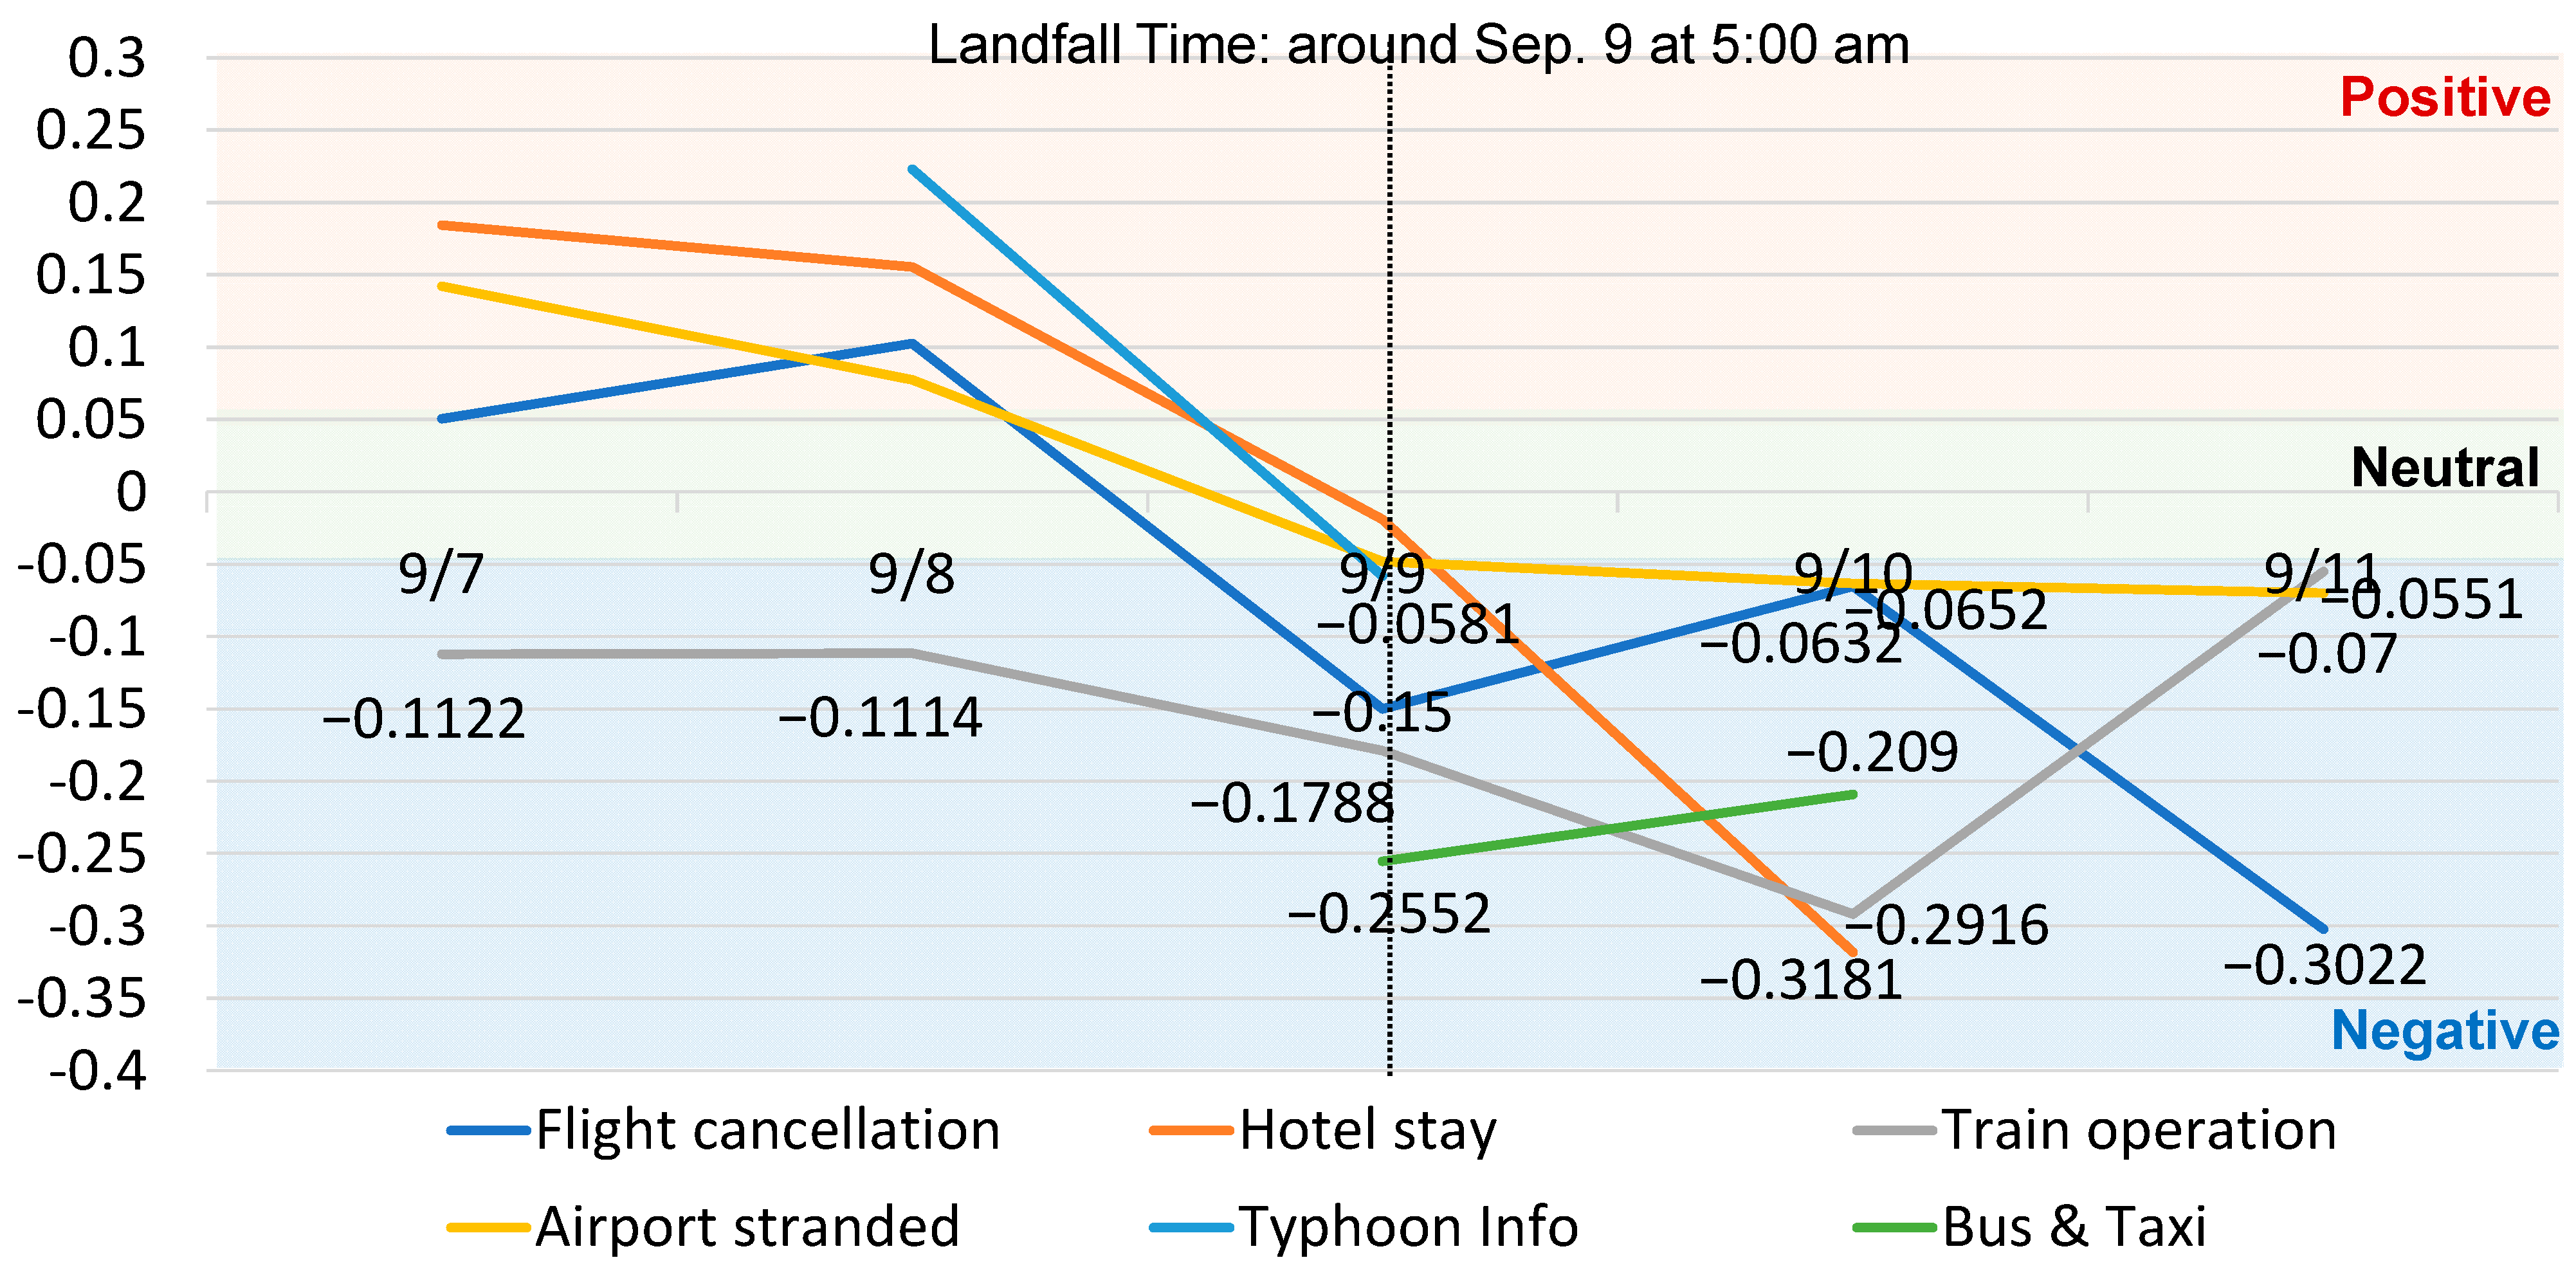
In the case of Typhoon Faxai, the overall sentiments toward transportation and tourism services were neutral to positive, except for “train operation”, as shown in Figure 8. After the landfall, a drastic drop was found in the sentiment toward “hotel stay” and “typhoon information”. Specifically, the sentiment score toward “hotel stay” decreased from 0.1554 on 8 September to −0.0189 on 9 September and −0.3181 on 10 September. The sentiment regarding “train operation” remained negative at −0.1788 on 9 September and −0.2916 on 10 September, and rebounded only after two days. Further, negative sentiments were found for “bus and taxi”, such as −0.2552 on 9 September and −0.209 on 10 September.
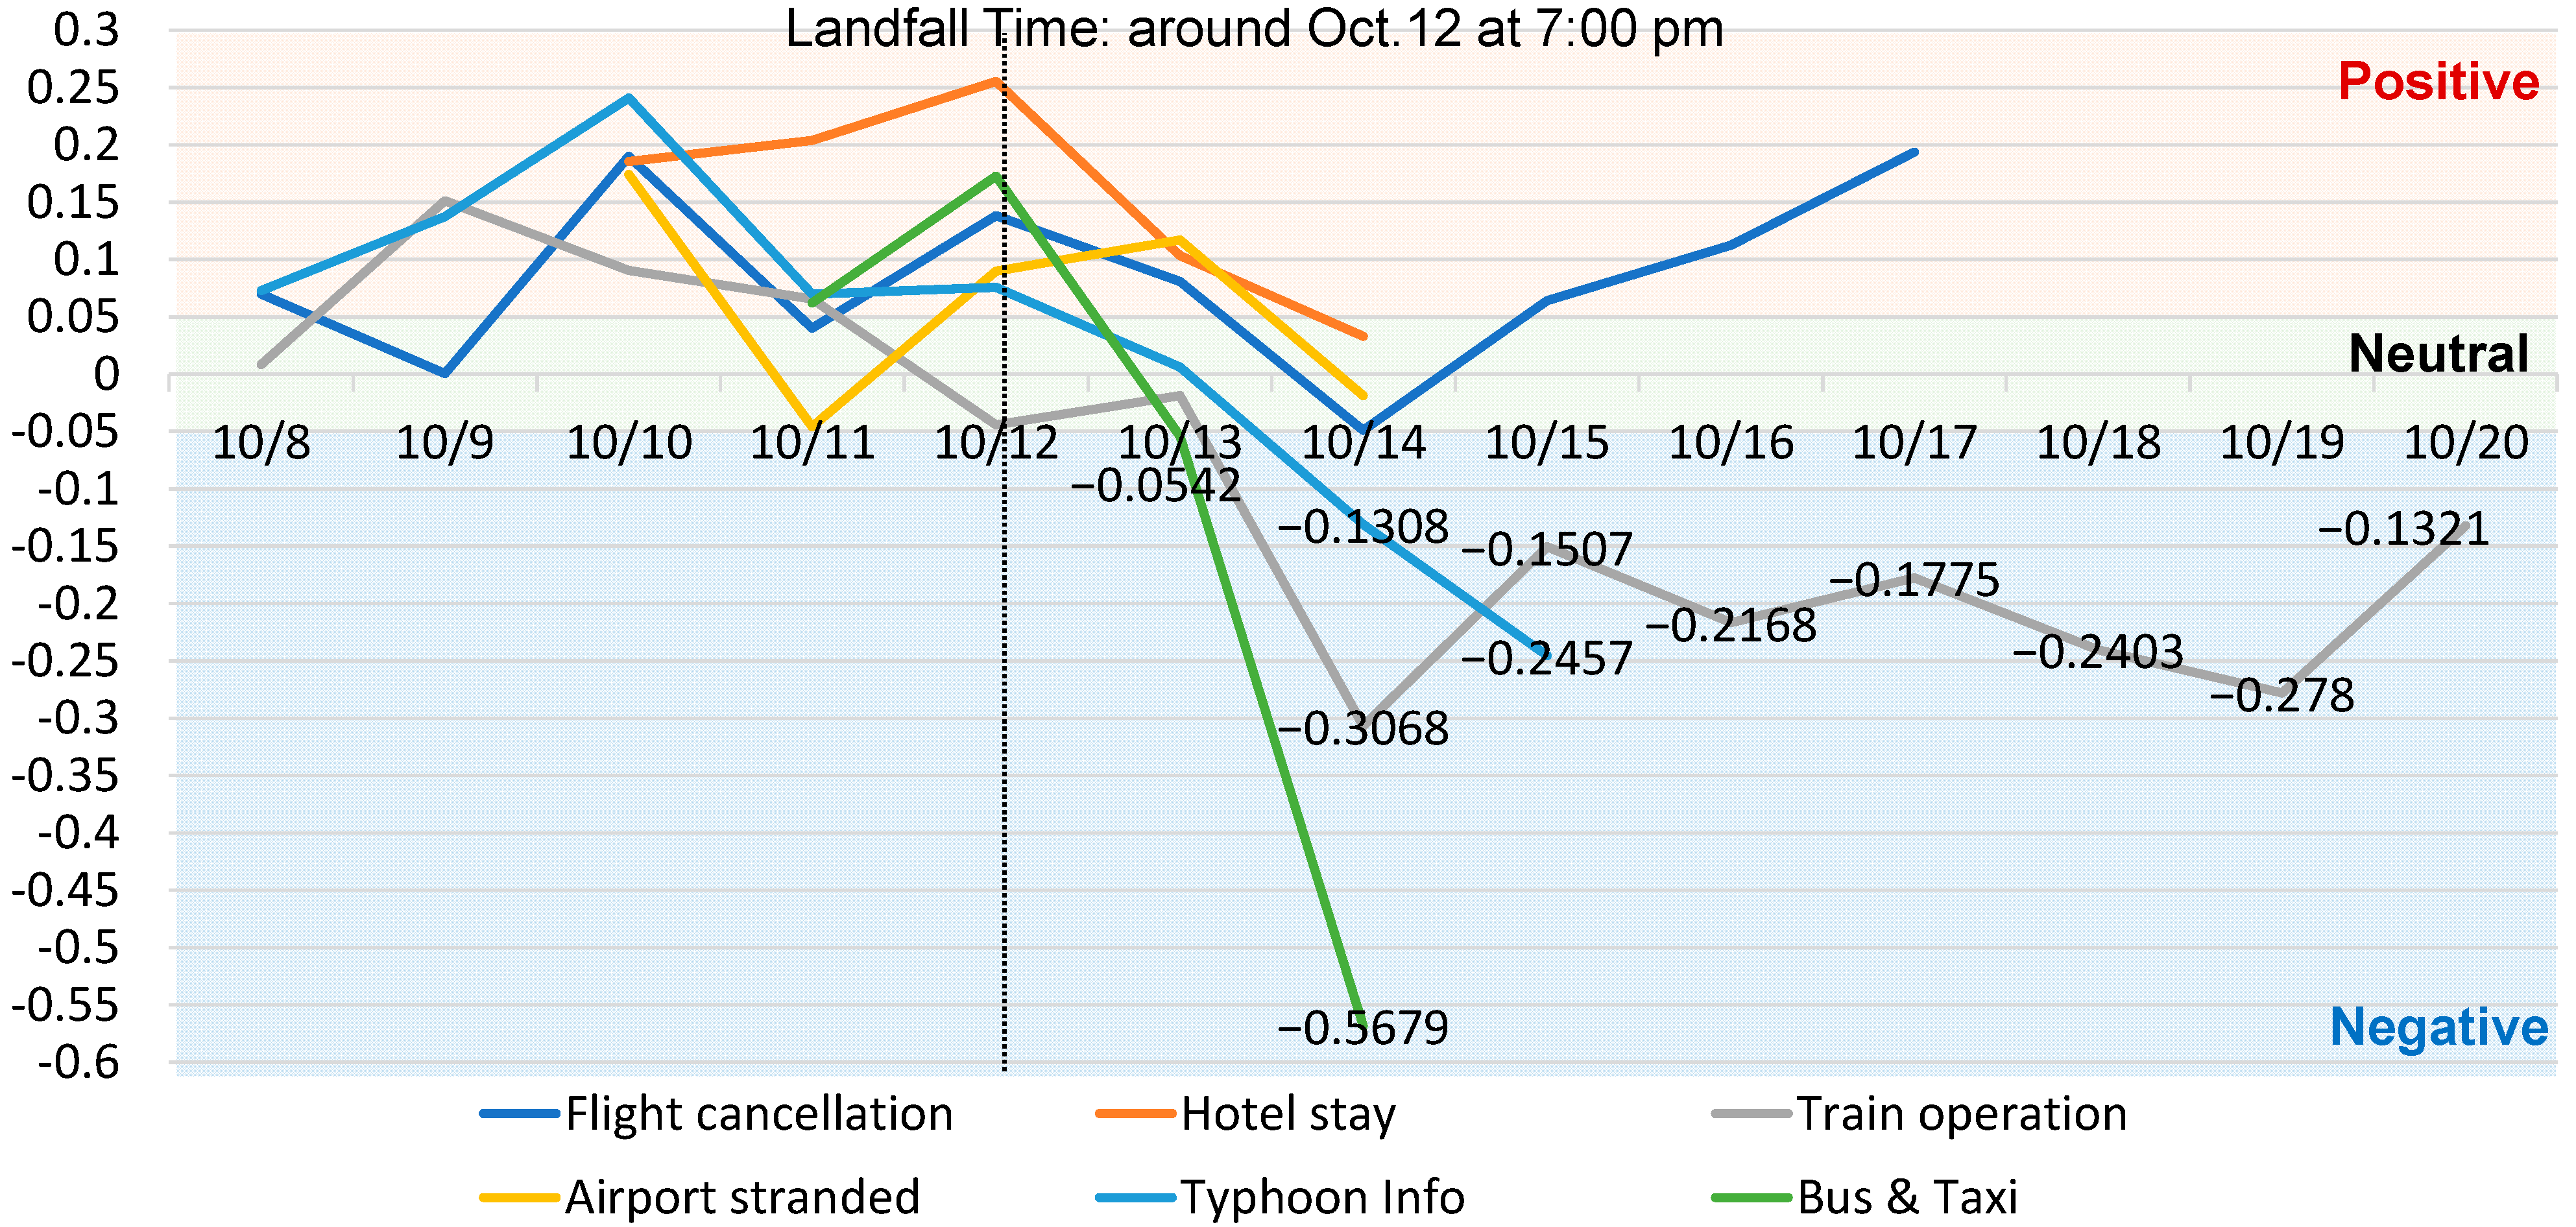
In the case of Typhoon Hagibis, sentiments toward all six topics were either neutral or positive before landfall, as shown in Figure 9. Immediately after landfall, the sentiments toward “bus and taxi” gradually decreased from 0.0624 on 11 October to 0.1726 on 12 October, −0.0542 on 13 October, and −0.5679 on 14 October during the immediate response phase. The sentiment toward “train operation” also decreased from 0.0654 on 11 October to −0.3068 on 14 October, resulting in a continuous negative sentiment for several days. A positive sentiment was found for the topic “flight cancel” at 0.0642 on 15 October, two days after the typhoon landfall. For “typhoon information”, the sentiment was positive until 12 October and turned negative at −0.1308 on 14 October and −0.2457 on 15 October.

4.5. Discussion

Some interesting findings from the results of the analysis are discussed by comparing the average daily sentiment score for both Typhoons Faxai and Hagibis. A drastic decrease in sentiments was found for “hotel stay” for Typhoon Faxai, as shown in Figure 9. This may be because international tourists needed to change or cancel their travel plans and even extend their stay when most flights were not departing from Narita Airport. The topic-based sentiment analysis in this study successfully captures the dissatisfaction of international tourists toward specific services affected by disruptive events. In addition, it is interesting to note that sentiments toward transportation were mostly negative. The sentiments for “train operation” were observed to be negative for a longer period for both typhoons. This result may be explained by the fact that the train network is quite vulnerable to various natural disasters (especially typhoons) in Japan. The results also indicate the negative perception toward “bus and taxi”, which had relatively negative scores in both cases.
The results of the top seven topics raised by public and official tweets show that there are discrepancies in the content and amount of information during the two typhoons in Japan, results which are also supported by previous studies [31,80]. The two topics of hotel stay and bus and taxi are not mentioned in official tweets, whereas the other two topics of typhoon damage and emergency assistance are not mentioned by public tweets. This is probably due to the disaster response characteristics of international tourists, in that they are more likely to move immediately after the disasters and then seek information which supports their decisions to take their next response actions [7,10].

4.6. Theoretical and Practical Implications

This study contributes to the existing literature in the following aspects: First, this is one of the first empirical investigations on exploring the disaster responses and perceptions of international tourists in Japan which extends further understanding in tourism crisis management and crisis communication. Second, our methodological framework examines both topics raised by the public and officials and clarifies their different themes and information needs, which were not adequately addressed in previous studies. Finally, temporal dynamics in topic-based sentiment toward transportation and tourism services support the tailored information dissemination of international tourists in social media use during disasters. Therefore, this study also addresses a gap in the existing theoretical framework, the “Transactive and Dynamic Crisis Communication Model in Hospitality and Tourism” [21], by providing insights through clarifying the content and sentiment of messages communicated during disasters. It focuses on the interactions between organizations, such as businesses and governments, and individuals, such as tourists, to enhance the effectiveness of crisis communication dynamics during disasters.
Furthermore, this study provides practical implications with regards to tourism practices and policies. Considering the fact that accommodation facilities are served as a base for international tourists during the disasters, it is required for accommodation facilities to not only provide information on appropriate disaster response actions but also to update information on disaster situations and public transportation operation, such as the resumption and operation of trains and subways. In addition, given the observed negative perceptions across several transportation modes, it is necessary to discuss the importance of preparedness and response in airport accessibility, extending also to the transport industry. Unlike other tourism cities in the world, Tokyo is known for its numerous airport access modes, such as train, bus, taxi, and rental car services. With regard to trains, the access can be facilitated through Narita Express (NEX), JR lines (excluding NEX), Sky-liner, Narita Access Line (excluding Sky-liner), and Keisei Honsen. The latest report on airport access by Narita Airport shows that international tourists chose the following transport modes to airports: NEX (18.9%), direct bus to airport (18.2%), Sky-liner (15.4%), hotel bus (13.2%), and taxi (3.9%) [81].
Since the train and bus serve as important modes of access to the airport, understandably, international tourists had a negative perception of train as well as bus and taxi operations as an immediate disaster response. This means that not only the airport but also related transportation and tourism stakeholders, especially those working on airport access, need to work collaboratively to provide essential disaster information in a timely manner. To achieve this collaboration, developing a holistic tourism crisis communication framework through discussions among both tourism and transport sector is essential. The framework may include details on role assignment; sharing and disseminating information; and ensuring the content and quality of information, such as the preparation of both digital and printed signs, formats, and multi-language translation.

5. Conclusions

This study clarifies the kind of topics generated by the public and officials to examine the information needs of international tourists related to transport and tourism services and to investigate changes in sentiments toward specific topics in past disasters. This study achieved these objectives by analyzing Twitter data using two data science methods, BERT topic modeling and lexicon-based VADER sentiment analysis. The embedding BERT topic model was built to generate topics of public and official tweets. Thus, sentiment scores derived using topic-based VADER sentiment analysis were utilized to evaluate the perceived responses of international tourists toward transportation and tourism services during the disaster responses. Empirical findings through a case study of Typhoons Faxai and Hagibis in Japan further confirmed the application of the methodological framework and extended the understanding of actual crisis communication in past disasters.
Our results showed that there are some differences between topics generated by the public and officials. Common topics from both sides included “flight cancel”, “train operation”, “airport stranded”, and “typhoon information”. The provision of detailed information about access to airports and the city when transportation is suspended and/or canceled is necessary to support international tourists. Based on the topic-based sentiment analysis of Typhoons Faxai and Hagibis, mostly negative sentiments toward transportation and tourism were found after the landfall of the typhoons. Especially in terms of bus and taxi, which are critical transportation modes that connect the airport and tourism spots, the sentiments drastically dropped during Typhoon Hagibis.
Drawing upon the intersection of tourism crisis communication and data mining analysis, our study extended the potential of Twitter data for the extraction of relevant information in tourism crisis management and as a data source for transport and tourism service monitoring. The differences generated by a topic model can be obtained through real-time Twitter data, which can be utilized by official accounts to adjust and update the content of crisis information. In addition, the topic-based sentiment analysis suggests that monitoring temporal sentiment changes can be used to recommend the kind of transportation/tourism services that need to improve and provide tourism crisis response measures. Finally, these findings help elucidate the understanding of international tourists’ information-seeking behavior during crises. These findings also suggest the need to develop a holistic tourism crisis communication framework involving not only airports but also stakeholders engaged in facilitating airport access, such as transportation and tourism service providers, through further discussions on information and ensuring content or service provision and quality. Adopting a more sustainable perspective allows governmental bodies and policymakers to evaluate both the immediate and long-term effects of risks and hazards on the public and the environment [15].
This study has some limitations. Regarding the Twitter data, its nature brings difficulties in effective topic modeling and sentiment analysis since the models are sensitive to the text quality [66]. Thus, recent restrictions make it difficult for researchers and practitioners to gather the necessary data. Although using relevant keywords to extract the X data is useful, it is necessary to mention that some tweets containing content on transportation or tourism may have been omitted since they did not include the keywords used for filtering. Further study could extend this point by gathering an extensive dataset with more time periods and keywords. In addition, the current study utilizes Tweets in English, but further study could compare the text data in different languages, assuming the Japanese users as residents, to compare other socio-cultural aspects in crisis communication. In addition, the assumption regarding English users as international tourists needs to be confirmed by other case studies or appropriate approaches that utilize more information, such as geotagged location data. As one of validation approaches, comparing the performance of manual labeling in BERT and VADER can be served following discussions in previous studies [33,82,83]. Moreover, the study focused mostly on the response phase but the time span can be extended to explore the recovery stage after the typhoons and application of methodological framework to other types of natural disasters such as earthquakes, hurricanes, wildfires, and others as well. As for the pre-processing of data, additional techniques or rules can be included. Future studies addressing these limitations may be helpful for officials in deciding what kind of combination between communication channels and digital tools is effective while leveraging the existing social media and other traditional channels. Further, information providers can decide information that should be prioritized and categorized while preparing for future tourism crises so that international tourists can obtain the exact information they need and be safely guided and evacuated.

Author Contributions

Conceptualization, S.C. and K.L.; methodology, S.C. and K.L.; software, K.L.; validation, S.C. and K.L.; formal analysis, S.C. and K.L.; investigation, S.C. and K.L.; resources, S.C. and S.H.; data curation, S.C. and K.L.; writing—original draft preparation, S.C.; writing—review and editing, S.C., K.L. and S.H.; visualization, S.C. and K.L; supervision, S.C. and S.H.; project administration, S.C.; funding acquisition, S.C. All authors have read and agreed to the published version of the manuscript.

Funding

This work was supported by the JSPS KAKENHI (Grant-in-Aid for Scientific Research, C), grant number 20K12396.

Institutional Review Board Statement

Not applicable.

Informed Consent Statement

Not applicable.

Data Availability Statement

The raw data supporting the conclusions of this article will be made available by the authors on request.

Conflicts of Interest

The authors declare no conflicts of interest.

References

  1. Mileti, D.S.; O’Brien, P.W. Warnings during Disaster: Normalizing Communicated Risk. Soc. Probl. 1992, 39, 40–57. [Google Scholar] [CrossRef]
  2. Spence, P.R.; Westerman, D.; Skalski, P. Proxemic Effects on Information Seeking Following the 9/11 Attacks. Commun. Res. Rep. 2005, 22, 39–46. [Google Scholar] [CrossRef]
  3. Drabek, T.E. Disaster Responses within the Tourism Industry. Int. J. Mass Emerg. Disasters 1995, 13, 7–23. [Google Scholar] [CrossRef]
  4. Cahyanto, I.; Pennington-Gray, L.; Thapa, B.; Srinivasan, S.; Villegas, J.; Matyas, C.; Kiousis, S. Predicting Information Seeking Regarding Hurricane Evacuation in the Destination. Tour. Manag. 2016, 52, 264–275. [Google Scholar] [CrossRef]
  5. Kawasaki, A.; Henry, M.; Meguro, K. Media Preference, Information Needs, and the Language Proficiency of Foreigners in Japan after the 2011 Great East Japan Earthquake. Int. J. Disaster Risk Sci. 2018, 9, 116–128. [Google Scholar] [CrossRef]
  6. Choi, S. Comparative Study on Disaster Prevention Consciousness and Evacuation Intention of Inbound Tourists and Japanese. In Proceedings of the Travel and Tourism Research Association: Advancing Tourism Research Globally 2020 (2020 TTRA), Victoria, BC, Canada, 16–18 June 2020; p. 72. [Google Scholar]
  7. Choi, S.; Yoshida, K.; Yamaji, H.; Shindo, H.; Maharjan, R. Factors Influencing Disaster Response Behavior of International Tourists under the Tokyo Metropolitan Earthquake Scenario. Front. Sustain. Tour. 2023, 2, 1205084. [Google Scholar] [CrossRef]
  8. Hatayama, M.; Kosaka, T.; Hernandez, A.H. Analysis on Tsunami Evacuation Options with Agent-Based Simulation in Tourist Area. In Proceedings of 2018 5th International Conference on Information and Communication Technologies for Disaster Management (ICT-DM), Sendai, Japan, 4–7 December 2018; IEEE: New York, NY, USA, 2018; pp. 1–8. [Google Scholar]
  9. Takabatake, T.; Shibayama, T.; Esteban, M.; Ishii, H. Simulated tsunami evacuation behavior of local residents and visitors in Kamakura, Japan. Int. J. Disaster Risk Reduct. 2017, 23, 1–14. [Google Scholar] [CrossRef]
  10. Choi, S.; Maharjan, R.; Hong, T.T.N.; Hanaoka, S. Impact of Information Provision on Tsunami Evacuation Behavior of Residents and International Tourists in Japan. Transp. Policy 2024, 155, 264–273. [Google Scholar] [CrossRef]
  11. Ritchie, B.W. Chaos, Crises and Disasters: A Strategic Approach to Crisis Management in the Tourism Industry. Tour. Manag. 2004, 25, 669–683. [Google Scholar] [CrossRef]
  12. Cahyanto, I.; Pennington-Gray, L. Communicating Hurricane Evacuation to Tourists: Gender, Past Experience with Hurricanes, and Place of Residence. J. Travel Res. 2015, 54, 329–343. [Google Scholar] [CrossRef]
  13. Arce, R.S.C.; Onuki, M.; Esteban, M.; Shibayama, T. Risk Awareness and Intended Tsunami Evacuation Behavior of Tourists in Kamakura City, Japan. Int. J. Disaster Risk Reduct. 2017, 23, 178–192. [Google Scholar] [CrossRef]
  14. Aliperti, G.; Nagai, H.; Cruz, A.M. Communicating Risk to Tourists: A Mental Models Approach to Identifying Gaps and Misperceptions. Tour. Manag. Perspect. 2020, 33, 100615. [Google Scholar] [CrossRef]
  15. Alrawad, M.; Lutfi, A.; Almaiah, M.A.; Alsyouf, A.; Arafa, H.M.; Soliman, Y.; Elshaer, I.A. A Novel Framework of Public Risk Assessment Using an Integrated Approach Based on AHP and Psychometric Paradigm. Sustainability 2023, 15, 9965. [Google Scholar] [CrossRef]
  16. Seneviratne, K.; Nadeeshani, M.; Senaratne, S.; Perera, S. Use of Social Media in Disaster Management: Challenges and Strategies. Sustainability 2024, 16, 4824. [Google Scholar] [CrossRef]
  17. Chung, N.; Koo, C. The Use of Social Media in Travel Information Search. Telemat. Inform. 2015, 32, 215–229. [Google Scholar] [CrossRef]
  18. Kwak, S.Y.; Shin, M.; Lee, M.; Back, K.J. Integrating the Reviewers’ and Readers’ Perceptions of Negative Online Reviews for Customer Decision-Making: A Mixed-Method Approach. Int. J. Contemp. Hosp. Manag. 2023, 35, 4191–4216. [Google Scholar] [CrossRef]
  19. Sousa, N.; Alén, E.; Losada, N.; Melo, M. Breaking Barriers: Unveiling Challenges of Tourism and Hospitality Management. Tour. Hosp. Manag. 2024, 30, 269–282. [Google Scholar] [CrossRef]
  20. Sousa, N.; Alén, E.; Losada, N.; Melo, M. Influencing Wine Tourists’ Decision-Making with VR: The Impact of Immersive Experiences on Their Behavioural Intentions. Tour. Manag. Perspect. 2024, 51, 101235. [Google Scholar] [CrossRef]
  21. Liu-Lastres, B. Beyond Simple Messaging: A Review of Crisis Communication Research in Hospitality and Tourism. Int. J. Contemp. Hosp. Manag. 2022, 34, 1959–1983. [Google Scholar] [CrossRef]
  22. Vera-Burgos, C.M.; Griffin Padgett, D.R. Using Twitter for Crisis Communications in a Natural Disaster: Hurricane Harvey. Heliyon 2020, 6, e04804. [Google Scholar] [CrossRef]
  23. Pennington-Gray, L.; Schroeder, A. International Tourists’ Perceptions of Safety & Security: The Role of Social Media. Matkailututkimus 2013, 9, 7–20. [Google Scholar]
  24. Panagiotopoulos, P.; Barnett, J.; Bigdeli, A.Z.; Sams, S. Social Media in Emergency Management: Twitter as a Tool for Communicating Risks to the Public. Technol. Forecast. Soc. Chang. 2016, 111, 86–96. [Google Scholar] [CrossRef]
  25. Schultz, F.; Utz, S.; Göritz, A. Is the medium the message? Perceptions of and reactions to crisis communication via twitter, blogs and traditional media. Public Relat. Rev. Rev. Commun. 2011, 37, 20–27. [Google Scholar] [CrossRef]
  26. Cabinet Office Japan. White Paper on Disaster Management. 2022. Available online: https://www.bousai.go.jp/en/documentation/white_paper/pdf/2022/R4_hakusho_english.pdf (accessed on 13 October 2024).
  27. Japan Tourism Agency. Useful Tools for Foreign Tourists Visiting Japan in Case of a Disaster (In Japanese). 2023. Available online: https://www.mlit.go.jp/kankocho/seisaku_seido/kihonkeikaku/jizoku_kankochi/anzenkakuho/inbound/tool.html (accessed on 13 October 2024).
  28. Morelli, S.; Pazzi, V.; Nardini, O.; Bonati, S. Framing Disaster Risk Perception and Vulnerability in Social Media Communication: A Literature Review. Sustainability 2022, 14, 9148. [Google Scholar] [CrossRef]
  29. Martín, Y.; Cutter, S.L.; Li, Z.; Emrich, C.; Mitchell, J.T. Using geotagged tweets to track population movements to and from Puerto Rico after Hurricane Maria. Popul. Environ. 2020, 42, 4–27. [Google Scholar] [CrossRef]
  30. Bonta, V.; Kumaresh, N.; Janardhan, N. A Comprehensive Study on Lexicon Based Approaches for Sentiment Analysis. Asian J. Comput. Sci. Technol. 2019, 8, 1–6. [Google Scholar] [CrossRef]
  31. Terracciano, E.; Han, A.T. Twitter Communication During Winter Storm Uri in San Antonio, Texas: Implications for Climate Resiliency Planning. Cities 2023, 136, 104407. [Google Scholar] [CrossRef]
  32. Devlin, J.; Chang, M.W.; Lee, K.; Toutanova, K. BERT: Pre-training of Deep Bidirectional Transformers for Language Understanding. arXiv 2018, arXiv:1810.04805. [Google Scholar]
  33. Hutto, C.; Gilbert, E. VADER: A Parsimonious Rule-Based Model for Sentiment Analysis of Social Media Text. In Proceedings of the International AAAI Conference on Web and Social Media, Ann Arbor, MI, USA, 1–4 June 2014; pp. 216–225. [Google Scholar]
  34. Ritchie, B.W.; Jiang, W. A Review of Research on Tourism Risk, Crisis and Disaster Management: Launching the Annals of Tourism Research Curated Collection on Tourism Risk, Crisis and Disaster Management. Ann. Tour. Res. 2019, 79, 102812. [Google Scholar] [CrossRef]
  35. Mair, J.; Ritchie, B.W.; Walters, G. Towards a Research Agenda for Post-Disaster and Post-Crisis Recovery Strategies for Tourist Destinations: A Narrative Review. Curr. Issues Tour. 2016, 19, 1–26. [Google Scholar] [CrossRef]
  36. Faulkner, B. Towards a Framework for Tourism Disaster Management. Tour. Manag. 2001, 22, 135–147. [Google Scholar] [CrossRef]
  37. Möller, C.; Wang, J.; Nguyen, H.T. #Strongerthanwinston: Tourism and Crisis Communication through Facebook following Tropical Cyclones in Fiji. Tour. Manag. 2018, 68, 272–284. [Google Scholar] [CrossRef]
  38. Aliperti, G.; Cruz, A.M. Risk Communication to Tourists: Towards the Definition of a Research Agenda for a More Effective Disaster Preparedness in Japan. Almatourism 2018, 9, 1–12. [Google Scholar] [CrossRef]
  39. Martinez-Rojas, M.; del Carmen Pardo-Ferreira, M.; Rubio-Romero, J.C. Twitter as a Tool for the Management and Analysis of Emergency Situations: A Systematic Literature Review. Int. J. Inf. Manag. 2018, 43, 196–208. [Google Scholar] [CrossRef]
  40. Aladwani, A.M.; Dwivedi, Y.K. Towards a Theory of Socio-Citizenry: Quality Anticipation, Trust Configuration, and Approved Adaptation of Governmental Social Media. Int. J. Inf. Manag. 2018, 43, 261–272. [Google Scholar] [CrossRef]
  41. Lindsay, B.R. Social Media and Disasters: Current Uses, Future Options, and Policy Considerations; Congressional Research Service: Washington, DC, USA, 2011.
  42. Osborne, M.; Moran, S.; McCreadie, R.; Von Lunen, A.; Sykora, M.; Cano, E.; O’Brien, A. Real-Time Detection, Tracking, and Monitoring of Automatically Discovered Events in Social Media. In Proceedings of 52nd Annual Meeting of the Association for Computational Linguistics: System Demonstrations, Baltimore, MD, USA, 23–24 June 2014; pp. 37–42. [Google Scholar] [CrossRef]
  43. Zhao, S.; Gao, Y.; Ding, G.; Chua, T.S. Real-Time Multimedia Social Event Detection in Microblog. IEEE Trans. Cybern. 2017, 48, 3218–3231. [Google Scholar] [CrossRef] [PubMed]
  44. Gal-Tzur, A.; Grant-Muller, S.M.; Kuflik, T.; Minkov, E.; Nocera, S.; Shoor, I. The Potential of Social Media in Delivering Transport Policy Goals. Transp. Policy 2014, 32, 115–123. [Google Scholar] [CrossRef]
  45. Asghari, M.; Sierra-Sosa, D.; Elmaghraby, A.S. A Topic Modeling Framework for Spatio-Temporal Information Management. Inf. Process. Manag. 2020, 57, 102340. [Google Scholar] [CrossRef]
  46. Romero, C.; Ventura, S. Educational Data Mining: A Review of the State of the Art. IEEE Trans. Syst. Man Cybern. Part C Appl. Rev. 2010, 40, 601–618. [Google Scholar] [CrossRef]
  47. Zeng, L.; Li, L.; Duan, L.; Lu, K.; Shi, Z.; Wang, M.; Wu, W.; Luo, P. Distributed Data Mining: A Survey. Inf. Technol. Manag. 2012, 13, 403–409. [Google Scholar] [CrossRef]
  48. He, W. Improving User Experience with Case-Based Reasoning Systems Using Text Mining and Web 2.0. Expert Syst. Appl. 2013, 40, 500–507. [Google Scholar] [CrossRef]
  49. Ukkusuri, S.V.; Zhan, X.; Sadri, A.M.; Ye, Q. Use of Social Media Data to Explore Crisis Informatics: Study of 2013 Oklahoma Tornado. Transp. Res. Rec. 2014, 2459, 110–118. [Google Scholar] [CrossRef]
  50. Vayansky, I.; Kumar, S.A.P. A Review of Topic Modeling Methods. Inf. Syst. 2020, 94, 101582. [Google Scholar] [CrossRef]
  51. Blei, D.M.; Ng, A.Y.; Jordan, M.I. Latent Dirichlet Allocation. J. Mach. Learn. Res. 2003, 3, 993–1022. [Google Scholar]
  52. Méndez, J.T.; Lobel, H.; Parra, D.; Herrera, J.C. Using Twitter to Infer User Satisfaction with Public Transport: The Case of Santiago, Chile. IEEE Access 2019, 7, 60255–60263. [Google Scholar] [CrossRef]
  53. Ali, F.; Kwak, D.; Khan, P.; Islam, S.R.; Kim, K.H.; Kwak, K.S. Fuzzy Ontology-Based Sentiment Analysis of Transportation and City Feature Reviews for Safe Traveling. Transp. Res. Part C Emerg. Technol. 2017, 77, 33–48. [Google Scholar] [CrossRef]
  54. Hu, M.; Liu, B. Mining and Summarizing Customer Reviews. In Proceedings of the Tenth ACM SIGKDD International Conference on Knowledge Discovery and Data Mining, Seattle, WA, USA, 22–25 August 2004; ACM: New York, NY, USA, 2004; pp. 168–177. [Google Scholar]
  55. Ma, E.; Cheng, M.; Hsiao, A. Sentiment Analysis—A Review and Agenda for Future Research in Hospitality Contexts. Int. J. Contemp. Hosp. Manag. 2018, 30, 3287–3308. [Google Scholar] [CrossRef]
  56. Philander, K.; Zhong, Y. Twitter Sentiment Analysis: Capturing Sentiment from Integrated Resort Tweets. Int. J. Hosp. Manag. 2016, 55, 16–24. [Google Scholar] [CrossRef]
  57. Kirilenko, A.P.; Stepchenkova, S.O.; Kim, H.; Li, X. Automated Sentiment Analysis in Tourism: Comparison of Approaches. J. Travel Res. 2018, 57, 1012–1025. [Google Scholar] [CrossRef]
  58. Paolanti, M.; Mancini, A.; Frontoni, E.; Felicetti, A.; Marinelli, L.; Marcheggiani, E.; Pierdicca, R. Tourism Destination Management Using Sentiment Analysis and Geo-Location Information: A Deep Learning Approach. Inf. Technol. Tour. 2021, 23, 241–264. [Google Scholar] [CrossRef]
  59. Tokarchuk, O.; Barr, J.C.; Cozzio, C. Estimating Destination Carrying Capacity: The Big Data Approach. In Proceedings of the 51st Travel and Tourism Research Association (TTRA) International Conference, Vitual, 14–16 June 2021. [Google Scholar]
  60. Norris, F.H.; Stevens, S.P.; Pfefferbaum, B.; Wyche, K.F.; Pfefferbaum, R.L. Community Resilience as a Metaphor, Theory, Set of Capacities, and Strategy for Disaster Readiness. Am. J. Community Psychol. 2008, 41, 127–150. [Google Scholar] [CrossRef] [PubMed]
  61. Irons, M.; Paton, D. Social Media and Emergent Groups: The Impact of High Functionality of Community Resilience. In Disaster Resilience: An Integrated Approach, 2nd ed.; Paton, D., Moore, D., Eds.; Charles C Thomas Publisher: Springfield, IL, USA, 2017. [Google Scholar]
  62. Obembe, D.; Kolade, O.; Obembe, F.; Owoseni, A.; Mafimisebi, O. COVID-19 and Tourism Industry: An Early Stage Sentiment Analysis of the Impact of Social Media and Stakeholder Communication. Int. J. Inf. Manag. Data Insights 2021, 1, 100040. [Google Scholar] [CrossRef]
  63. Schulz, A.; Thanh, T.D.; Paulheim, H.; Schweizer, I. A Fine-Grained Sentiment Analysis Approach for Detecting Crisis Related Microposts. In Proceedings of the 10th International ISCRAM Conference, Baden, Germany, 1 May 2013; pp. 846–851. [Google Scholar]
  64. Neppalli, V.K.; Caragea, C.; Squicciarini, A.; Tapia, A.; Stehle, S. Sentiment Analysis during Hurricane Sandy in Emergency Response. Int. J. Disaster Risk Reduct. 2017, 21, 213–222. [Google Scholar] [CrossRef]
  65. Sano, K.; Sano, H. The effect of different crisis communication channels. Ann. Tour. Res. 2019, 79, 102804. [Google Scholar] [CrossRef]
  66. Dahal, B.; Kumar, S.A.P.; Li, Z. Topic Modeling and Sentiment Analysis of Global Climate Change Tweets. Soc. Netw. Anal. Min. 2019, 9, 24. [Google Scholar] [CrossRef]
  67. Zheng, Y.; Su, L.; Luo, Q.; Liu-Lastres, B. Public Risk Perception of Cruise Travel on Social Media: A Collective Sensemaking Perspective. J. Hosp. Tour. Manag. 2023, 56, 473–481. [Google Scholar] [CrossRef]
  68. Laureate, C.D.P.; Buntine, W.; Linger, H. A systematic review of the use of topic models for short text social media analysis. Artif. Intell. Rev. 2023, 56, 14223–14225. [Google Scholar] [CrossRef]
  69. Birunda, S.S.; Devi, R.K. A Review on Word Embedding Techniques for Text Classification. In Innovative Data Communication Technologies and Application; Raj, J.S., Ed.; Lecture Notes on Data Engineering and Communications Technologies; Springer: Singapore, 2021; Volume 59, pp. 271–282. [Google Scholar] [CrossRef]
  70. Çılgın, C.; Baş, M.; Bilgehan, H.; Ünal, C. Twitter Sentiment Analysis during COVID-19 Outbreak with VADER. Am. J. Inf. Technol. Educ. 2022, 13, 49. [Google Scholar] [CrossRef]
  71. Sakurai, M.; Adu-Gyamfi, B. Disaster-Resilient Communication Ecosystem in an Inclusive Society—A Case of Foreigners in Japan. Int. J. Disaster Risk Reduct. 2020, 51, 101804. [Google Scholar] [CrossRef]
  72. Twitter. Twitter Advanced Search. Available online: https://help.x.com/en/using-x/x-advanced-search (accessed on 1 December 2022).
  73. Grootendorst, M. BERTopic: Leveraging BERT and c-TF-IDF to Create Easily Interpretable Topics. Zenodo 2020. [CrossRef]
  74. McInnes, L.; Healy, J.; Melville, J. UMAP: Uniform Manifold Approximation and Projection for Dimension Reduction. ArXiv 2018, arXiv:1802.03426. [Google Scholar] [CrossRef]
  75. Campello, R.J.; Moulavi, D.; Sander, J. Density-Based Clustering Based on Hierarchical Density Estimates. In Pacific-Asia Conference on Knowledge Discovery and Data Mining; Springer: Berlin/Heidelberg, Germany, 2013; pp. 160–172. [Google Scholar]
  76. Pavlopoulos, I. Aspect Based Sentiment Analysis. Ph.D. Thesis, Athens University of Economics and Business, Athens, Greece, 2014. [Google Scholar]
  77. Japan Meteorological Agency. Damage Caused by Typhoons in Japan (In Japanese). Available online: https://www.jma.go.jp/jma/kishou/know/typhoon/6-1.html (accessed on 2 December 2022).
  78. Suzuki, T.; Tajima, Y.; Watanabe, M.; Tsuruta, N.; Takagi, H.; Takabatake, T. Post-Event Survey of Locally Concentrated Disaster due to 2019 Typhoon Faxai along the Western Shore of Tokyo Bay, Japan. Coast. Eng. J. 2020, 62, 146–158. [Google Scholar] [CrossRef]
  79. Murata, A.; Teraoka, A. Exodus Begins for over 10,000 Stranded at Narita Airport. 10 September 2019. Available online: https://asia.nikkei.com/Economy/Natural-disasters/Exodus-begins-for-over-10-000-stranded-at-Narita-airport (accessed on 2 December 2022).
  80. Deng, Q.; Gao, Y.; Wang, C.; Zhang, H. Detecting Information Requirements for Crisis Communication from Social Media Data: An Interactive Topic Modeling Approach. Int. J. Disaster Risk Reduct. 2020, 50, 101692. [Google Scholar] [CrossRef]
  81. Narita International Airport Corporation. Survey on Current State of Transportation Modes of Access to Narita Airport. Available online: https://www.naa.jp/jp/ (accessed on 2 December 2022).
  82. Hartman, J.; Huppertz, J.; Schamp, C.; Heitmann, M. Comparing Automated Text Classification Methods. Int. J. Res. Mark. 2019, 36, 20–38. [Google Scholar] [CrossRef]
  83. Hayati, S.A.; Kang, D.; Ungar, L. Does BERT Learn as Humans Perceive? Understanding Linguistic Styles through Lexica. In Proceedings of the 2021 Conference on Empirical Methods in Natural Language Processing, Virtual Event, 7–11 November 2021; pp. 6323–6331. [Google Scholar]
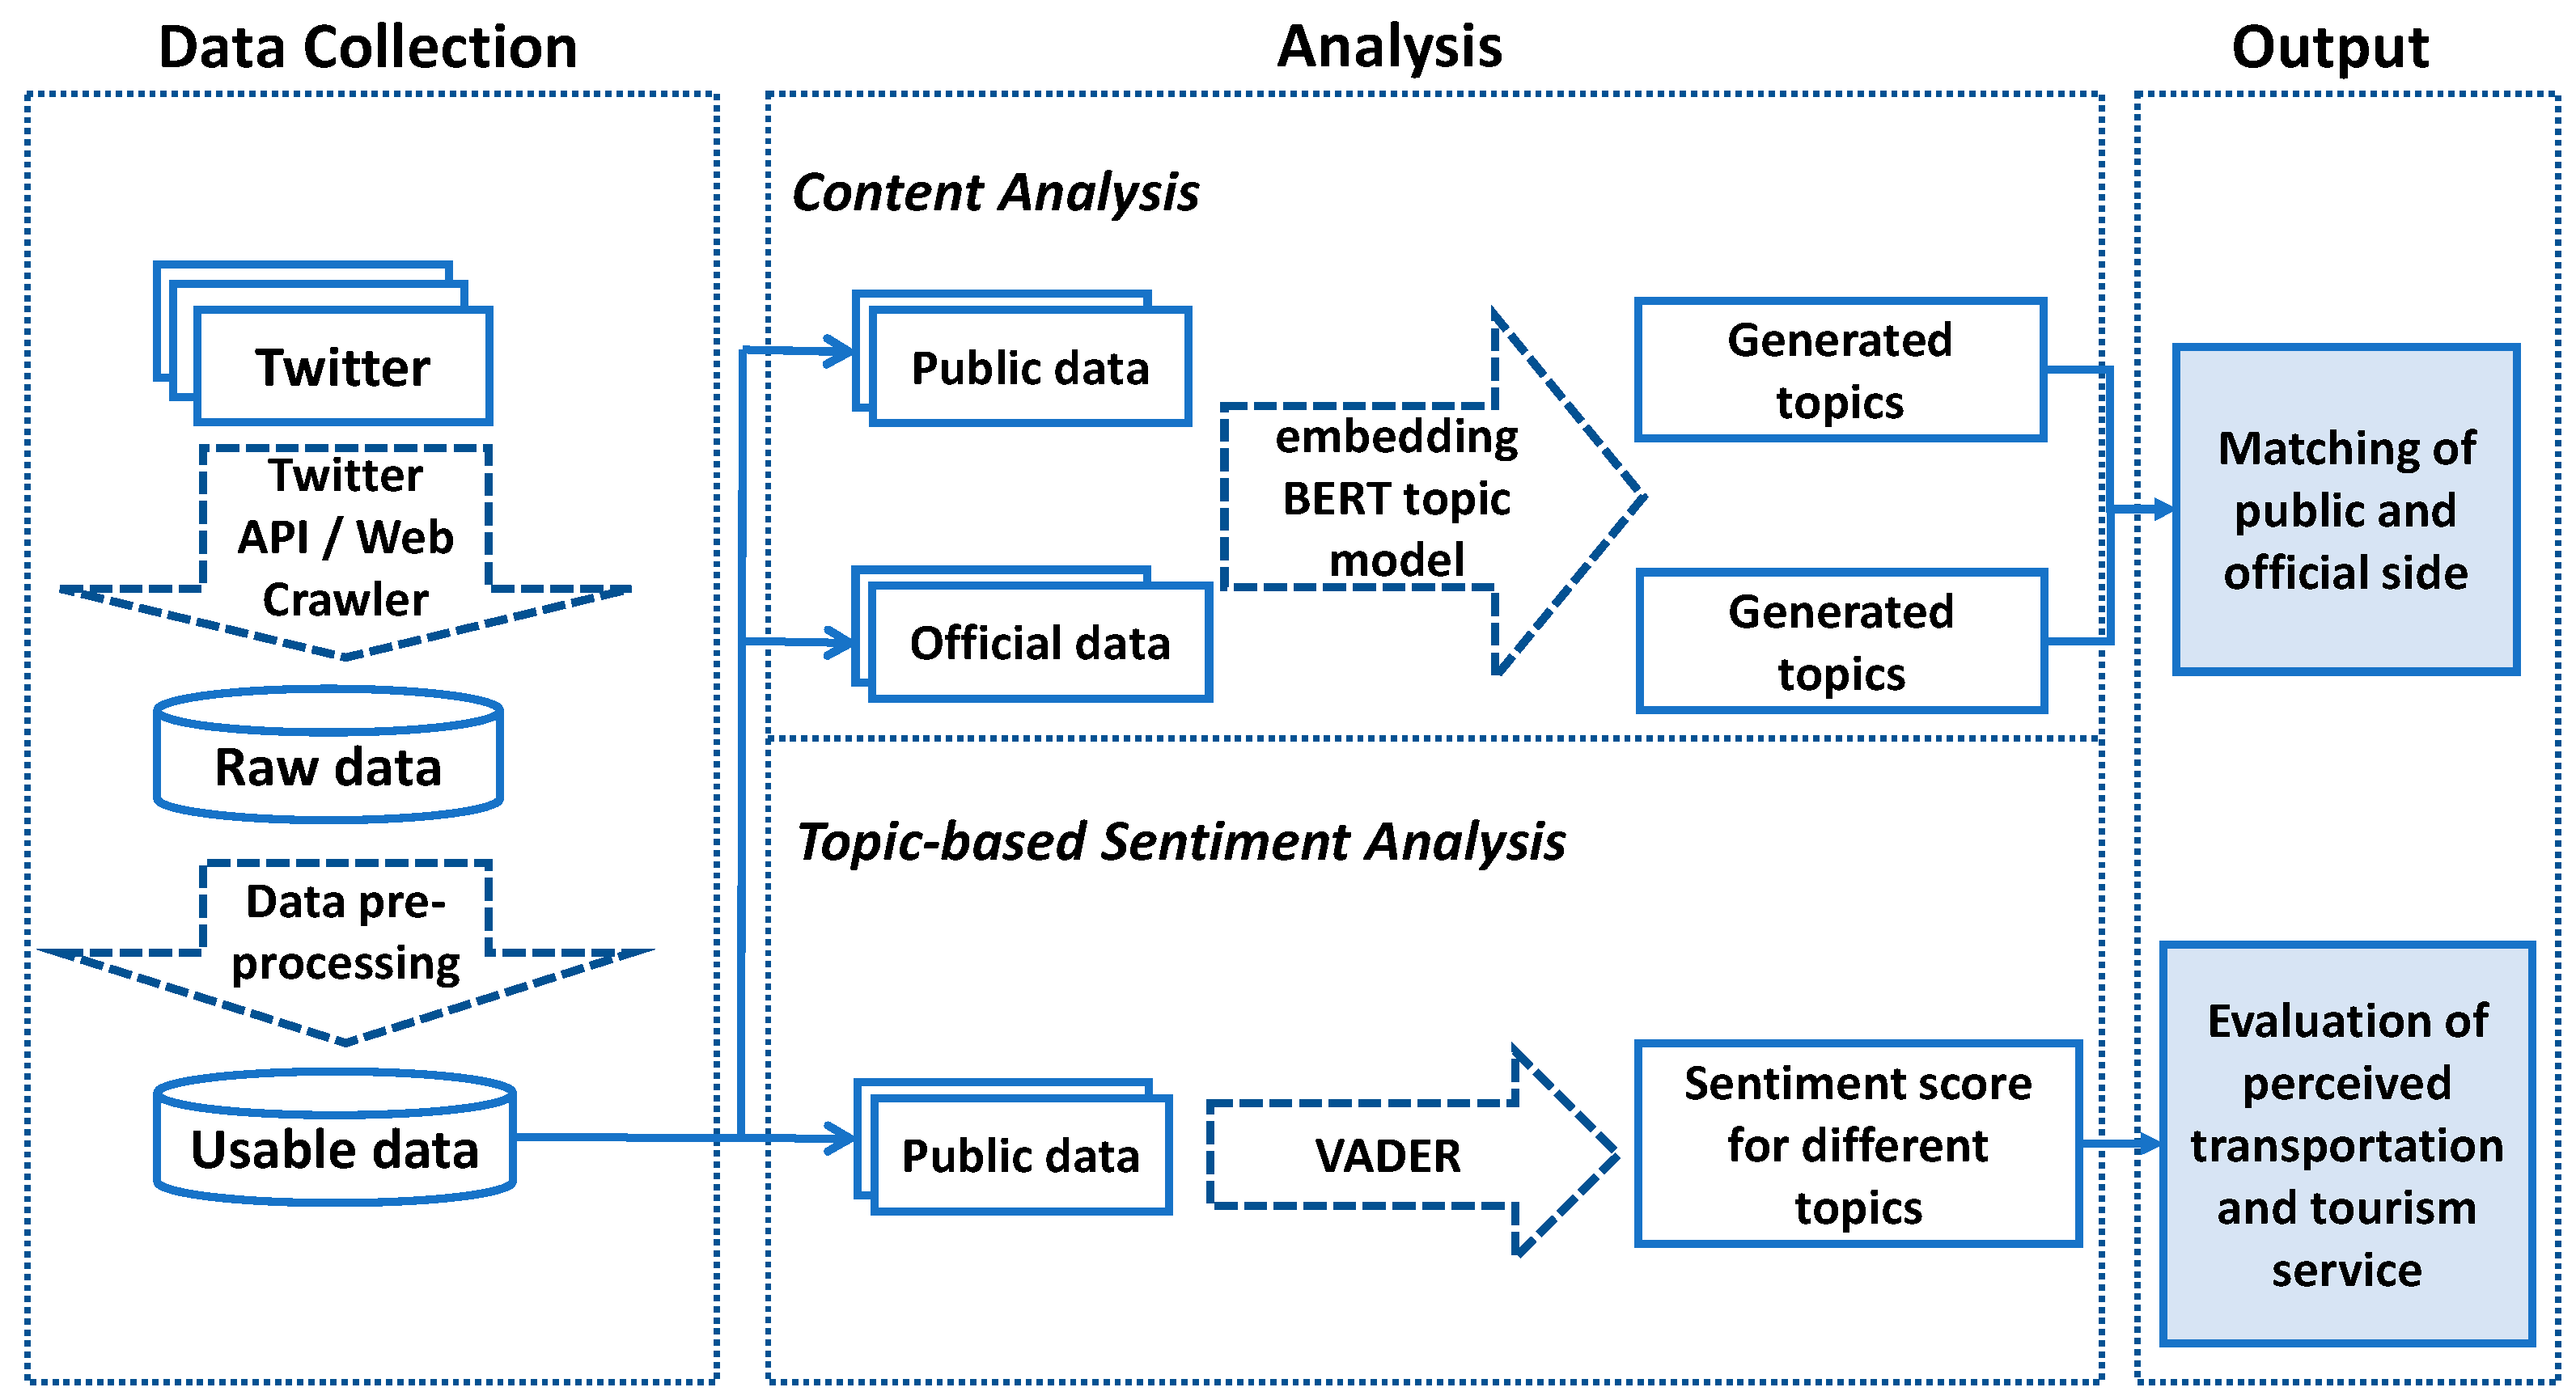
Figure 1. Methodological framework.
Sustainability 16 09114 g001
Figure 2. Illustration of the components of a text tweet.
Sustainability 16 09114 g002
Figure 3. Map of Tokyo and location of major airports (modified from Google Maps; by Brionies—own work, CC BY-SA 3.0, https://commons.wikimedia.org/w/index.php?curid=10907220, accessed on 2 December 2022).
Sustainability 16 09114 g003
Figure 4. Intertopic distance maps of public (left) and official (right) data.
Sustainability 16 09114 g004
Figure 5. Distribution of the number of tweets in days on the topics of (a) flight cancel, (b) hotel stay, (c) train operation, (d) airport stranded, (e) typhoon information, and (f) bus and taxi.
Sustainability 16 09114 g005aSustainability 16 09114 g005b
Figure 6. Relative percentages of public and official topics.
Sustainability 16 09114 g006
Figure 7. Subjectivity and polarity scatter plot.
Sustainability 16 09114 g007
Figure 8. Average daily sentiment score (Typhoon Faxai).
Sustainability 16 09114 g008
Figure 9. Average daily sentiment score (Typhoon Hagibis).
Sustainability 16 09114 g009
Table 1. Tweets of 10 official accounts.
Account IDNumber of Tweets
@JapanSafeTravel 103
@NHKWORLD_News47
@JR-WEST Travel Information 46
@JRE_Super_Exp39
@JRC_Shinkan_en25
@Narita Airport Operation Information [Official]51
@Narita_OPC_info15
@JAL Flight Info32
@ANA Flight Info7
@haneda_airport8
Table 2. Top seven public topics.
TopicTopic NameCountKeywords
Public1Flight cancel (1)137flight; cancelled; get; hi; delayed; united; now
2Hotel stay113hotel; room; night; rain; stay; here; day
3Train operation69suspended; train; tokyu; transportation; shinkansen; strike; yamanashi
4Flight cancel (2)69canceled; airports; flights; airlines; airways; Haneda; nrt
5Airport stranded68stranded; airport; narita; faxai; passengers; leaving; travelers
6Typhoon information51weekend; winds; rain; storm; Hagibis; expected; weather
7Bus and Taxi47Narita; airport; buses; taxi; chaos; Tokyo; passengers
Official1Flight cancel72flights; typhoon; Hagibis; cancelled; delayed; operations; tokyo
2Train operation43suspended; train; shinkansen; operations; Monday; tokaido; september
3Emergency assistance28emergencies; assistance; tourist; hotline; call; accidents; disaster
4Typhoon information (1)28warning; rain; emergency; meteorological; yamanashi; saitama; miyagi
5Typhoon damage25Hagibis; typhoon; damage; east; causes; flooding; areas
6Airport stranded24airline; congestion; terminals; airport; narita; transporation; typhoon
7Typhoon information (2)24October; typhoon; current; notice; status; canceled; suspension
Table 3. Examples of the VADER results.
TweetsCompoundNegativePositiveNeutral
I was supposed to go to Osaka this weekend, but my flight was cancelled due to the typhoon. Getting ahold of an English speaker at @JEJUair so I can either get refunded or rebook has been difficult.−0.69560.14100.859
For those who travel in Japan, we have a record-level typhoon approaching. Many air flights, trains, and shinkansen are scheduled to suspend the operation today across the nation. You should also stay alert−0.02580.0610.0590.88
Flights canceled; preparations underway as super typhoon bears down on Japan 0.599400.2810.719
Disclaimer/Publisher’s Note: The statements, opinions and data contained in all publications are solely those of the individual author(s) and contributor(s) and not of MDPI and/or the editor(s). MDPI and/or the editor(s) disclaim responsibility for any injury to people or property resulting from any ideas, methods, instructions or products referred to in the content.