
Assessing Watershed Flood Resilience Based on a Grid-Scale System Performance Curve That Considers Double Thresholds

 ,
,
Abstract
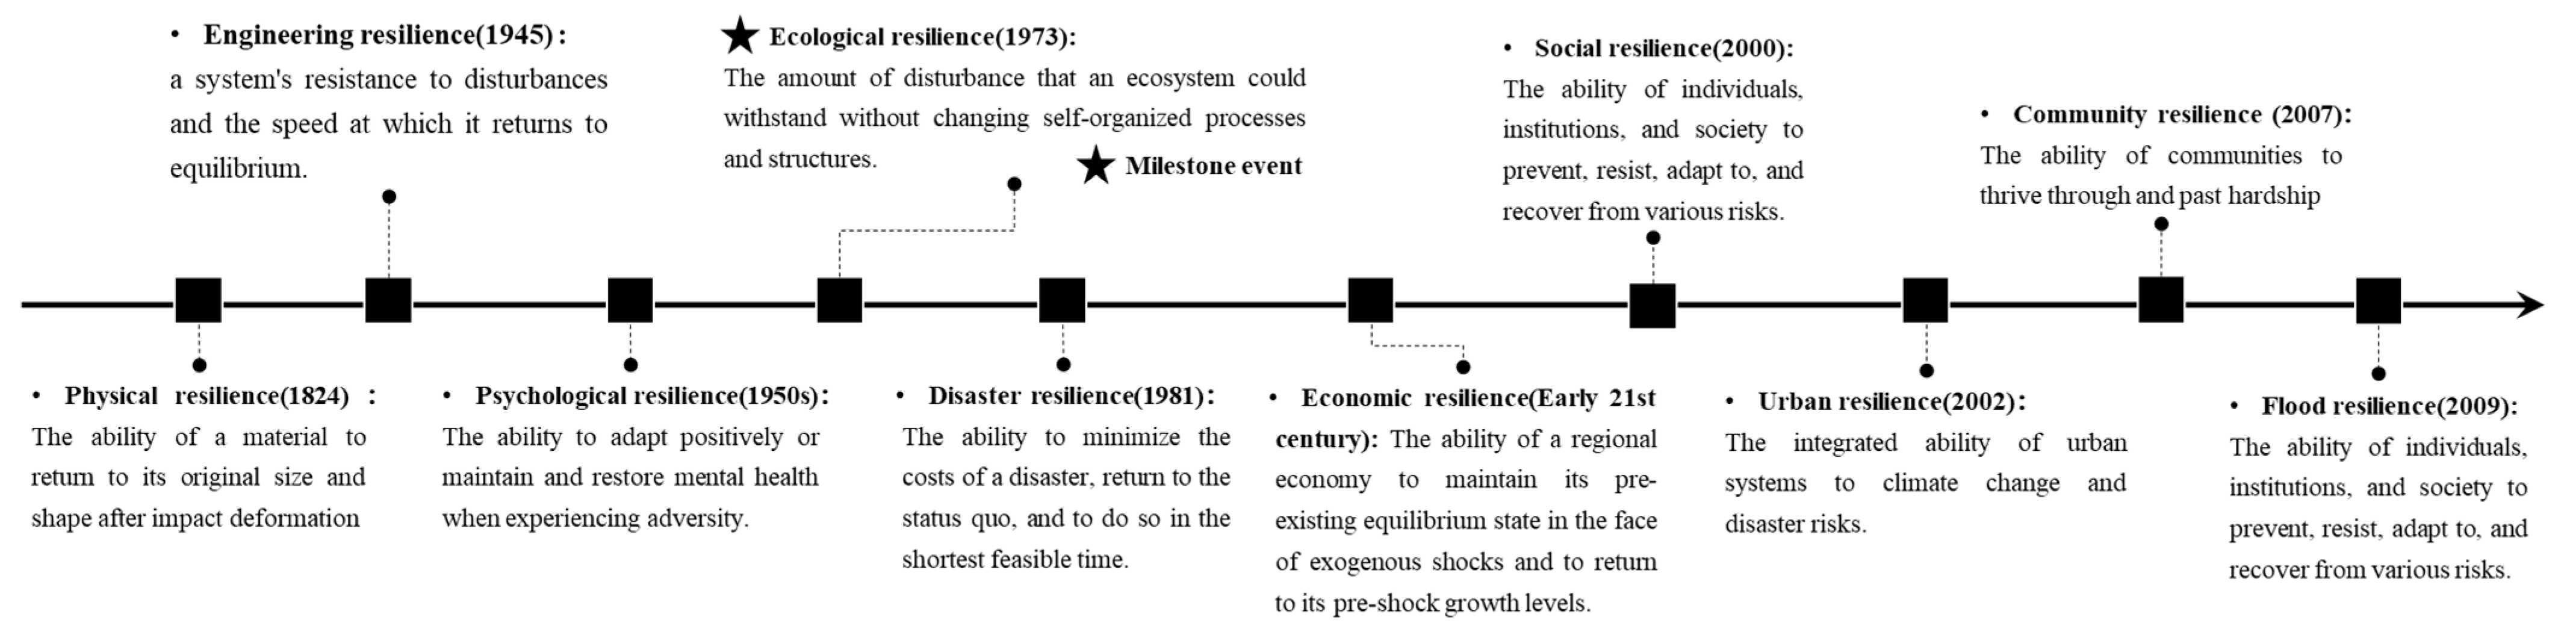
1. Introduction
2. Materials and Methods
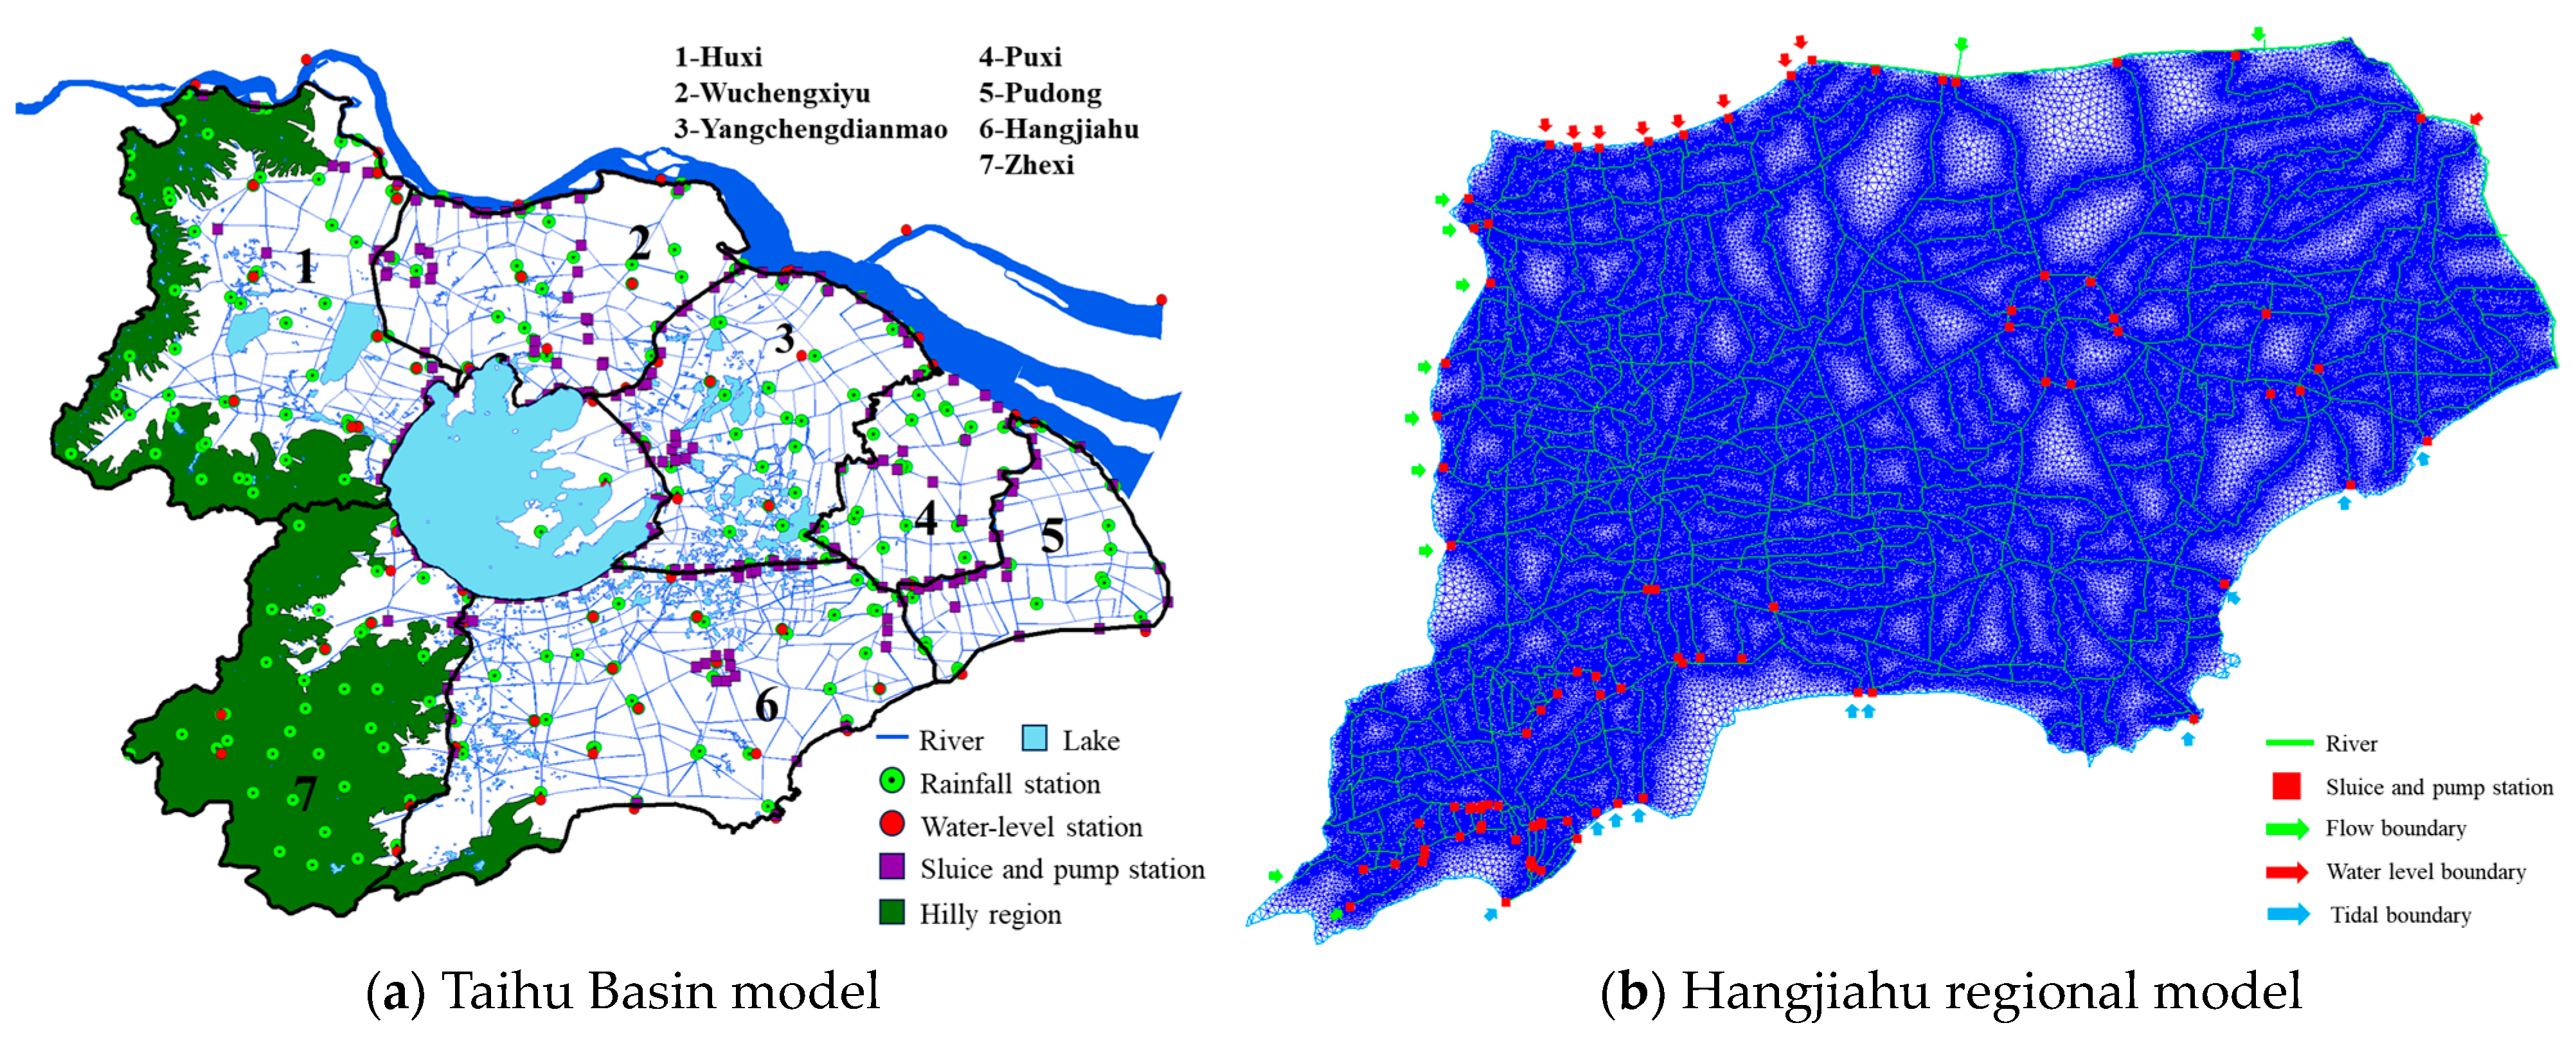
2.1. Study Area and Data
2.2. Study Framework
2.3. Flood Disaster Simulation Method
2.3.1. One-Dimensional Hydrodynamic River Simulation Method
2.3.2. Two-Dimensional Surface Hydrodynamic Simulation Method
2.4. Flood Resilience Assessment Method
2.4.1. System Performance Curve
2.4.2. Flood Resilience Assessment Method Based on Improved System Performance Curve
3. Results
3.1. Flood Disaster Simulation
3.1.1. Construction of the Hydrological and Hydrodynamic Model
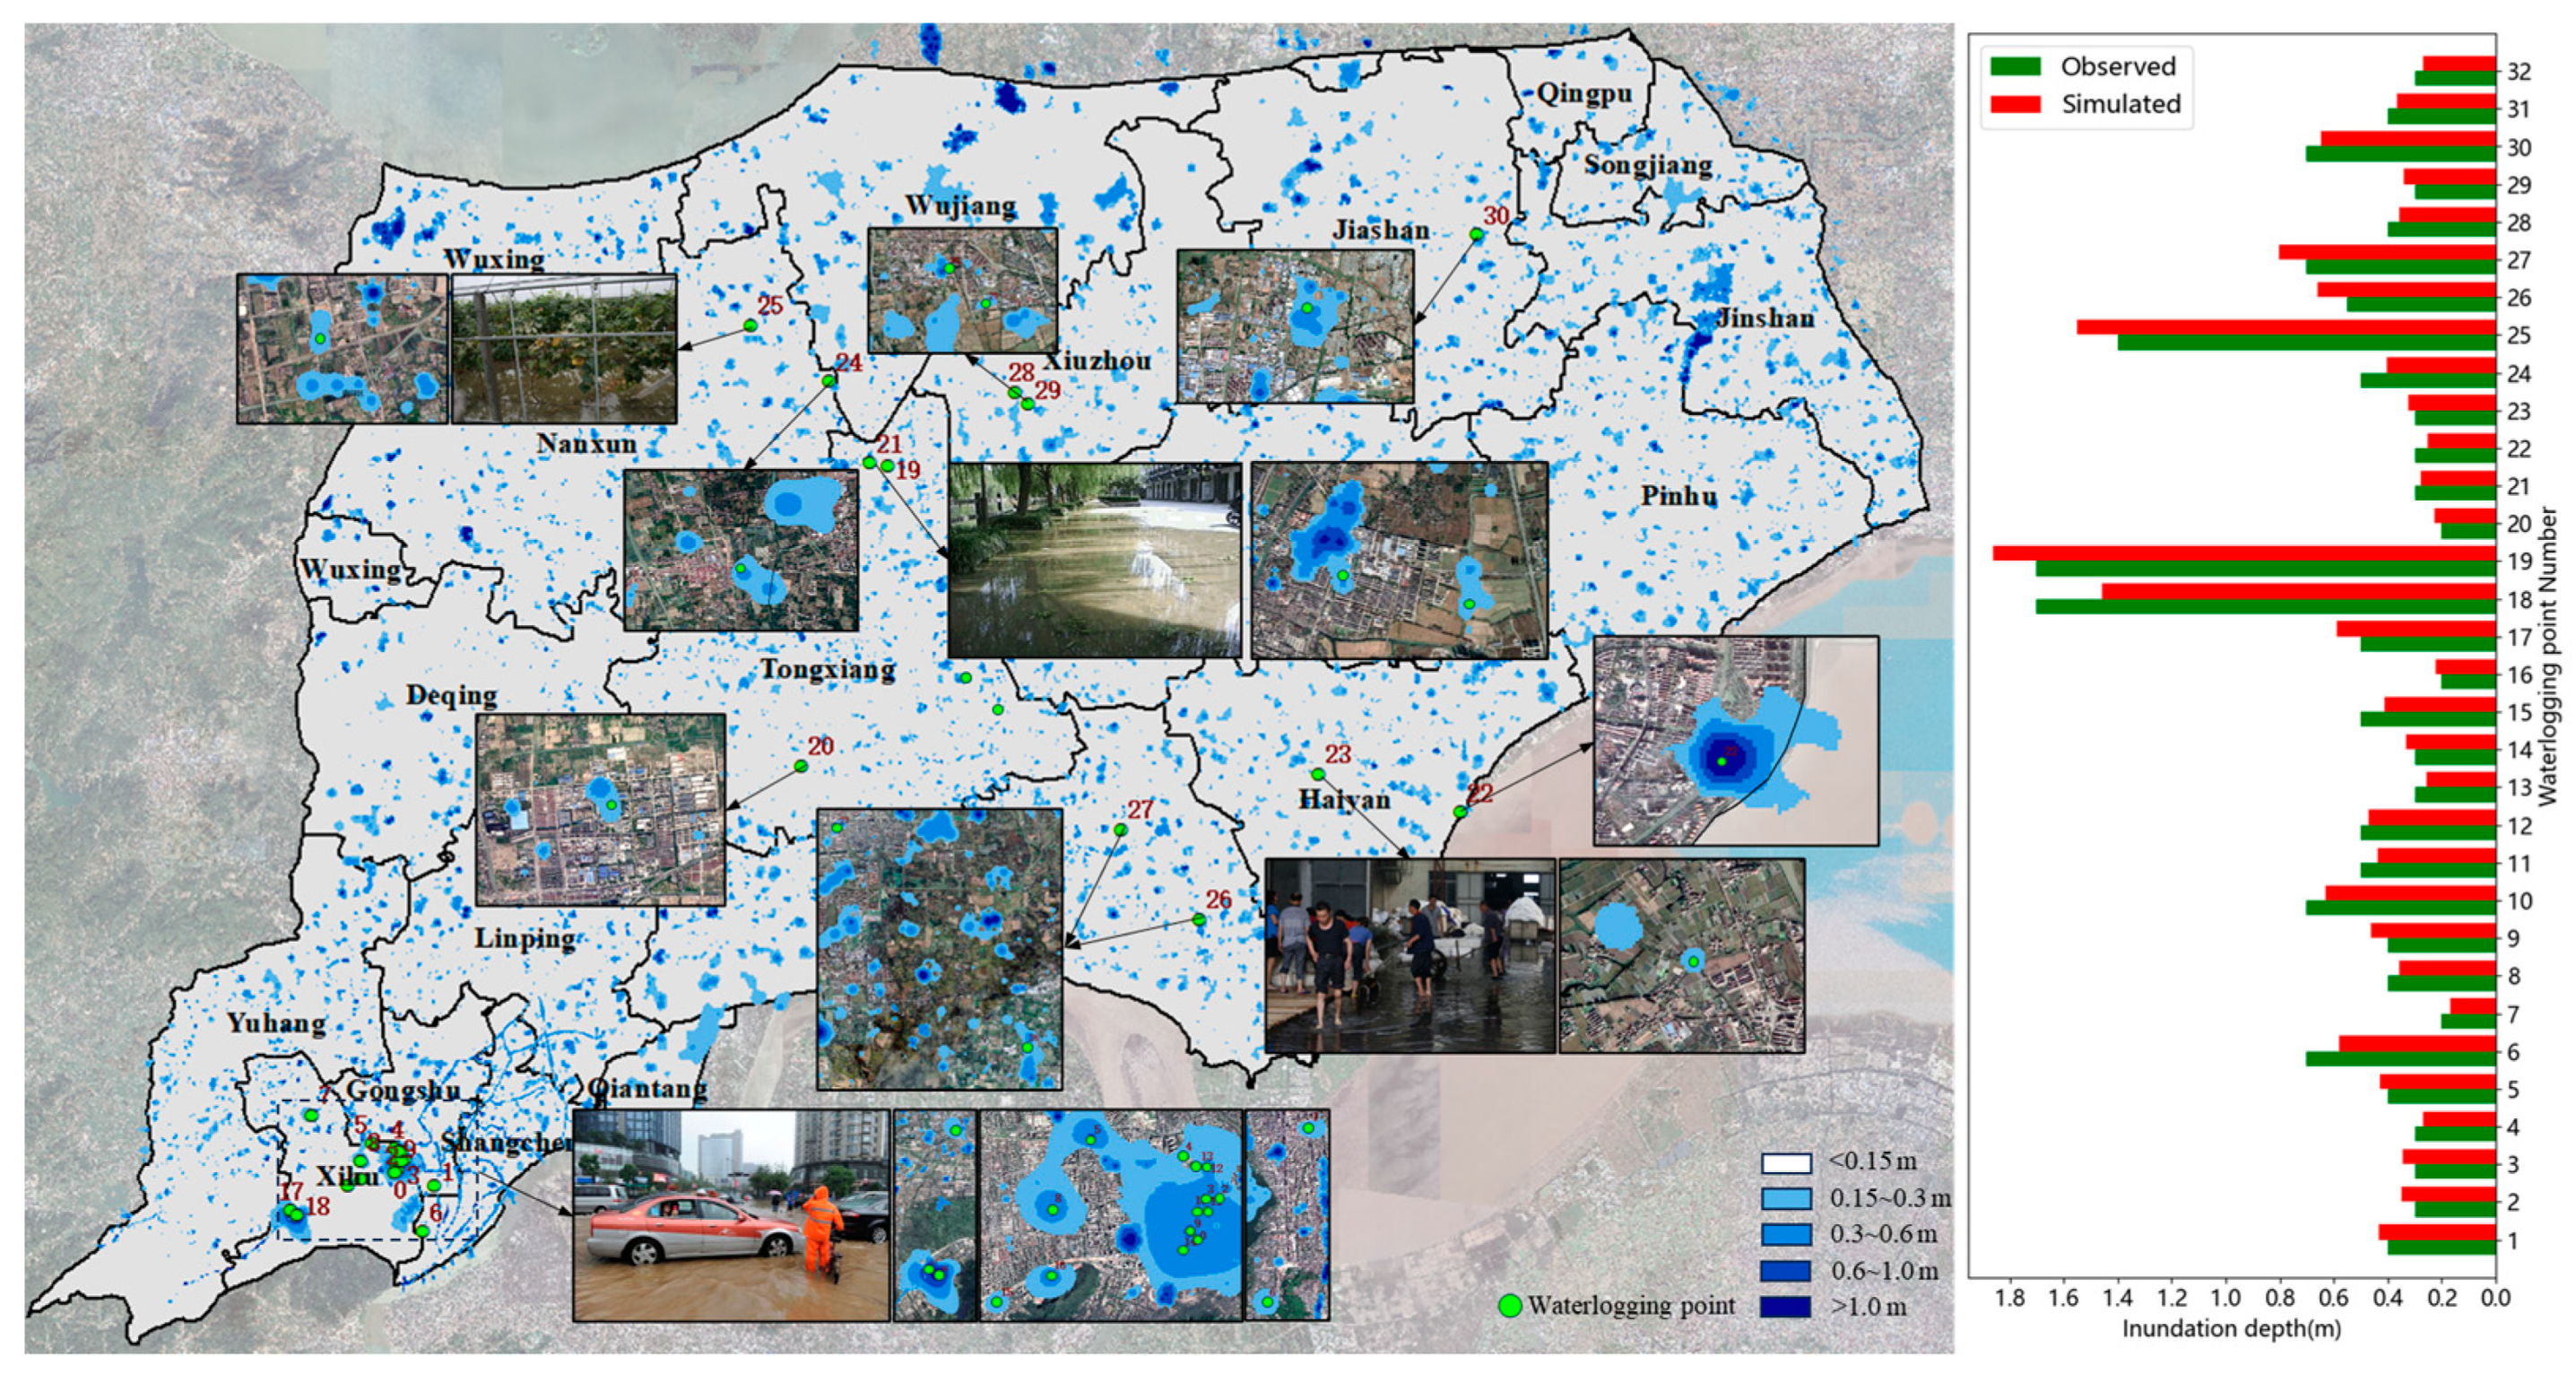
3.1.2. Model Calibration and Verification
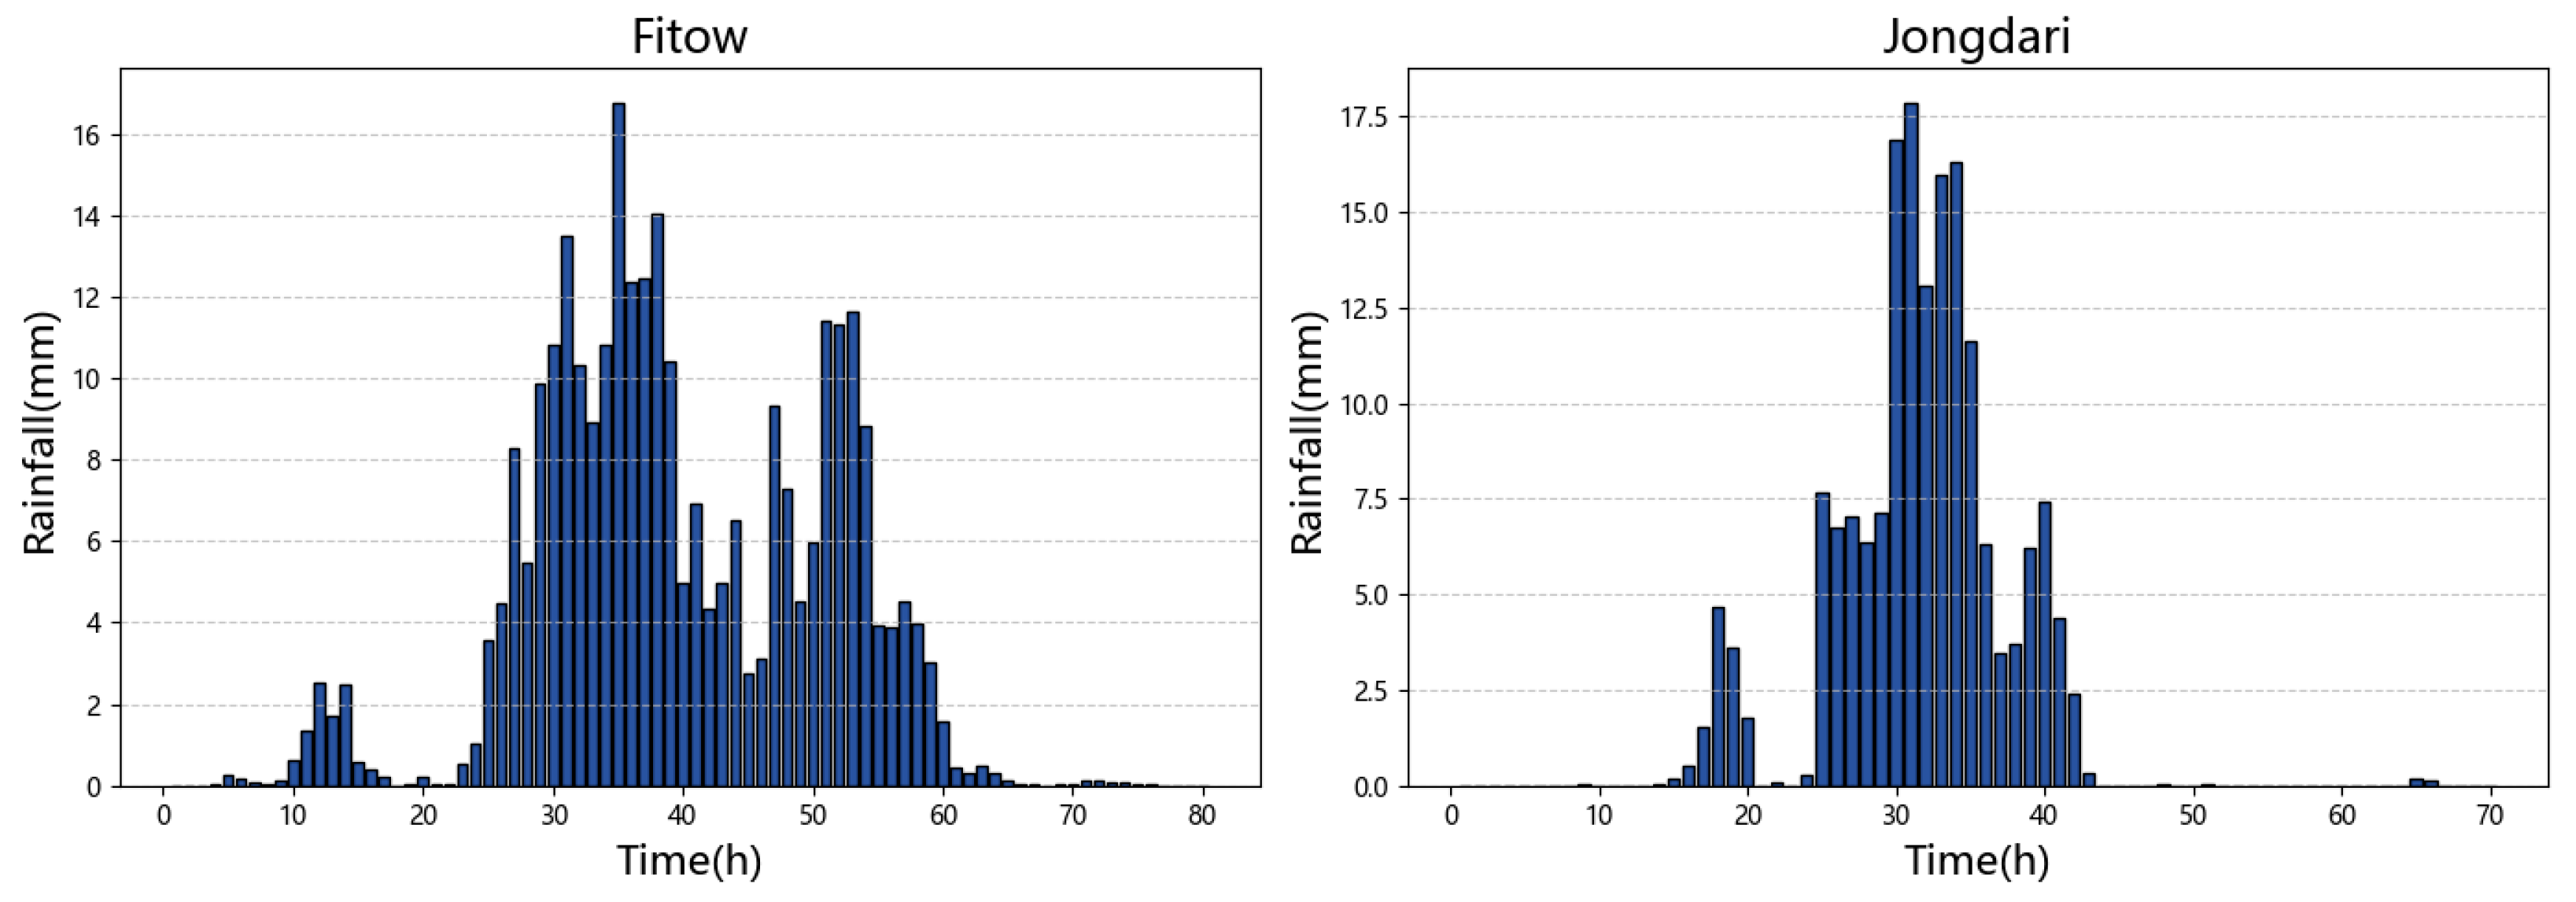
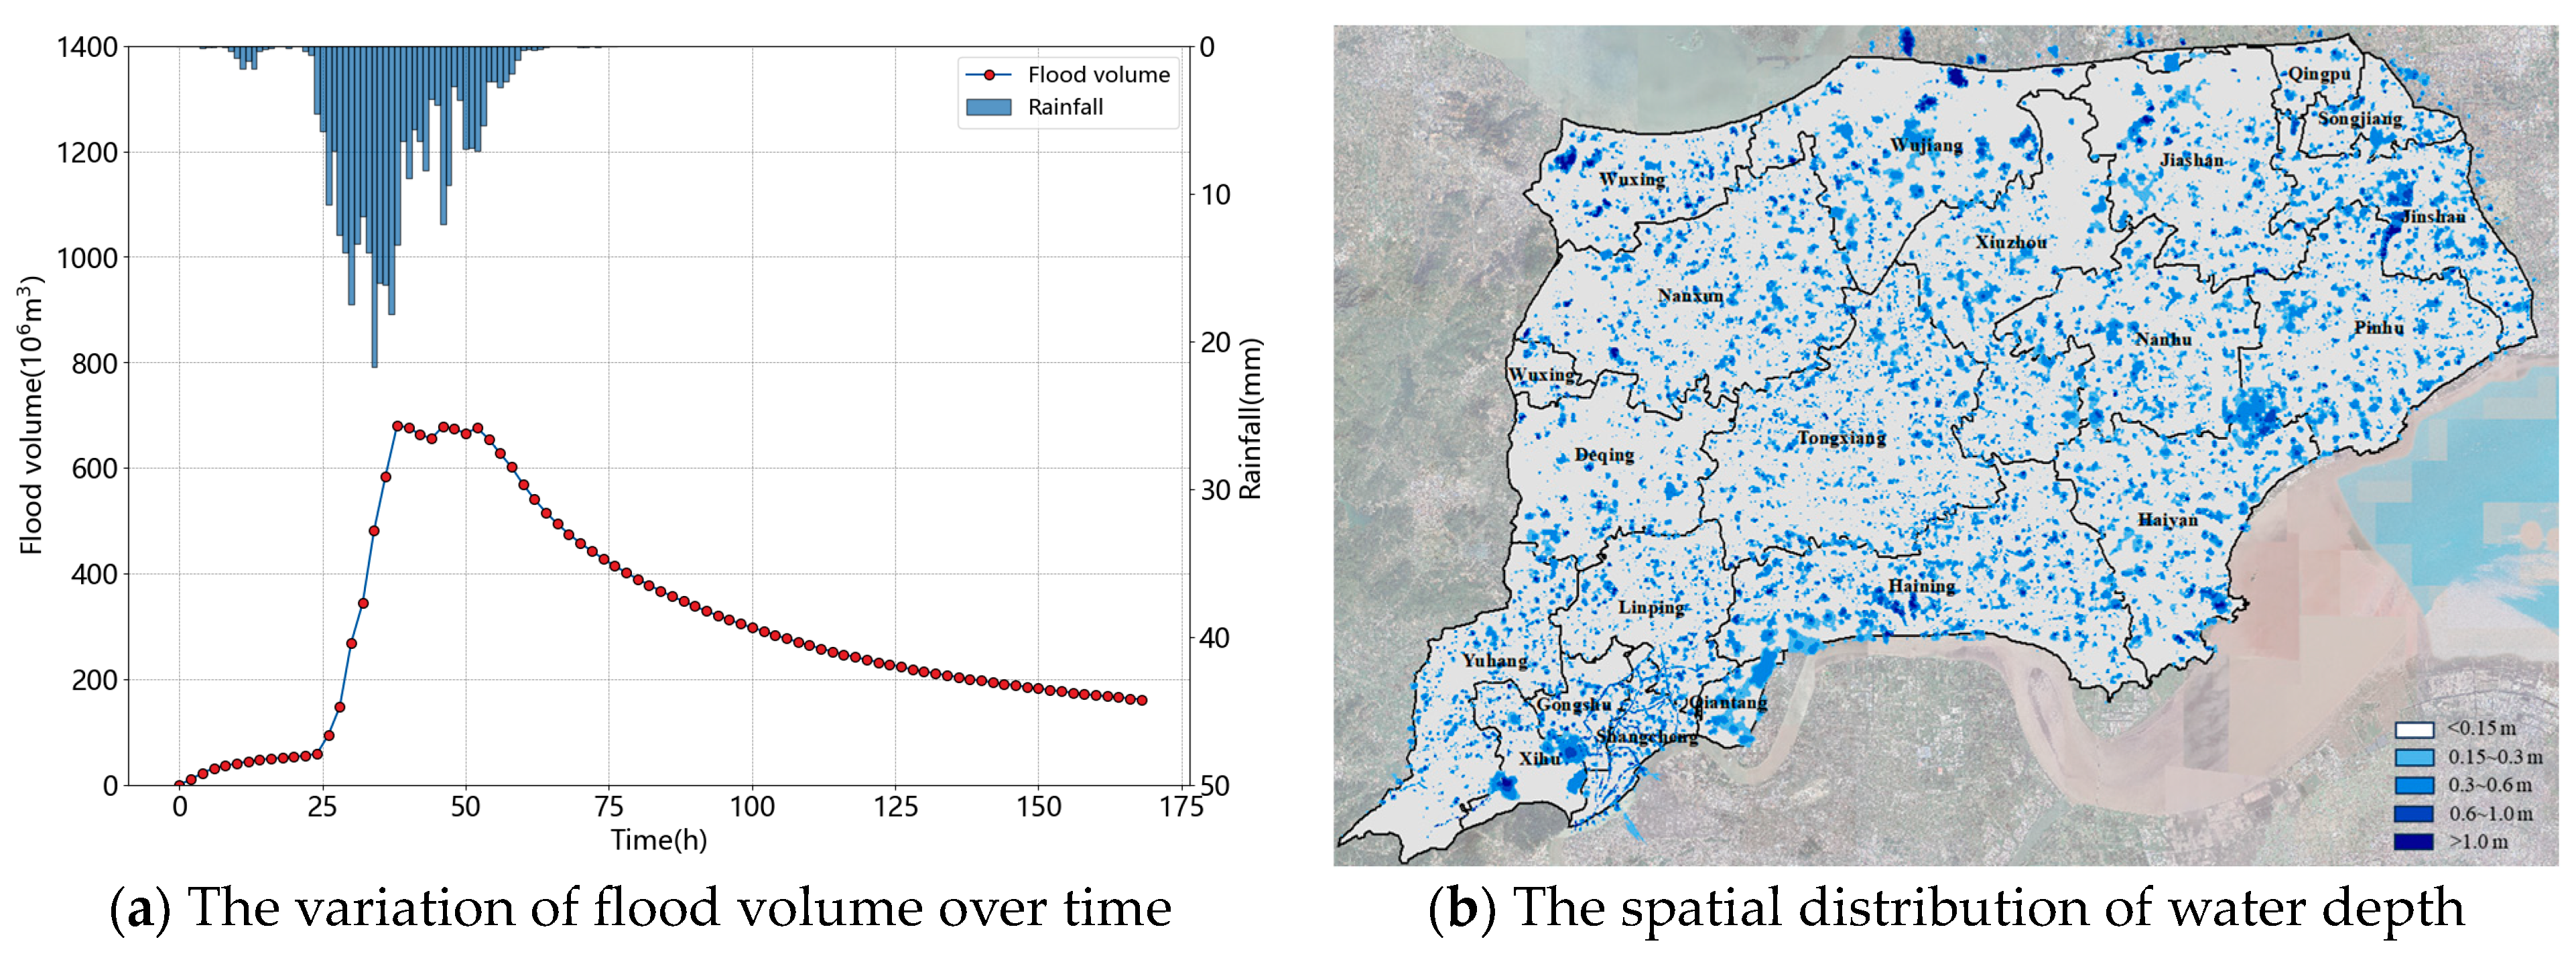
3.1.3. Flood Disaster Simulation Based on the Typhoon Fitow Rain Pattern Under a 100-Year Return Period
3.2. Flood Resilience Assessment Results
3.2.1. Dynamic Variation Curve of Flood Resilience over Time
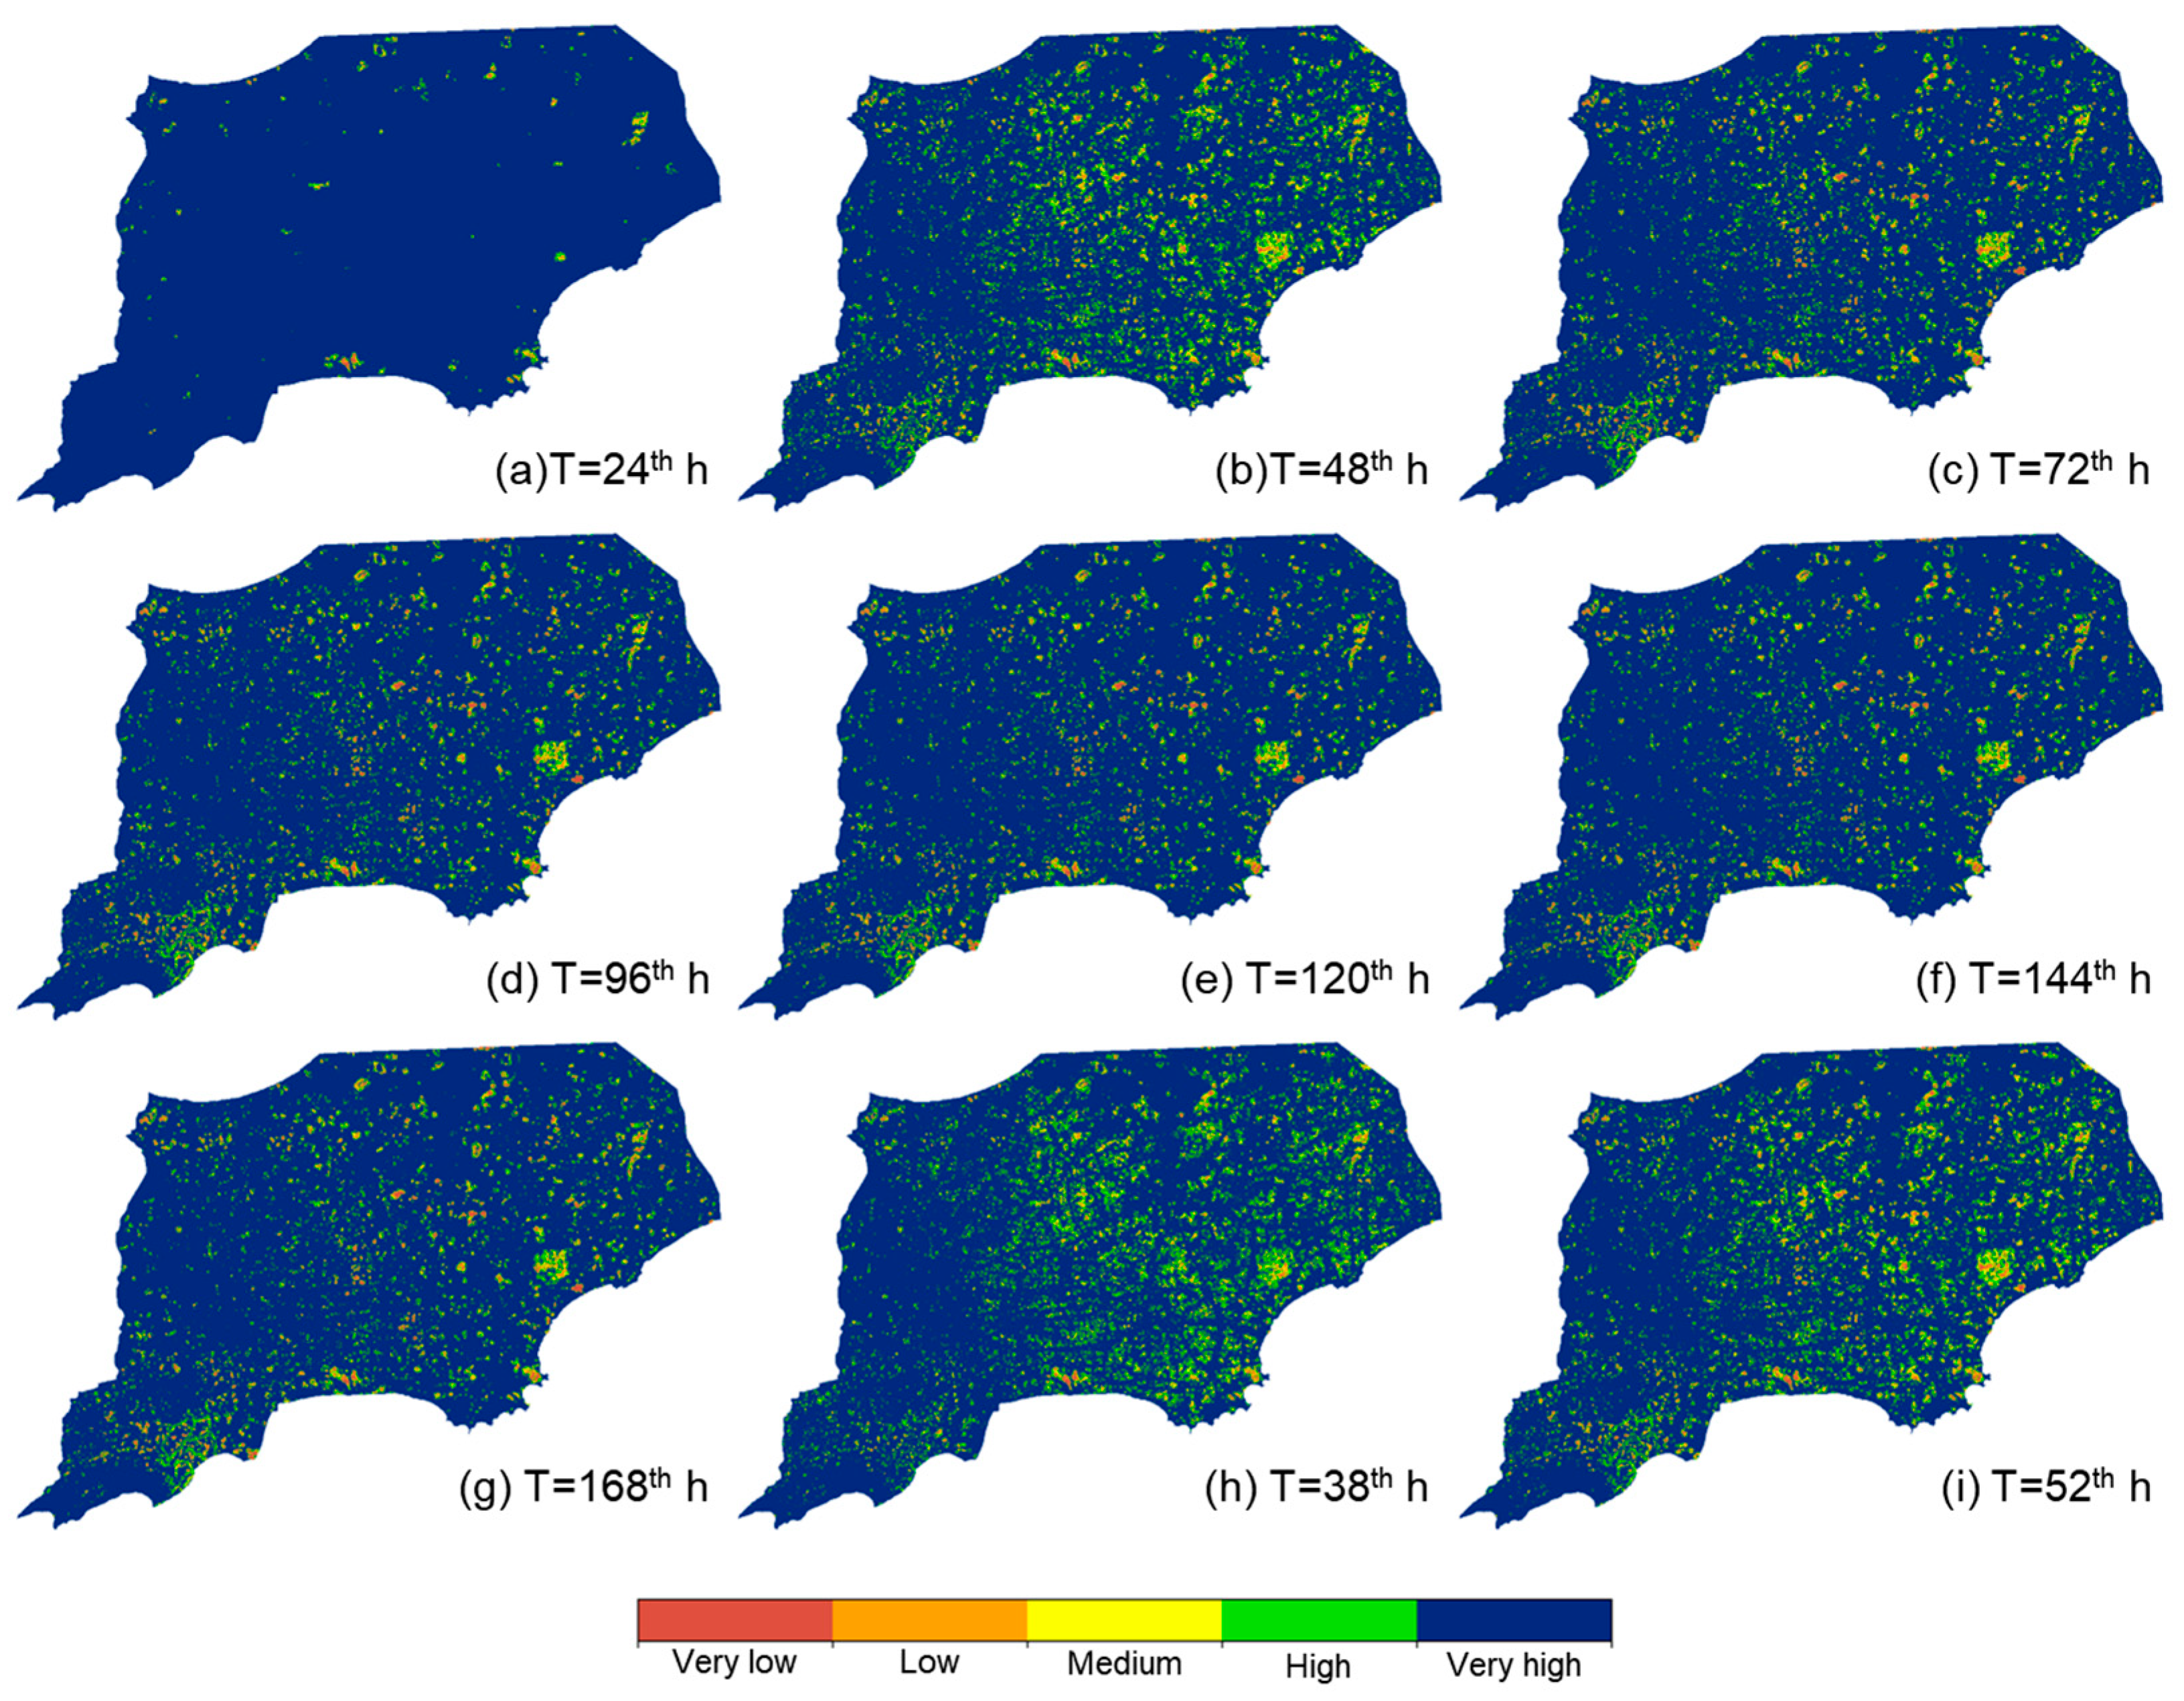
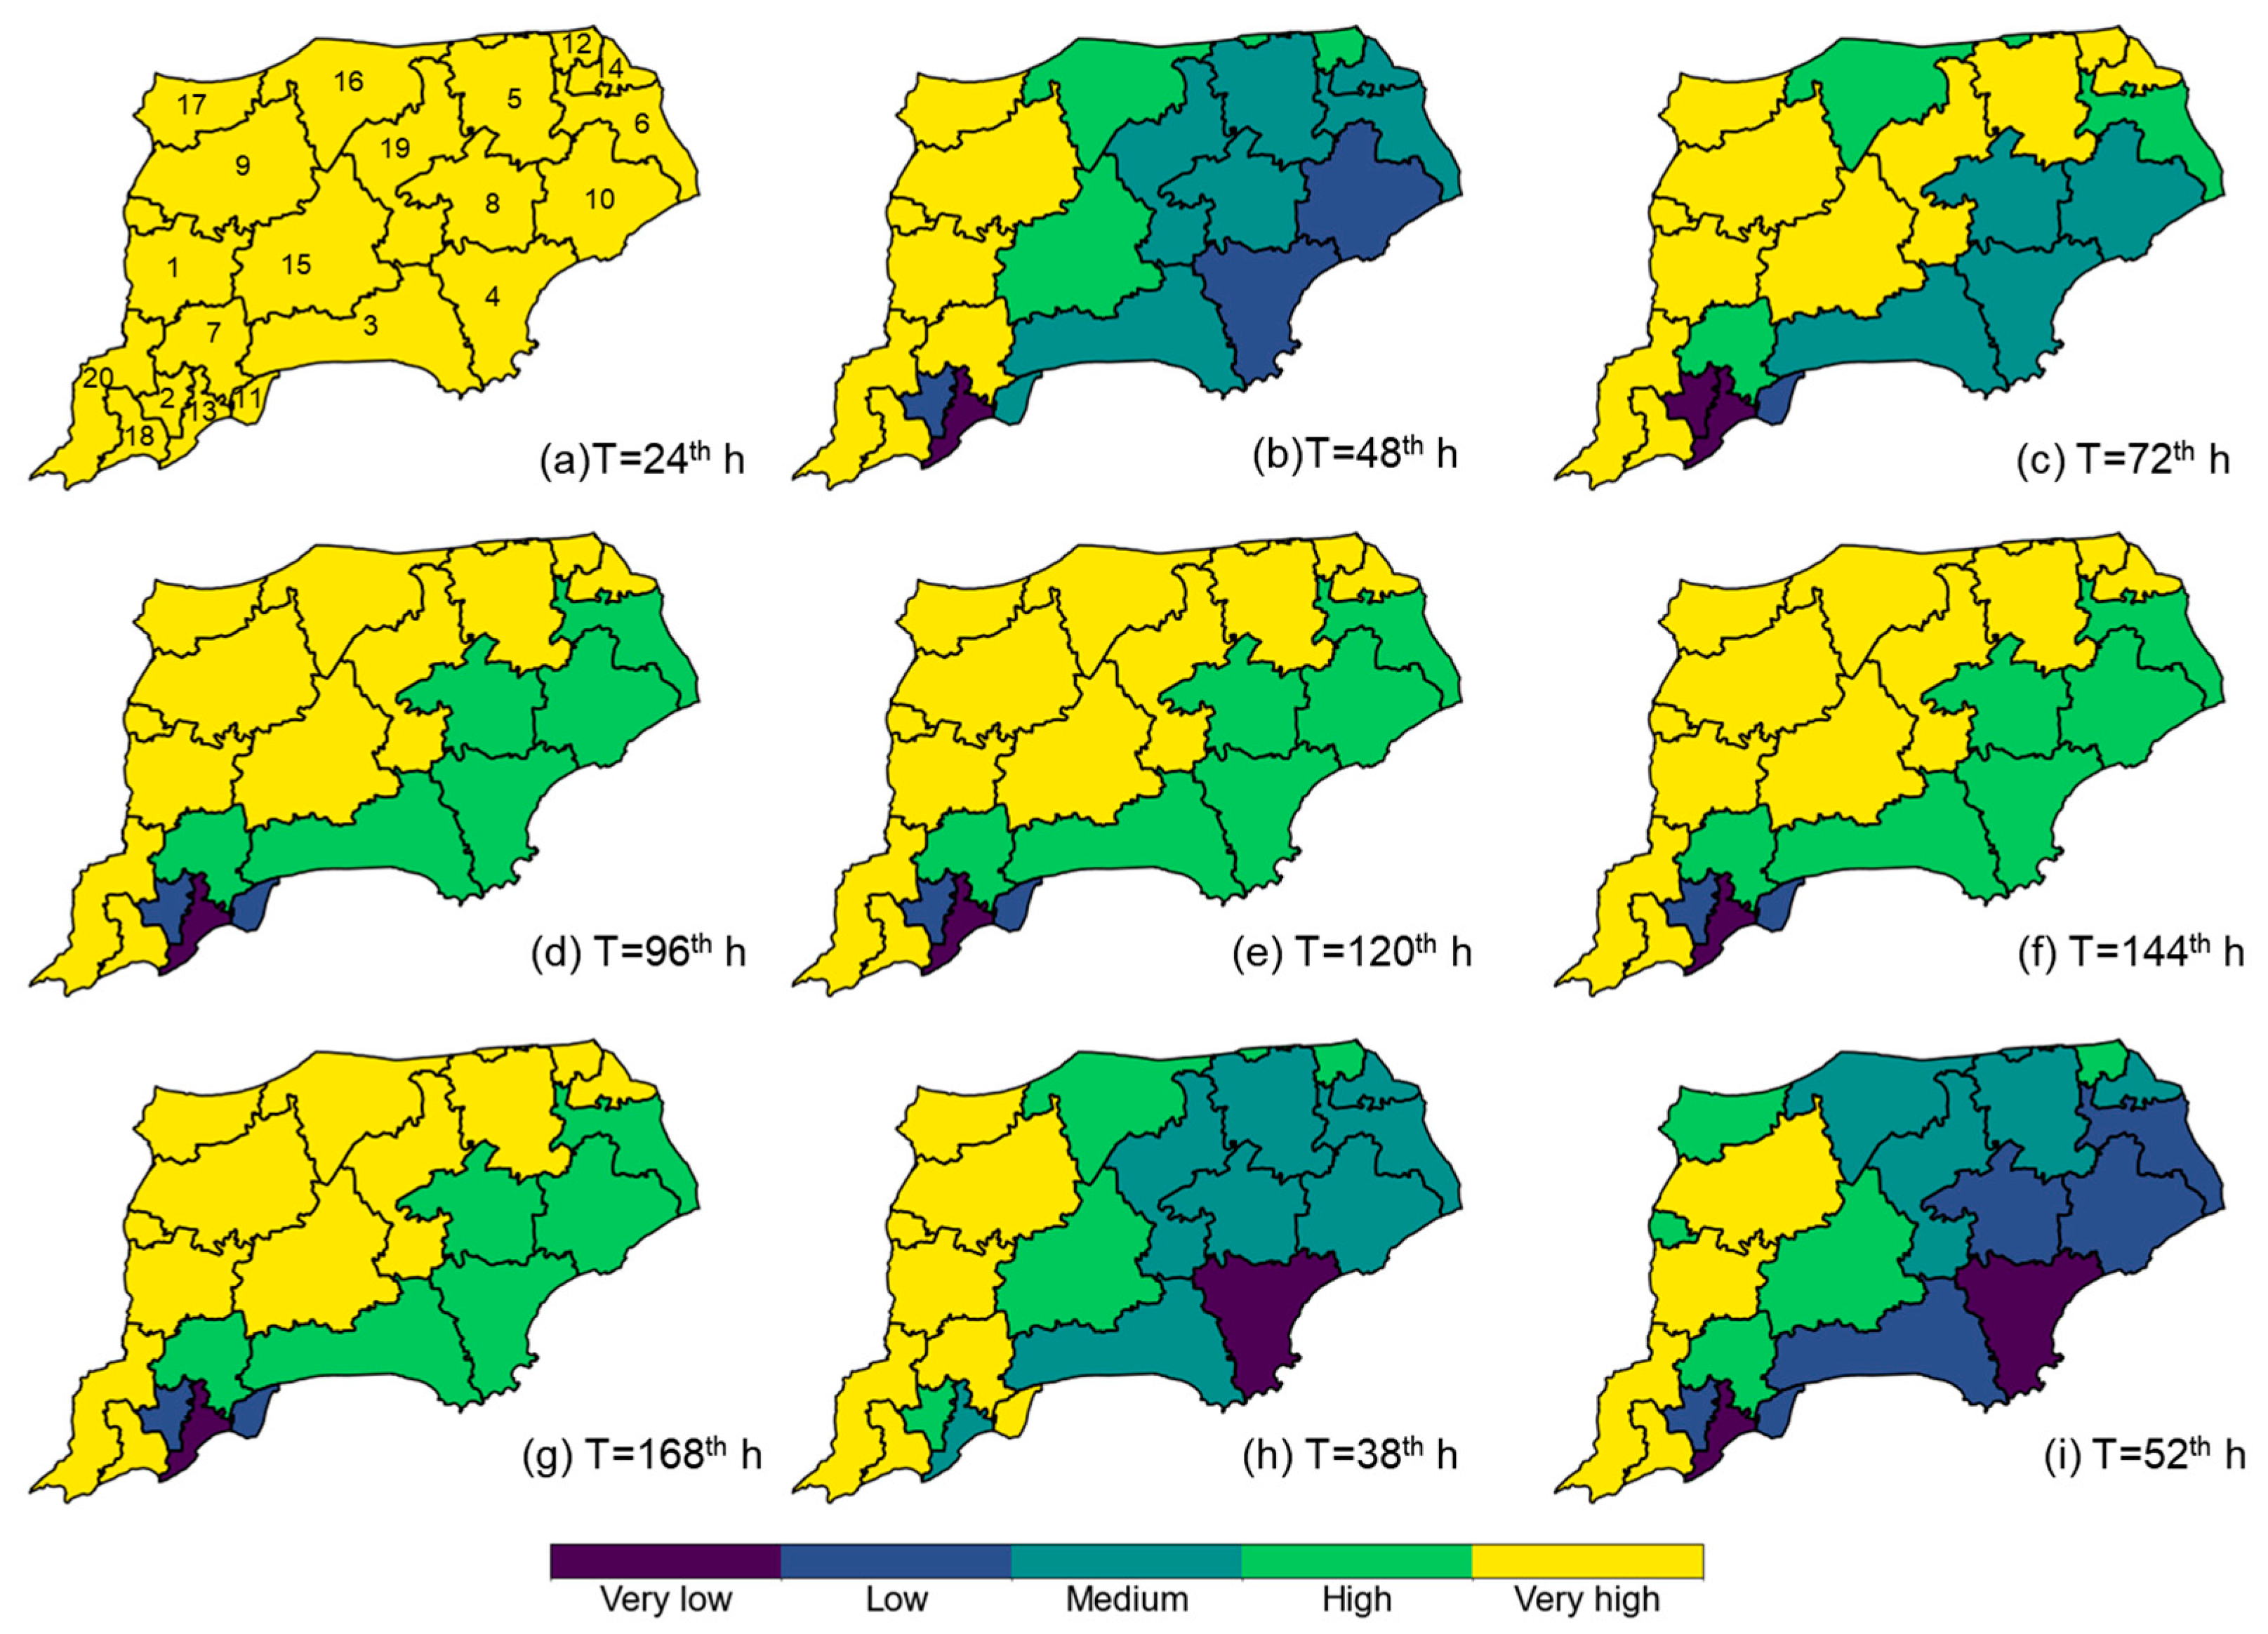
3.2.2. Spatial Distribution of Watershed Flood Resilience Considering the Dynamic Process of Floods
4. Discussion
4.1. The Impact of Inundation Depth and Inundation Time on the Evolution Trend of Flood Resilience
4.2. Identification of the Main Factors Influencing Flood Resilience
4.3. Analysis of the Reasons for Differences in Inundation Depth and Duration Thresholds Among Four Land Use Types
4.4. The Potential Impact on Practical Flood Resilience Enhancement Measures
4.5. Limitations and Improvements
5. Conclusions
Author Contributions
Funding
Institutional Review Board Statement
Informed Consent Statement
Data Availability Statement
Acknowledgments
Conflicts of Interest
References
- Rentschler, J.; Avner, P.; Marconcini, M.; Su, R.; Strano, E.; Vousdoukas, M.; Hallegatte, S. Global evidence of rapid urban growth in flood zones since 1985. Nature 2023, 622, 87–92. [Google Scholar] [CrossRef]
- Alipour, A.; Ahmadalipour, A.; Moradkhani, H. Assessing flash flood hazard and damages in the southeast United States. J. Flood Risk Manag. 2020, 13, e12605. [Google Scholar] [CrossRef]
- Ionita, M.; Nagavciuc, V. Extreme floods in the eastern part of Europe: Large-scale drivers and associated impacts. Water 2021, 13, 1122. [Google Scholar] [CrossRef]
- Zhu, S.; Li, D.; Feng, H.; Zhang, N. The influencing factors and mechanisms for urban flood resilience in China: From the perspective of social-economic-natural complex ecosystem. Ecol. Indic. 2023, 147, 109959. [Google Scholar] [CrossRef]
- Nakmuenwai, P.; Yamazaki, F.; Liu, W. Automated extraction of inundated areas from multi-temporal dual-polarization RADARSAT-2 images of the 2011 central Thailand flood. Remote Sens. 2017, 9, 78. [Google Scholar] [CrossRef]
- Chan FK, S.; Yang, L.E.; Mitchell, G.; Guan, M.; Lu, X.; Wang, Z.; Montz, O.; Adekola, O. Comparison of sustainable flood risk management by four countries–the United Kingdom, the Netherlands, the United States, and Japan–and the implications for Asian coastal megacities. Nat. Hazards Earth Syst. Sci. 2022, 22, 2567–2588. [Google Scholar] [CrossRef]
- Jiao, Z.; Zhang, Z.; Wu, L. SAR-based dynamic information retrieving of the Beijing-Tianjin-Hebei flood-inundation happened in July 2023, North China. Geomat. Nat. Hazards Risk 2024, 15, 2366361. [Google Scholar] [CrossRef]
- Oduoye, M.O.; Karim, K.A.; Kareem, M.O.; Shehu, A.; Oyeleke, U.A.; Zafar, H.; Muhsin Umar, M.; Raja, H.A.; Adegoke, A.A. Flooding in Libya amid an economic crisis: What went wrong? IJS Glob. Health 2024, 7, e0401. [Google Scholar] [CrossRef]
- Sun, R.; Shi, S.; Reheman, Y.; Li, S. Measurement of urban flood resilience using a quantitative model based on the correlation of vulnerability and resilience. Int. J. Disaster Risk Reduct. 2022, 82, 103344. [Google Scholar] [CrossRef]
- Alexander, D.E. Resilience and disaster risk reduction: An etymological journey. Nat. Hazards Earth Syst. Sci. 2013, 13, 2707–2716. [Google Scholar] [CrossRef]
- McClymont, K.; Morrison, D.; Beevers, L.; Carmen, E. Flood resilience: A systematic review. J. Environ. Plan. Manag. 2020, 63, 1151–1176. [Google Scholar] [CrossRef]
- Koliou, M.; van de Lindt, J.W.; McAllister, T.P.; Ellingwood, B.R.; Dillard, M.; Cutler, H. State of the research in community resilience: Progress and challenges. Sustain. Resilient Infrastruct. 2020, 5, 131–151. [Google Scholar] [CrossRef]
- Rezende, O.M.; de Oliveira AK, B.; Jacob AC, P.; Miguez, M.G. A framework to introduce urban flood resilience into the design of flood control alternatives. J. Hydrol. 2019, 576, 478–493. [Google Scholar] [CrossRef]
- Argyroudis, S.A.; Mitoulis, S.A.; Hofer, L.; Zanini, M.A.; Tubaldi, E.; Frangopol, D.M. Resilience assessment framework for critical infrastructure in a multi-hazard environment: Case study on transport assets. Sci. Total Environ. 2020, 714, 136854. [Google Scholar] [CrossRef] [PubMed]
- Zheng, J.; Li, J.; Zeng, J.; Huang, G.; Chen, W. Application of a time-dependent performance-based resilience metric to establish the potential of coupled grey-green infrastructure in urban flood management. Sustain. Cities Soc. 2024, 112, 105608. [Google Scholar] [CrossRef]
- Tayyab, M.; Zhang, J.; Hussain, M.; Ullah, S.; Liu, X.; Khan, S.N.; Baig, M.A.; Hassan, W.; Al-Shaibah, B. Gis-based urban flood resilience assessment using urban flood resilience model: A case study of peshawar city, khyber pakhtunkhwa, pakistan. Remote Sens. 2021, 13, 1864. [Google Scholar] [CrossRef]
- Fu, X.; Liu, Y.; Xie, Z.; Jiang, F.; Xu, J.; Yang, Z.; Deng, Z.; Wang, Q.; Liao, M.; Wu, X.; et al. A coupled PSR-based framework for holistic modeling and flood resilience assessment: A case study of the 2022 flood events in five southern provinces of China. J. Hydrol. 2024, 636, 131255. [Google Scholar] [CrossRef]
- Zhu, S.; Li, D.; Huang, G.; Chhipi-Shrestha, G.; Nahiduzzaman, K.M.; Hewage, K.; Sadiq, R. Enhancing urban flood resilience: A holistic framework incorporating historic worst flood to Yangtze River Delta, China. Int. J. Disaster Risk Reduct. 2021, 61, 102355. [Google Scholar] [CrossRef]
- Chen, J.; Chen, W.; Huang, G. Assessing urban pluvial flood resilience based on a novel grid-based quantification method that considers human risk perceptions. J. Hydrol. 2021, 601, 126601. [Google Scholar] [CrossRef]
- Wang, Y.; Meng, F.; Liu, H.; Zhang, C.; Fu, G. Assessing catchment scale flood resilience of urban areas using a grid cell based metric. Water Res. 2019, 163, 114852. [Google Scholar] [CrossRef]
- Zhang, Y.; Yue, W.; Su, M.; Teng, Y.; Huang, Q.; Lu, W.; Rong, Q.; Xu, C. Assessment of urban flood resilience based on a systematic framework. Ecol. Indic. 2023, 150, 110230. [Google Scholar] [CrossRef]
- Ferreira, D.M.; Fernandes CV, S.; Kaviski, E.; Bleninger, T. Calibration of river hydrodynamic models: Analysis from the dynamic component in roughness coefficients. J. Hydrol. 2021, 598, 126136. [Google Scholar] [CrossRef]
- Yang, Q.; Huang, H.; Wang, C.; Lei, X.; Feng, T.; Zuo, X. Improving the Accuracy of Urban Waterlogging Simulation: A Novel Computer Vision-Based Digital Elevation Model Refinement Approach for Roads and Densely Built-Up Areas. Remote Sens. 2023, 15, 4915. [Google Scholar] [CrossRef]
- Ganin, A.A.; Massaro, E.; Gutfraind, A.; Steen, N.; Keisler, J.M.; Kott, A.; Mangoubi, R. Igor Linkov Operational resilience: Concepts, design and analysis. Sci. Rep. 2016, 6, 1–12. [Google Scholar] [CrossRef] [PubMed]
- Mugume, S.N.; Gomez, D.E.; Fu, G.; Farmani, R.; Butler, D. A global analysis approach for investigating structural resilience in urban drainage systems. Water Res. 2015, 81, 15–26. [Google Scholar] [CrossRef] [PubMed]
- Zheng, J.; Huang, G. A novel grid cell–based urban flood resilience metric considering water velocity and duration of system performance being impacted. J. Hydrol. 2023, 617, 128911. [Google Scholar] [CrossRef]
- Zhao, G.; Xu, Z.; Pang, B.; Tu, T.; Xu, L.; Du, L. An enhanced inundation method for urban flood hazard mapping at the large catchment scale. J. Hydrol. 2019, 571, 873–882. [Google Scholar] [CrossRef]
- Li, C.; Cheng, X.; Li, N.; Du, X.; Yu, Q.; Kan, G. A framework for flood risk analysis and benefit assessment of flood control measures in urban areas. Int. J. Environ. Res. Public Health 2016, 13, 787. [Google Scholar] [CrossRef]
- GB 50014—2021; Standard for Design of Outdoor Wastewater Engineering. China Planning Press: Beijing, China, 2021. (In Chinese)
- SL723—2016; Standard for Waterlogging Control. China Water Resources and Hydropower Press: Beijing, China, 2016. (In Chinese)
- SL/T 4—2020; Technical Code for Farmland Drainage Projects. China Water Resources and Hydropower Press: Beijing, China, 2020. (In Chinese)
- Begum, M.; Juraimi, A.S.; Amartalingam, R.; Bin Man, A.; Bin Syed Rastans, S.O. The effects of sowing depth and flooding on the emergence, survival, and growth of Fimbristylis miliacea (L.) Vahl. Weed Biol. Manag. 2006, 6, 157–164. [Google Scholar] [CrossRef]
- Nie, G.P.; Chen, M.M.; Yang, L.Y.; Cai, Y.; Xu, F.; Zhang, Y. Plant response to waterlogging stress: Research progress. Chin. Agric. Sci. Bull. 2021, 37, 57–64. (In Chinese) [Google Scholar]
- Chen, S.K.; Liu, C.W. Analysis of water movement in paddy rice fields (I) experimental studies. J. Hydrol. 2002, 260, 206–215. [Google Scholar] [CrossRef]
- Mo, B.; Chen, X.Y.; Yang, Y.C.; Luo, B.L.; Tang, J.; Gong, C.M.; Lin, Z.X.; Zhou, S.J.; Shen, Y.K. Research on soil infiltration capacity and its influencing factors in different land uses. Res. Soil Water Conserv. 2016, 23, 13–17. (In Chinese) [Google Scholar]
- Berhanu, B.; Melesse, A.M.; Seleshi, Y. GIS-based hydrological zones and soil geo-database of Ethiopia. Catena 2013, 104, 21–31. [Google Scholar] [CrossRef]
- Wang, Y.; Zhang, C.; Chen, A.S.; Wang, G.; Fu, G. Exploring the relationship between urban flood risk and resilience at a high-resolution grid cell scale. Sci. Total Environ. 2023, 893, 164852. [Google Scholar] [CrossRef] [PubMed]
- Najibi, N.; Devineni, N. Recent trends in the frequency and duration of global floods. Earth Syst. Dyn. 2018, 9, 757–783. [Google Scholar] [CrossRef]
- Hammond, M.J.; Chen, A.S.; Djordjević, S.; Butler, D.; Mark, O. Urban flood impact assessment: A state-of-the-art review. Urban Water J. 2015, 12, 14–29. [Google Scholar] [CrossRef]
- Zhang, Y.; Li, Z.; Ge, W.; Wang, J.; Guo, X.; Wang, T.; Li, W. Assessment of the impact of floods on terrestrial plant biodiversity. J. Clean. Prod. 2022, 339, 130722. [Google Scholar] [CrossRef]
- Prashar, N.; Lakra, H.S.; Shaw, R.; Kaur, H. Urban Flood Resilience: A comprehensive review of assessment methods, tools, and techniques to manage disaster. Prog. Disaster Sci. 2023, 20, 100299. [Google Scholar] [CrossRef]
- Chen, J.; Huang, G.; Chen, W. Towards better flood risk management: Assessing flood risk and investigating the potential mechanism based on machine learning models. J. Environ. Manag. 2021, 293, 112810. [Google Scholar] [CrossRef]
- Bertilsson, L.; Wiklund, K.; de Moura Tebaldi, I.; Rezende, O.M.; Veról, A.P.; Miguez, M.G. Urban flood resilience–A multi-criteria index to integrate flood resilience into urban planning. J. Hydrol. 2019, 573, 970–982. [Google Scholar] [CrossRef]
- Sidek, L.M.; Jaafar, A.S.; Majid, W.H.A.W.A.; Basri, H.; Marufuzzaman, M.; Fared, M.M.; Moon, W.C. High-resolution hydrological-hydraulic modeling of urban floods using InfoWorks ICM. Sustainability 2021, 13, 10259. [Google Scholar] [CrossRef]
- Rahman, M.C.; Islam, M.A.; Rahaman, M.S.; Sarkar, M.A.R.; Ahmed, R.; Kabir, M.S. Identifying the threshold level of flooding for rice production in Bangladesh: An Empirical Analysis. J. Bangladesh Agric. Univ. 2021, 19, 243–250. [Google Scholar] [CrossRef]
- Cocks, P.S. Ecology of herbaceous perennial legumes: A review of characteristics that may provide management options for the control of salinity and waterlogging in dryland cropping systems. Aust. J. Agric. Res. 2001, 52, 137–151. [Google Scholar] [CrossRef]
- Vreugdenhil, S.J.; Kramer, K.; Pelsma, T. Effects of flooding duration,-frequency and-depth on the presence of saplings of six woody species in north-west Europe. For. Ecol. Manag. 2006, 236, 47–55. [Google Scholar] [CrossRef]
- Grimoldi, A.A.; Insausti, P.; Vasellati, V.; Striker, G.G. Constitutive and plastic root traits and their role in differential tolerance to soil flooding among coexisting species of a lowland grassland. Int. J. Plant Sci. 2005, 166, 805–813. [Google Scholar] [CrossRef]
- Wu, L.; Tong, J.; Wang, Z.; Li, J.; Li, M.; Li, H.; Feng, Y. Post-flood disaster damaged houses classification based on dual-view image fusion and Concentration-Based Attention Module. Sustain. Cities Soc. 2024, 103, 105234. [Google Scholar] [CrossRef]
- Wu, L.; Liu, Y.; Zhang, J.; Zhang, B.; Wang, Z.; Tong, J.; Li, M.; Zhang, A. Identification of flood depth levels in urban waterlogging disaster caused by rainstorm using a CBAM-improved ResNet50. Expert Syst. Appl. 2024, 6, 124382. [Google Scholar] [CrossRef]
- Murdock, H.J.; De Bruijn, K.M.; Gersonius, B. Assessment of critical infrastructure resilience to flooding using a response curve approach. Sustainability 2018, 10, 3470. [Google Scholar] [CrossRef]
- Wu, X.; Zhu, H.; Hu, L.; Meng, J.; Sun, F. Analysis of Short-Term Heavy Rainfall-Based Urban Flood Disaster Risk Assessment Using Integrated Learning Approach. Sustainability 2024, 16, 8249. [Google Scholar] [CrossRef]
- Yang, F.; Xiong, S.; Ou, J.; Zhao, Z.; Lei, T. Human settlement resilience zoning and optimizing strategies for river-network cities under flood risk management objectives: Taking Yueyang City as an example. Sustainability 2022, 14, 9595. [Google Scholar] [CrossRef]
- Xia, J.; Chen, J. A new era of flood control strategies from the perspective of managing the 2020 Yangtze River flood. Sci. China Earth Sci. 2021, 64, 1–9. [Google Scholar] [CrossRef]
- Deng, P.; Zhang, M.; Hu, Q.; Wang, L.; Bing, J. Pattern of spatio-temporal variability of extreme precipitation and flood-waterlogging process in Hanjiang River basin. Atmos. Res. 2022, 276, 106258. [Google Scholar] [CrossRef]


| Types | Accuracy | Sources |
|---|---|---|
| DEM | 30 m × 30 m | Geospatial Data Cloud https://www.gscloud.cn/ (accessed on 4 April 2024) |
| Land use | 30 m × 30 m | Resource and Environmental Science Data Platform https://www.resdc.cn/ (accessed on 15 April 2024) |
| Rainfall | 1 h | The China Meteorological Data Service Center http://data.cma.cn/ (accessed on 18 June 2020) |
| River | — | OpenStreetMap https://download.geofabrik.de/ (accessed on 20 April 2024) |
| Water level/tide level data | 5 min | Taihu Basin Authority of Ministry of Water Resources |
| River section data | 0.01 m | |
| Hydraulic engineering data | — |
| Spatial Scale | Model Name | Model Type | Model Function |
|---|---|---|---|
| Watershed | Taihu basin Model | Hydrologic and hydrodynamic coupling model | Provide inundation level/flow boundary for study area |
| Regional | Hangjiahu regional model | 1D- and 2D hydrodynamic coupling model |
|
| Land Use Type | Inundation Depth (cm) | Inundation Time (h) | ||
|---|---|---|---|---|
| Hmax | Hmin | Tmax | Tmin | |
| Urban land | 15 | 50 | 1 | 24 |
| Paddy fields | 30 | 60 | 48 | 144 |
| Dryland | 5 | 10 | 48 | 96 |
| Grassland | 2 | 6 | 144 | 432 |
| Forestland | 10 | 30 | 240 | 960 |
| Land Use Type | Stable Infiltration Rates (mm/h) | Manning Coefficient | Land Use Type | Stable Infiltration Rates (mm/h) | Manning Coefficient |
|---|---|---|---|---|---|
| Paddy field | 0.6 | 0.035 | Waters | 1.3 | 0.027 |
| Dryland | 6.6 | 0.040 | Urban | 4.8 (20 year) 1 | 0.016 |
| Forestland | 18 | 0.100 | Rural | 4.2 (40 year) 1 | 0.020 |
| Grassland | 13.8 | 0.080 | Bare land | 8 | 0.025 |
| Time | The Area Proportion of Different Resilience Levels (%) | ||||
|---|---|---|---|---|---|
| Very Low | Low | Medium | High | Very High | |
| T = 24th h | 0.40 | 0.09 | 0.09 | 0.10 | 99.32 |
| T = 48th h | 4.11 | 1.58 | 1.75 | 1.57 | 90.99 |
| T = 72th h | 4.45 | 0.62 | 0.64 | 0.93 | 93.36 |
| T = 96th h | 3.77 | 0.58 | 0.64 | 0.88 | 94.13 |
| T = 120th h | 3.68 | 0.65 | 0.72 | 0.83 | 94.11 |
| T = 144th h | 3.78 | 0.64 | 0.65 | 0.81 | 94.11 |
| T = 168th h | 3.91 | 0.54 | 0.63 | 0.81 | 94.11 |
| T = 38th h 1 | 3.98 | 1.03 | 1.61 | 2.23 | 91.14 |
| T = 52th h 2 | 4.46 | 1.85 | 1.20 | 1.51 | 90.98 |
| No. | District Name | Resilience Order | The Area Proportion of Different Resilience Levels (%) | ||||
|---|---|---|---|---|---|---|---|
| Very Low | Low | Medium | High | Very High | |||
| 1 | Deqing | 1 | 0.94 | 0.63 | 0.60 | 0.79 | 97.04 |
| 2 | Gongshu | 18 | 5.90 | 4.22 | 1.11 | 0.94 | 87.83 |
| 3 | Haining | 14 | 5.67 | 2.32 | 1.44 | 1.89 | 88.69 |
| 4 | Haiyan | 19 | 7.76 | 2.30 | 1.81 | 2.30 | 85.82 |
| 5 | Jiashan | 10 | 4.91 | 1.66 | 1.23 | 1.48 | 90.72 |
| 6 | Jinshan | 13 | 5.75 | 1.84 | 1.62 | 2.06 | 88.73 |
| 7 | Linping | 6 | 3.18 | 1.98 | 1.08 | 1.34 | 92.42 |
| 8 | Nanhu | 15 | 5.41 | 2.73 | 1.67 | 1.80 | 88.39 |
| 9 | Nanxun | 3 | 2.18 | 0.94 | 0.84 | 1.18 | 94.85 |
| 10 | Pinghu | 17 | 5.89 | 2.44 | 1.42 | 1.90 | 88.35 |
| 11 | Qiantang | 16 | 4.30 | 3.83 | 2.06 | 2.46 | 87.35 |
| 12 | Qingpu | 7 | 3.94 | 1.32 | 1.05 | 1.14 | 92.55 |
| 13 | Shangcheng | 20 | 7.71 | 6.09 | 1.98 | 1.88 | 82.35 |
| 14 | Songjiang | 11 | 5.17 | 1.51 | 1.08 | 1.39 | 90.85 |
| 15 | Tongxiang | 8 | 4.24 | 1.92 | 1.07 | 1.49 | 91.28 |
| 16 | Wujiang | 9 | 4.55 | 1.47 | 1.18 | 1.46 | 91.34 |
| 17 | Wuxing | 5 | 3.60 | 1.24 | 0.94 | 1.18 | 93.03 |
| 18 | Xihu | 2 | 1.68 | 0.84 | 0.33 | 0.53 | 96.63 |
| 19 | Xiuzhou | 12 | 5.13 | 1.93 | 1.26 | 1.49 | 90.20 |
| 20 | Yuhang | 4 | 2.38 | 1.30 | 0.80 | 1.03 | 94.48 |
Disclaimer/Publisher’s Note: The statements, opinions and data contained in all publications are solely those of the individual author(s) and contributor(s) and not of MDPI and/or the editor(s). MDPI and/or the editor(s) disclaim responsibility for any injury to people or property resulting from any ideas, methods, instructions or products referred to in the content. |
© 2024 by the authors. Licensee MDPI, Basel, Switzerland. This article is an open access article distributed under the terms and conditions of the Creative Commons Attribution (CC BY) license (https://creativecommons.org/licenses/by/4.0/).
Share and Cite
Su, X.; Wang, L.; Li, L.; Li, X.; Wang, Y.; Liu, Y.; Hu, Q. Assessing Watershed Flood Resilience Based on a Grid-Scale System Performance Curve That Considers Double Thresholds. Sustainability 2024, 16, 9101. https://doi.org/10.3390/su16209101
Su X, Wang L, Li L, Li X, Wang Y, Liu Y, Hu Q. Assessing Watershed Flood Resilience Based on a Grid-Scale System Performance Curve That Considers Double Thresholds. Sustainability. 2024; 16(20):9101. https://doi.org/10.3390/su16209101
Chicago/Turabian StyleSu, Xin, Leizhi Wang, Lingjie Li, Xiting Li, Yintang Wang, Yong Liu, and Qingfang Hu. 2024. "Assessing Watershed Flood Resilience Based on a Grid-Scale System Performance Curve That Considers Double Thresholds" Sustainability 16, no. 20: 9101. https://doi.org/10.3390/su16209101
APA StyleSu, X., Wang, L., Li, L., Li, X., Wang, Y., Liu, Y., & Hu, Q. (2024). Assessing Watershed Flood Resilience Based on a Grid-Scale System Performance Curve That Considers Double Thresholds. Sustainability, 16(20), 9101. https://doi.org/10.3390/su16209101