


Scenario-Based Supply Chain Resilience Analysis of Bearings


Abstract
1. Introduction
2. Materials and Methods
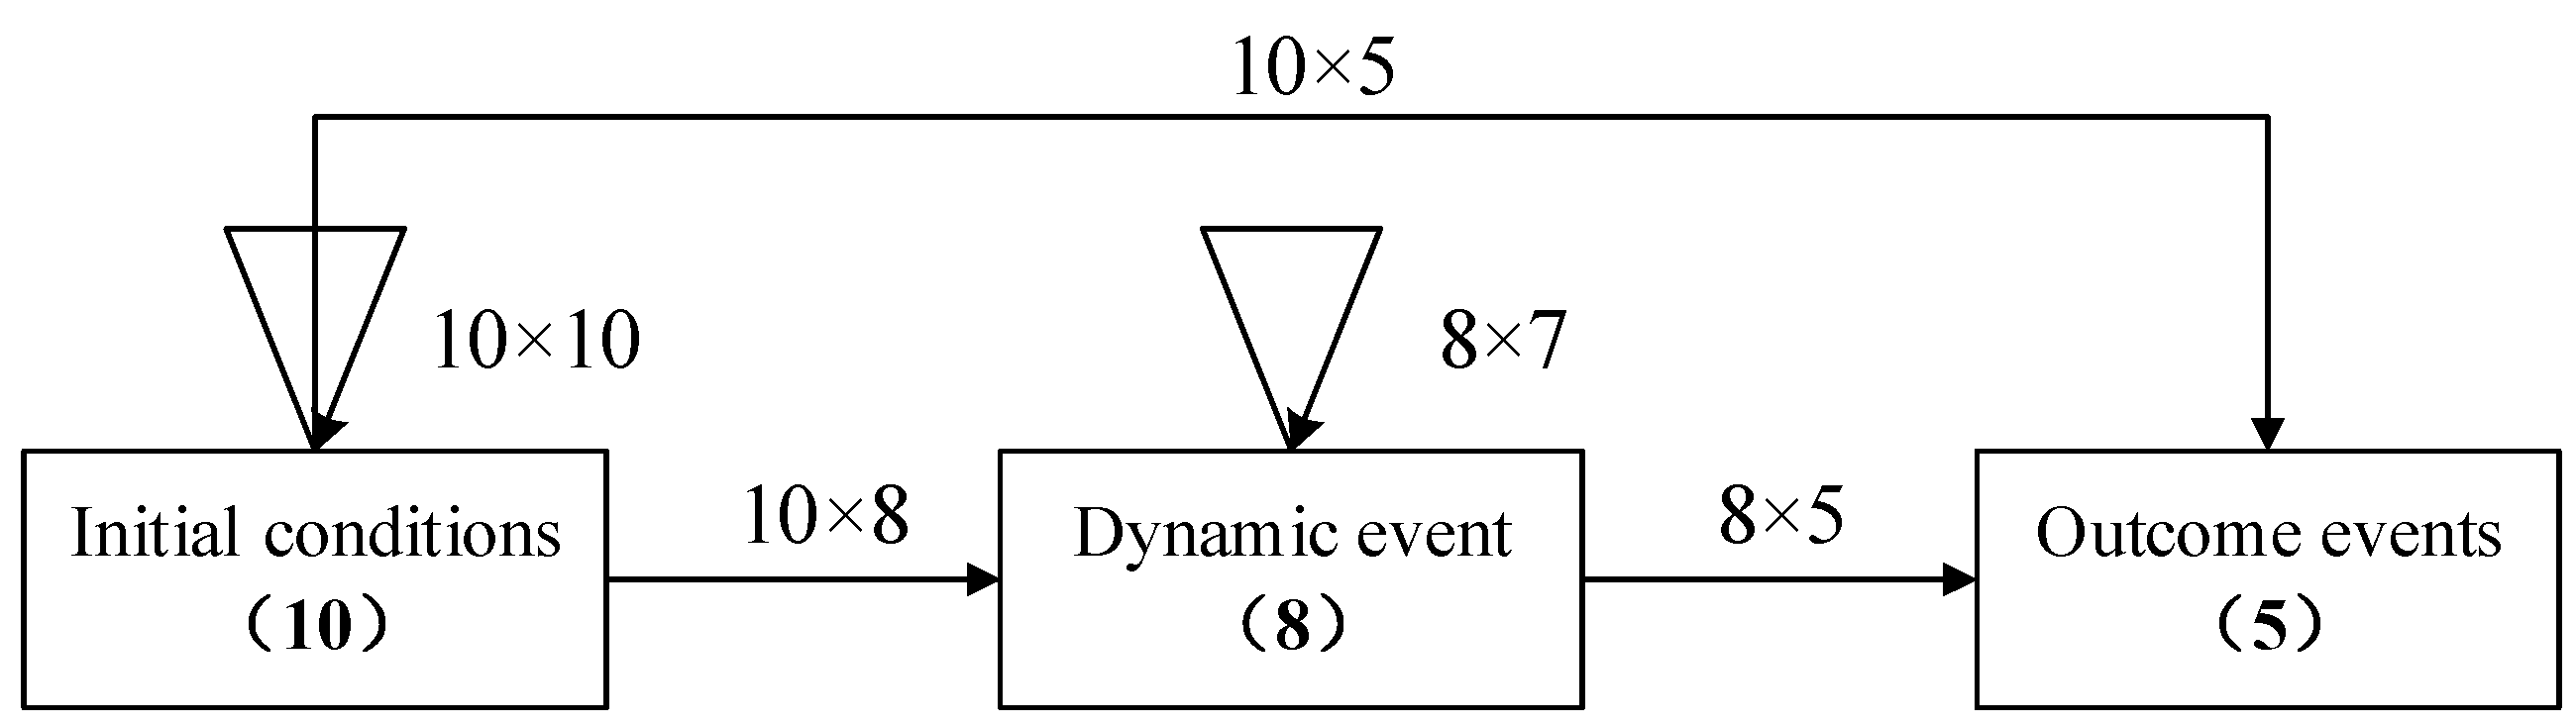
2.1. Construction of Event Sets
2.2. Expert Assessment
2.3. Calculation of Cross-Influence
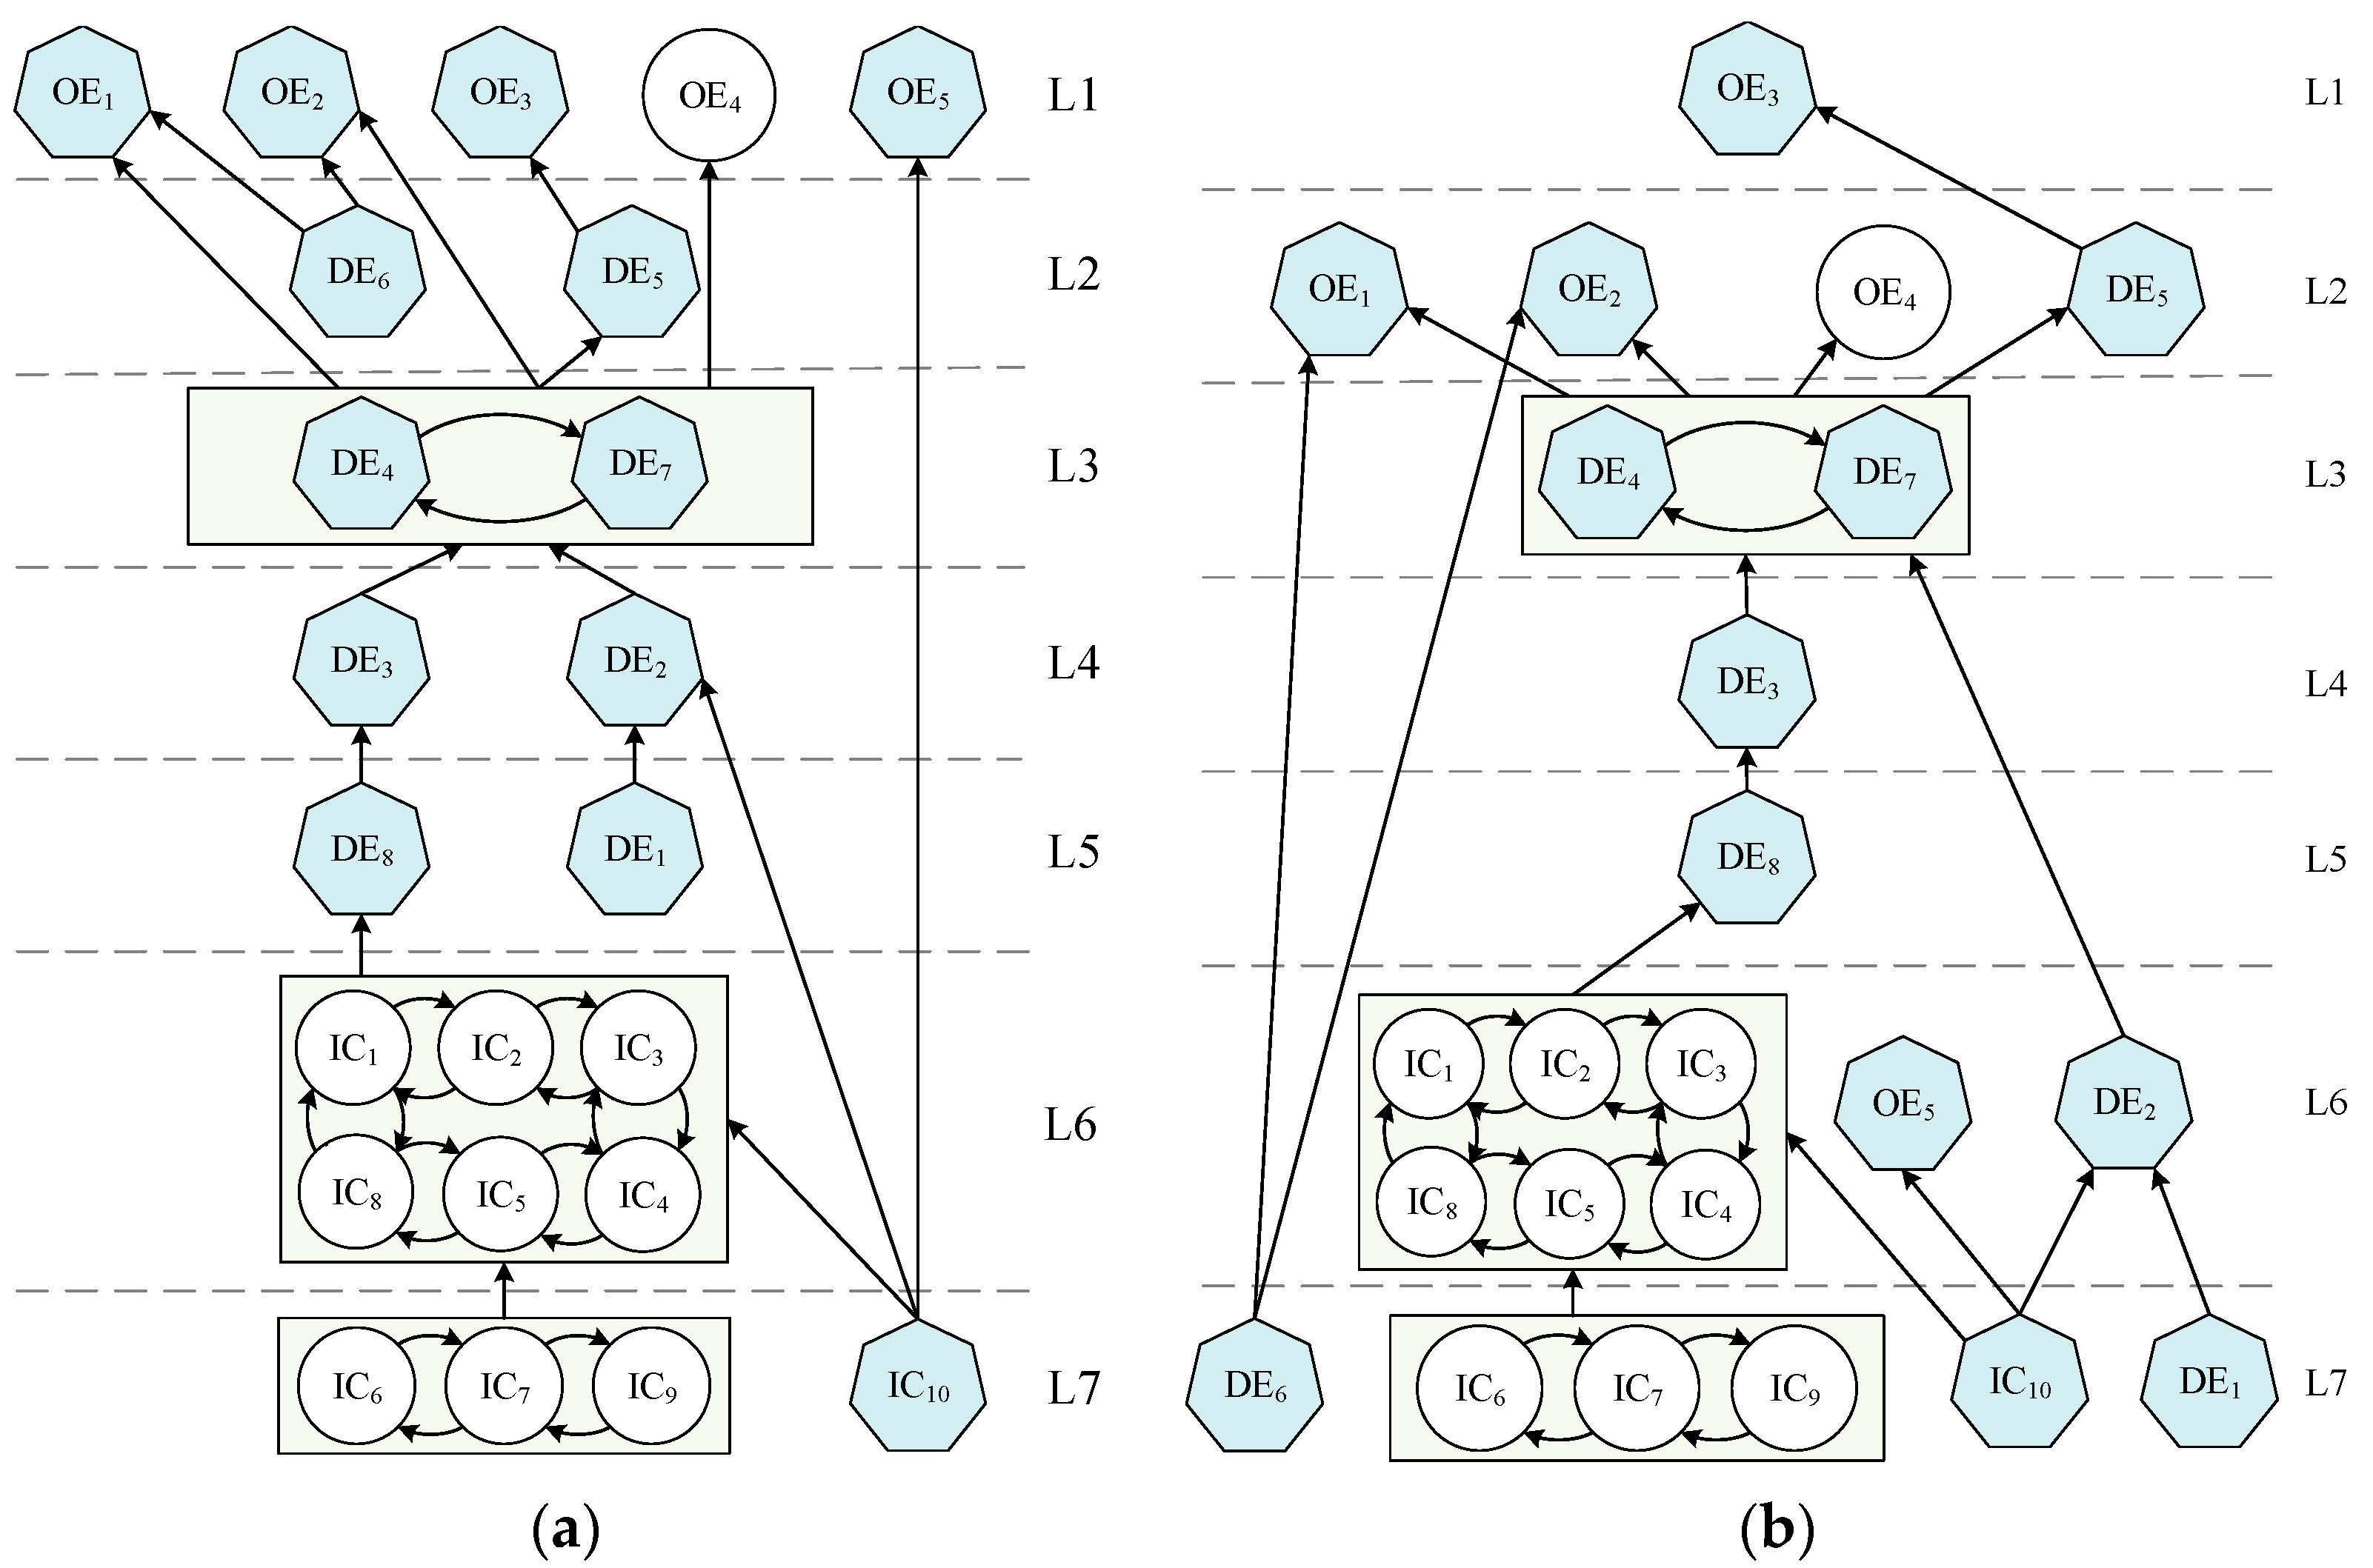
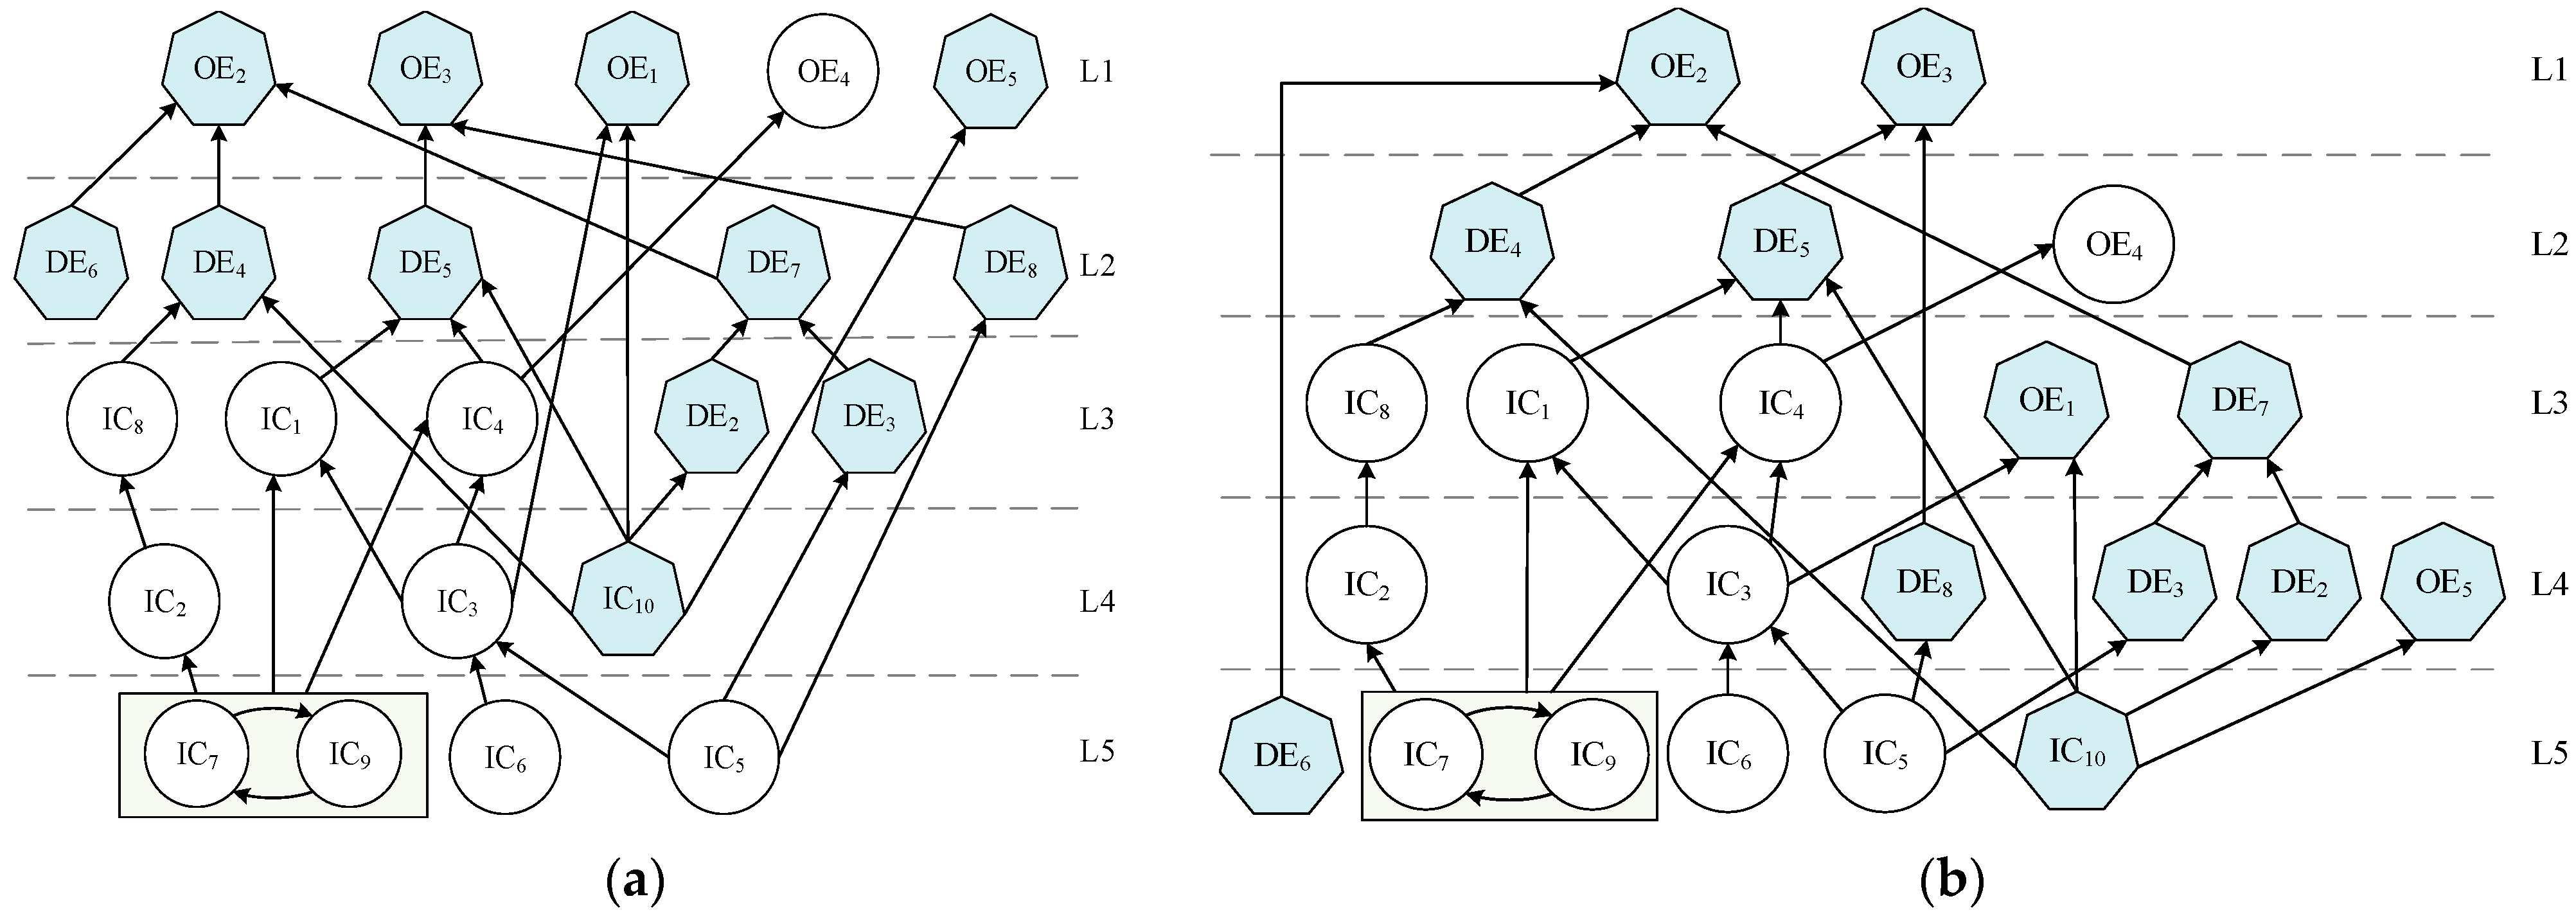
2.4. Analysis of Hierarchical Relationship Between Events Based on AISM
2.4.1. Processing Input Matrix
2.4.2. Division of Hierarchy
2.4.3. Draw Multilevel Hierarchical Directed Graphs
2.5. Probability Derivation
3. Case Study
3.1. Case Background
3.2. Identifying Impact Factors
3.3. Model Analysis
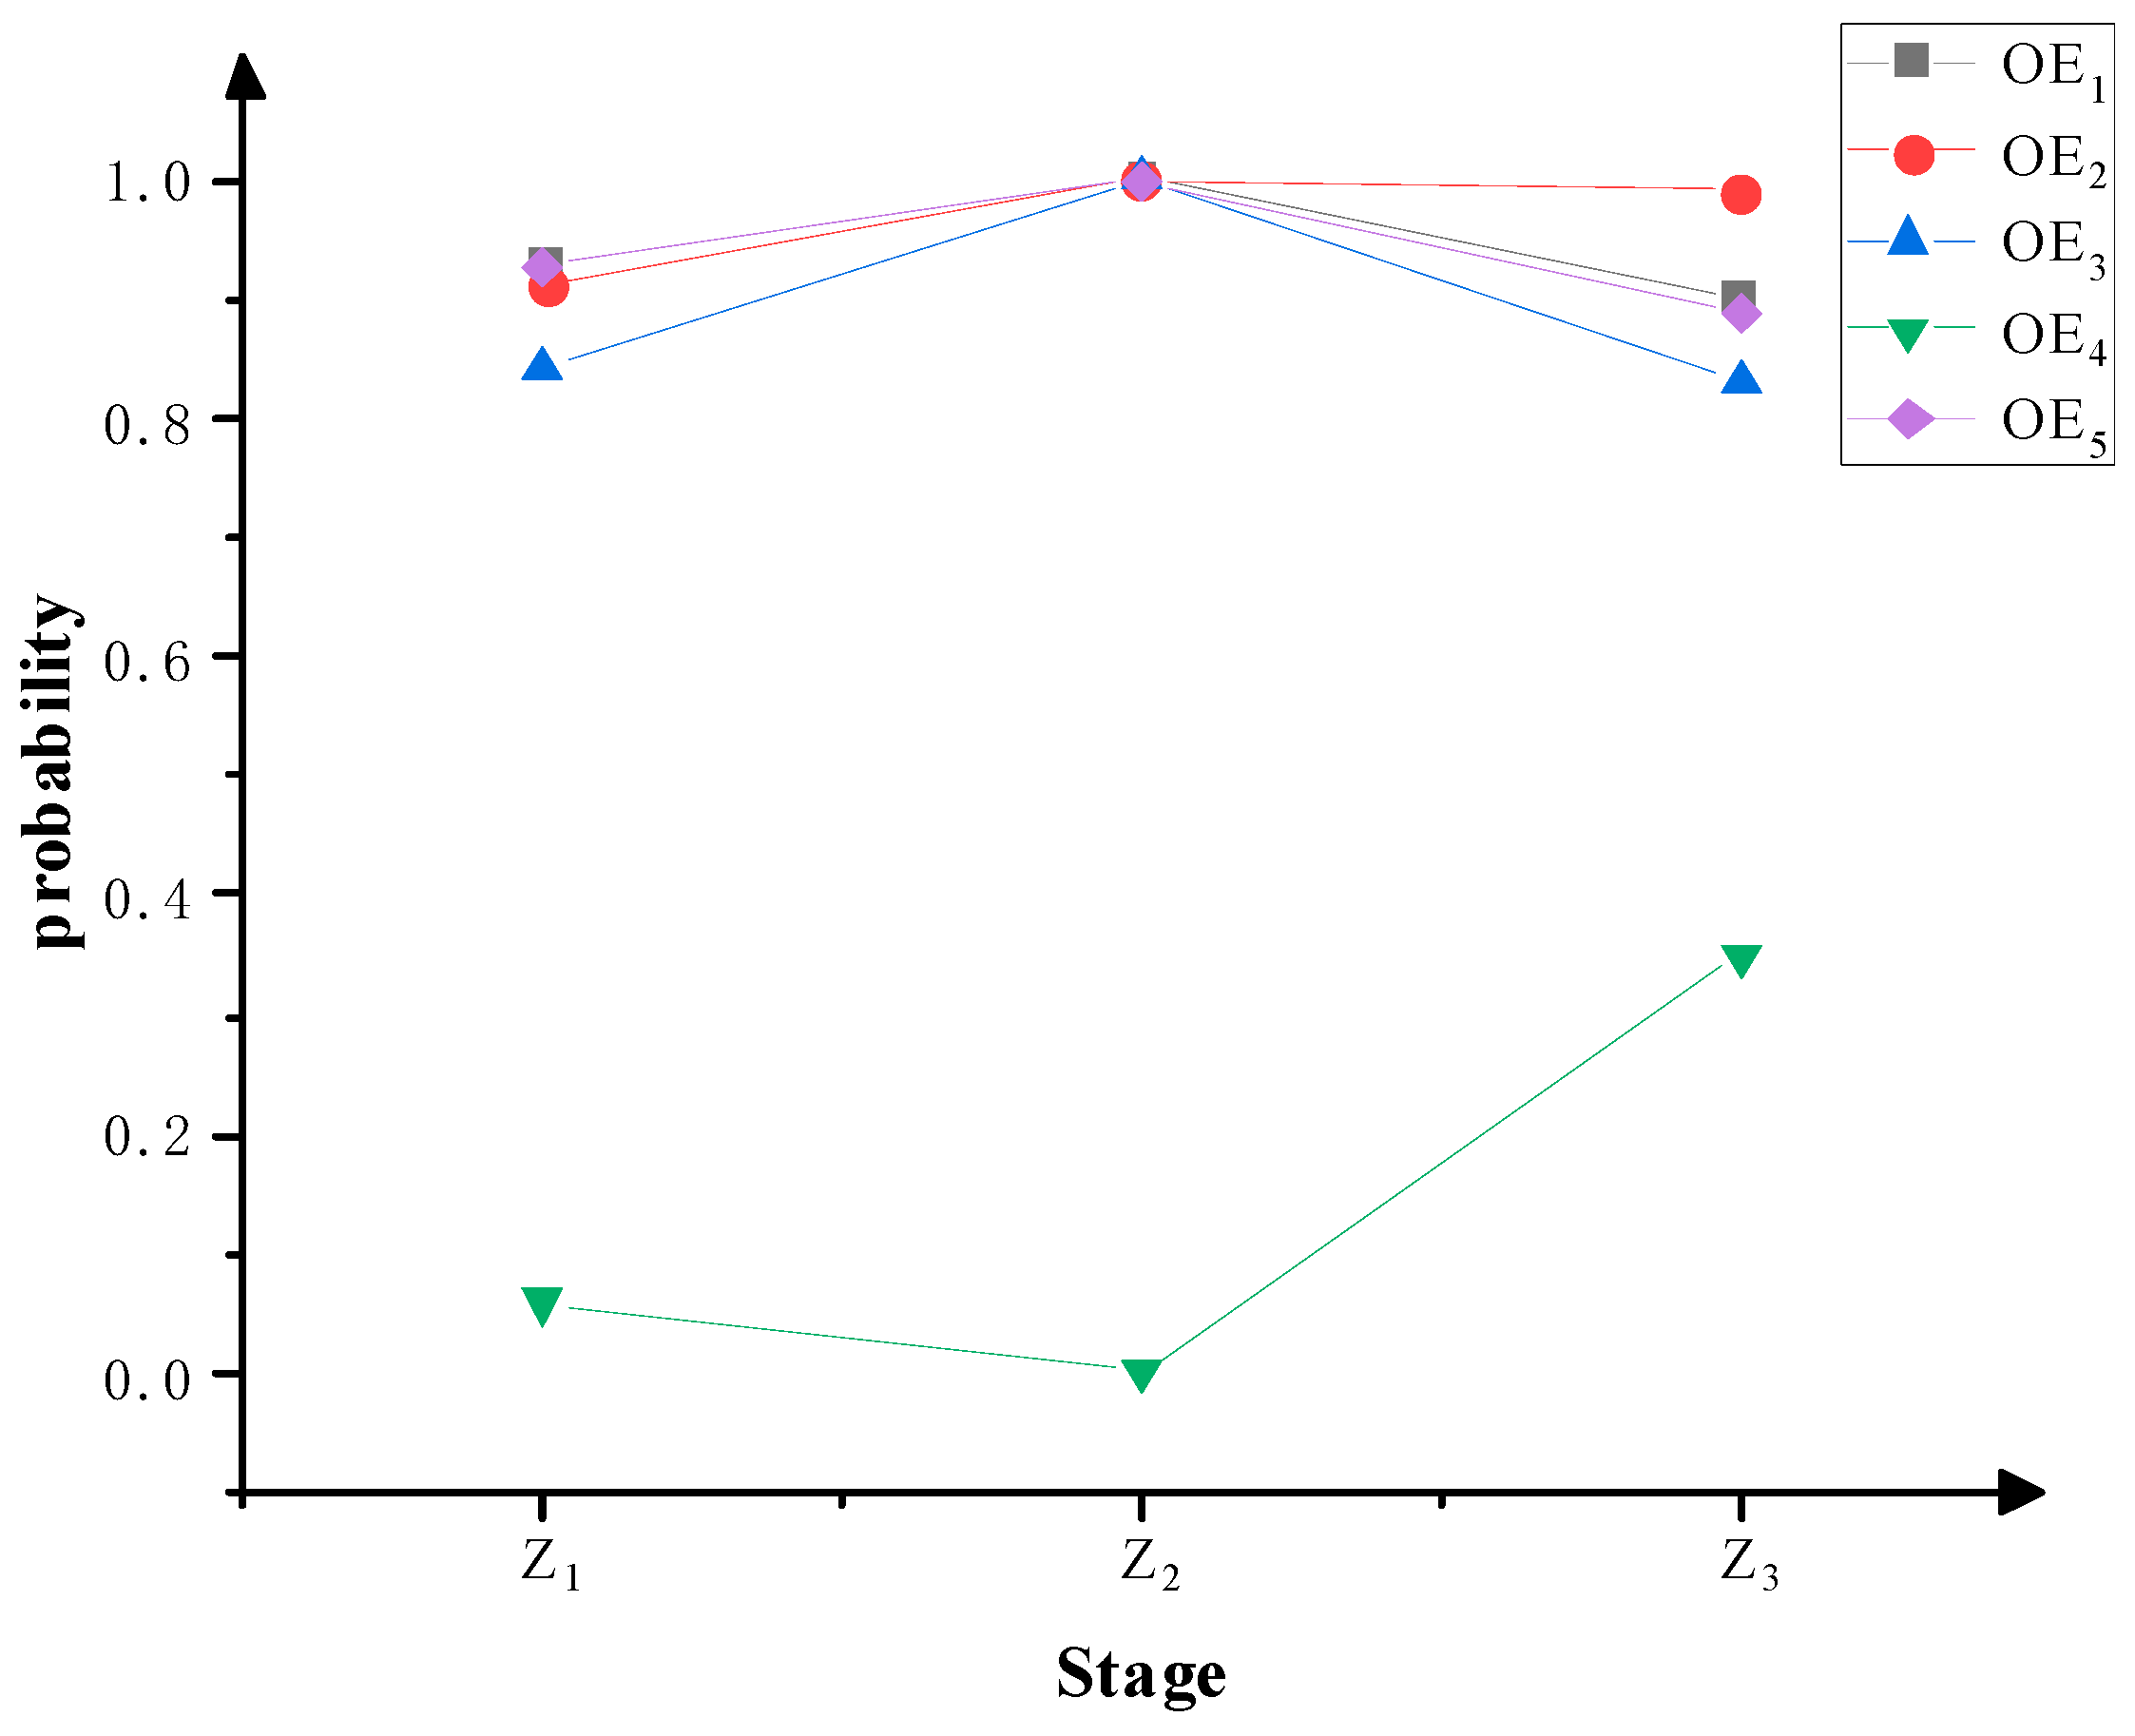
3.4. Scenario Deduction
4. Conclusions
- (1)
- Introducing triangular fuzzy quantitative expert evaluation, effectively expressing the complex relationship between evaluation indicators, more comprehensively considering the mutual influence of factors, and making the evaluation results more scientific and reasonable.
- (2)
- Taking the intersection of the multilevel recursive order-directed graphs of the top 30% and top 10% of impact intensities. It is concluded that the basic strength of supply chain members, staff personal quality and experience accumulation, ability to learn and grow, adverse external shocks, and sudden damage to equipment are the root causes affecting the resilience of the bearing supply chain; a disorganized production schedule and sudden damage to equipment are the dynamic events that have the most direct impact on the outcome events.
- (3)
- Applying enterprise G interruption events to the TCIA-AISM model for scenario inference. The predicted results of the model are consistent with the realistic results of Enterprise G interruption events. The model is feasible and effective. Through further assumptions, the simulation deduction of the fundamental response measures for risk events shows that the effect of ensuring the security and sustainability of the supply chain is significantly improved.
Supplementary Materials
Author Contributions
Funding
Institutional Review Board Statement
Informed Consent Statement
Data Availability Statement
Acknowledgments
Conflicts of Interest
References
- Zhang, T.; Wang, H. Quantile regression network-based cross-domain prediction model for rolling bearing remaining useful life. Appl. Soft Comput. 2024, 159, 111649. [Google Scholar] [CrossRef]
- Xu, F.; Ding, N.; Li, N.; Liu, L.; Hou, N.; Xu, N.; Guo, W.; Tian, L.; Xu, H.; Wu, C.-M.L.; et al. A review of bearing failure Modes, mechanisms and causes. Eng. Fail. Anal. 2023, 152, 107518. [Google Scholar] [CrossRef]
- Manan, B.R.; Hirenkumar, J. Categorical framework for implementation of industry 4.0 techniques in medium-scale bearing manufacturing industries. Mater. Today Proc. 2022, 65, 3531–3537. [Google Scholar]
- Christopher, M.; Peck, H. Building the Resilient Supply Chain. Int. J. Logist. Manag. 2004, 15, 1–13. [Google Scholar] [CrossRef]
- Wu, H.; Li, G.; Zheng, H. How Does Digital Intelligence Technology Enhance Supply Chain Resilience? Sustainable Framework and Agenda. Ann. Oper. Res. 2024, 6, 1–23. [Google Scholar] [CrossRef]
- Ali, A.; Mahfouz, A.; Arisha, A. Analysing supply chain resilience: Integrating the constructs in a concept mapping framework via a systematic literature review. Supply Chain. Manag. 2017, 22, 16–39. [Google Scholar] [CrossRef]
- Wieland, A.; Wallenburg, C.M. The influence of relational competencies on supply chain resilience: A relational view. Int. J. Phys. Distr. Logist. Manag. 2013, 43, 300–320. [Google Scholar] [CrossRef]
- Ivanov, D.A.; Sokolov, B.; Dolgui, A. The Ripple effect in supply chains: Trade-off ‘efficiency-flexibility-resilience’ in disruption management. Int. J. Prod. Res. 2014, 52, 2154–2172. [Google Scholar] [CrossRef]
- Brandon, J.E.; Squire, B.; Autry, C.W.; Petersen, K. A Contingent Resource-Based Perspective of Supply Chain Resilience and Robustness. J. Supply Chain. Manag. 2014, 50, 55–73. [Google Scholar] [CrossRef]
- Tukamuhabwa, B.R.; Stevenson, M.; Busby, J.; Zorzini, M. Supply chain resilience: Definition, review and theoretical foundations for further study. Int. J. Prod. Res. 2015, 53, 5592–5623. [Google Scholar] [CrossRef]
- Chowdhury, M.H.; Quaddus, M. Supply chain readiness, response and recovery for resilience. Supply Chain. Manag. 2016, 21, 709–731. [Google Scholar] [CrossRef]
- Ge, R.; Bao, H. Digital transformation and resilience of supply chain in manufacture listed firms: A backward spillover effects in the vertical supply chain relationship. Financ. Res. Lett. 2024, 65, 105516. [Google Scholar] [CrossRef]
- Atieh Ali, A.A.; Sharabati, A.A.A.; Allahham, M.; Nasereddin, A.Y. The Relationship between Supply Chain Resilience and Digital Supply Chain and the Impact on Sustainability: Supply Chain Dynamism as a Moderator. Sustainability 2024, 16, 3082. [Google Scholar] [CrossRef]
- Zheng, T.; Zhao, G.; Chu, S. A Study on the Impact of External Shocks on the Resilience of China’s Grain Supply Chain. Sustainability 2024, 16, 956. [Google Scholar] [CrossRef]
- Zhu, Y.; Zhang, C.; Fang, J.; Miao, Y. Paths and strategies for a resilient megacity based on the water-energy-food nexus. Sustain. Cities Soc. 2022, 82, 103892. [Google Scholar] [CrossRef]
- Ishii, N.; Ohba, M. Quantitative evaluation of an information network in a supply chain. Int. J. Prod. Econ. 2023, 261, 108889. [Google Scholar] [CrossRef]
- Sabouhi, F.; Jabalameli, M.S.; Jabbarzadeh, A. An optimization approach for sustainable and resilient supply chain design with regional considerations. Comput. Ind. Eng. 2021, 159, 107510. [Google Scholar] [CrossRef]
- Lotfi, R.; Kargar, B.; Rajabzadeh, M.; Hesabi, F.; Özceylan, E. Hybrid Fuzzy and Data-Driven Robust Optimization for Resilience and Sustainable Health Care Supply Chain with Vendor-Managed Inventory Approach. Int. J. Fuzzy Syst. 2022, 24, 1216–1231. [Google Scholar] [CrossRef]
- Xu, B.; Liu, W.; Li, J.; Yang, Y.; Wen, F.; Song, H. Resilience Measurement and Dynamic Optimization of Container Logistics Supply Chain under Adverse Events. Comput. Ind. Eng. 2023, 180, 109202. [Google Scholar] [CrossRef]
- Bañuls, V.A.; Turoff, M.; Hiltz, S. Collaborative Scenario Modelling in Emergency Management through Cross-Impact. Technol. Forecast. Soc. Chang. 2013, 80, 1756–1774. [Google Scholar] [CrossRef]
- Bañuls, V.A.; Turoff, M. Scenario construction via Delphi and cross-impact analysis. Technol. Forecast. Soc. Chang. 2011, 78, 1579–1602. [Google Scholar] [CrossRef]
- Mehrolhassani, M.H.; Setayesh, M.; Yazdi-Feyzabadi, V.; Rahimisadegh, R. Identification of Drivers and Affecting Factors in the Future of Persian Medicine: The Cross-Impact Analysis Method. Eur. J. Integr. Med. 2024, 65, 102316. [Google Scholar] [CrossRef]
- Xu, W.; Lu, Y.; Proverbs, D. An evaluation of factors influencing the vulnerability of emergency logistics supply chains. Int. J. Logist. Res. Appl. 2023, 27, 1891–1924. [Google Scholar] [CrossRef]
- Turoff, M.; Bañuls, V.A. Major extensions to Cross-Impact Analysis. In Proceedings of the International Conference on Information Systems for Crisis Response and Management, Lisbon, Portugal, 8–11 May 2011. [Google Scholar]
- Chandrasekar, S.; Saranyaa, P.; Nagarajan, D.; Pamučar, D. Triangular intuitionistic fuzzy number based backorder and lost sale in production, remanufacturing and inspection process. Expert Syst. Appl. 2023, 240, 122261. [Google Scholar]
- Gadekar, R.; Sarkar, B.; Gadekar, A. Key performance indicator based dynamic decision-making framework for sustainable Industry 4.0 implementation risks evaluation: Reference to the Indian manufacturing industries. Ann. Oper. Res. 2022, 318, 189–249. [Google Scholar] [CrossRef]
- Chen, X.; Qiao, W. A hybrid STAMP-fuzzy DEMATEL-ISM approach for analyzing the factors influencing building collapse accidents in China. Sci. Rep. 2023, 13, 19745. [Google Scholar] [CrossRef]
- Guo, L.; Liang, J.; Chen, T.; Gao, Y.; Yang, Z. Scenario-Driven Methodology for Cascading Disasters Risk Assessment of Earthquake on Chemical Industrial Park. Processes 2023, 11, 32. [Google Scholar] [CrossRef]
- Wang, R.; Cui, S.; Gao, M. Systematic scenario modeling for priority assessment of sustainable development goals in China under interaction and uncertainty. Environ. Dev. Sustain. 2024, 2, 1–36. [Google Scholar] [CrossRef]
- Wicaksono, T.; Illés, C.B. From resilience to satisfaction: Defining supply chain solutions for agri-food SMEs through quality approach. PLoS ONE 2022, 17, e0263393. [Google Scholar] [CrossRef]
- Ingra, V.F.; Silvio, L.S.A.; Davi, S.; Enzo, M.F. Visibility model for enhancing supply chains resilience. IFAC-PapersOnLine 2022, 55, 2521–2525. [Google Scholar]
- Liu, J.; Wu, J.; Gong, Y. Maritime supply chain resilience: From concept to practice. Comput. Ind. Eng. 2023, 182, 109366. [Google Scholar] [CrossRef]
- Ethan, N.; David, G.R.; Ivan, R. Supply chain resilience: When the recipe is more important than the ingredients for managing supply chain disruptions. Int. J. Prod. Econ. 2024, 272, 109236. [Google Scholar]
- Funlade, S.; Patrick, B.; Albert, T.; Janya, C.; Sreejith, B.; Mustafa, M. Prioritising Visibility Influencing Factors in Supply Chains for Resilience. Procedia Comput. 2023, 217, 1589–1598. [Google Scholar]
- Lin, M.; Ren, Y.; Feng, C.; Li, X. Analyzing resilience influencing factors in the prefabricated building supply chain based on SEM-SD methodology. Sci. Rep. 2024, 14, 17393. [Google Scholar] [CrossRef]
- Farhad, H.; Ripon, K.C.; Alireza, A. Evaluating supply chain network resilience considering disruption propagation. Comput. Ind. Eng. 2023, 183, 109531. [Google Scholar]
- Zhong, J.; Cheng, H.; Jia, F. Supply chain resilience capability factors in agri-food supply chains. Oper. Manag. Res. 2024, 17, 850–868. [Google Scholar] [CrossRef]
- Baghalzadeh, S.M.; Moehler, R.; Fang, Y.; Aboutorab, H.; Hijazi, A. Construction supply chain risk management. Automat. Constr. 2024, 162, 105396. [Google Scholar] [CrossRef]
- Song, H.; Chang, R.; Cheng, H.; Liu, P.; Yan, D. The impact of manufacturing digital supply chain on supply chain disruption risks under uncertain environment-Based on dynamic capability perspective. Adv. Eng. Inform. 2024, 60, 102385. [Google Scholar] [CrossRef]
- Yan, X.; Li, J.; Sun, Y.; Robert, S. Supply Chain Resilience Enhancement Strategies in the Context of Supply Disruptions, Demand Surges, and Time Sensitivity. Fundam. Res. 2023. [Google Scholar] [CrossRef]
- Mangla, S.; Kumar, P.; Barua, M. Risk analysis in green supply chain using fuzzy AHP approach: A case study. Resour. Conserv. Recycl. 2015, 104, 375–390. [Google Scholar] [CrossRef]
- Agyabeng-Mensah, Y.; Ahenkorah, E.; Afum, E.; Agyemang, A.N.; Agnikpe, C.; Rogers, F. Examining the influence of internal green supply chain practices, green human resource management and supply chain environmental cooperation on firm performance. Supply Chain. Manag. 2020, 25, 585–599. [Google Scholar] [CrossRef]
- Wang, R.; Wang, E.; Li, L.; Li, W. Evaluating the Effectiveness of the COVID-19 Emergency Outbreak Prevention and Control Based on CIA-ISM. Int. J. Environ. 2022, 19, 7146. [Google Scholar] [CrossRef] [PubMed]
- Zhen, Y.; Dong, X.; Guo, L. Scenario inference model of urban metro system cascading failure under extreme rainfall conditions. Reliab. Eng. Syst. Saf. 2022, 229, 108888. [Google Scholar]


| Semantic Interpretation | Triangular Fuzzy Number |
|---|---|
| Very high positive impact (VHP) | (0.80, 0.90, 1.00) |
| High positive impact (HP) | (0.70, 0.80, 0.90) |
| Medium positive impact (MP) | (0.60, 0.70, 0.80) |
| Low positive impact (LP) | (0.50, 0.60, 0.70) |
| No impact (N) | (0.40, 0.50, 0.60) |
| Low negative impact (LN) | (0.30, 0.40, 0.50) |
| Medium negative impact (MN) | (0.20, 0.30, 0.40) |
| High negative impact (HN) | (0.10, 0.20, 0.30) |
| Very high negative impact (VHN) | (0.00, 0.10, 0.20) |
| Occurrence of Event (+i) | Nonoccurrence of Even (−i) | |
|---|---|---|
| Occurrence of event (+i) | cij | −cij |
| Nonoccurrence of event (−i) | −cij | cij |
| Event Category | Number | Event Set | Definition | |
|---|---|---|---|---|
| Initial conditions | IC1 | Accuracy of market demand forecasting | The ability of a company to accurately predict the future supply, demands, and prices of products in the supply chain based on historical data, market trends, consumer behavior, and other information. | [30,31] |
| IC2 | Risk awareness | Enterprises can warn, plan, assess, avoid, and control risk before it strikes. | [30,32] | |
| IC3 | Supply chain visibility | Degree of comprehensive supervision and control of the entire supply chain operation process with the help of a visual information system. | [31,32,33] | |
| IC4 | Contingency planning capacity | The ability of an organization to rapidly establish emergency response mechanisms through a series of measures such as supply chain reconfiguration and design, information monitoring, and technology maintenance in the face of emergencies. | [31,34,35] | |
| IC5 | Structural stability of supply chain network | Ordered relationships and structures are formed between firm members to have the ability to withstand the disruptions of competition and uncertainty, mainly in terms of supply chain member reputation as well as supply chain complexity. | [33,36,37] | |
| IC6 | The basic strength of supply chain members | Including the level of facilities, market share, financial strength, and so on. | [32,35,37] | |
| IC7 | Staff personal quality and experience accumulation | The comprehensive ability shown by employees in their work and the knowledge and experience accumulated in long-term work. | [32,35,37] | |
| IC8 | Redundancy | Stockpiling critical resources and replicating key components or procedures in the supply chain to ensure that backup systems are available in the event of disruptions or failures, such as having multiple suppliers, alternate transportation routes, storage facilities, and alternative processing plants. | [32,35,36] | |
| IC9 | Ability to learn and grow | It mainly includes learning ability and innovation ability. Learning ability is the ability to learn lessons and share experiences in a timely and effective manner after the occurrence of adverse events. Innovation ability is the ability to optimize the management technology level of supply chain enterprises and grasp the industry technology update. | [32,35,36] | |
| IC10 | Adverse external shocks | These include man-made disasters, natural events, and international conflicts. Man-made disasters include global pandemics, economic setbacks, technological change, policy changes, and fires. Natural disasters such as earthquakes, floods, and heavy rains. International conflict refers to the competition and confrontation between actors in the international community in terms of interests, power, status, and resources. | [34,37,38] | |
| Dynamic events | DE1 | Changes in the structure of market demand | Shifts in the types, proportions, and preferences of consumer demand for goods or services in the marketplace. | [35,37,38,39] |
| DE2 | Emergency change of order information | Sudden modification requests from customers or the market for orders already placed involve adjustments to product specifications, quantities, delivery times, and other key information. | [37,39] | |
| DE3 | Miscommunication | A situation in which errors, omissions, or delays in the transmission of information result in the recipient failing to obtain the original information in an accurate and timely manner. | [33,40] | |
| DE4 | Problems with critical resources | Includes shortages and defects, inadequate supply of raw materials, spare parts, manpower, etc., and failure of acquired resources to meet established standards or requirements in terms of quality. | [38,40] | |
| DE5 | Disorganized production schedule | Due to the imbalance of resource allocation and other factors, the execution of the original production plan was blocked, the production schedule was seriously deviated, and the product delivery was delayed. | [40,41] | |
| DE6 | Sudden damage to equipment | An emergency in which critical equipment malfunctions or fails in the course of production or operations without anticipation or prior warning, resulting in interruption of production or disruption of operations. | [30,41] | |
| DE7 | Distribution anomaly | Deviations from plans or expectations in the distribution process, including but not limited to problems such as delays, errors, damage, or loss. | [30,38,41] | |
| DE8 | Unreliable partners | The partner fails to meet its commitments or responsibilities. | [30,41] | |
| Outcome Events | OE1 | Supply chain disruption | During the operating process in the supply chain, an unexpected event occurs suddenly in one or more parts of the supply chain, which leads to the obstruction of the logistics, information flow, or capital flow in the supply chain, and then affects the normal operation of the whole supply chain. | [34,38,39] |
| OE2 | Temporary shutdown of production lines | The production line suspended production activities for some reason, but measures were taken to resolve the problem and normal production processes and capacity were resumed eventually. | [34,38] | |
| OE3 | Cumulative chain breaks | In the supply chain operation process, the gradual accumulation of several small problems forms a potential risk, which has a limited impact on the supply chain operation in the short term, but once it accumulates to a certain extent, it may lead to the disruption or serious obstruction of the supply chain as a whole. | [34] | |
| OE4 | Flexible supply chain response | When facing internal and external changes, the supply chain system can quickly adjust its strategy and optimize resource allocation to ensure smooth supply chain operation. | [39] | |
| OE5 | Significant economic loss of the enterprise | A situation in which an enterprise suffers huge financial losses due to a sharp decline in asset value and significant deterioration in financial condition due to internal and external factors. | [38,42] | |
| Sequence | OE1 | OE2 | OE3 | OE4 | OE5 | |||||
|---|---|---|---|---|---|---|---|---|---|---|
| 1 | IC3 | 3.243 | DE7 | 3.874 | DE4 | 3.549 | IC5 | 3.243 | IC10 | 3.243 |
| 2 | IC10 | 3.243 | IC10 | 2.966 | DE8 | 2.966 | IC3 | 2.966 | IC4 | 2.051 |
| 3 | IC5 | 2.966 | DE5 | 2.966 | IC2 | 2.711 | IC4 | 2.966 | DE4 | 2.051 |
| 4 | IC6 | 2.485 | DE6 | 2.966 | DE7 | 2.485 | IC10 | 2.711 | DE7 | 2.051 |
| 5 | DE6 | 2.485 | DE3 | 2.262 | IC10 | 2.051 | IC6 | 2.485 | DE8 | 2.051 |
| 6 | DE8 | 2.485 | DE2 | 2.051 | DE2 | 1.859 | IC9 | 2.485 | IC1 | 1.666 |
| 7 | IC4 | 2.262 | DE8 | 1.859 | DE3 | 1.859 | IC1 | 2.262 | IC5 | 1.666 |
| 8 | DE5 | 2.262 | IC5 | 1.666 | IC5 | 1.666 | DE7 | 2.262 | DE3 | 1.666 |
| 9 | DE2 | 2.051 | IC6 | 1.666 | IC6 | 1.666 | IC7 | 2.051 | DE5 | 1.666 |
| 10 | DE3 | 2.051 | IC8 | 1.666 | IC7 | 1.666 | IC8 | 2.051 | IC2 | 1.309 |
| 11 | DE7 | 2.051 | DE4 | 1.666 | DE5 | 1.666 | DE3 | 2.051 | IC3 | 1.309 |
| 12 | IC1 | 1.666 | IC1 | 1.480 | IC4 | 1.480 | DE5 | 2.051 | IC9 | 1.309 |
| 13 | DE4 | 1.666 | IC2 | 1.480 | IC3 | 1.309 | DE8 | 2.051 | DE6 | 1.309 |
| 14 | IC8 | 1.480 | IC3 | 1.480 | IC8 | 1.309 | IC2 | 1.859 | IC7 | 1.133 |
| 15 | IC9 | 1.309 | IC7 | 1.480 | IC9 | 1.133 | DE4 | 1.666 | IC8 | 1.133 |
| 16 | IC2 | 1.133 | DE1 | 1.309 | DE1 | 0.962 | DE6 | 1.666 | DE2 | 1.133 |
| 17 | IC7 | 1.133 | IC4 | 0.794 | DE6 | 0.962 | DE1 | 1.480 | IC6 | 0.962 |
| 18 | DE1 | 0.803 | IC9 | 0.637 | IC1 | 0.794 | DE2 | 1.480 | DE1 | 0.962 |
| Stage | Event Probability Setting |
|---|---|
| Z1 | IC5 = 0, IC8 = 0, IC6 = 1, IC10 = 1, the remaining initial conditions, dynamic event probabilities are 0.5. |
| Z2 | DE2 = 1, DE4 = 1, DE5 = 1, DE7 = 1, DE8 = 1, IC5 = 0, IC8 = 0, IC6 = 1, IC10 = 1, the remaining initial conditions, dynamic event probabilities are 0.5. |
| Z3 | IC3 = 1, IC4 = 1, IC7 = 1, IC9 = 1, DE5 = 0, IC5 = 0, IC8 = 0, IC6 = 1, IC10 = 1, DE2 = 1, DE4 = 1, DE7 = 1, DE8 = 1, the remaining initial conditions, dynamic event probabilities are 0.5. |
| Event | Z1 | Z2 | Z3 |
|---|---|---|---|
| IC1 | 0.5 | 0.5 | 0.5 |
| IC2 | 0.5 | 0.5 | 0.5 |
| IC3 | 0.5 | 0.5 | 1 |
| IC4 | 0.5 | 0.5 | 1 |
| IC5 | 0 | 0 | 0 |
| IC6 | 1 | 1 | 1 |
| IC7 | 0.5 | 0.5 | 1 |
| IC8 | 0 | 0 | 0 |
| IC9 | 0.5 | 0.5 | 1 |
| IC10 | 1 | 1 | 1 |
| DE1 | 0.7360 | 0.5 | 0.5 |
| DE2 | 0.8652 | 1 | 1 |
| DE3 | 0.8916 | 0.5 | 0.5 |
| DE4 | 0.9683 | 1 | 1 |
| DE5 | 0.9681 | 1 | 0 |
| DE6 | 0.6468 | 0.5 | 0.5 |
| DE7 | 0.8255 | 1 | 1 |
| DE8 | 0.8462 | 1 | 1 |
| OE1 | 0.9310 | 0.9996 | 0.9020 |
| OE2 | 0.9102 | 0.9998 | 0.9906 |
| OE3 | 0.8429 | 0.9996 | 0.8319 |
| OE4 | 0.0595 | 0.0005 | 0.3510 |
| OE5 | 0.9269 | 0.9991 | 0.8874 |
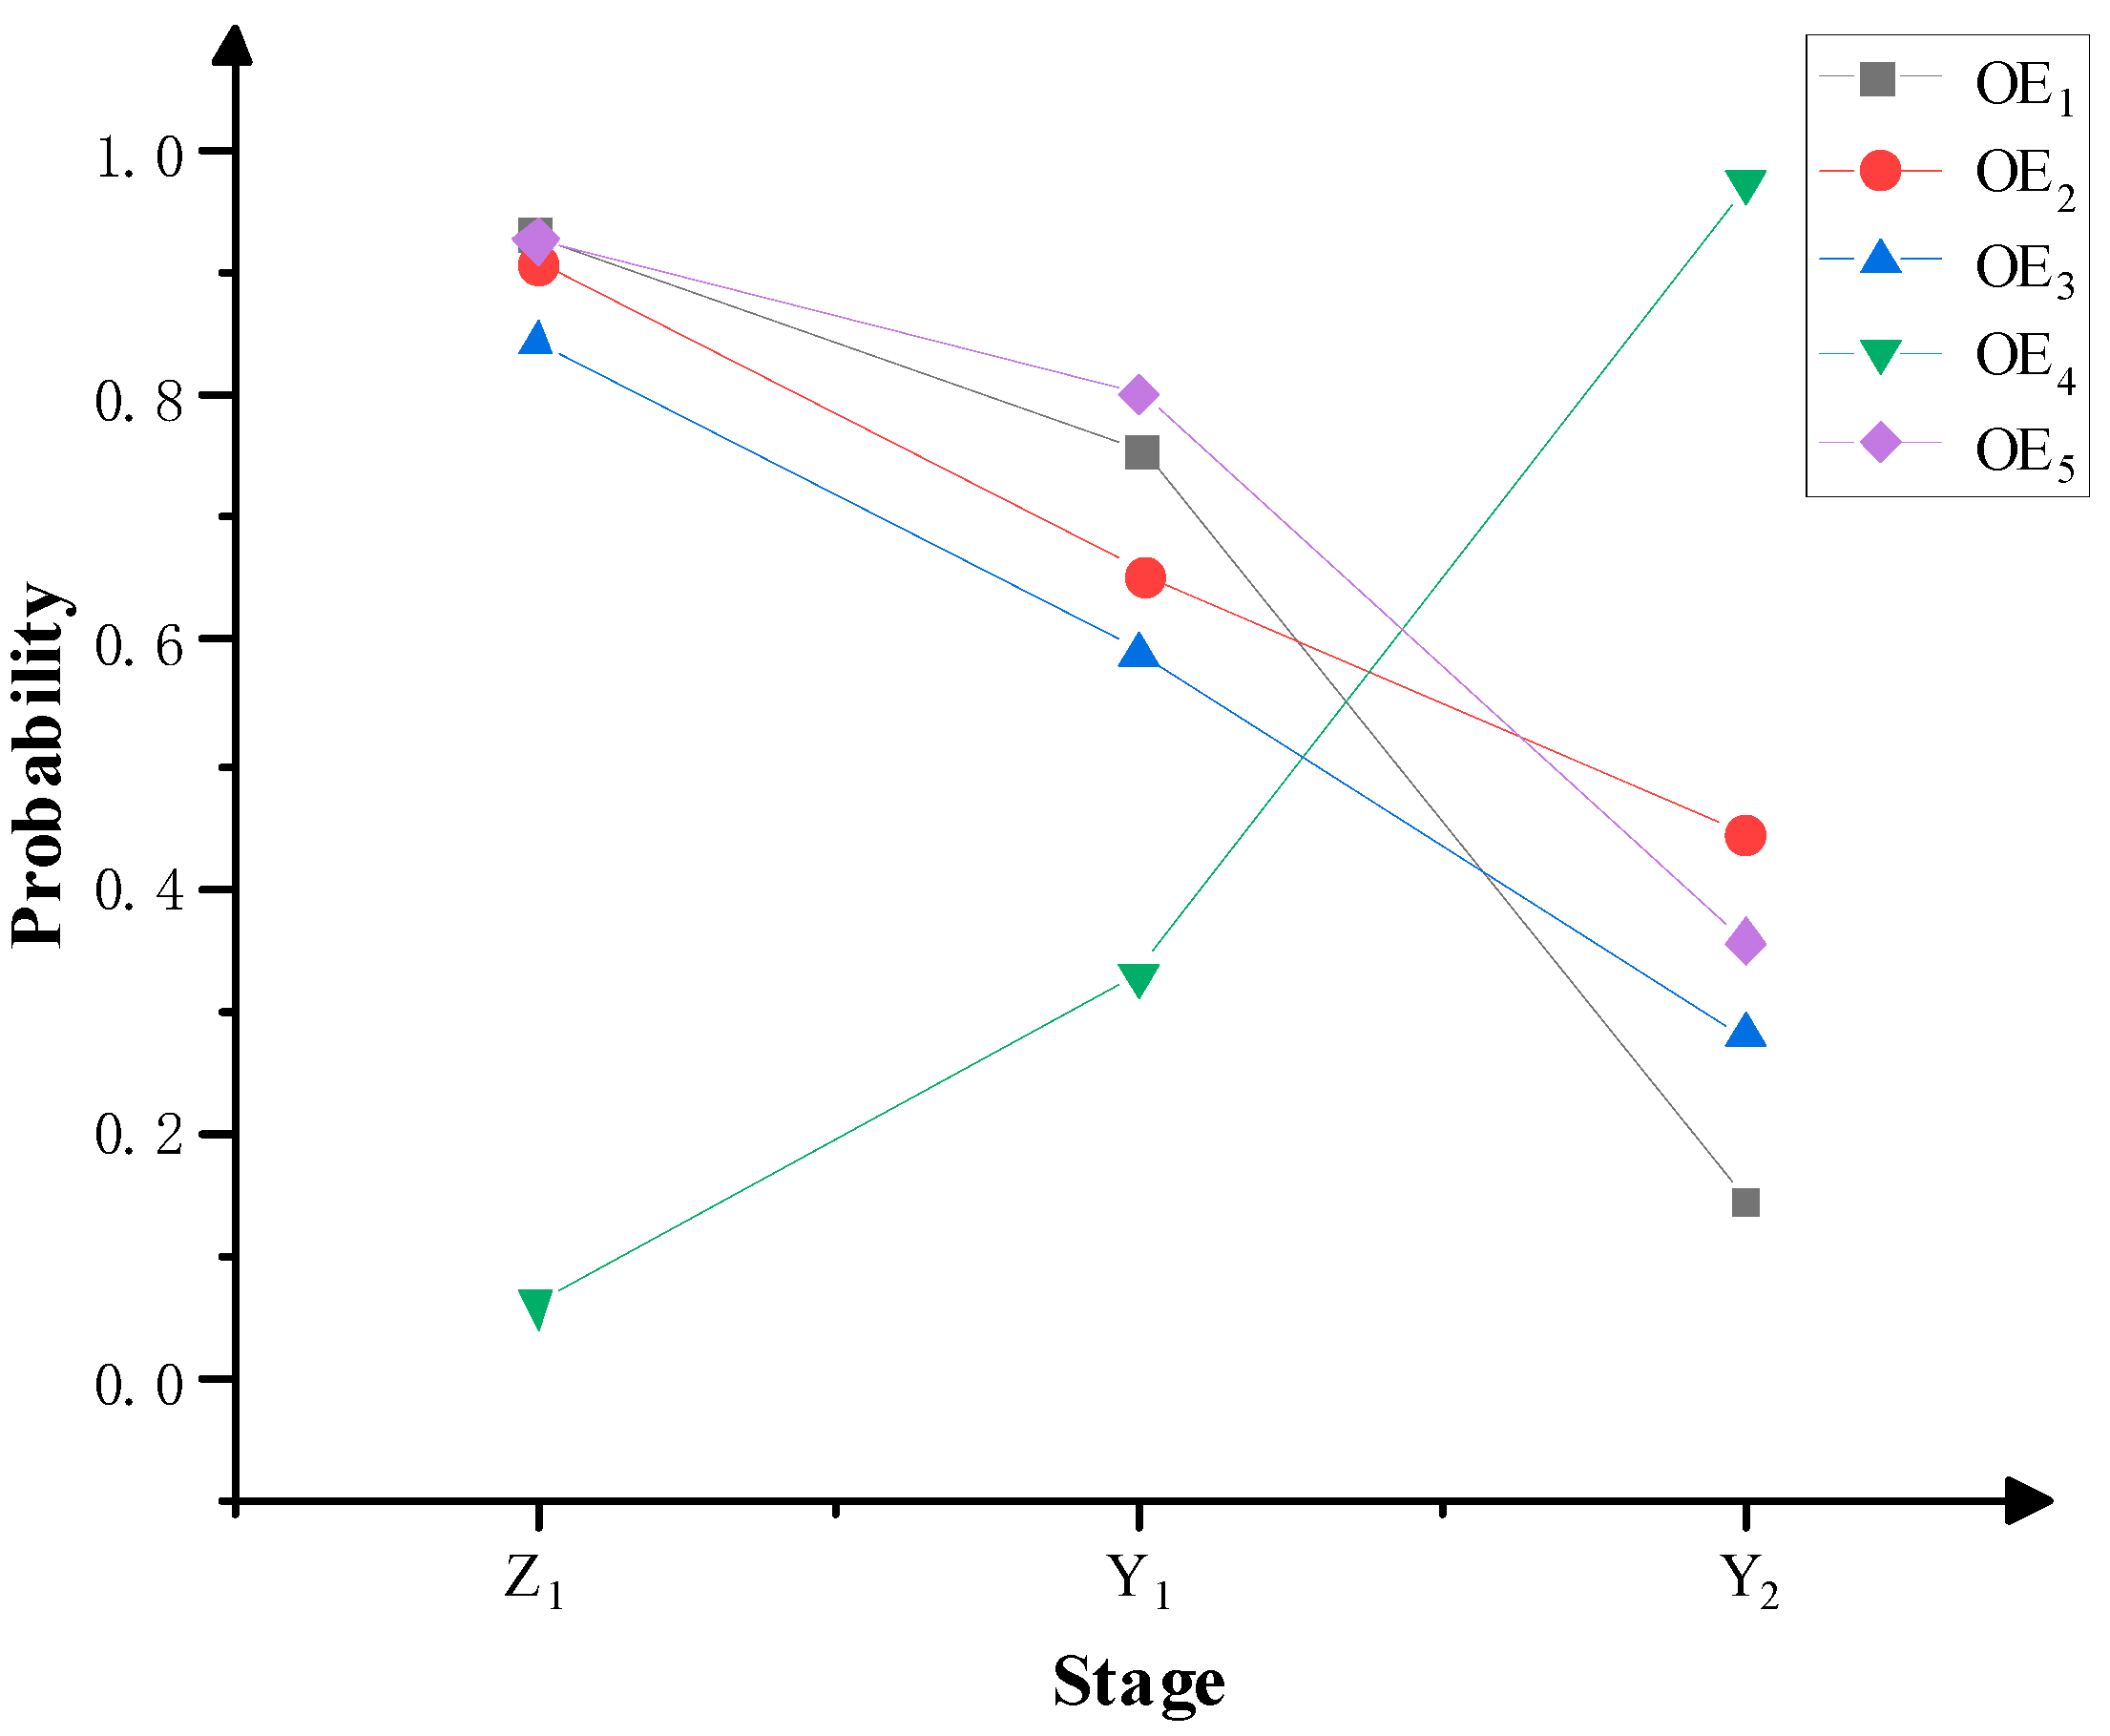
| Event | Z1 | Y1 | Y2 |
|---|---|---|---|
| IC1 | 0.5 | 0.5 | 0.5 |
| IC2 | 0.5 | 0.5 | 0.5 |
| IC3 | 0.5 | 0.5 | 1 |
| IC4 | 0.5 | 0.5 | 1 |
| IC5 | 0 | 0 | 0 |
| IC6 | 1 | 1 | 1 |
| IC7 | 0.5 | 0.5 | 1 |
| IC8 | 0 | 1 | 1 |
| IC9 | 0.5 | 0.5 | 1 |
| IC10 | 1 | 1 | 1 |
| DE1 | 0.7360 | 0.7360 | 0.5 |
| DE2 | 0.8652 | 0.8244 | 0.8244 |
| DE3 | 0.8916 | 0.8751 | 0.5 |
| DE4 | 0.9683 | 0.3884 | 0.3884 |
| DE5 | 0.9681 | 0.6687 | 0.6687 |
| DE6 | 0.6468 | 0.6468 | 0.5 |
| DE7 | 0.8255 | 0.6813 | 0.6813 |
| DE8 | 0.8462 | 0.8462 | 0.5 |
| OE1 | 0.9310 | 0.7543 | 0.1436 |
| OE2 | 0.9102 | 0.6570 | 0.4431 |
| OE3 | 0.8429 | 0.5917 | 0.2775 |
| OE4 | 0.0595 | 0.3298 | 0.9729 |
| OE5 | 0.9269 | 0.8033 | 0.3556 |
Disclaimer/Publisher’s Note: The statements, opinions and data contained in all publications are solely those of the individual author(s) and contributor(s) and not of MDPI and/or the editor(s). MDPI and/or the editor(s) disclaim responsibility for any injury to people or property resulting from any ideas, methods, instructions or products referred to in the content. |
© 2024 by the authors. Licensee MDPI, Basel, Switzerland. This article is an open access article distributed under the terms and conditions of the Creative Commons Attribution (CC BY) license (https://creativecommons.org/licenses/by/4.0/).
Share and Cite
Lyu, F.; Liu, F.; Zhang, S.; Zhang, Z. Scenario-Based Supply Chain Resilience Analysis of Bearings. Sustainability 2024, 16, 9069. https://doi.org/10.3390/su16209069
Lyu F, Liu F, Zhang S, Zhang Z. Scenario-Based Supply Chain Resilience Analysis of Bearings. Sustainability. 2024; 16(20):9069. https://doi.org/10.3390/su16209069
Chicago/Turabian StyleLyu, Feng, Fen Liu, Shuping Zhang, and Zhiwen Zhang. 2024. "Scenario-Based Supply Chain Resilience Analysis of Bearings" Sustainability 16, no. 20: 9069. https://doi.org/10.3390/su16209069
APA StyleLyu, F., Liu, F., Zhang, S., & Zhang, Z. (2024). Scenario-Based Supply Chain Resilience Analysis of Bearings. Sustainability, 16(20), 9069. https://doi.org/10.3390/su16209069