Article

The Spatial Effects of Digital Economy on Sustainable Urban Economic Development in China

by
Rashid Latief
1 and
Sohail Ahmad Javeed
2,*
1
School of Finance, Xuzhou University of Technology, Xuzhou 221008, China
2
School of Economics and Management, Quanzhou University of Information Engineering, Quanzhou 362200, China
*
Author to whom correspondence should be addressed.
Sustainability 2024, 16(20), 8973; https://doi.org/10.3390/su16208973
Submission received: 3 September 2024 / Revised: 7 October 2024 / Accepted: 14 October 2024 / Published: 17 October 2024

Abstract

:
This paper examines the nexus between the digital economy and sustainable urban economic development by considering the moderating roles of human capital and government support. This study utilizes panel data from China at the city level from 30 provinces for the period 2011–2019 and employs the Spatial Durbin model along with fixed effects, the Generalized Method of Moments (GMM), and Feasible Generalized Least Squares (FGLS) models. The results show a significant positive connection between the digital economy and sustainable urban economic development. The findings also demonstrate the significant moderating roles of human capital and government support in enhancing the connection between the digital economy and sustainable urban development. Finally, this study recommends policy implications to improve the quality of life and stimulate growth in urban areas of China.

1. Introduction

After the fourth Industrial Revolution, the digital economy (DE) has profoundly impacted national economic growth, becoming crucial for transforming industrial structures and economic models [1]. In this digital era, data have emerged as critical components of the economic system, closely intertwined with traditional production factors such as labor, capital, and land. The capacity for extensive data collection surpasses the limitations of conventional production elements, and the data’s scalability and potential for enhancing traditional production efficiencies are considerable. Additionally, digital technologies significantly reduce the costs associated with economic activities, such as those related to information search and replication [2].
The DE has recently become a key driver of economic advancement and global economic transformation. Initially, during the stages of information processing, value addition, and amplification, big data technologies enable organizations to derive valuable insights and enhance human capital quality [3]. Moreover, big data technologies can lessen the costs of developing green technologies while improving the transparency of market information [4]. Thus, the global trend now emphasizes advancing green technology innovation and improving human capital through the DE to achieve high-quality economic growth.
China’s rapid shift toward digitalization reflects global technological advancements. The United Nations’s 2019 DE report estimated that the DE constituted between 4.5% and 15.5% of the global GDP [5]. According to a Chinese government report, the DE represented 39.8% of China’s GDP in 2021, underscoring its crucial role in the country’s high-quality development. However, economic indicators in China experienced a sharp decline in the first half of 2022 due to the global economic environment and the pandemic [6].
Recent academic research has extensively explored the DE from various angles, including its impact on industrial development [7], sustainable growth [8], urban migration [9], environmental pollution [10], financial technology [11], and production efficiency [12]. Some studies have investigated how research and development, technological investments, and tax incentives influence the growth of the DE [13]. However, many studies have examined only isolated aspects of the DE’s effects on environmental and economic domains.
Despite the significant attention given to the DE, several research gaps remain. First, the existing literature lacks a comprehensive framework to explain how the expansion of the DE influences sustainable urban economic development (ED). Simple regressions of the DE against sustainable urban ED indicators may lead to misleading conclusions. Second, there is a need for a holistic index of sustainable urban ED in China, which complicates the accurate measurement of contributions across different models. Third, while previous studies have addressed various factors influencing urban development and the DE’s impact, few have considered the moderating roles of human capital and government support.
The objective of this study is to examine the nexus between the DE and sustainable urban ED by considering the moderating roles of human capital and government support in China. This study addresses the highlighted gaps and contributes to the present work in several ways. First, it provides pioneering insights into the connection between the DE and sustainable urban ED using city-level data from 30 provinces of China. Second, it explores both direct and indirect connections between the DE and sustainable urban ED. Third, it introduces two important moderators—human capital and government support—to assess their roles in the affiliation between the DE and sustainable urban ED. Fourth, it develops a comprehensive index for sustainable urban ED by incorporating multiple factors. Fifth, it employs advanced econometric techniques, including the Spatial Durbin method, GMM model, fixed effects model, and FGLS models. Finally, this study offers practical recommendations based on its findings to foster sustainable urban ED in China.
The structure of the remaining sections is as follows: Section 2 provides a detailed literature review and theoretical framework for the study variables. Section 3 describes the variables, datasets, econometric models, and methodologies used. Section 4 presents the empirical outcomes, while Section 5 offers recommendations to conclude the research. Figure 1 shows the conceptual framework.

2. Literature Review and Theoretical Mechanism

2.1. Digital Economy and Sustainable Urban Economic Development (ED)

Capital has long been a cornerstone of economic and social progress since the Industrial Revolution, with technological advancements and improved management practices subsequently introduced [13]. In the contemporary landscape, big data has emerged as a critical element of the evolving DE, and it significantly contributes to China’s robust economic growth [14]. The DE influences ED by enhancing production input and output efficiency [7]. This impact is evidenced by an increased factor input, improved efficiency in resource allocation, and a rise in total factor productivity driven by technological advancements and spillovers. Digitization is recognized as a key driver of economic progress, particularly in developing nations [15]. It reduces transaction costs, enhances labor and capital productivity, and facilitates national integration into the global market system [16].
From 2004 to 2012, the DE was a primary engine of ED in the United States [17]. In China, the DE has emerged as a new component of urbanization, not only enhancing urban functions but also significantly impacting urban ED [18]. The growth of the DE supports urban ED both directly through its inherent characteristics and indirectly by facilitating the industrial structures [1]. Additionally, considering “Metcalfe’s Law” and the “Network Effect” associated with the DE, there may be spatial spillover effects influencing the urban development quality [19]. Modernizing industrial structures has become a core principle of sustainable development and a foundation for new forms of urbanization.
The current literature and the development experiences of advanced economies highlight that production factors and job creation during industrial upgrades are crucial for improving urbanization quality [20]. The DE significantly contributes to industrial upgrading [21]. From the perspective of digital industrialization, the DE, with big data as a key production component, fosters the emergence of new manufacturing and service sectors that are interconnected with various parts of the national economy [22]. The DE, supported by modern information networks, has blurred geographical distinctions and enhanced both local and neighboring urban development quality [23].
Data possess technical and economic properties that are fundamentally integrative, collaborative, and highly available [24]. These characteristics enable data to improve business relationships and collaboration at the small level, while at the large level, they can double social value generation and enhance residents’ quality of life in the immediate and surrounding areas [8]. Concurrently, the DE has facilitated cross-regional growth and support, significantly improving access to knowledge and information, and mitigating the diminishing effects of geographical distance on technology spillovers between regions [24]. This offers a potential pathway to reduce developmental disparities between urban areas. Research indicates that the DE has spatial spillover effects on both ecological environments and ED in neighboring urban areas [10]. Based on these views, we propose the following hypothesis:
H1. 
The DE can help to expand the sustainable urban ED.

2.2. The Role of Human Capital

In discussions about the development and prosperity of countries and regions over recent decades, the study of human capital has become increasingly significant [25]. This importance arises because advanced societies have progressively transitioned toward a “knowledge-based economy”. The impacts of human capital on regions can be categorized into two distinct sets: one resembling national impact and the other diverging from them [26]. Firstly, similar to national economies, regional human capital affects overall economic productivity through related externalities. Secondly, human capital within a region can lead to significant spatial redistributions of resources, differing from the patterns observed at the national level.
Venables [27] notes that urban areas are becoming increasingly central to the global economy, encompassing both industrialized and emerging economies. Beyond this scale effect, cities are assumed to play a more qualitative role, which contributes to the scale effect itself. This suggests that, in light of human capital considerations, cities serving as hubs for knowledge exchange will increasingly attract individuals with human capital as workers migrate in response to higher wages associated with knowledge-based roles. Research indicates a growing concentration of university-educated workers in cities. Additionally, there appears to be a correlation between the percentage of educated workers and human capital, both of which are linked to urban expansion [28].
The rise of new industries has fundamentally altered the demand for human capital, necessitating a higher number of highly skilled workers. Consequently, shifting consumer demands have prompted workers to enhance their skill sets, thereby increasing the region’s human capital [29]. Moreover, greater human capital has become a key factor in the superior ED observed in Chinese cities [30]. As human capital levels rise, high-skilled physical capital contributes to increased labor productivity and high-quality economic growth in China [31]. The application of data technologies has also facilitated the dissemination of educational information, breaking geographical barriers to knowledge and technology [29].
These technological advancements have led to transformative changes in human capital, both in terms of the origins and progress of technology and its role in users’ lives [31]. Human capital must acquire new competencies, including technical skills from human–machine interactions and behavioral changes such as improved communication, ethical behavior, and new abilities in virtual interactions. By leveraging organizational incentives in this area, human capital can continue to drive technological advancement, with educational attainment serving as an indicator of credentials and supplementary qualifications [32]. Human capital not only supports industrial upgrading but also reinforces the DE. Furthermore, industrial intelligence remains in its nascent stages due to inadequately developed industrial sectors in China and other developing nations [24]. Therefore, to fully benefit from industrial intelligence, other factors must be considered, with human capital playing a crucial role as an “intellectual factor” essential for the country’s initial and sustainable development [33].
Theoretically, the growth of human capital can enhance economic income and subsequently increase the reliance of rapidly industrializing and urbanizing economies on energy, which can be counterproductive to pollution reduction [34]. To balance economic growth with environmental preservation, human capital, like other natural resource endowments, must be effectively developed and directed toward economic activities [35]. As the fusion of “capability” and “wisdom” in the DE, industrial intelligence requires substantial “intellectual capital”, such as human capital, to foster its growth. Increased human capital levels lead to enhanced analytical and problem-solving abilities, greater innovation potential, and improved productivity through the effective use of smart technology [36]. Based on these views, we propose the following hypotheses:
H2. 
Human capital is valuable for sustainable urban ED.
H3. 
Human capital positively moderates the connection between the DE and sustainable urban ED.

2.3. The Role of Government Support

Government support is a crucial mechanism for counteracting economic downturns, fostering superior ED, and enhancing national governance [5]. In particular, government support plays a vital role in driving high levels of urban ED. In China, for instance, the government actively oversees industrial progress and advocates for the DE to stimulate economic growth [37]. Such support enables industries to participate in environmental cleanup initiatives and promotes green innovation. Without governmental backing, progress, especially in the DE, would be significantly impeded. Government support alleviates financial pressures, reduces production costs, and facilitates industry restructuring. Additionally, the government provides subsidies aimed at controlling carbon emissions in China [5].
Furthermore, governmental influence compels authorities to establish regulations and policies designed to foster urban development [38]. This underscores the heightened significance of government support in China, where continuous oversight is pivotal [39]. The Chinese government implemented effective regulations to encourage environmentally friendly practices in cities. In the realm of DE, government regulations facilitate fair practices and transparency through digital platforms [39]. Government support is essential for advancing regional ecological well-being via the DE. The effectiveness of the DE hinges on technological advancements that enhance the service scope, operational efficiency, and address information asymmetries. Contemporary digital technologies are instrumental in expanding service capabilities and internal momentum for improving ecological well-being, particularly in the context of environmental regulation [8].
The term DE encompasses the integration of modern technologies and digital tools, such as social media, mobile applications, and e-commerce, into business practices [40]. Government support includes policy-backing and specific investments that bolster new industries or strategic national sectors, as shown by Guo et al. [41]. The growth of the DE is closely linked to governmental support, given its novel state and model. Government policies significantly influence the pace and direction of technological progress, as supported by empirical research [42]. To enhance the growth of the DE, the Chinese government continues to provide support through funding for science and technology and research and development subsidies. This assistance not only helps to restructure industries but also eases financial burdens.
Recent academic studies discovered the theoretical implications of official policies on DE growth. For example, Zhong, Liu, and Li [43] examined DE strategies in developed countries such as the United States and the United Kingdom, comparing them with China’s DE status. Their research investigated emerging trends in digitization and international investment. They argued that active governmental involvement is crucial for advancing the DE through increased consumer subsidies and market stimulation. Fan and Hao [44] emphasized that tax policies are foundational and catalytic for the high-quality growth of the DE. They identified the interaction of consumption, manufacturing, market creation, and sectoral development as key funding sources for this advancement. Based on these insights, we propose the following hypotheses:
H4. 
Government support is valuable for sustainable urban ED.
H5. 
Government support positively and moderately affects the connection between the DE and sustainable urban ED.

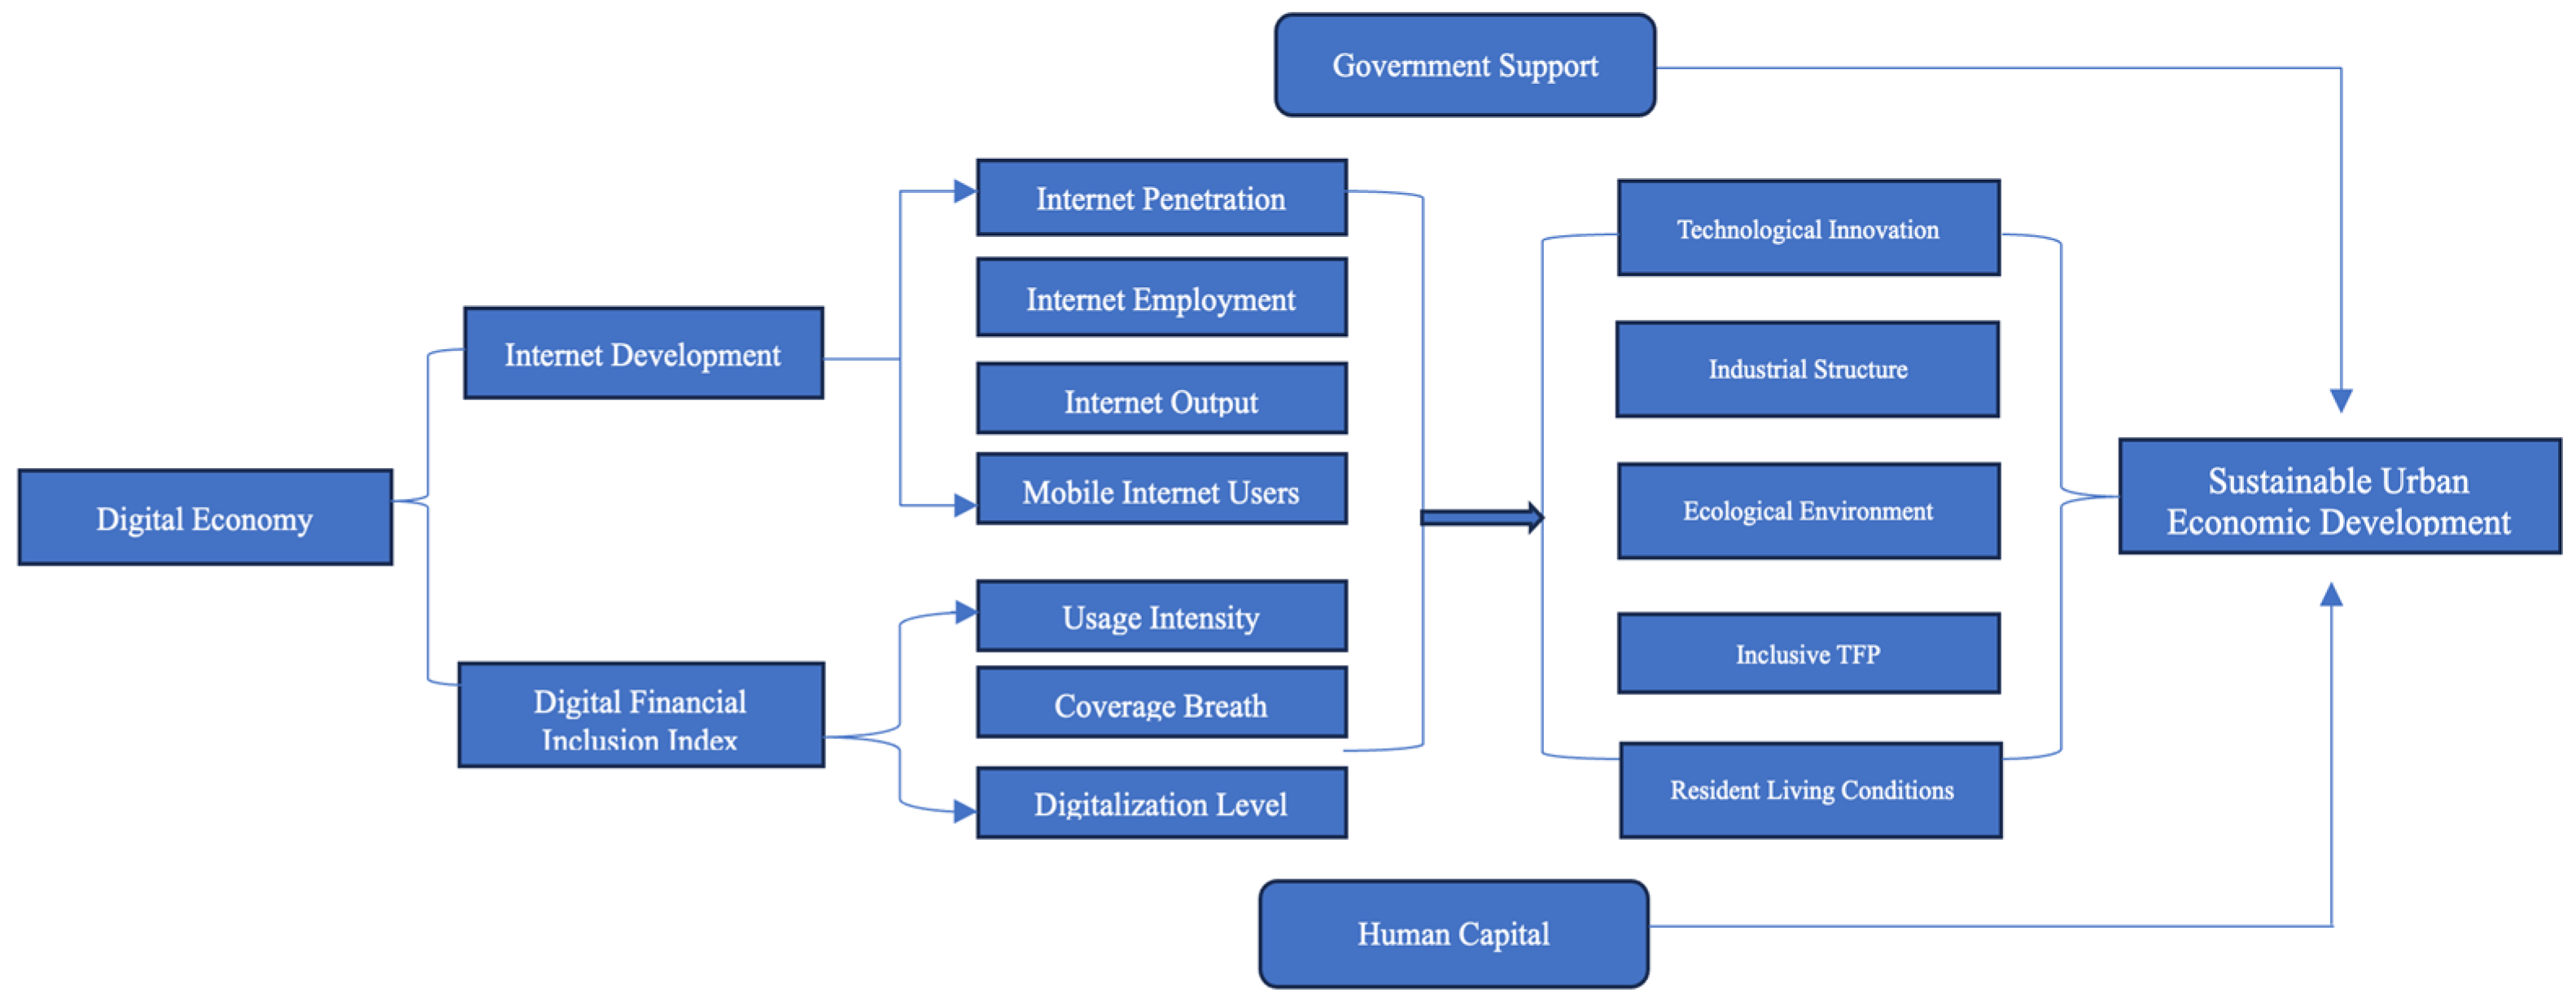
3. Materials and Methods

3.1. Data Sources

We utilized different sources to gather data, including the China Statistical Yearbook, the China Population and Employment Statistics Yearbook, and the China Finance Yearbook, covering the period from 2011 to 2019. Data on digital finance are gathered from the Institute of Digital Finance’s official website at Peking University, which uses the overall digital finance index figured out by Guo, Wang, Wang, Kong, Zhang, and Cheng [41]. The reason for choosing this period is because the digital finance index was developed in 2011 by Peking University. Moreover, this period is critical for the Chinese DE because of the higher development and planning. Finally, we compiled a panel dataset comprising observations from 284 cities in 30 Chinese provinces spanning the years 2011 to 2019 for the purpose of this study.

3.2. Variables Measures

3.2.1. Sustainable Urban Economic Development (ED)

In this study, sustainable urban ED is treated as the dependent variable, with a focus on assessing its quality. To ensure the precision of the results, it is essential to employ accurate measurements of the relevant variables. Consequently, we meticulously selected various indicators that capture the sustainable ED. Prior research has advocated for a comprehensive indexing system to assess this quality [45]. Utilizing city-level data, we identified key variables encompassing five dimensions: technological innovation, industrial structure, ecological environment, inclusive total factor productivity (TFP), and resident living conditions, which are integral to evaluating sustainable urban ED. The composition of the index is detailed in Table 1. Nominal data of growth were adjusted to real variables to accurately reflect changes in economic growth. Per capita figures were derived from the total population of each city at year-end. Different forms of industrial structures were assessed using a Thiel index and the ratio of the tertiary value added to secondary industries [46]. The representation of the service sector was indicated by the percentage of workers employed to urban workers. The inclusive TFP was constructed using the Malmquist index and the super-efficiency SBM model. Labor and capital inputs were incorporated into these parameters. Finally, the entropy technique was employed to calculate the index for sustainable urban ED. The index computation details are presented in Table 1.

3.2.2. Digital Economy

This paper considers the DE as the primary explanatory variable. Following the framework established by Liang and Li [5], the assessment of the DE and its development encompasses both internet infrastructure and digital finance.
Firstly, the internet development index is evaluated using different internet indicators such as penetration, employment, outputs, and users. Secondly, the study utilizes the Digital Financial Inclusion Index developed by a research team from Ant Group and the Institute of Digital Finance at Peking University. The methodology for constructing this index is detailed by Guo, Wang, Wang, Kong, Zhang, and Cheng [41]. This index incorporates three supplementary indicators—usage intensity, coverage breadth, and digitalization level—to comprehensively represent the state of digital finance development in China [47]. The raw data furnished by Ant Financial are both reliable and representative, having been utilized in various empirical studies [5]. Thus, digital finance is measured using the Peking University Digital Financial Inclusion Index, which consists of an evaluation of coverage breadth (the number of electronic accounts) and usage depth (reflecting engagement in payment, investment, insurance, and credit activities).

3.2.3. Moderating Factors

We used two different variables as the moderator in this study. First, this study uses government support as a moderating variable. We measured government support as the percentage of government subsidies to local fiscal expenditure [5]. Second, we use human capital (HC) as the moderator. According to the human capital theory, human capital is defined as the capital created by human investment, particularly through monetary outlays for education and other activities that will benefit individuals for the rest of their lives [48]. Human capital not only contributes significantly to technological advancement and high-quality economic growth, but it also holds great promise for reducing carbon emissions and generating environmental benefits. Given the statistical scope and availability of city data, this paper, therefore, keeps in line with previous empirical studies and takes average years of schooling per capita to capture the effect of human capital, referring to [49].

3.2.4. Control Variables

To substantiate this study’s hypotheses, several control variables were included: Financial development (FD): This is measured as the ratio of loans and deposits held by banks and other institutions to GDP, as described by Hunjra et al. [50]. FDI is calculated as the percentage of total investment from abroad to GDP, following the methodology outlined by Chang and Li [51]. External openness (EXR): this variable represents the percentage of the sum of exports and imports to GDP. Population size (POP): this is determined by the total persons residing in the city permanently, as detailed by Bai and Lei [52].

3.3. Model Formulation

To investigate the nexus between the DE and sustainable urban ED along with moderators in the urban areas of China by utilizing benchmark regression methods, the following model is formulated:
E D i , t = α 1 + β 1 D E 1 i , t + β 2 H C 2 i , t + β 3 G S 3 i , t + β 4 D E 1 i , t H C 2 i , t + β 5 D E 1 i , t G S 2 i , t + γ 1 Z i , t + μ i , t
where, in Equation (1), ED demonstrates sustainable urban economic development; HC shows human capital; GS presents government support; D E 1 i , t H C 2 i , t is the interaction between the digital economy and human capital; and D E 1 i , t G S 2 i , t is the interaction between the digital economy and government support. Z i , t highlights the control variables and i and t symbolize cities and time, respectively.
To estimate the Spatial Durbin model (SDM) based on Hypothesis 1, the following model is constructed:
E D i , t = C + p W E D i , t + α 1 D E i t + p W D E i , t + δ i t Z i , t + μ i , t + θ t + E i , t
In Equation (2), i, t shows the cities and years. E D reveals sustainable urban economic development. D E i t presents the digital economy. W in the model stands for the spatial weight matrix of geographic distance. W is constructed in three stages: First, we calculated the distance between the cities. Second, the spatial weight matrix is constructed by taking the reciprocal of the distance. Lastly, the matrix is harmonized to determine the W. ρ represents the coefficient. The terms μ i and θ t , respectively, describe the individual and year-fixed effects. E i , t is a symbol of the perturbation term.

4. Empirical Findings

4.1. Descriptive Statistics and Correlation

Initially, we present the descriptive statistics for all variables under consideration. Table 2 summarizes the observations, means, standard deviations, minimum, and maximum values of these variables. Table 3 stipulates the correlation matrix, which confirms the significant correlation among all factors considered in this paper. Furthermore, the variance inflation factor (VIF) test is applied to detect the multicellularity issue, and the results of the VIF test confirm the absence of multicollinearity for all factors.

4.2. Spatial Autocorrelation Analysis

Before applying the spatial econometric analysis, it is crucial to assess whether spatial autocorrelation exists between the DE and sustainable urban ED. Table 4 shows the outcomes of Moran’s I for 2011–2019. The results reveal a positive spatial correlation between the DE and increased sustainable urban ED.

4.3. Spatial Spillover Effects

Table 5 displays the spatial autoregressive coefficient ρ in the Spatial Durbin model (SDM) regression, which adjusts for the fixed individual effects of cities and time and is significantly positive at a 1% confidence level. This finding highlights a strong positive spatial correlation in sustainable urban ED among cities, with the sustainable urban ED levels in neighboring areas also impacting the local sustainable urban ED levels.
Focusing on the regression coefficients of the core explanatory variables, it can be seen that the coefficient of the total effects DE is significantly positive, indicating that the development of the digital economy has significantly promoted sustainable urban ED. Meanwhile, the coefficient of the DE in the indirect effect is also positive, indicating that the digital economy can generate positive spillover effects and promote the sustainable development of neighboring economies. The digitization, tracking, connectivity, sharing, personalization, and directness of the digital economy have broken through the temporal and spatial limitations of factor flow and can promote sustainable economic development in neighboring areas.
China’s extensive territory and significant disparities in resource endowments contribute to substantial development gaps between cities, even within the same province. Cities with more abundant resources tend to have a stronger foundation for developing the DE, resulting in a higher DE level compared to neighboring cities. This disparity can exacerbate the sustainable urban ED gap between neighboring cities, leading to a “siphon effect” where the sustainable urban ED of adjacent cities is constrained. Consequently, the DE may not exhibit a positive spillover effect in the short term. These findings are consistent with those reported by Varlamova and Kadochnikova [53].
To validate the robustness of applying the SDM, we conducted a Likelihood Ratio (LR) and Wald test. The statistical outcomes from both tests show p-values less than 0.001, indicating that the SDM does not degrade into a Spatial Autoregressive Model (SAR) or a Spatial Error Model (SEM). Thus, the SDM is deemed appropriate for spatial analysis in this context.

4.4. Benchmark Regression Method

A notable concern with panel data is the potential presence of unobservable heterogeneity. Specifically, this issue pertains to the potential for heterogeneity, also known as the omission bias; this bias arises from unobservable, time-invariant variables that may affect the outcome but are not included in the model [54]. Conversely, variables that exhibit temporal variation and are not common across entities also pose challenges. To address these panel data issues, precise methodological approaches are required.
Consequently, this study employed benchmark regressions, including the fixed effects (FE) model. Table 6 presents the findings for all hypotheses from Model 1 to Model 7, utilizing the FE model, which aligns with our expectations. For instance, Model 1 demonstrates that the coefficient for the digital economy (DE) is significant at the 1% level, indicating a substantial contribution of the DE to sustainable urban ED.
Additionally, Model 2 reports a significant coefficient for the DE, government support, and human capital, all at the 1% level, highlighting the critical roles these factors play in stimulating sustainable urban ED. Model 3 shows that both the DE and government support significantly and positively affect sustainable urban ED at the 1% level; the interaction term (DE × GS) reflects a similar trend, indicating that government support plays a crucial moderating role in the relationship between the DE and sustainable urban ED.
Furthermore, Model 4 indicates that the DE and government support significantly and positively influence sustainable urban ED at the 1% level, with the interaction term (DEGS) emphasizing the same trend. Among the controlling factors, financial development (FD) in Model 4 demonstrates a significantly negative relationship with sustainable urban ED at the 1% level. The results for Model 5 show significant coefficients for the DE and government support, both at the 1% level, while the interaction term (DEGS) underscores a significantly positive relationship with sustainable urban ED. The controlling factors FD and FDI also demonstrate significant associations with sustainable urban ED.
Moreover, Model 6 demonstrates a significantly positive relationship between the DE, government support (GS), and sustainable urban ED at the 1% level, with the interaction term (DEGS) reflecting the same trend. Among the controlling factors, FD, FDI, and external openness (EXR) in Model 4 show significant relationships with sustainable urban ED. The results for Model 7 indicate a significantly positive connection between the DE, GS, and sustainable urban ED at the 1% level, while the interaction term (DEGS) also highlights the same relationship. Among the controlling factors, FD, FDI, EXR, and population (POP) in Model 4 demonstrate significant relationships with sustainable urban ED at different significance levels.

4.5. Endogeneity Problem

In this study, we used city-level panel data, which are often prone to endogeneity problems. Endogeneity in econometrics arises when an explanatory variable is connected with the error term. Semykina and Wooldridge [55] highlight that endogeneity can stem from issues such as sample selection, simultaneity, and omitted variables. To tackle endogeneity and improve the accuracy of our findings, we applied the Generalized Method of Moments (GMM), a robust method designed to address endogeneity in panel data.
Several scholars such as Lahouel et al. [56] and Javeed et al. [57] advocate for the use of the GMM to address panel data issues and mitigate endogeneity. Accordingly, Table 7 exhibits the coefficients for the DE model related to hypothesis 1 (H1). The application of the GMM produced statistically significant and predominantly positive results. Similarly, Models 2 and 3, related to hypotheses 2 (H2) and 3 (H3), also demonstrate significant and generally favorable outcomes through the use of the GMM. Furthermore, the GMM model was employed to validate the results of hypotheses 4 (H4) and 5 (H5). The final GMM application effectively corrected for endogeneity and corroborated the results of all preceding hypotheses.

4.6. Robustness Test

Heteroscedasticity Test

In statistics, an outlier is a data point that significantly departs from other observations and may indicate experimental errors, leading to its exclusion from the dataset [58]. Moreover, when all random variables in a series exhibit the same limited variance, it is referred to as homoscedasticity, which denotes uniformity in variance. Qiu et al. [59] addressed challenges related to heteroscedasticity and outliers by using Feasible Generalized Least Squares (FGLS). As a result, we utilized the FGLS model to further explore our research questions and verify prior results.
Table 8 presents the outcomes of the FGLS robustness test, showing that Models 1 through 5 exhibit positive and statistically significant coefficient values for each proposed hypothesis. The robustness test corroborates the positive link between the DE and sustainable urban ED. Additionally, it supports the roles of human capital and government support in promoting economic growth. Notably, the test also confirms the moderating effect of human capital and government support on the affiliation between the DE and sustainable urban ED.

5. Results Discussion

The first aim of the paper is to examine the influence of the DE on sustainable urban ED in China. The findings suggest that an improved urban quality of life is strongly associated with the expansion of the digital economy (DE), as cities benefit from economic agglomeration and talent concentration, driving growth through industrial advancements and efficient resource management [60]. In the era of big data, the DE serves as a catalyst for urban economic growth by fostering innovation, improving service delivery, and creating new opportunities. As cities continue to embrace these digital transformations, they can build more resilient, sustainable, and prosperous urban environments [61]. Furthermore, it aids national integration into the global market, enhances labor and capital productivity, and reduces transaction costs, all of which contribute to better urban development. The broader impacts of a thriving DE extend far beyond immediate economic benefits. They encompass profound changes in labor dynamics, social structures, environmental sustainability, and governance, ultimately shaping the future of societies and their positions within the global landscape. Embracing these changes can lead to more inclusive, innovative, and resilient economies. As a transformative factor in urbanization in China, the DE simplifies the lives of people, particularly those living in urban areas, by improving their accessibility to and utilization of funds, thereby fostering urban development [18]. The rise of the DE also indirectly supports urban development by advancing industrial modernization [62], aligning with the conclusions of Zhu and Zhen [8]. The expansion of the DE also creates new opportunities, such as easy access to financial services and global markets, remote work, online businesses, and others, for people living in urban areas, thus contributing to improved urban development [63].
The secondary aim is to explore the moderating role of human capital and government support in the nexus between the DE and sustainable urban ED. The results confirm that human capital is crucial for achieving superior urban development. It is the backbone of urban development, influencing economic growth, social cohesion, innovation, and sustainability. By investing in education, training, and skill development, cities can create environments that foster prosperity and enhance the quality of life for all residents [64]. Like national economies, regional human capital levels influence overall productivity [25]. Human capital includes skills, knowledge, and competitive advantages that drive urban development [29]. Higher human capital is increasingly recognized as vital for superior economic growth in Chinese cities [30]. Supporting this, research by Abel and Gabe [65] highlights the effects of human capital on urban ED. The findings demonstrate that human capital positively influences the connection between the DE and improved urban development. In the context of digitization, human capital is essential [31]. It facilitates the creation of new technologies and enhances organizational capabilities through education and credentials [32]. Human capital is key to driving the DE and industrial upgrades. To maximize the benefits of industrial intelligence, it is important to consider other factors, with human capital being a crucial intellectual component for sustained development [33]. However, rapid industrialization and urbanization driven by human capital may increase energy consumption and pollution [34].
Moreover, the results highlight the significant role of government support in sustainable urban ED. Government assistance is vital for promoting urban economic growth [5]. The government implements various policies related to infrastructure development, tax incentives, research and development, green practices, workforce development, and economic diversification, all of which help to achieve sustainable urban ED. Wu [66] underscores that strategic government support is essential for achieving higher levels of urban economic growth. The Chinese government actively supports industrial development and the DE to drive economic progress [37]. By fostering skill development and industrial upgrades, government support enhances sustainable urban ED [38]. The findings also emphasize the important moderating influence of government support on the connection between the DE and sustainable urban ED. Government initiatives are crucial for improving economic conditions, and China’s shift toward a DE is strongly supported by these initiatives [39]. The Chinese government follows policies to advance the DE due to its extensive engagement with digital technologies globally [8]. In the current era, digitization is essential, and Chinese authorities are developing effective strategies to further advance the DE [67].

6. Conclusions

Urbanization remains a critical focus for policymakers aiming to improve economic living standards. Governments worldwide, including those in China, are dedicated to enhancing the quality of urban development. Notably, China’s advanced level of digitization presents a significant advantage for its authorities. Globally, and particularly in China, the importance of the digital economy (DE) has been increasingly recognized. In the digital era, technology is integral to managing national economies. Consequently, this study explores the potential of the DE to enhance sustainable urban economic development (ED), with government support and human capital serving as moderating factors.
Urban development, as a component of economic growth, may be significantly influenced by the DE, which offers new opportunities to unlock the capabilities and potential of the Chinese economy. For this analysis, we utilized panel data from 284 Chinese cities spanning 2011 to 2019. Our approach involved examining the role of the DE from various perspectives to ensure accurate results. We employed several econometric techniques, including the Spatial Durbin model (SDM) in conjunction with Moran’s I test, benchmark regression using the fixed effects (FE) model, the Generalized Method of Moments (GMM) model to tackle endogeneity, and the Feasible Generalized Least Squares (FGLS) model for robustness testing and to manage heteroscedasticity in the panel data.
The empirical findings from the Spatial Durbin model demonstrate that the DE has a substantial positive spillover effect on sustainable urban ED. Specifically, the DE not only promotes robust economic growth within cities but also effectively stimulates growth in neighboring regions, illustrating the “neighborhood-building” benefits of the DE. Our other econometric methods led to several key conclusions. First, the DE significantly contributes to sustainable urban ED. Second, the role of human capital is crucial, as it enhances the quality of urban development. Third, human capital is identified as a positive moderator in the relationship between the DE and sustainable urban ED. Furthermore, government support is essential for fostering sustainable urban ED and serves as an effective moderator in the connection between the DE and sustainable urban ED.

6.1. Implications

We recommend following policy guidelines relying on the outcomes of this paper. First, the Chinese government should actively foster the expansion of the DE and transform it into a sustainable driver of ED. This initiative will accelerate industrial and digital industrialization, promoting a deeper and more integrated connection between digital and traditional economies. To support the high-quality development of urban economies, it is essential to exploit the advantages of big data. The government should focus on removing barriers and facilitating the effective flow of resources while exploring diverse pathways for DE advancement.
The Chinese government should prioritize the development of human capital to enhance urban development. Human capital encompasses attributes such as loyalty, timeliness, skills, and expertise, which are highly valued by businesses and critical for advancing urban development, particularly in developing economies. A skilled and experienced workforce is crucial in the DE context. To strengthen the connection between the DE and sustainable urban ED, it is important to recognize and bolster the role of human capital. Policymakers should acknowledge its significance and integrate it into regional development strategies for better outcomes.
Government support remains pivotal for advancing sustainable urban ED. As digitization progresses rapidly in China, supportive policies are essential. Other economies should also consider the impact of government support in fostering urban development and transitioning to the DE. Future governmental efforts should include formulating policies that align with DE development and directing social capital toward essential infrastructure components. To stimulate the growth of the DE, the government should recognize the critical role of financial resources and allocate increased funding to technological and scientific innovation. This approach should extend beyond regional centers to other cities and rural areas, leveraging the spatial spillover effects of the sector and implementing inclusive policies to ensure widespread benefits.
Strengthening digital industrialization and the digitization of industries requires leveraging the full potential of digital technology. Efforts should focus on expanding the digital information sector, developing industry chains and clusters, and harnessing data as a key market component. Provinces not designated as pilot zones should tailor their strategies to local conditions, including ED levels, resource mobilization capabilities, institutional environments, and big data strategic planning. Additionally, enhancing digital literacy and skills among rural residents, alongside improving digital infrastructure, will contribute to more inclusive growth in the DE. These recommendations aim to ensure that the DE’s benefits are maximized, leading to sustainable urban ED.

6.2. Limitations

This study acknowledges several limitations. Firstly, due to data constraints for certain variables, the analysis is confined to city-level data examining the influence of the DE on sustainable urban ED between 2011 and 2019. Secondly, this study considered only two moderating factors—human capital and government support—in analyzing the connection between the DE and sustainable urban ED. Future research could find other governance factors or micro-level variables, such as gender diversity, industrial structure, and top management. Thirdly, while this paper briefly inspects the geographic diffusion of the DE in relation to sustainable urban ED, further investigation is needed to assess how variations in study areas, timeframes, and indicator systems might influence this relationship. Finally, this study is limited by the availability of data, which restricts the assessment of the DE to aspects such as internet development and digital finance. A more thorough exploration could benefit from including other significant digital technologies, such as artificial intelligence, to fully capture the scope of the DE.

Author Contributions

R.L.: formal analysis and writing—original draft. S.A.J.: conceptualization, writing—original draft. All authors have read and agreed to the published version of the manuscript.

Funding

There is no external funding involved in this study.

Institutional Review Board Statement

Not Applicable.

Informed Consent Statement

Not Applicable.

Data Availability Statement

The data presented in this study are available on request from the corresponding author.

Conflicts of Interest

The authors declare no conflicts of interest.

References

  1. Jiang, Q.; Li, Y.; Si, H. Digital economy development and the urban–rural income gap: Intensifying or reducing. Land 2022, 11, 1980. [Google Scholar] [CrossRef]
  2. Goldfarb, A.; Tucker, C. Digital economics. J. Econ. Lit. 2019, 57, 3–43. [Google Scholar] [CrossRef]
  3. Li, J.; Lu, M.; Lu, T. Constructing compact cities: How urban regeneration can enhance growth and relieve congestion. Econ. Model. 2022, 113, 105828. [Google Scholar] [CrossRef]
  4. Yaoteng, Z.; Xin, L. Research on green innovation countermeasures of supporting the circular economy to green finance under big data. J. Enterp. Inf. Manag. 2022, 35, 1305–1322. [Google Scholar] [CrossRef]
  5. Liang, L.; Li, Y. How does government support promote digital economy development in China? The mediating role of regional innovation ecosystem resilience. Technol. Forecast. Soc. Chang. 2023, 188, 122328. [Google Scholar] [CrossRef]
  6. Huang, L.; Zhang, H.; Si, H.; Wang, H. Can the digital economy promote urban green economic efficiency? Evidence from 273 cities in China. Ecol. Indic. 2023, 155, 110977. [Google Scholar] [CrossRef]
  7. Luo, S.; Yimamu, N.; Li, Y.; Wu, H.; Irfan, M.; Hao, Y. Digitalization and sustainable development: How could digital economy development improve green innovation in China? Bus. Strategy Environ. 2023, 32, 1847–1871. [Google Scholar] [CrossRef]
  8. Song, M.; Zheng, C.; Wang, J. The role of digital economy in China’s sustainable development in a post-pandemic environment. J. Enterp. Inf. Manag. 2022, 35, 58–77. [Google Scholar] [CrossRef]
  9. Zou, J.; Deng, X. To inhibit or to promote: How does the digital economy affect urban migrant integration in China? Technol. Forecast. Soc. Chang. 2022, 179, 121647. [Google Scholar] [CrossRef]
  10. Xue, Y.; Tang, C.; Wu, H.; Liu, J.; Hao, Y. The emerging driving force of energy consumption in China: Does digital economy development matter? Energy Policy 2022, 165, 112997. [Google Scholar] [CrossRef]
  11. Chen, X.; Yan, D.; Chen, W. Can the digital economy promote FinTech development? Growth Chang. 2022, 53, 221–247. [Google Scholar] [CrossRef]
  12. Zhang, T.; Shi, Z.-Z.; Shi, Y.-R.; Chen, N.-J. Enterprise digital transformation and production efficiency: Mechanism analysis and empirical research. Econ. Res. Ekon. Istraživanja 2022, 35, 2781–2792. [Google Scholar] [CrossRef]
  13. Li, T.; Yang, L. The effects of tax reduction and fee reduction policies on the digital economy. Sustainability 2021, 13, 7611. [Google Scholar] [CrossRef]
  14. Zhang, Y.; Ran, C. Effect of digital economy on air pollution in China? New evidence from the “National Big Data Comprehensive Pilot Area” policy. Econ. Anal. Policy 2023, 79, 986–1004. [Google Scholar] [CrossRef]
  15. Matthess, M.; Kunkel, S. Structural change and digitalization in developing countries: Conceptually linking the two transformations. Technol. Soc. 2020, 63, 101428. [Google Scholar] [CrossRef]
  16. Chen, Y. Improving market performance in the digital economy. China Econ. Rev. 2020, 62, 101482. [Google Scholar] [CrossRef]
  17. Litvinenko, V. Digital economy as a factor in the technological development of the mineral sector. Nat. Resour. Res. 2020, 29, 1521–1541. [Google Scholar] [CrossRef]
  18. Wang, D.; Zhou, T.; Wang, M. Information and communication technology (ICT), digital divide and urbanization: Evidence from Chinese cities. Technol. Soc. 2021, 64, 101516. [Google Scholar] [CrossRef]
  19. Zhang, X.-Z.; Liu, J.-J.; Xu, Z.-W. Tencent and Facebook data validate Metcalfe’s law. J. Comput. Sci. Technol. 2015, 30, 246–251. [Google Scholar] [CrossRef]
  20. Chen, S.; Chen, D. Air pollution, government regulations and high-quality economic development. Econ. Res. J 2018, 53, 20–34. [Google Scholar]
  21. Li, Z.; Wang, J. The dynamic impact of digital economy on carbon emission reduction: Evidence city-level empirical data in China. J. Clean. Prod. 2022, 351, 131570. [Google Scholar] [CrossRef]
  22. Ali, M.A.; Hoque, M.R.; Alam, K. An empirical investigation of the relationship between e-government development and the digital economy: The case of Asian countries. J. Knowl. Manag. 2018, 22, 1176–1200. [Google Scholar] [CrossRef]
  23. Leyshon, A. Economic geography II: The economic geographies of the COVID-19 pandemic. Prog. Hum. Geogr. 2023, 47, 353–364. [Google Scholar] [CrossRef] [PubMed]
  24. Guo, B.; Wang, Y.; Zhang, H.; Liang, C.; Feng, Y.; Hu, F. Impact of the digital economy on high-quality urban economic development: Evidence from Chinese cities. Econ. Model. 2023, 120, 106194. [Google Scholar] [CrossRef]
  25. Cooke, F.L.; Dickmann, M.; Parry, E. Important issues in human resource management: Introduction to the 2020 review issue. Int. J. Hum. Resour. Manag. 2020, 31, 1–5. [Google Scholar] [CrossRef]
  26. Wang, Y.; Liu, S. Education, human capital and economic growth: Empirical research on 55 countries and regions (1960–2009). Theor. Econ. Lett. 2016, 6, 347–355. [Google Scholar] [CrossRef]
  27. Venables, A.J. Geographical economics: Notes on Africa. J. Dev. Perspect. 2005, 1, 63–84. [Google Scholar]
  28. Berry, C.R.; Glaeser, E.L. The divergence of human capital levels across cities. Pap. Reg. Sci. 2005, 84, 407–444. [Google Scholar] [CrossRef]
  29. Kiuru, J.; Inkinen, T. Predicting innovative growth and demand with proximate human capital: A case study of the Helsinki metropolitan area. Cities 2017, 64, 9–17. [Google Scholar] [CrossRef]
  30. Fleisher, B.; Li, H.; Zhao, M.Q. Human capital, economic growth, and regional inequality in China. J. Dev. Econ. 2010, 92, 215–231. [Google Scholar] [CrossRef]
  31. Sulisnaningrum, E.; Widarni, E.L.; Bawono, S. Causality Relationship Between Human Capital, Technological Development and Economic Growth. J. Manag. Econ. Ind. Organ. JOMEINO 2022, 6, 1–12. [Google Scholar] [CrossRef]
  32. Gambardella, A.; Panico, C.; Valentini, G. Strategic incentives to human capital. Strateg. Manag. J. 2015, 36, 37–52. [Google Scholar] [CrossRef]
  33. Agolla, J.E. Human capital in the smart manufacturing and industry 4.0 revolution. Digit. Transform. Smart Manuf. 2018, 2, 41–58. [Google Scholar]
  34. Fang, Z.; Chen, Y. Human capital and energy in economic growth—Evidence from Chinese provincial data. Energy Econ. 2017, 68, 340–358. [Google Scholar] [CrossRef]
  35. Kurtz, M.J.; Brooks, S.M. Conditioning the “resource curse”: Globalization, human capital, and growth in oil-rich nations. Comp. Political Stud. 2011, 44, 747–770. [Google Scholar] [CrossRef]
  36. Zhang, Y.-J. The impact of financial development on carbon emissions: An empirical analysis in China. Energy Policy 2011, 39, 2197–2203. [Google Scholar] [CrossRef]
  37. Zhong, Q.; Wen, H.; Lee, C.-C. How does economic growth target affect corporate environmental investment? Evidence from heavy-polluting industries in China. Environ. Impact Assess. Rev. 2022, 95, 106799. [Google Scholar] [CrossRef]
  38. Dudzic-Gyurkovich, K. Urban development and population pressure: The case of Młynówka Królewska Park in Krakow, Poland. Sustainability 2021, 13, 1116. [Google Scholar] [CrossRef]
  39. Zhang, W.; Zhao, S.; Wan, X.; Yao, Y. Study on the effect of digital economy on high-quality economic development in China. PLoS ONE 2021, 16, e0257365. [Google Scholar] [CrossRef]
  40. Pan, W.; Xie, T.; Wang, Z.; Ma, L. Digital economy: An innovation driver for total factor productivity. J. Bus. Res. 2022, 139, 303–311. [Google Scholar] [CrossRef]
  41. Guo, F.; Wang, J.; Wang, F.; Kong, T.; Zhang, X.; Cheng, Z. Measuring China’s digital financial inclusion: Index compilation and spatial characteristics. China Econ. Q. 2020, 19, 1401–1418. [Google Scholar]
  42. Winthrop, M.F.; Deckro, R.F.; Kloeber, J.M., Jr. Government R&D expenditures and US technology advancement in the aerospace industry: A case study. J. Eng. Technol. Manag. 2002, 19, 287–305. [Google Scholar]
  43. Zhong, C.; Liu, C.; Li, Y. Actively respond to the “Digital economy”: The gap between China and the United States, causes and countermeasures. Econ. Rev. 2017, 4, 41–47. [Google Scholar]
  44. Fan, Y.; Hao, X. Financial assistance for high-quality development of digital economy: Core mechanism and experience enlightenment. Reform 2020, 8, 83–91. [Google Scholar]
  45. Tao, Z.; Zhang, Z.; Shangkun, L. Digital economy, entrepreneurship, and high-quality economic development: Empirical evidence from urban China. Front. Econ. China 2022, 17, 393. [Google Scholar]
  46. Liu, S.; Liu, C.; Yang, M. The effects of national environmental information disclosure program on the upgradation of regional industrial structure: Evidence from 286 prefecture-level cities in China. Struct. Chang. Econ. Dyn. 2021, 58, 552–561. [Google Scholar] [CrossRef]
  47. Yan, B.; Wang, F.; Chen, T.; Liu, S.; Bai, X. Digital finance, environmental regulation and emission reduction in manufacturing industry: New evidence incorporating dynamic spatial-temporal correlation and competition. Int. Rev. Econ. Financ. 2023, 83, 750–763. [Google Scholar] [CrossRef]
  48. Becker, G.S.; Barro, R.J. A reformulation of the economic theory of fertility. Q. J. Econ. 1988, 103, 1–25. [Google Scholar] [CrossRef]
  49. Bano, S.; Zhao, Y.; Ahmad, A.; Wang, S.; Liu, Y. Identifying the impacts of human capital on carbon emissions in Pakistan. J. Clean. Prod. 2018, 183, 1082–1092. [Google Scholar] [CrossRef]
  50. Hunjra, A.I.; Azam, M.; Bruna, M.G.; Taskin, D. Role of financial development for sustainable economic development in low middle income countries. Financ. Res. Lett. 2022, 47, 102793. [Google Scholar] [CrossRef]
  51. Chang, S.-C.; Li, M.-H. Impacts of foreign direct investment and economic development on carbon dioxide emissions across different population regimes. Environ. Resour. Econ. 2019, 72, 583–607. [Google Scholar] [CrossRef]
  52. Bai, C.; Lei, X. New trends in population aging and challenges for China’s sustainable development. China Econ. J. 2020, 13, 3–23. [Google Scholar] [CrossRef]
  53. Varlamova, J.; Kadochnikova, E. Modeling the spatial effects of digital data economy on regional economic growth: SAR, SEM and SAC models. Mathematics 2023, 11, 3516. [Google Scholar] [CrossRef]
  54. Bonhomme, S.; Manresa, E. Grouped patterns of heterogeneity in panel data. Econometrica 2015, 83, 1147–1184. [Google Scholar] [CrossRef]
  55. Semykina, A.; Wooldridge, J.M. Estimating panel data models in the presence of endogeneity and selection. J. Econom. 2010, 157, 375–380. [Google Scholar] [CrossRef]
  56. Lahouel, B.B.; Gaies, B.; Zaied, Y.B.; Jahmane, A. Accounting for endogeneity and the dynamics of corporate social–corporate financial performance relationship. J. Clean. Prod. 2019, 230, 352–364. [Google Scholar] [CrossRef]
  57. Javeed, S.A.; Latief, R.; Cai, X.; San Ong, T.; Qian, S.; Haq, A.U. What is the role of the board sustainable committee for corporate social responsibility? The moderating effect of gender diversity and ownership concentration. J. Clean. Prod. 2022, 379, 134710. [Google Scholar] [CrossRef]
  58. Fan, X.; Peng, Z. A comparative analysis of the outliers influence using GMM estimation based on dynamic panel data model. Appl. Econ. Lett. 2024, 31, 170–175. [Google Scholar] [CrossRef]
  59. Qiu, Y.; Wang, Z.; Xie, T.; Zhang, X. Forecasting Bitcoin realized volatility by exploiting measurement error under model uncertainty. J. Empir. Financ. 2021, 62, 179–201. [Google Scholar] [CrossRef]
  60. Frick, S.A.; Rodríguez-Pose, A. Big or small cities? On city size and economic growth. Growth Chang. 2018, 49, 4–32. [Google Scholar] [CrossRef]
  61. Luo, K.; Liu, Y.; Chen, P.-F.; Zeng, M. Assessing the impact of digital economy on green development efficiency in the Yangtze River Economic Belt. Energy Econ. 2022, 112, 106127. [Google Scholar] [CrossRef]
  62. Jiang, S.; Zhou, J.; Qiu, S. Digital agriculture and urbanization: Mechanism and empirical research. Technol. Forecast. Soc. Chang. 2022, 180, 121724. [Google Scholar] [CrossRef]
  63. Deng, X.; Guo, M.; Liu, Y. Digital economy development and the urban-rural income gap: Evidence from Chinese cities. PLoS ONE 2023, 18, e0280225. [Google Scholar] [CrossRef] [PubMed]
  64. Clarke, T.; Gholamshahi, S. Developing human capital for knowledge based economies. In Innovation in the Asia Pacific: From Manufacturing to the Knowledge Economy; Springer: Berlin/Heidelberg, Germany, 2018; pp. 247–270. [Google Scholar]
  65. Abel, J.R.; Gabe, T.M. Human capital and economic activity in urban America. Reg. Stud. 2011, 45, 1079–1090. [Google Scholar] [CrossRef]
  66. Wu, F. Land financialisation and the financing of urban development in China. Land Use Policy 2022, 112, 104412. [Google Scholar] [CrossRef]
  67. Jiang, X. Digital economy in the post-pandemic era. J. Chin. Econ. Bus. Stud. 2020, 18, 333–339. [Google Scholar] [CrossRef]
Figure 1. Conceptual framework.
Sustainability 16 08973 g001
Table 1. Sustainable urban ED index computation.
Index Primary IndicatorsIndex Secondary IndicatorsIndex ExplanationSpecification
Technological innovationLicensing of patentsNo. of patents obtained per 10,000 individualsPositive
Rationalization of industrial structureA modified Thiel indexNegative
Industrial structureIndustrial structure advancementThe proportion of value added by the tertiary sector relative to that contributed by the secondary sectorPositive
Percentage of Producer ServicesThe percentage of Producer Services in Urban EmploymentPositive
Ecological environmentIndustrial Water WastageThe ratio of Industrial Water Wastage Discharge per capitaNegative
The emissions of Sulfur DioxideThe ratio of emissions of Sulfur Dioxide per capitaNegative
Industrial Dust emissionsThe ratio of Dust emissions per capitaNegative
Inclusive TFPThe index of inclusive TFPCalculated with the help of the DEA Positive
Malmquist productivity
index method
Resident living conditionsGDP per capitaGDP divided by the Urban PopulationPositive
Educational ExpensesExpenses made for education per capitaPositive
Number of Hospital BedsNo. of Hospital Beds per capitaPositive
Table 2. Descriptive statistics.
VariablesAbbreviationNMeanSDMinMax
Sustainable urban economic developmentED25560.05220.03410.00640.4677
Digital economyDE25560.16550.06540.01700.3216
Human capitalHC25560.00510.00430.00050.0542
Government supportGS25560.07880.02310.01580.1741
Financial developmentFD255641.0229.950210.1583.52
Foreign direct investmentFDI25561.66891.76060.000019.8813
Level of external openness EXR25566.47110.25386.14276.898
Population sizesPOP25560.10270.14060.00152.1749
Table 3. Correlation matrix.
VariablesHEDDEHCGSFDFDIEXR
ED1
DE0.4169 ***1
HC0.2789 ***0.206 ***1
GS0.0198−0.1179 ***−0.1215 ***1
FD0.3226 ***0.5572 ***0.4329 ***−0.0880 ***1
FDI0.2531 ***0.01210.1069 ***0.02880.1097 ***1
EXR0.1382 ***0.6212 ***0.2178 ***−0.1275 ***0.3791 ***−0.0848 ***1
POP0.5047 ***0.2379 ***0.2595 ***0.0704 ***0.3678 ***0.1703 ***0.077 ***
*** p < 0.01.
Table 4. Moran’s I.
Table 4. Moran’s I.
For ED For DE
VariablesIzp-Value *Izp-Value *
20110.3699.410.000.45611.5260.00
20120.3669.410.000.46811.8290.00
20130.4119.410.000.4511.3870.00
20140.3629.410.000.3879.7960.00
20150.3889.410.000.43310.9620.00
20160.3989.410.000.4210.6220.00
20170.3999.410.000.45811.590.00
20180.4059.410.000.52813.3280.00
20190.4189.410.000.53813.5940.00
* p < 0.1.
Table 5. Spatial autocorrelation analysis.
VARIABLESModel 1Model 2Model 3Model 4Model 5Model 6Model 7
EDEDEDEDED (Direct)ED (Indirect)ED (Total)
DE0.3936 ***−0.0462 ** 0.4432 ***0.5803 ***1.0235 ***
(11.1005)(−2.4975) (10.8324)(7.4234)(9.1551)
ISU0.1168 ***−0.2172 *** 0.0837 **−0.3783 *−0.2946
(3.5216)(−3.0180) (2.0242)(−1.7763)(−1.2133)
FD−0.0006 ***0.0003 *** −0.0006 ***−0.0002−0.0008 ***
(−8.7310)(2.9895) (−8.9275)(−0.8648)(−3.0289)
FDI0.00000.0001 0.00010.00050.0006
(0.2438)(0.4610) (0.4419)(0.6921)(0.7231)
POP0.0059 ***0.0023 0.0073 ***0.01700.0244
(2.7050)(0.4436) (2.7459)(1.1850)(1.4998)
rho 0.6634 ***
(36.798)
sigma2_e 0.0001 ***
(34.337)
Observations2.5562.5562.5562.5562.5562.5562.556
R-squared0.09860.09860.09860.09860.09860.09860.0986
Number of id284284284284284284284
City FeYesYesYesYesYesYesYes
Year FeYesYesYesYesYesYesYes
z-statistics in parentheses; *** p < 0.01, ** p < 0.05, * p < 0.1; Log-likelihood = 8509.6638. //Wald test for SAR: chi2(4) = 16.84, Prob > chi2 = 0.0021. //Wald test for SEM: chi2(5) = 73.39, Prob > chi2 = 0.0000. LR test for SAR: Likelihood Ratio test LR chi2(5) = 22.24, (assumption: sar nested in sdm) Prob > chi2 = 0.0005. LR test for SEM: Likelihood Ratio test LR chi2(5) = 24.15, (assumption: sem nested in sdm) Prob > chi2 = 0.0002.
Table 6. Fixed effects.
Sustainable Urban Economic Development
VARIABLESModel 1 Model 2Model 3Model 4Model 5Model 6Model 7
DE0.1212 ***
(0.0037)
0.1311 ***
(0.00399)
0.09465 ***
(0.0044)
0.1379 *** (0.00695)0.1391 ***
(0.0070)
0.1373 ***
(0.0070)
0.1351 ***
(0.0070)
GS 0.08554 *** (0.01223)0.05867 ***
(0.01186)
0.05451 *** (0.01171)0.0544 ***
(0.0117)
0.0551 ***
(0.0117)
0.0548 ***
(0.0117)
HC 0.30295 ***
(0.0853)
−0.17405 **
(0.08678)
−0.0933 (0.08619)−0.0748
(0.0864)
−0.1166
(0.0896)
−0.1176
(0.0893)
DEGS 0.0005 ***
(0.00003)
0.00046 *** (0.00003)0.0005 ***
(0.00001)
0.0005 ***
(0.0000)
0.0005 ***
(0.0000)
DEHC −0.00006 *** (0.00001)−0.00005 *** (.000013)−0.0001 ***
(0.0000)
−0.0001 ***
(0.0000)
−0.0001 ***
(0.00001)
FD −0.00056 ***
(0.00007)
−0.0006 ***
(0.0001)
−0.0006 ***
(0.0001)
−0.0006 ***
(0.0001)
FDI 0.0006 ***
(0.0002)
0.0006 ***
(0.0002)
0.0006 ***
(0.0002)
EXR 0.0022 *
(0.0012)
0.0021 *
(0.0012)
POP 0.0105 ***
(0.0029)
Constant0.0322 ***
(0.0007)
0.01291 ***
(0.00269)
0.03884 ***
(0.00607)
0.05723 ***
(0.00642)
0.0559 *** (0.00643)0.04441***
(0.009)
0.04306 ***
(0.00915)
Observations2.5562.5562.5562.5562.5562.5562.556
R-squared0.89410.89700.90750.91000.91030.91040.9109
City FeYesYesYesYesYesYesYes
Province FeYesYesYesYesYesYesYes
*** p < 0.01, ** p < 0.05, * p < 0.1.
Table 7. GMM model.
Table 7. GMM model.
VariablesSustainable Urban Economic Development
Model 1Model 2Model 3Model 4Model 5
L_ED−0.03337
(0.0269)
0.5837 **
(0.0273)
−0.02013
(0.02717)
0.0229
(0.02715)
−0.0068 **
(0.0265)
DE0.147 ***
(0.01263)
0.101 ***
(0.1624)
0.038 *
(0.2267)
HC 0.821 ***
(0.131794)
−0.870 **
(0.4056)
DEHC 6.106 ***
(1.7008)
GS 0.151 ***
(0.1671)
−0.140 ***
(0.0532)
DEGS 1.462 ***
(0.2723)
FD−0.003 ***
(0.000118)
0.004 ***
(0.00009)
−0.002 *
(0.00012)
0.003 ***
(0.00009)
−0.005 ***
(0.0001)
FDI−0.006
(0.000345)
−0.002
(0.0037)
0.001
(0.00035)
−0.001
(0.00036)
0.001
(0.0003)
EXR0.002
(0.001654)
0.004 ***
(0.0017)
−0.001
(0.0017)
0.013 ***
(0.0017)
−0.003 *
(0.0017)
POP−0.012 ***
(0.00478)
0.010 **
(0.0051)
−0.011 *
(0.0048)
−0.014 ***
(0.00501)
−0.015 ***
(0.0047)
Constant0.045 ***
(0.00938)
−0.001
(0.0086)
0.056 ***
(0.0096)
−0.059 ***
(0.0089)
0.043 ***
(0.0124)
City feYesYesYesYesYes
Year feYesYesYesYesYes
N19881988198819881988
Wald Chi2473.11 ***323.41 ***497.81 ***389.33 ***610.05 ***
*** p < 0.01, ** p < 0.05, * p < 0.1.
Table 8. FGLS.
Table 8. FGLS.
VariablesSustainable Urban Economic Development
Model 1Model 2Model 3Model 4Model 5
DE0.153 ***
(0.0053)
0.142 ***
(0.0074)
−0.004
(0.0133)
HC 0.304 ***
(0.8674)
0.003
(0.1778)
DEHC 3.489 ***
(0.8902)
GS 0.053 ***
(0.1156)
−0.397 ***
(0.0321)
DEGS 2.272 ***
(0.1759)
FD−0.001 ***
(0.00003)
0.004 ***
(0.00003)
−0.001 ***
(0.00003)
0.004 ***
(0.00003)
−0.001 ***
(0.00003)
FDI0.003 ***
(0.00015)
0.003 ***
(0.00015)
0.003 ***
(0.0002)
0.003 ***
(0.00015)
0.003 ***
(0.00015)
EXR−0.001
(0.0012)
0.009 ***
(0.0012)
−0.003 ***
(0.0012)
0.011 ***
(0.0011)
−0.006 ***
(0.0013)
POP0.106 ***
(0.0047)
0.094 ***
(0.0049)
0.102 ***
(0.0046)
0.097 ***
(0.0048)
0.104 ***
(0.0045)
Constant0.021 ***
0.0074)
−0.047 ***
(0.0071)
0.037 ***
(0.0077)
−0.063 ***
(0.0071)
0.084 ***
(0.0091)
City feYesYesYesYesYes
Year feYesYesYesYesYes
N25562556255625562556
*** p < 0.01.
Disclaimer/Publisher’s Note: The statements, opinions and data contained in all publications are solely those of the individual author(s) and contributor(s) and not of MDPI and/or the editor(s). MDPI and/or the editor(s) disclaim responsibility for any injury to people or property resulting from any ideas, methods, instructions or products referred to in the content.

