Article

Integrating Machine Learning, Land Cover, and Hydrological Modeling to Contribute Parameters for Climate Impacts on Water Resource Management

1
Department of Geosciences, University of Texas-Permian Basin, Odessa, TX 79762, USA
2
Korea Environment Institute (KEI), 370 Sicheong-daero, Sejong 30147, Republic of Korea
3
Department of Civil Engineering, Seoil University, 28 Yongmasan-ro 90-gil, Jungnang-gu, Seoul 02192, Republic of Korea
*
Author to whom correspondence should be addressed.
Sustainability 2024, 16(20), 8805; https://doi.org/10.3390/su16208805
Submission received: 5 July 2024 / Revised: 20 August 2024 / Accepted: 30 September 2024 / Published: 11 October 2024
(This article belongs to the Section Sustainable Water Management)

Abstract

:
The purpose of this study is to establish basic policies for managing the impacts of climate change on water resources using the integration of machine learning and land cover modeling. We predicted future changes in land cover within the water management and assessed its vulnerability to climate change. After confirming this vulnerability, we considered measures to improve climate resilience and presented future water resource parameters. We reviewed the finances available to promote climate projects, noting the major river management funds. The future project will serve as a stepping stone to promote climate resilience projects addressing water resource challenges exacerbated by future climate change. The study examined the results of analyzing changes in land cover maps due to climate change and assessed vulnerability in water management areas until 2050. According to the analysis results, the regulations for our study areas were set lower than those for other water management zones, resulting in a high rate of urbanization. Therefore, the climate resilience project in the water management area should be implemented first, despite the need for a long-term view in adapting to climate change.

1. Introduction

The International Panel on Climate Change (IPCC) has reported that Korea is experiencing a warming trend and is expected to face more extreme weather events, including heavy rainfall and severe droughts, in the future [1]. Climate change also affects vegetation, causing changes in the flowering seasons as well as species of plants living in the area, eventually affecting regional water balance by causing changes in factors such as evapotranspiration and surface runoff [2]. Moreover, changes in land cover caused by human activities also affect surface runoff and pollutant transport [3]. Satellite data on land-cover change reveal a clear trend of shrinking forest and grassland areas, with a 15% reduction in forest cover and a 20% expansion in urban areas between the 2000s and 2020s. These changes provide valuable insights for predicting future shifts in water balance [1,4]. As climate changes and land-cover changes will certainly cause changes in the water balance of the affected area (evapotranspiration and surface runoff), qualitative and quantitative assessments of changes in the distribution of pollutant sources caused by groundwater recharge or runoff [4,5].
Global changes in the water cycle, including water quality deterioration, could lead to various impacts and risks [6,7]. Natural freshwater systems have been altered by both climatic and non-climatic influences, and this trend is expected to persist. Although significant water quality deterioration has been observed in arid and semi-arid regions, it remains challenging to determine whether climate change is the primary driver affecting most freshwater bodies [7,8]. These include natural variability, human activities like agriculture and urbanization, and localized climatic conditions. In arid and semi-arid regions, the impacts of climate change are often compounded by the over-extraction of water, pollution, and land-use changes, making it difficult to isolate climate change as the primary cause of water quality degradation. Climate change serves as an ancillary driver, accelerating water quality degradation in combination with non-climatic factors such as land-use changes, industrial activities, and variations in the absolute load of pollutants [9].
The impact on the water supply is expected to be even greater. The influx of pollutants into water sources due to climate change and non-climatic factors can restrict normal water supply in densely populated areas [10,11]. To prevent the degradation of freshwater ecosystems and the spread of waterborne diseases, more energy and financial resources will be required for water treatment. In the worst case, reductions in water supply and the closure of water sources may be required.
Numerous studies have been conducted to predict the impact of future climate change on water quality in South Korea using modeling techniques [12,13,14]. These studies have primarily focused on evaluating water quality under future climate scenarios. Water quality changes have been examined through the model development for water temperature and aquatic ecology [15,16]. Some studies have assessed the potential impacts of changes in water temperature, pathogenic microorganisms, and trace hazardous substances under future climate scenarios [17,18]. Using three-dimensional water quality models, previous studies have developed a water quality simulation system to estimate the effects of various climate change conditions and water quality management strategies [19]. Based on their findings from future climate scenarios, most studies strongly recommended the implementation of water quality monitoring systems, including non-point source pollution management systems, spatial information systems, and securing environmental water.
Research on non-climatic drivers of freshwater quality, especially land-use changes in watersheds, has mainly been focused on river basins with short flow distances and those with high potential for urbanization [20,21]. The Slope, Land Use, Exclusion, Urban, Transportation, Hillshade (SLEUTH) land-use model and IPCC Special Report on Emission (SRES) A2-B1 scenarios to simulate high-resolution land-use changes from 2010 to 2100 in the Gyeongan Stream watershed, a tributary of the Han River in South Korea [22]. The results indicated that urban areas could more than double over the next 50 years under both economic growth and environmental management-focused scenarios compared to the 2010s. However, most studies linking climate change and land-use changes have used models based on Cellular Automata (CA), which inherently reflect past land use histories in future predictions [20,21,22]. This approach has limitations and rarely includes simultaneous linkage to surface runoff in the research results.
In this study, IPCC climate change scenario data are analyzed and processed to create spatiotemporal distribution data of the factors necessary for water balance and describe future landcover changes through a relevant modeling process. Both climate change and land-cover change modeling results are integrated into the water balance model to represent the spatiotemporal changes in the water balance, and the analysis of the model results is used to evaluate the potential pollution of surface water and groundwater. The objectives of this study are (1) to review, analyze, and process climate scenarios; (2) to construct a model for future land-cover change and analyze the results, integrating machine learning method; and (3) to provide an assessment of the future potential for surface water and groundwater pollution in the study area. This research aims to provide insights into temporal and spatial changes in water balance resources, including surface runoff, evapotranspiration, and groundwater recharge, until 2050. Our study contributes to the understanding of predicted land-cover changes and water resource management in South Korea. Therefore, this research will offer significant information on water resources and land-cover changes, aiding in decision-making and the development of future water resource management strategies.

2. Background and Methodology

The Representative Concentration Pathway (RCP) scenarios provided by the Korea Meteorological Administration (KMA)-Climate Information Portal are utilized to generate integrated water balance analysis by dividing them into the areas of model application, analysis, and processing [23,24]. Through the processing of the data, the data scale will be adjusted to take account of the terrain distribution as needed and to fit the grid of the water balance and land-cover change model to show the regional characteristics.

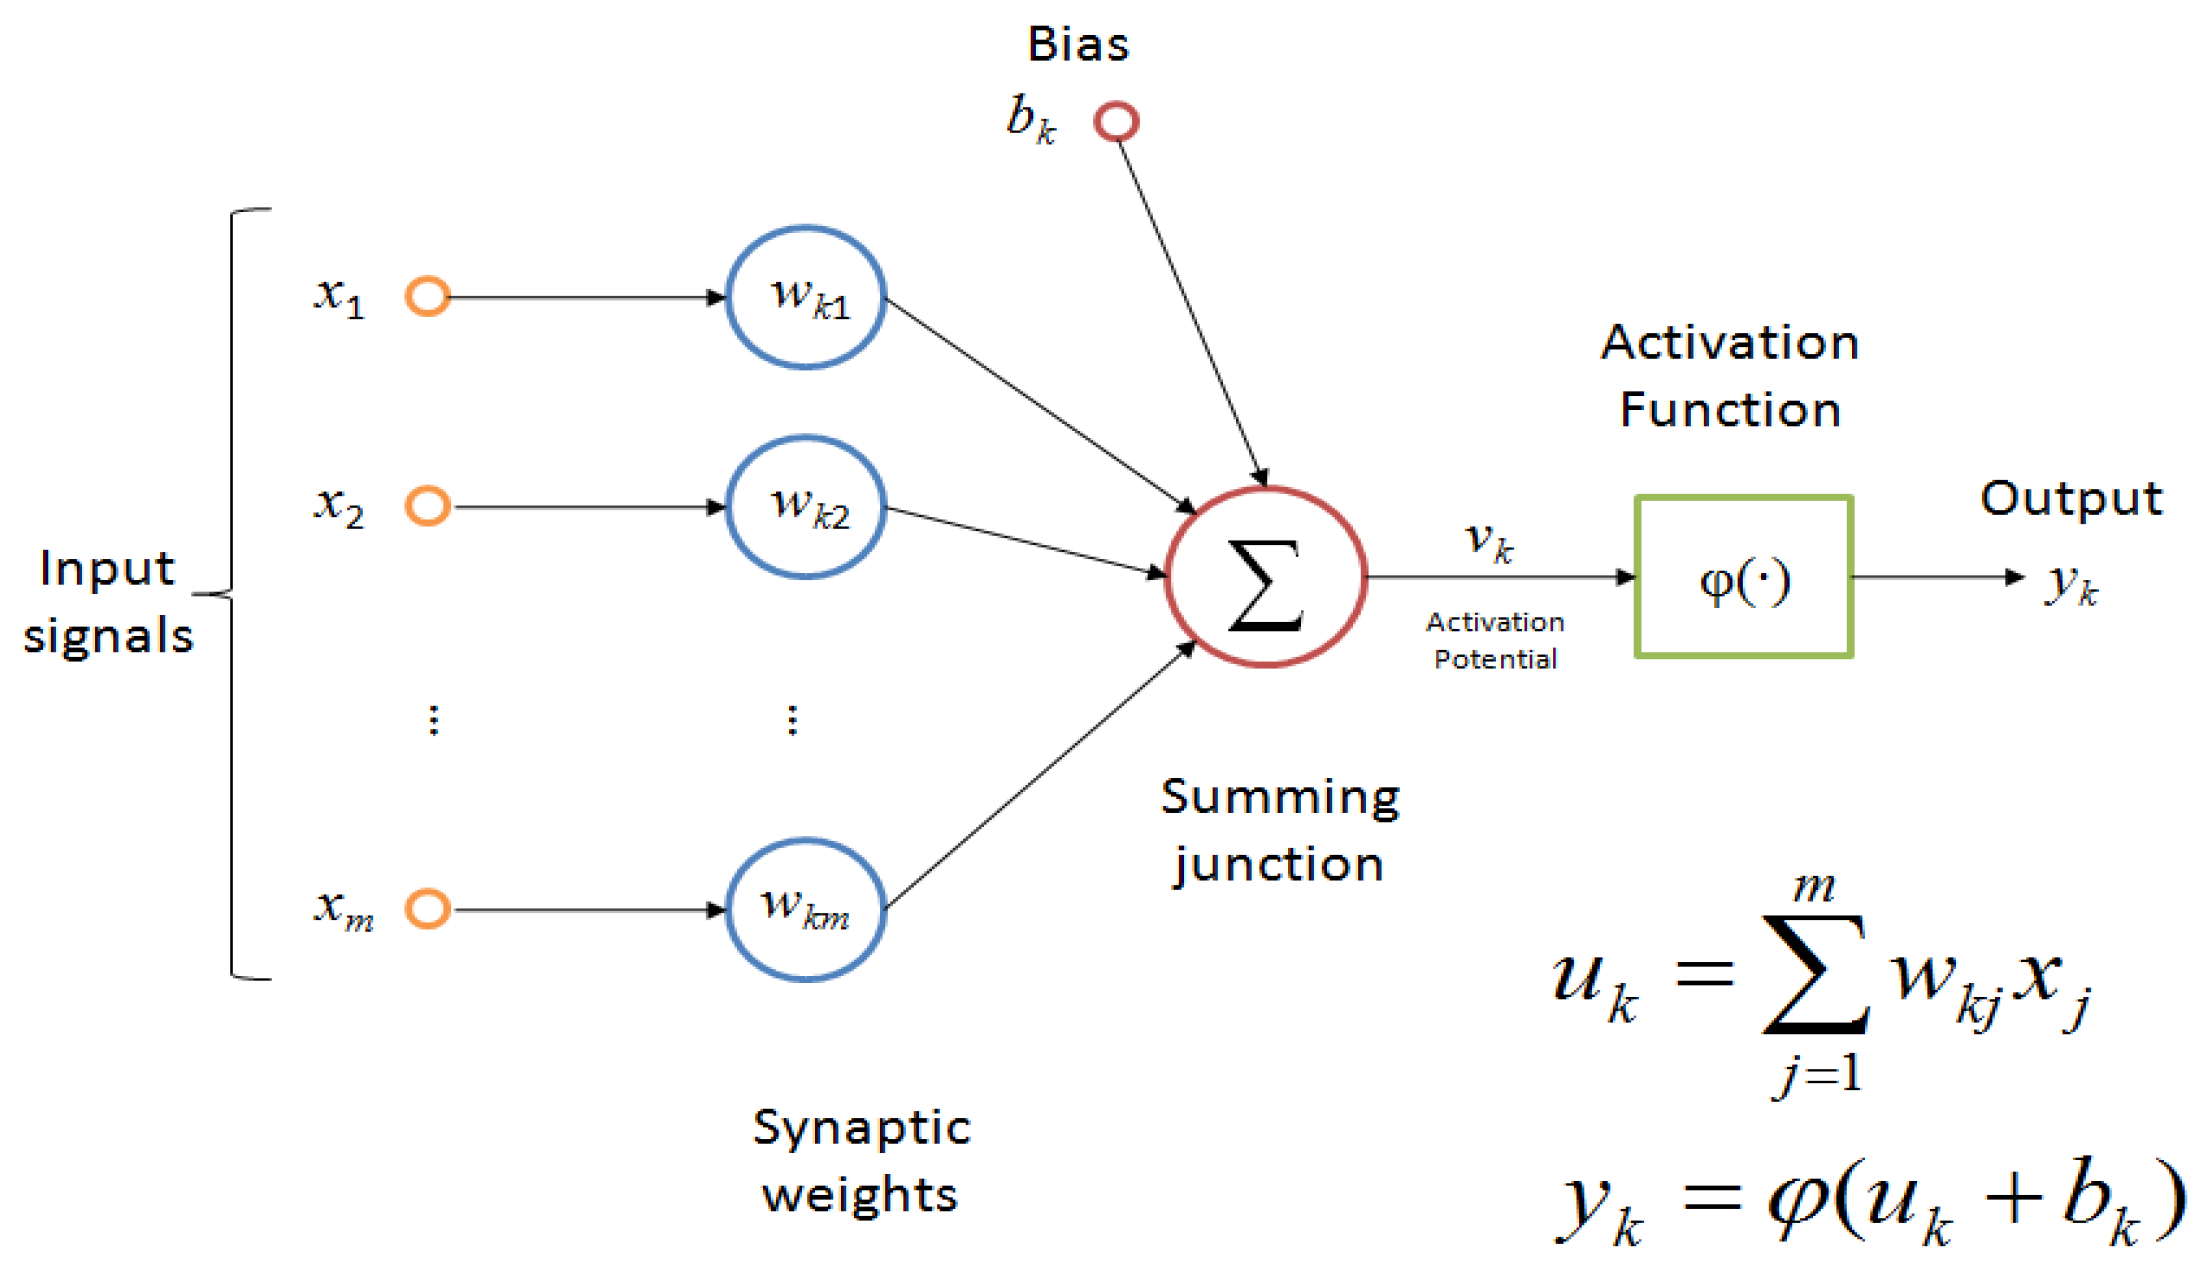
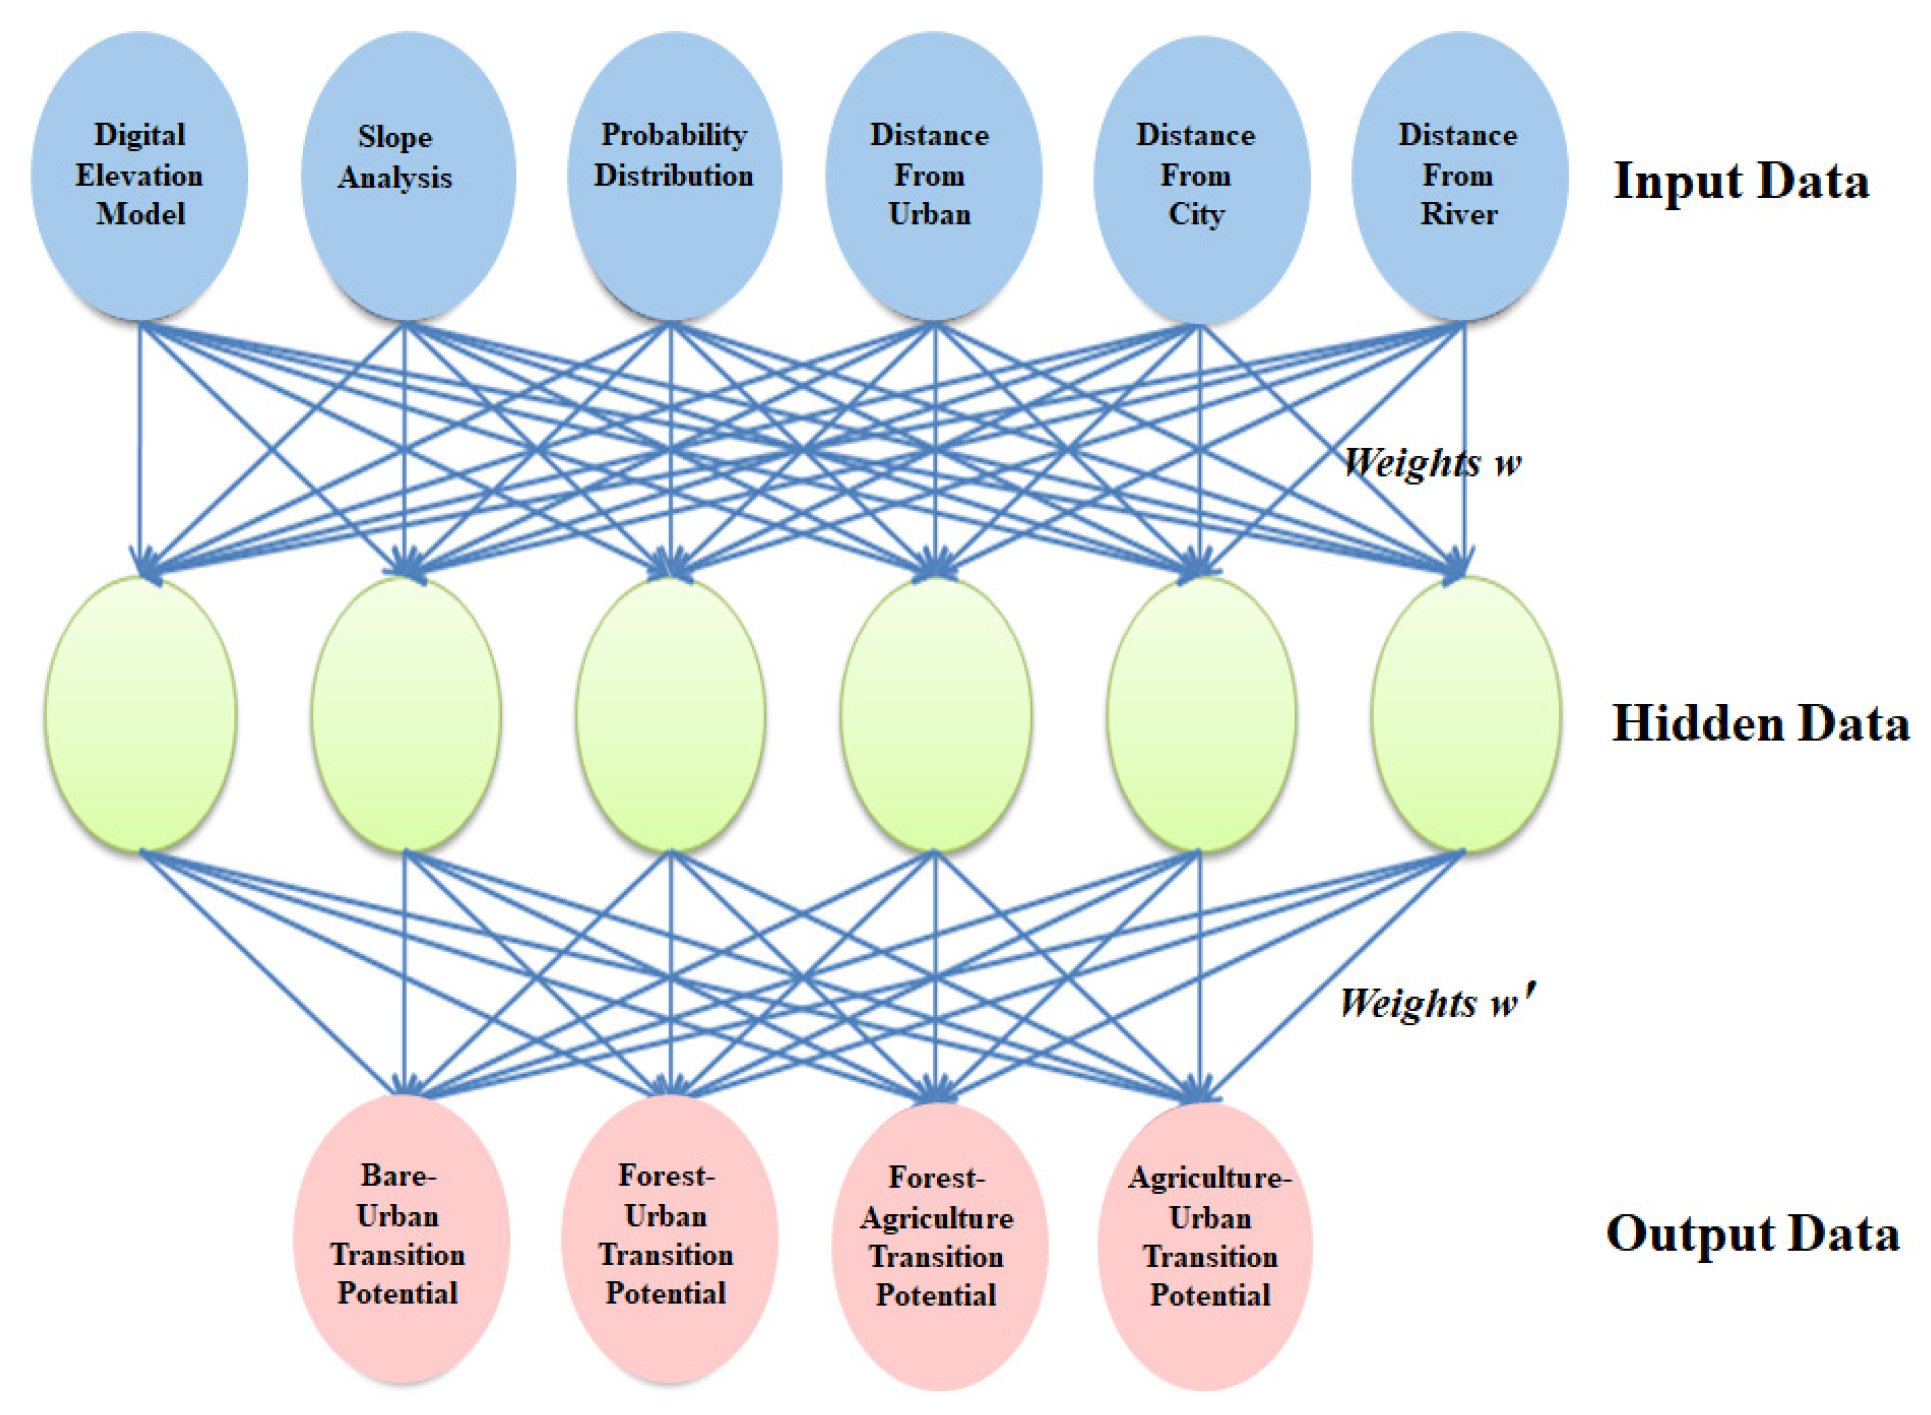
2.1. Dataset and Machine Learning

Future land-cover change modeling was conducted using land cover data from the Ministry of Environment and water information from the Ministry of Land, Infrastructure, and Transport. This study utilized the Land Change Modeler (LCM) developed by Clark Labs (2009) in the United States. The structural principle of the LCM involves simulating and predicting changes in land use and land cover based on historical data and driving factors. It uses a combination of spatial and temporal data, often incorporating machine learning methods, like neural networks, to analyze patterns and project future scenarios. The model typically includes modules for calibration, validation, and scenario analysis, allowing users to assess the impacts of various factors on land change over time [25,26].
The LCM offers several advantages for modeling land-cover changes. It is user-friendly and utilizes Multi-Layer Perceptron (MLP) neural networks, which are effective in capturing non-linear relationships in the data, enhancing the accuracy of predictions. The LCM supports scenario-based modeling, enabling users to explore various future land use possibilities based on different drivers and policies. Other models, such as the Cellular Automata–Markov (CA–Markov) or Agent-Based Models (ABMs), might perform better in specific contexts (e.g., higher spatial resolution or more complex human-environment interactions). However, the LCM is often chosen for its balance of user-friendliness, integration capabilities, and robust modeling performance across diverse scenarios.
The LCM predicts future land-cover changes by employing a Multi-Layer Perceptron (MLP) with rasterized spatial data as inputs and conducting iterative machine learning processes. MLP is a fundamental model in machine learning, particularly useful for tasks requiring non-linear mappings from inputs to outputs. An MLP consists of an input layer, one or more hidden layers, and an output layer. Each layer is composed of interconnected nodes or neurons that process input data by applying weights and biases to the inputs, followed by a non-linear activation function [26,27]. Thus, LCM can perform future land-cover predictions with limited spatial data, such as land cover, river distribution, and terrain. This method has the advantage of enabling more flexible and versatile prediction by reflecting natural and anthropogenic land changes that may occur due to future development restrictions or planned development areas [28].
In the data preprocessing stage, all input data are rasterized, and the data will be utilized along with the land cover maps provided by the Ministry of Environment as well as the river information provided by the Ministry of Land, Infrastructure, and Transport to perform a prediction on future land-cover changes. After completing the transition type and transition probability analysis using multiple data sets, the landcover transition potential will be analyzed via LCM. The LCM employs a Multi-Layer Perceptron (MLP) to perform machine learning analyses. As an artificial neural network, the MLP mimics a neuron, a signal transmitter in the human nervous system, enabling it to quickly solve non-linear problem even with some errors in the input data. Figure 1 is a perceptron expressed in a mathematical formula. Input x has synaptic weight w, and when Vk, which is the sum of uk, the result of multiplying input x and synaptic weight, and Bias bk satisfies activation function φ, the perceptron is activated and produces an output.
A perceptron can be constructed by organizing a set of these neurons into layers in the form of input, hidden, and output layers, and a perceptron with one or more hidden layers that transmit signals between input and output layers is called a Multi-Layer Perceptron (MLP). The structure of the perceptron analyzing the transition potential between land cover types is shown in Figure 2. An input layer of six neurons is created from the data on the probability of land type change, a hidden layer is created to transmit the values of the input layer, and the calculation results are stored in the output layer of four neurons representing the main transition types. You can set the Root Mean Square (RMS) value, number of iterations, and accuracy as the training conditions for the perceptron [29]. After training, the number of hidden layers and number of neurons can be adjusted according to the final conditions to achieve optimal results. Along with the results of the transition potential analysis, LCM obtains a transition matrix using a Markov chain and uses it to predict future land-cover changes. For instance, Fattah et al. (2020) applied an MLP network to simulate land-use changes, which are crucial for understanding water management and surface temperature changes [30]. This study helped visualize the impact of land cover on local climate, particularly in urbanized systems. MLP networks combined with Markov models have been used to predict drought and manage water resources [31,32]. These applications are particularly effective in arid and semi-arid regions, providing valuable information for managing water resources under drought conditions. Additionally, Markov models, including Markov chains, have been widely used in modeling sequential data, such as in water resource management, bioinformatics, and climate modeling [32]. These models are particularly powerful in capturing the temporal dependencies and probabilistic transitions between states.
The future prediction’s result is expressed as a Hard Prediction Map, which shows an absolute change in the land cover type in the land cover map, and a Soft Prediction Map, which shows a possible change in a designated area. This model is validated by comparing the actual land cover map that we have acquired with the map produced by the LCM map at a given time period and assessing the model’s predictive ability through Receiver Operating Characteristics (ROCs) curve analysis. If the model’s predictive ability does not meet the expectation, the model will be adjusted by adjusting the structure and input layer of the perceptron.
Figure 3 shows an example of a result of a landcover transition potential analysis. Among the transition types shown in the output layer of Figure 2, the transition from farmland to urban area is shown to have the highest transition potential, and the spatial distribution shows a tendency of expansion from existing urban areas. Figure 4 shows a comparison of land cover from the actual satellite image analysis and the land cover predicted by the LCM. Some discrepancies are easily noticeable, which can be interpreted as a result of inconsistencies in the designation of development restrictions and planned developments according to the land utilization plan. For a more quantitative validation, ROC analysis (Figure 5) showed the area under the curve (AUC) value of 0.922, which indicates that the result is statistically significant [33]. A ROC curve is a graphical plot that illustrates the diagnostic ability of a binary classifier system as its discrimination threshold is varied. The ROC curve helps you visualize how well your classification model is performing. The AUC is typically calculated using numerical integration methods, such as the trapezoidal rule, which approximates the area under the curve by summing the areas of trapezoids formed between consecutive points on the ROC curve. In summary, an AUC value of 0.922 indicates that the model is 92.2% likely to correctly distinguish between a randomly chosen positive instance and a randomly chosen negative instance.

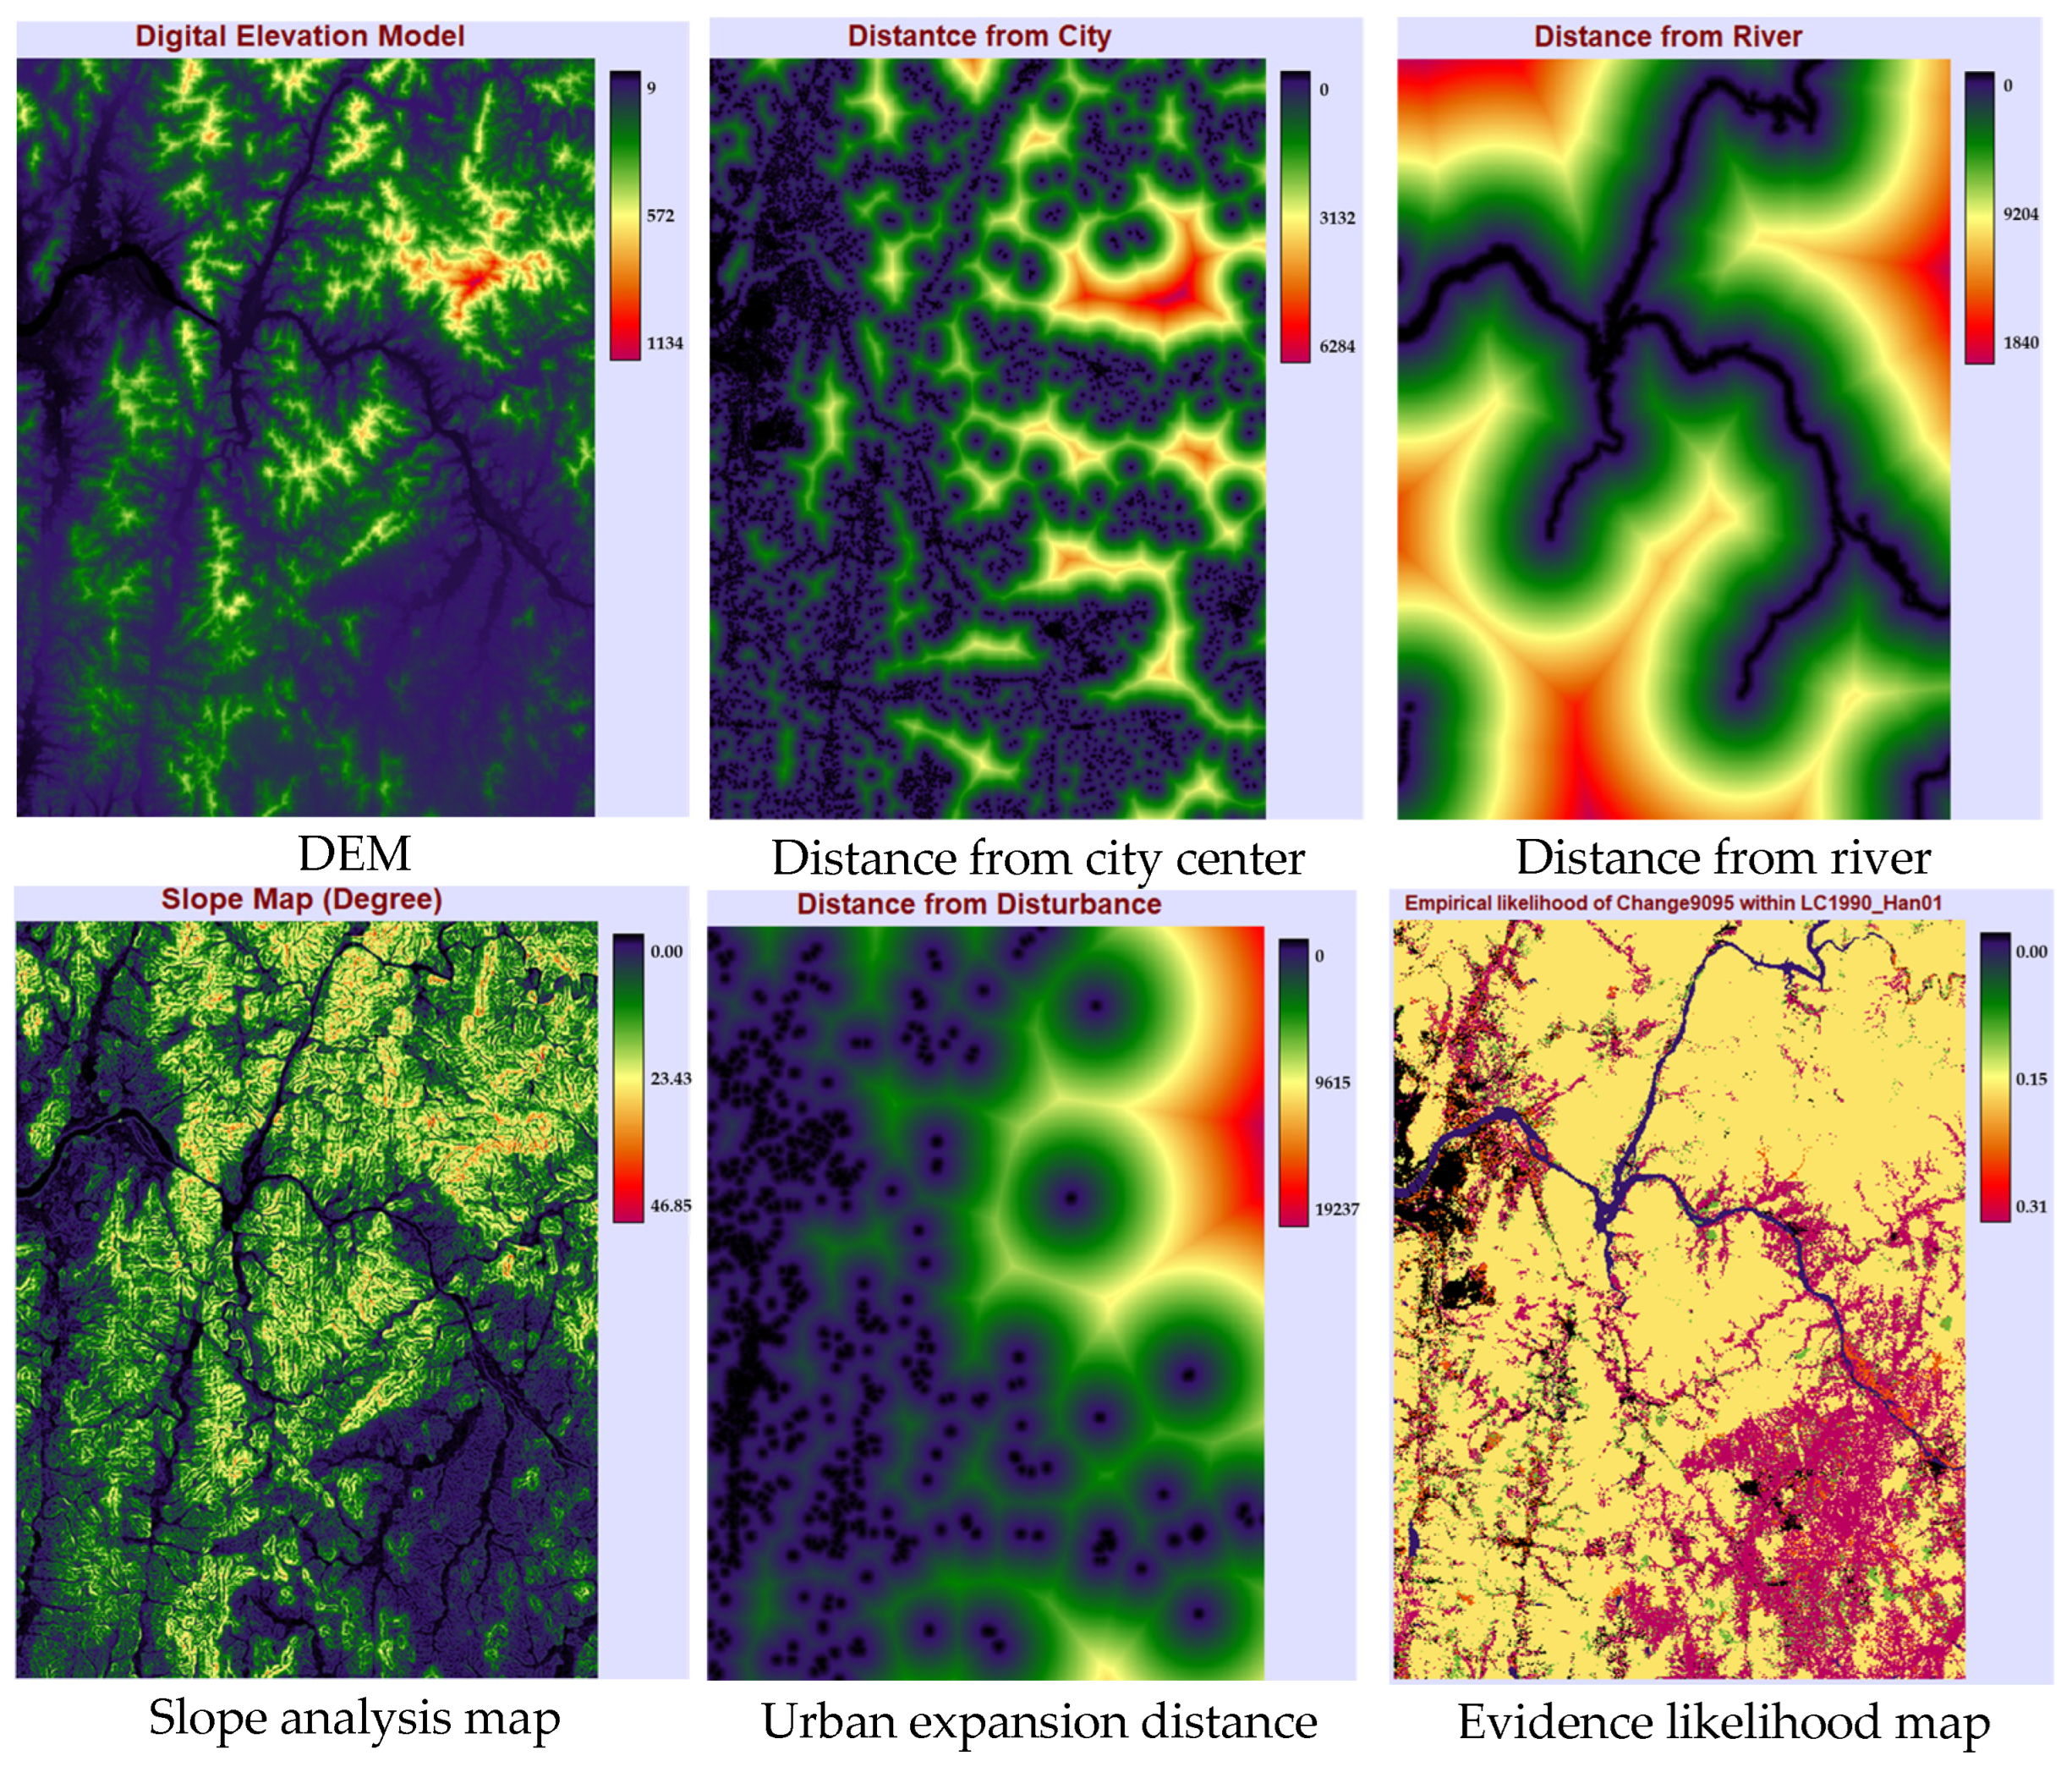
2.2. Integrating Modeling

Future water balance change can be predicted by integrating the distributive water balance model with climate predictions according to the climate scenario and future land cover map created via land cover predictions, and based on the predicted water balance change, potential pollution of the groundwater and surface water can be assessed. A few well-known distributive water balance models include SWAT-K [34,35,36] and WetSpass [37]. SWAT-K calculates water balance based on Korean soil information DB; thus, using SWAT-K provides the advantage of applying Korean-specific characteristics much more conveniently. On the other hand, VELAS allows water balance to be calculated precisely by considering soil moisture changes, and it can also be linked to groundwater models. As for WetSpass, though it is a quasi-stationary model, it provides relatively good results when the input data are limited. In this study, WetSpass is used to perform the water balance analysis considering the limited future climate prediction based on the climate scenario as well as the size of the data.
WetSpass (Water and Energy Transfer between Soil, Plants and Atmosphere under quasi-Steady State) is a GIS-based water balance analysis model that calculates quasi-static state water balance using rasterized weather observation data, soil, land use, and groundwater level information and expresses the result in spatial distribution [37]. The water balance equation for precipitation is shown below.
P = S + E T + R
P is precipitation, S is surface runoff, ET is evapotranspiration, and R is groundwater absorption. WetSpass categorizes the land surface into vegetated surface, bare soil, open water, and impervious surface paved with asphalt or cement according to the cover status and applies the water balance in each area according to the classification. The water balance of the vegetative surface (v) is shown below. In this formula, I is water intercepted by vegetation, and S_〖v〗, T_〖v〗, R_〖v〗 are the runoff, transpiration, and absorption amount in the vegetated surface, respectively.
P = I + S_〖v〗 + T_〖v〗 + R_〖v〗
Through this water balance modeling reflecting future climate prediction and land-cover changes, the changes in water balance caused by extreme precipitation and droughts, and based on this, the relocation of surface pollutants considering the change and flow of the surface runoff as well as the pollution vulnerability assessment on the surface and groundwater due to the resulting surface runoff becomes possible.
Since water supply management areas are subject to environmental regulation policies to protect water resources, there are strict limitations on developmental activities. Therefore, it is necessary to adjust the change rate to a very low level in the land cover analysis to artificially limit major land-cover changes from occurring within water supply management areas. In this study, based on the distribution and area of water supply management areas, the mainstreams of the four major rivers (Han, Geum, Seomjin, and Nakdong Rivers), as well as their primary tributaries, were analyzed. By selectively focusing on these areas, we aimed to improve the efficiency of the model and result analysis without compromising the modeling outcomes. The WetSpass water balance model, as mentioned earlier, simulates evapotranspiration (including interception, evaporation, and transpiration), surface runoff, and groundwater absorption from precipitation in a quasi-stationary manner (for both dry and wet seasons) by considering land-cover changes as well as soil characteristics. The land-cover change predictions described above, along with climate change prediction values obtained from climate scenarios distributed via Climate Information Portal (www.climate.go.kr; accessed on 2 November 2023) provided by the Korea Meteorological Administration, were used as input data for this analysis. The climate scenario data used in this analysis included evapotranspiration data, precipitation data, and temperature data from the RCP 8.5 scenarios applied to water resources [37]. For wind speed data, we used the 30-year average value provided by the Korea Meteorological Administration’s weather data open portal (data.kma.go.kr; accessed on 14 November 2023), as the climate scenario only provides limited data.

3. Results and Discussion

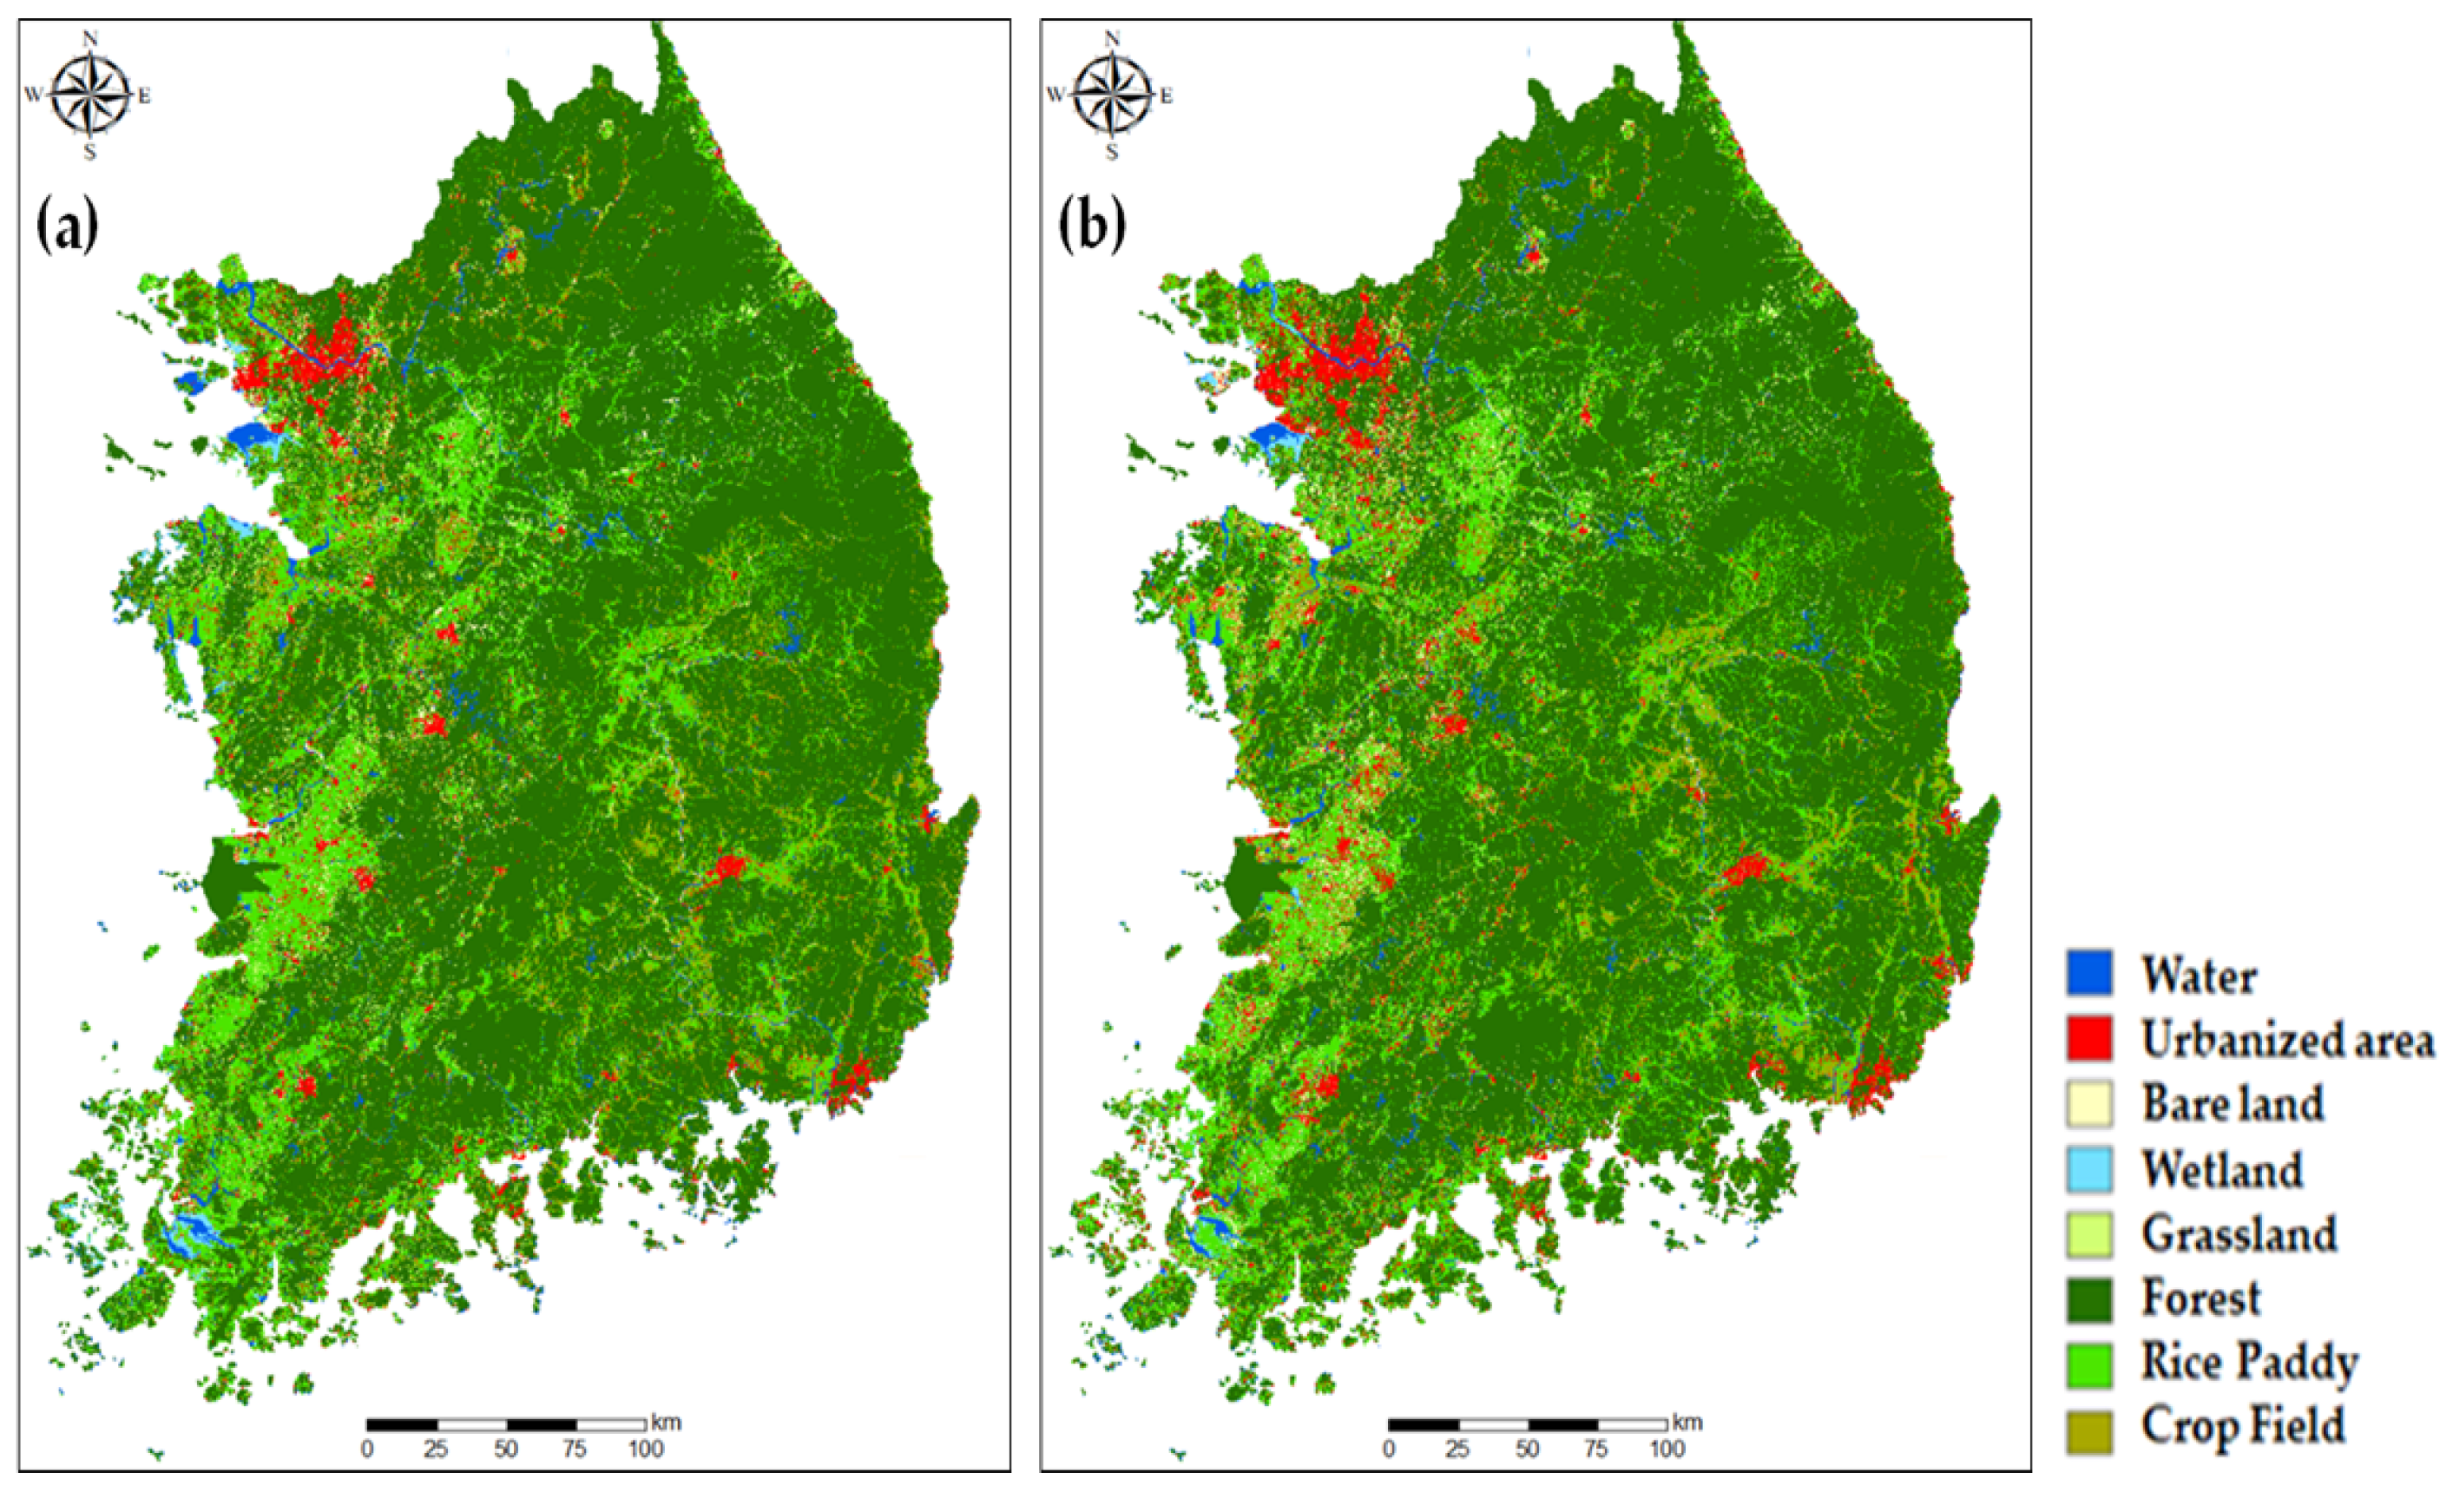
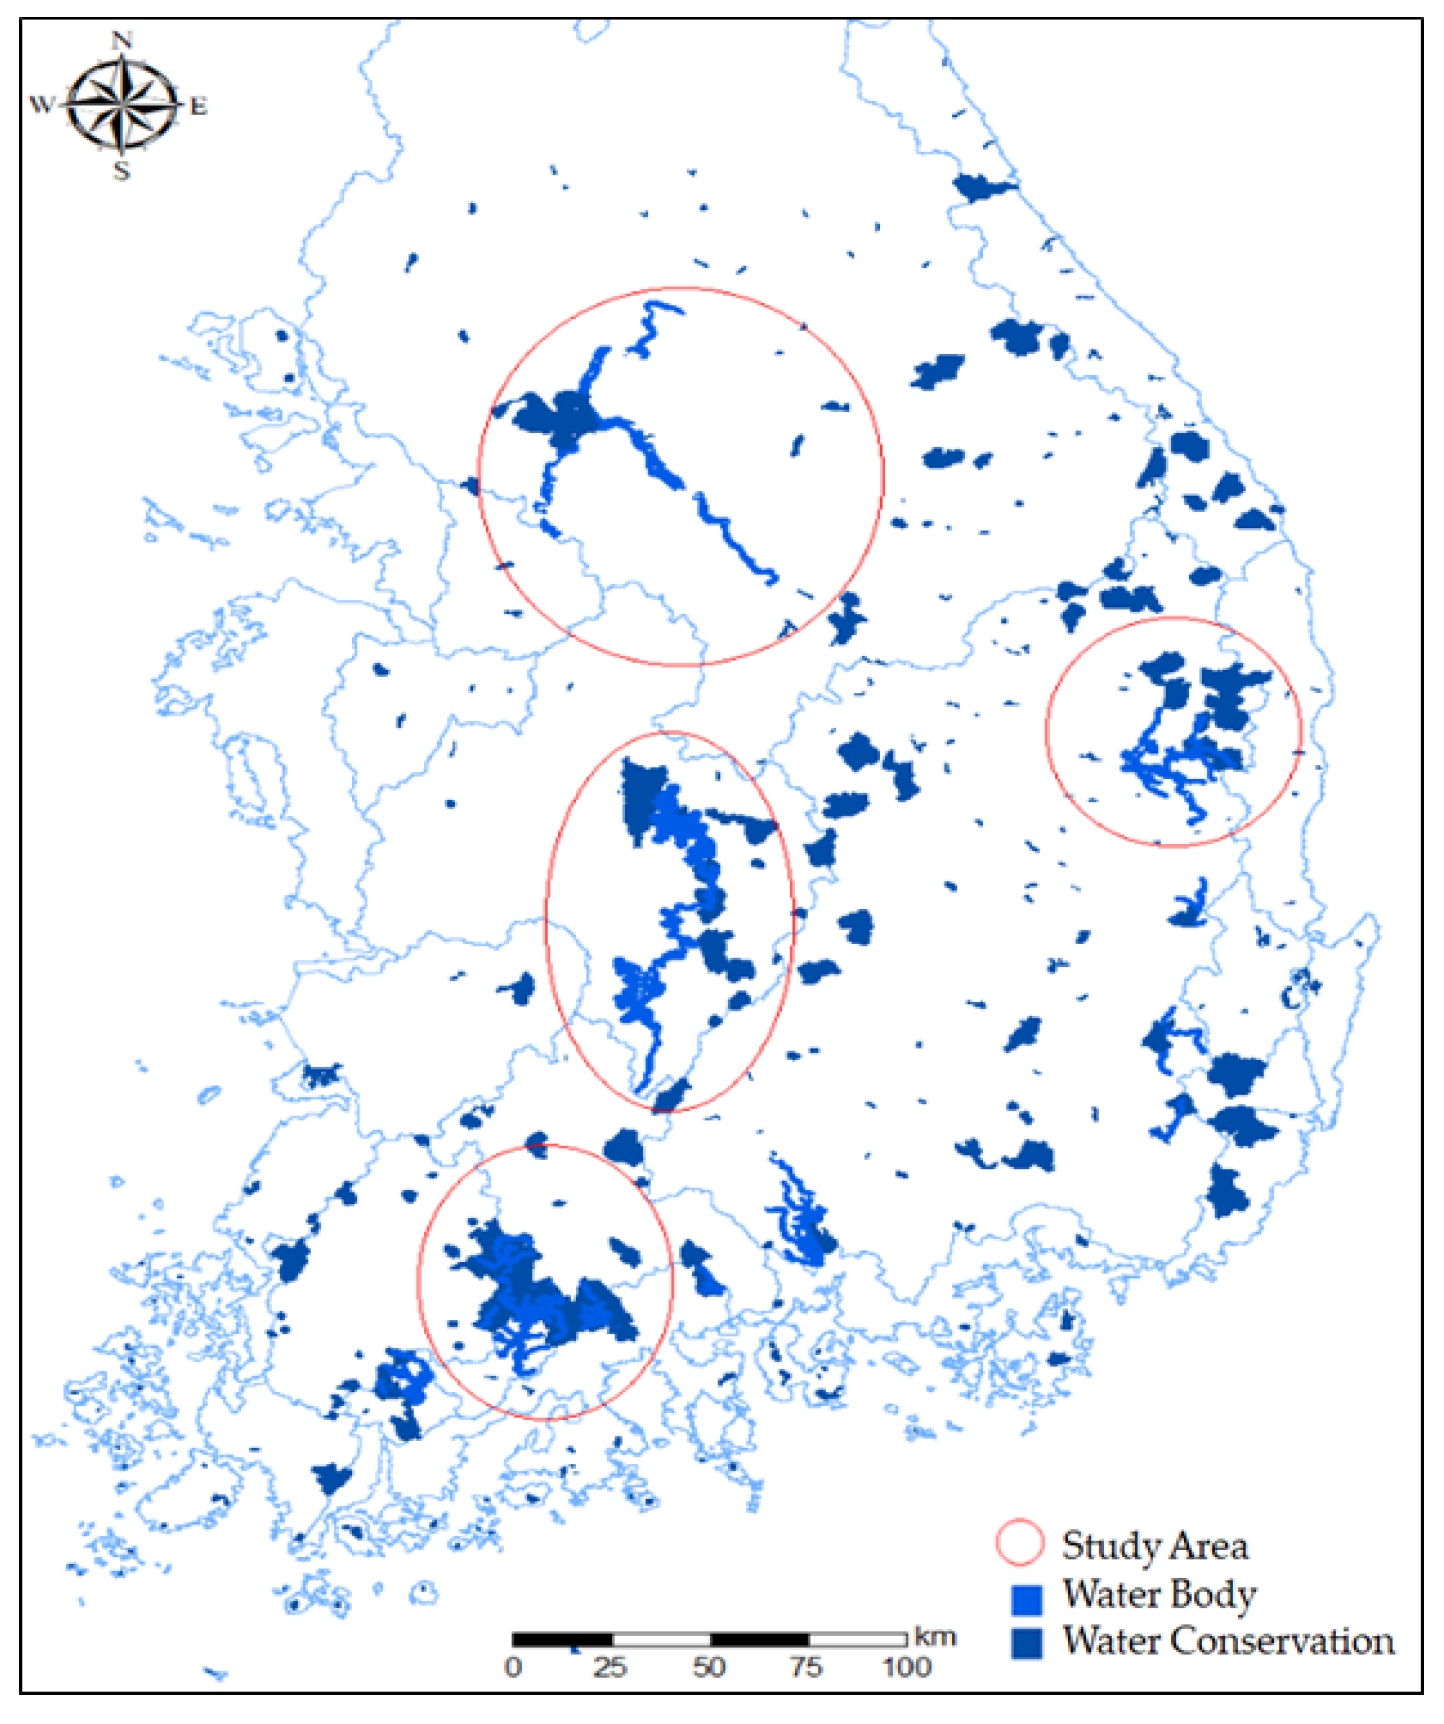
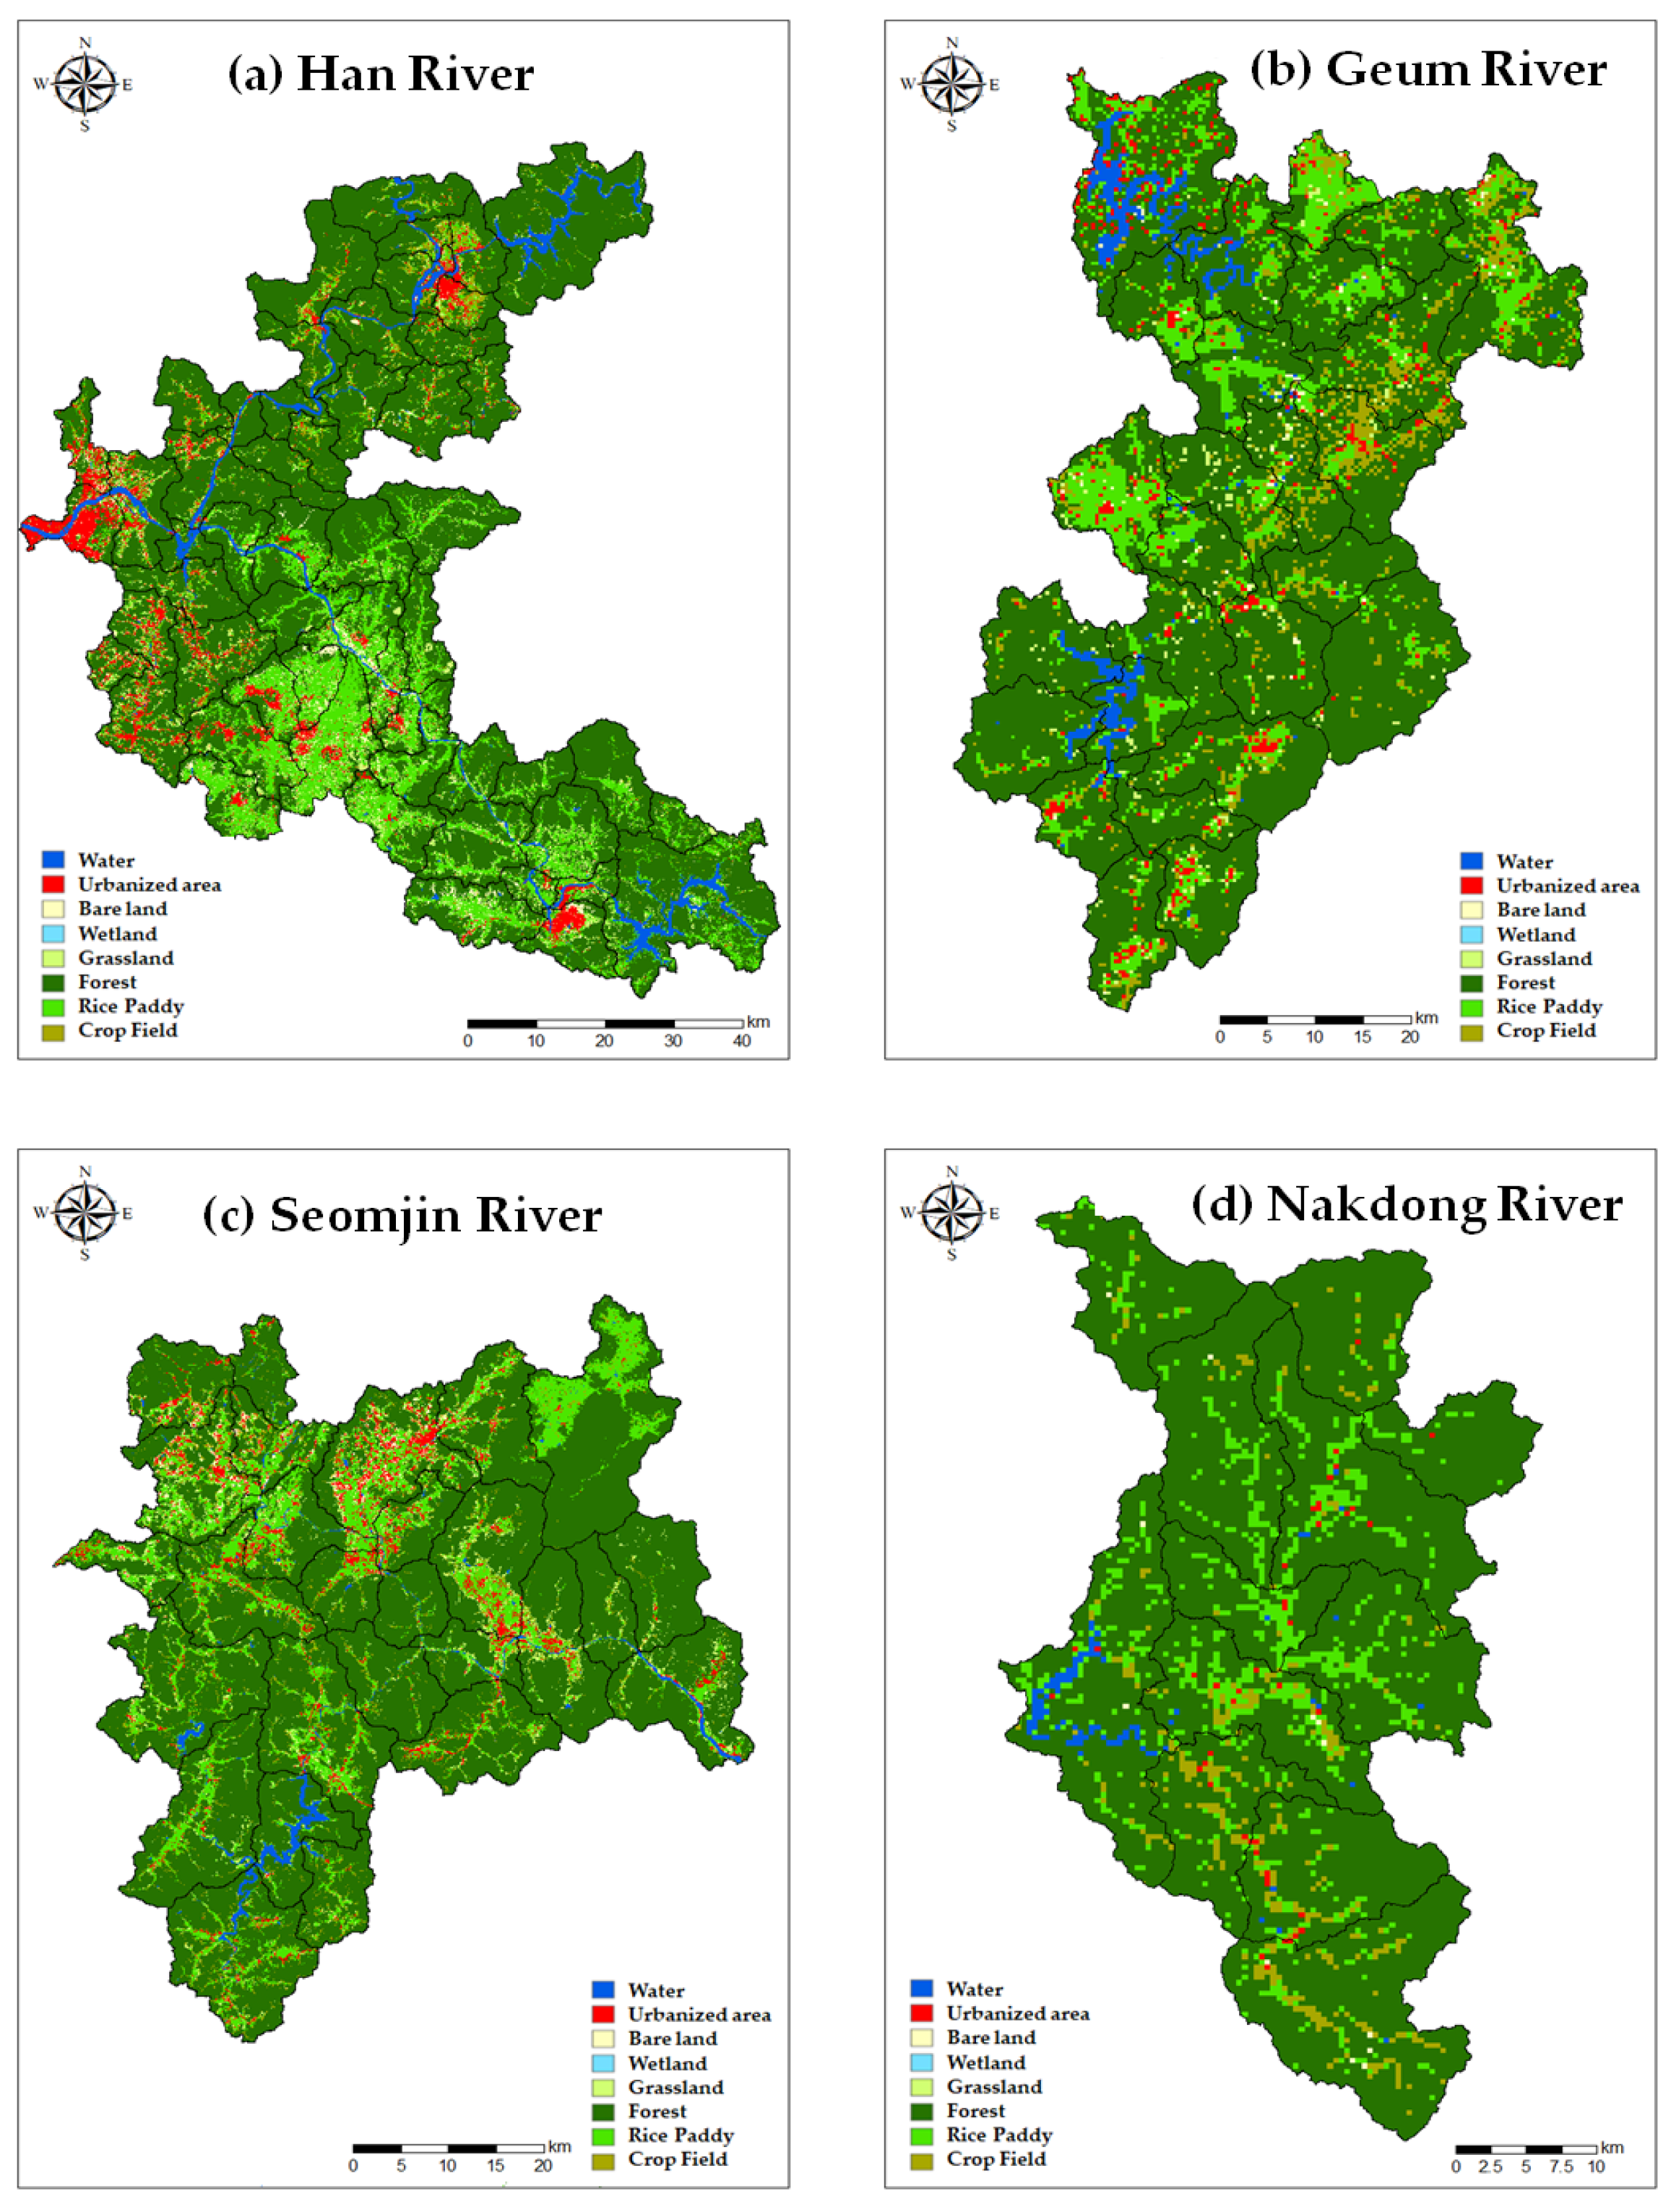
3.1. Historical Changes in the Study Area

The Korean Ministry of Environment provides various land surface maps through the Environmental Geographic Information Service (egis.me.go.kr; accessed on 14 November 2023) [38,39]. This study used large-scale land cover maps due to their regular intervals and simple classification, making model building and analysis easier. The large-scale land, with a 30 m grid, covers the entire Republic of Korea. It is based on a 1:50,000 scale map divided into 15 min intervals of longitude and latitude and features seven categories (as shown in Table 1). The 1990 and 2000 maps (Figure 6) further divide agricultural areas into paddy fields and regular fields, resulting in eight categories used for analysis. Paddy fields, which must remain waterlogged during the growing season, function like ponds that infiltrate water into the surrounding soil [40]. This characteristic is crucial for water balance analysis. The historical land cover maps for 1990 and 2000 reveal changes in land use patterns, as shown in Figure 6. Forest cover decreased from 40% in 1990 to 35% in 2000, indicating a 5% reduction due to deforestation and land conversion. Agricultural land increased from 30% to 35% over the same period, reflecting a shift towards more intensive farming practices. Additionally, urban areas expanded to 15% by 2000, highlighting rapid urbanization and ongoing urbanization trends during the observation period.
In the Han River area, which is the largest area in the study, water supply management areas are concentrated in the upstream areas of the North Han River near Chuncheon and the South Han River near Chungju and in the Paldang Dam area where the two rivers converge [41,42,43,44]. Therefore, the scope of this land-cover change analysis was limited to these three areas to improve the efficiency of model construction and analysis (Figure 7). According to the change in land cover distribution between 1990 and 2000, the forest area was decreased by 163 km2 and the field area was decreased by 80 km2. In contrast, grassland was increased by 136 km2 and urbanized area was increased by 127 km2. The increase in urbanized areas is directly related to the surface runoff and ground infiltration of precipitation from a hydrological perspective, as most of these areas are covered by impervious or impermeable materials, which results in an increase in direct runoff and a decrease in infiltration, which is important for groundwater recharge [45]. The increase in grassland is represented by forest conversion in the transition phase of land cover, potentially converting to farmland or other agricultural land, which in turn can increase surface runoff of precipitation.
In the actual modeling phase, to exclude the urban effect caused by active urbanization and expansion occurred in Seoul, Hanam and the Gwangju area due to land development near the Paldang Dam, North Han River area, South Han River area, and Han River downstream area were modeled separately and then the results from each modeling were integrated to ultimately use as the input data for the water balance analysis. Shown below are DEM, slope analysis map, distance analysis map (city center, river, urban expansion), and Evidence Likelihood analysis map, the input data for land cover transition potential analysis using MLP [46]. Figure 8 is an example of the input data used for the Paldang Dam area. The convergence condition for this learning was RMS 0.01, learning was repeated 10,000 times, and the accuracy rate was set to 100%; after reaching the maximum number of repetitions, all three regions showed an accuracy rate of above 80%.

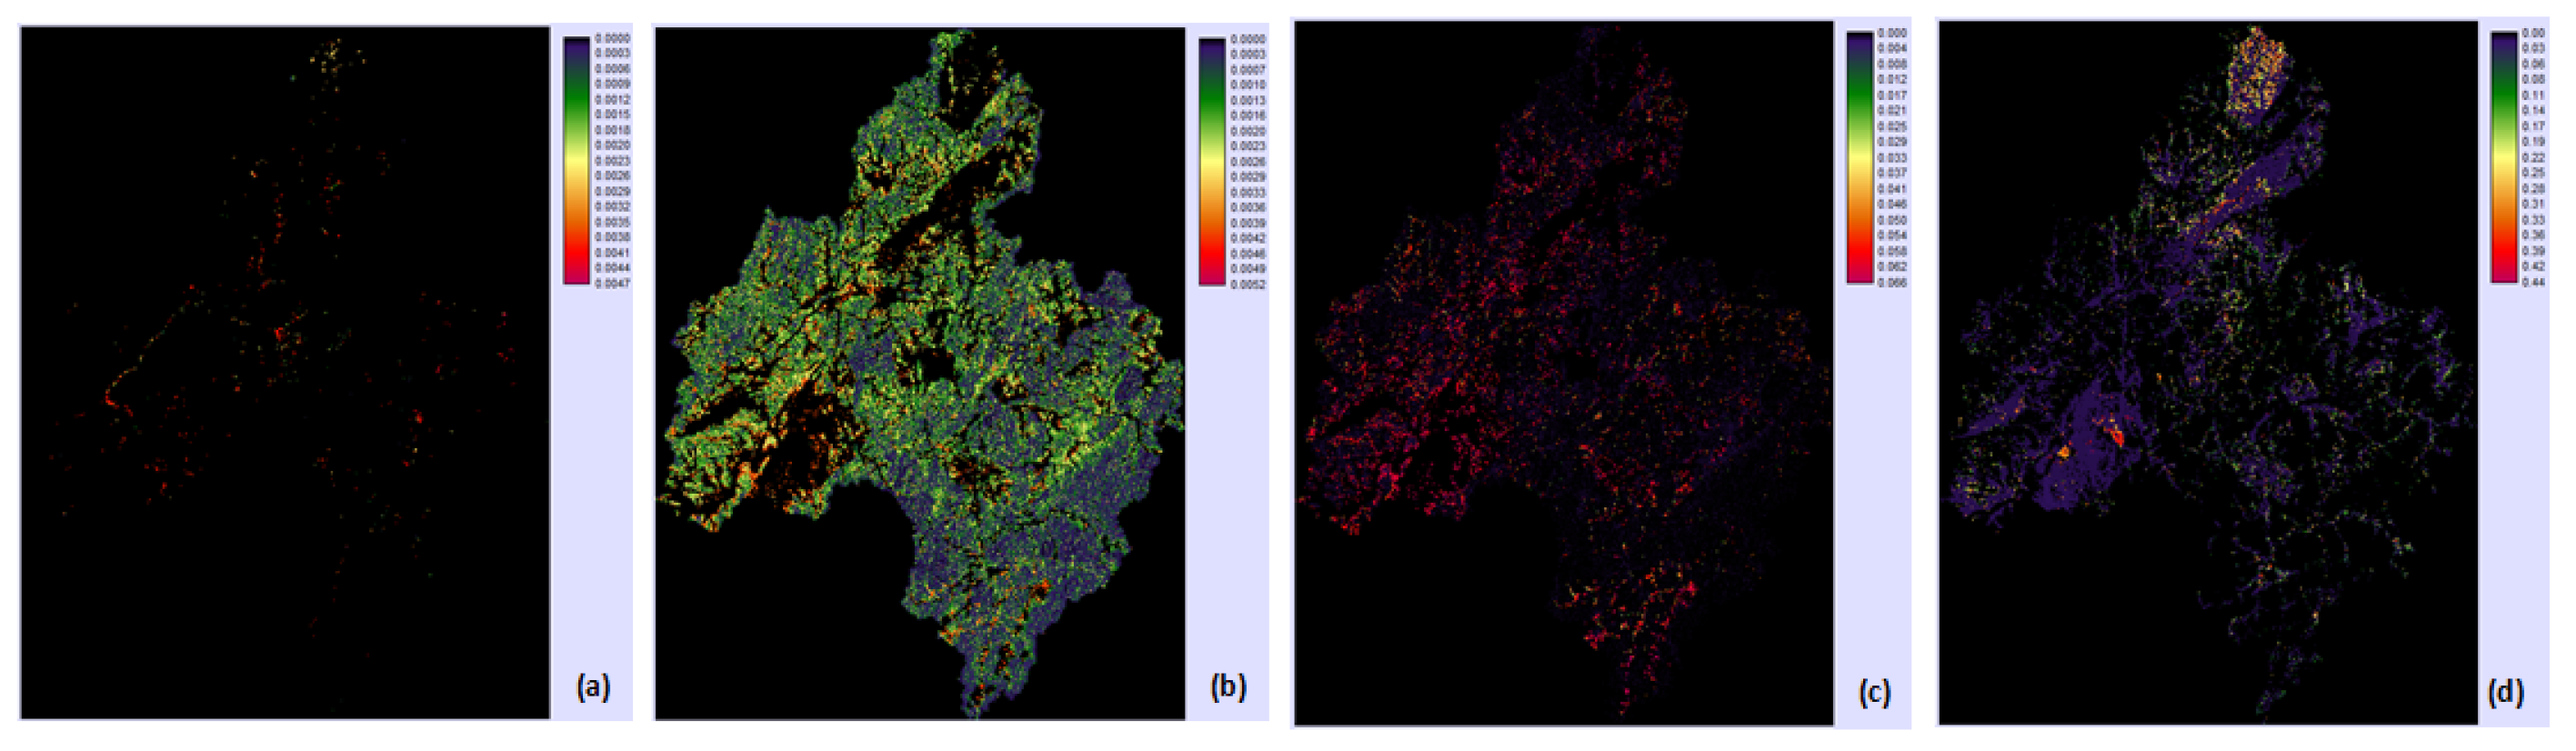
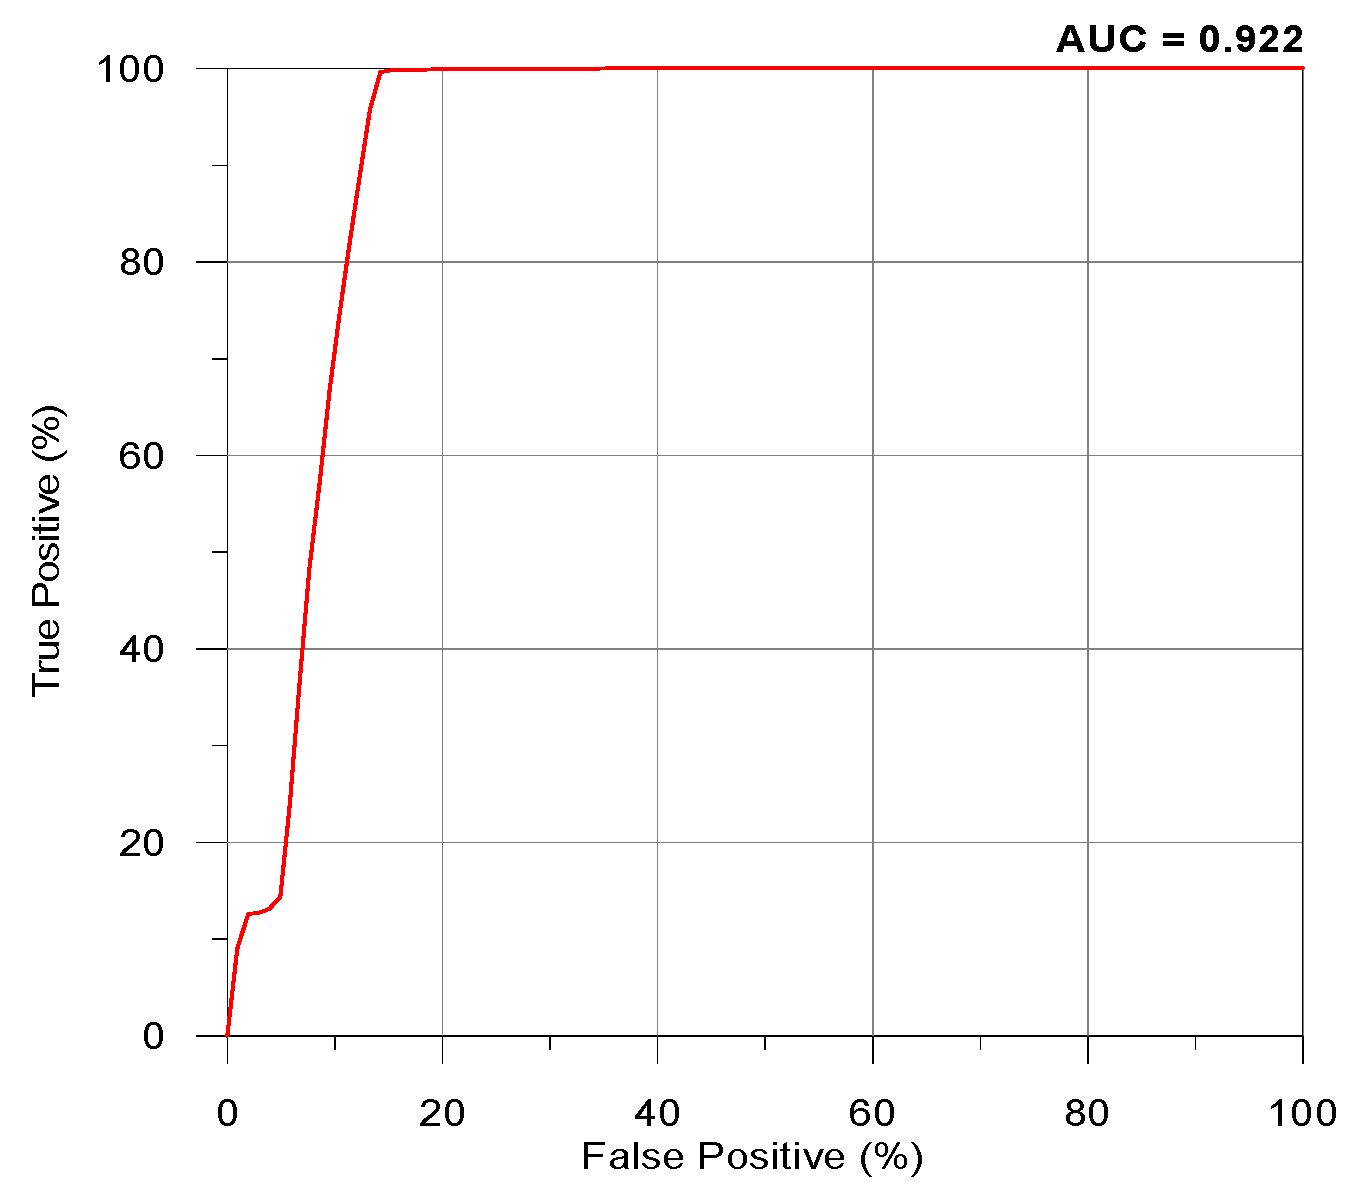
3.2. Future Land-Cover Changes

The land-cover change in the Han River area was predicted by 2050 using the land-cover change prediction model while setting the water supply management area as the limiting condition of the land-cover change. Due to the change limitation set for the water supply management area, urbanization or changes in the forest area were minimal. In contrast, the area outside of the limited area is predicted to have active land-cover changes, which results in active urbanizations from vegetative areas, bare soil, and fields. Though the land-cover change within the water supply management area is predicted to be minimal and limited, the expansion of urban areas and farmlands upstream of the river that is in the same water system as the water management area can cause the increase in surface runoff from the upstream and, ultimately, can result in the flooding or increased pollution loads in the downstream area.
As for the Han River area, the area change in the urbanization area is predicted to be 245 km2 in 2000 and 296 km2 in 2050, showing a gradual increase over time. For the Geum River area, it was 60 km2 and 100 km2, respectively, which showed approximately 40 km2 expansion in the timeframe. Among the predicted expansion, approximately half of the expansion was predicted to occur in the Daecheong Dam area. For the Seomjin River area, the urbanization expansion was predicted to be 108 km2 in 2000 and 112 km2 in 2050. However, in the Nakdong River area, there were no significant land-cover changes predicted as there was almost no urbanized area within the water supply management area that was subjected to this analysis. The spatial distribution for each area is expressed in Figure 9. It shows the predicted land-cover changes in the Han River area to 2050, inclusive of the water supply management area. In the same manner, land-cover change models were constructed for the major water supply management areas located in the Geum River area (Figure 9) and Seomjin River area (Figure 9) and performed future predictions of the land-cover change.

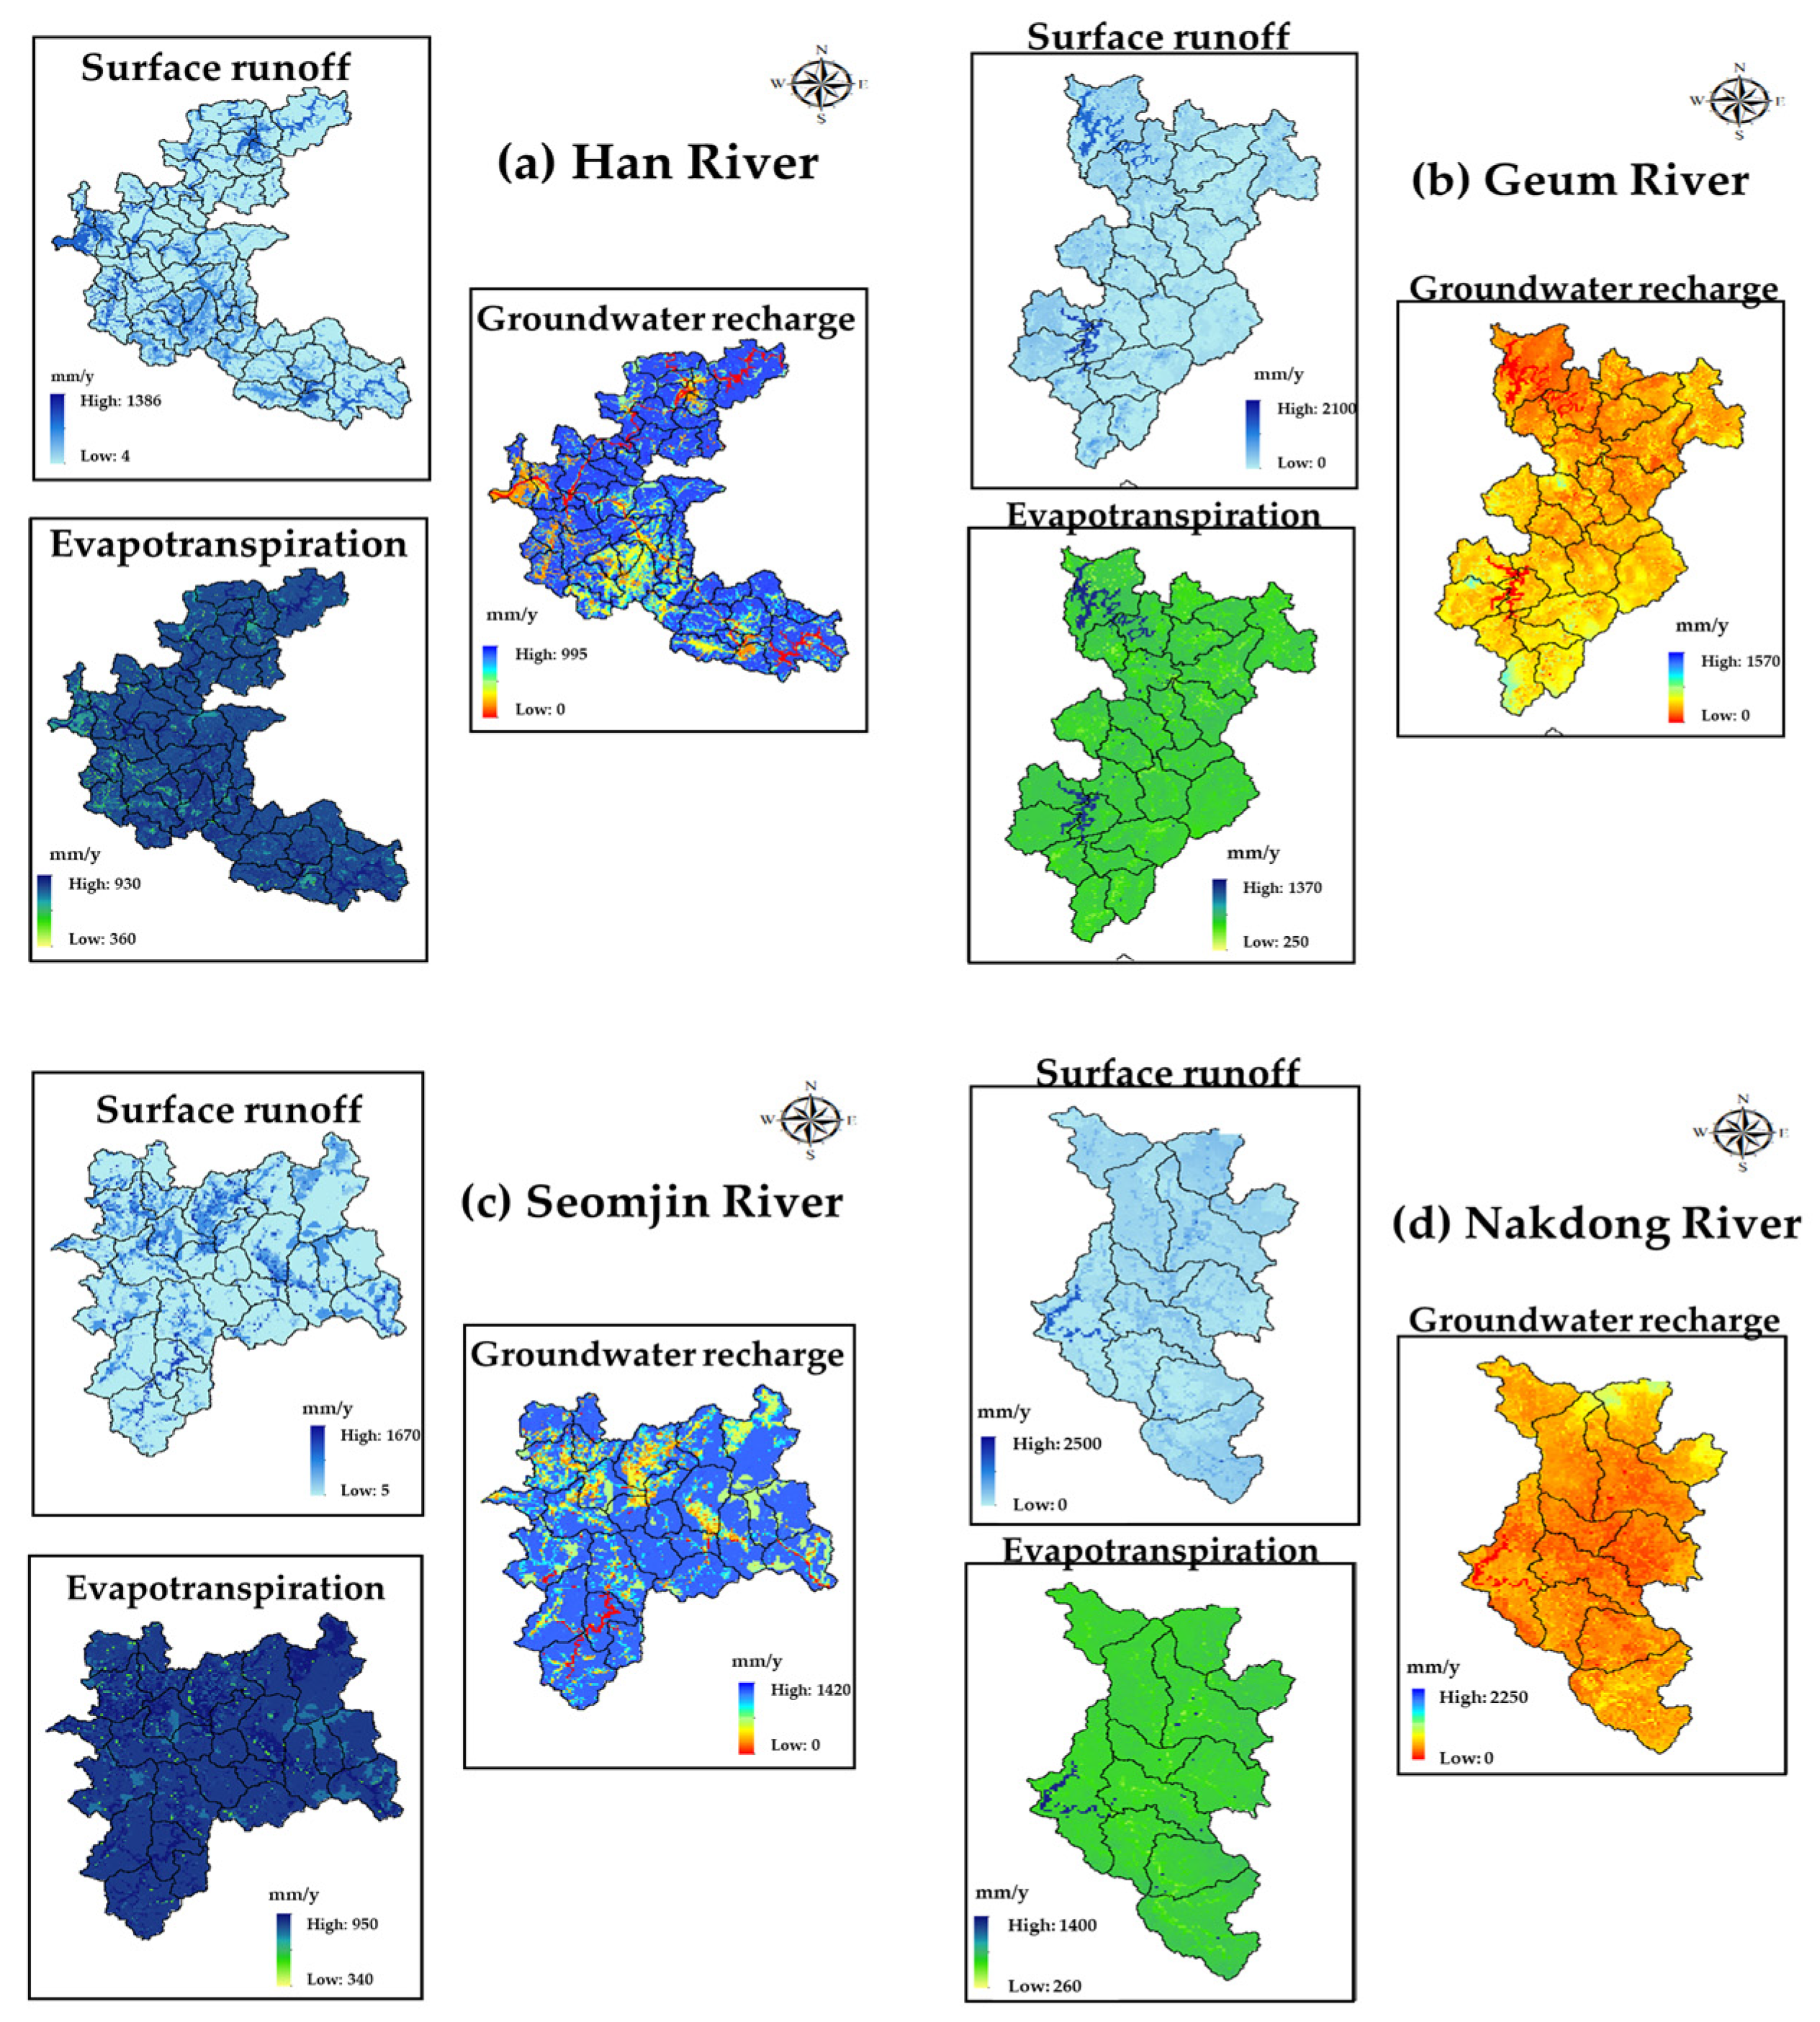
3.3. Integrating Land-Cover and Water Modeling

The water balance in the Han River area shows higher values throughout all parameters in 2050 where the precipitation is predicted to be higher [47]. As for the surface runoff, which is closely related to the land cover characteristics, it was higher in the Yeoju and Icheon areas located at the southern part of the River’s midstream, where the urban area increase was more pronounced than the other areas (Figure 10a). Groundwater absorption was predicted to be significantly decreased after 2000. This could be caused by the decrease in precipitation, but the main reason for this prediction would be the increase in surface runoff due to the rainfall mostly being limited in the summertime.
As for the evapotranspiration, it is influenced by temperature and wind speed. However, in this study, as the wind speed data used were limited, there were no significant changes in evapotranspiration where the range was 400 mm/y in the dry season at the least and 900 mm/y in the wet season at the most during the predicted years. The Geum River area (Figure 10b) and the Seomjin River area (Figure 10c) showed similar patterns for each prediction period, and these similarities are likely to be caused by the similarity in precipitation patterns due to these two areas’ proximity to each other. In general, there was a decrease in groundwater absorption after 2000, a later period of the simulation. Lastly, the Nakdong River area (Figure 10d) showed a very low groundwater absorption throughout the simulation period. This is likely to be caused by the location of the simulation area, which is located on the headwaters of the river, as well as the main land cover type being forest areas, which resulted in higher evapotranspiration [47].

4. Conclusions

This study examined the changes in the land cover map according to climate change and reviewed the result of climate change vulnerability until 2050 in water supply management areas. The analysis showed that the changes in land cover due to climate change are more likely to be affected by the special measures areas among the water supply management areas in the Han River water system and Geum River water system. For instance, increased urbanization in special measures areas leads to more impermeable surfaces, which results in higher surface runoff and potential flooding. The expansion of urban areas reduces the amount of permeable land, decreasing groundwater recharge rates and potentially lowering water table levels. These changes highlight the importance of carefully managing land use and balancing development with environmental sustainability. Such “special measures” areas are included in the water supply management area in real life, but the restrictions set by the law and policy are less strict compared to other water supply management areas, such as water source protection areas and waterfront areas.
These lenient restrictions caused relatively rapid urbanization, and modeling analysis showed the same result, attributing the changes to rapid urbanization. Thus, even though climate change adaptation requires a long-term measure, it is recommended that climate resilience projects in water supply management areas should prioritize such “special measures” areas. In other words, prioritizing these special measures areas first when planning Climate resilience projects and creating short- and medium-term plans, then expanding the projects to other water supply management areas would be more effective in preventing adverse effects of climate change. However, it would be imperative to establish a prioritized water supply management area and proceed with the project if necessary in consideration of the resources and the project characteristics. To summarize, the recommendation in this section is that it is sometimes necessary to prioritize the targeted area of a project to increase its effectiveness when a completely new type of project is being conducted using water system funds. This will also provide a solid foundation for informed decision-making and targeted water resource management efforts. Long-term solutions should prioritize improving sustainable practices, including the adoption of future climate scenarios, responsible land use, and enhanced water resource management strategies.

Author Contributions

J.H. crafted the overall manuscript, calculated the surface and groundwater contamination, and developed the arguments. J.L. designed the structure, developed the arguments, and contributed to the overall paper. Y.H. collected detailed information on climate change and developed the arguments. J.P. validated the methodology and contributed to the overall paper. All authors have read and agreed to the published version of the manuscript.

Funding

This research received no external funding.

Informed Consent Statement

Not Applicable.

Data Availability Statement

Data available on request due to restrictions.

Acknowledgments

This article is based on the findings of the research project Strengthening Climate Resilience of Water Source Management Area: Focusing on the Four Major Rivers of Korea (RE2018-14) and Development and Application of Management Indicators for Sustainable Groundwater Management (II) (RE2024-10), which were supported and conducted by Korea Environment Institute (KEI).

Conflicts of Interest

The authors declare no conflict of interest.

References

  1. IPCC (International Panel Climate Change). Managing the Risks of Extreme Events and Disasters to Advance Climate Change Adaptation; Field, C.B., Barros, V., Stocker, T.F., Qin, D., Dokken, D.J., Ebi, K.L., Mastrandrea, M.D., Mach, K.J., Plattner, G.-K., Allen, S.K., et al., Eds.; Special Report of Working Groups I and II of the Intergovernmental Panel on Climate Change; Cambridge University Press: Cambridge, UK, 2020. [Google Scholar]
  2. Delpla, I.; Jung, A.; Baures, E.; Clement, M.; Tomas, O. Impacts of Climate Change on Surface Water Quality in Relation to Drinking Water Production. Environ. Int. 2009, 35, 1225–1233. [Google Scholar] [CrossRef] [PubMed]
  3. Rehana, S.; Mujumdar, P. Climate Change Induced Risk in Water Quality Control Problems. J. Hydrol. 2012, 444, 63–77. [Google Scholar] [CrossRef]
  4. Heo, J.; Lim, C.; Lozano, J.; Regmi, N. Hydrological Transport and Fate of Brackish and Inorganic Contaminants with Anthropogenic Influence. Sustainability 2023, 15, 15564. [Google Scholar] [CrossRef]
  5. Ochoa, C.; Sierra, A.; Vives, L. Spatio-temporal effect of climate change on water balance and interactions between groundwater and surface water in plains. Sci. Total Environ. 2020, 722, 137886–137894. [Google Scholar] [CrossRef] [PubMed]
  6. IPCC (International Panel Climate Change). Impacts, Adaptation, and Vulnerability; Part A: Global and Sectoral Aspects; Field, C.B., Barros, V.R., Dokken, D.J., Mach, K.J., Mastrandrea, M.D., Bilir, T.E., Chatterjee, M., Ebi, K.L., Estrada, Y.O., Genova, R.C., Eds.; Contribution of Working Group II to the Fifth Assessment Report of the Intergovernmental Panel on Climate Change; Cambridge University Press: Cambridge, UK, 2021. [Google Scholar]
  7. IPCC (International Panel Climate Change). Synthesis Report; The Core Writing Team, Pachauri, R.K., Meyer, L.A., Eds.; Contribution of Working Groups I, II and III to the Fifth Assessment Report of the Intergovernmental Panel on Climate Change; Cambridge University Press: Cambridge, UK, 2021. [Google Scholar]
  8. Hargrove, W.; Heyman, J.; Mayer, A.; Mirchi, A.; Granados-Olivas, A.; Ganjegunte, G.; Gutzler, D.; Pennington, D.D.; Ward, F.A.; Garnica, L.; et al. The future of water in a desert river basin facing climate change and competing demands: A holistic approach to water sustainability in arid and semi-arid regions. J. Hydrol. Reg. Stud. 2023, 46, 101336–101358. [Google Scholar] [CrossRef]
  9. Gissi, E.; Manea, E.; Mazaris, A.; Fraschetti, S.; Almpanidou, V.; Bevilacqua, S.; Coll, M.; Katsanevakis, S. A review of the combined effects of climate change and other local human stressors on the marine environment. Sci. Total Environ. 2021, 755, 142564–142578. [Google Scholar] [CrossRef]
  10. Seoul Metropolitan Government. Technical Education on Improvement of Water Use Charge System; Seoul Metropolitan Government: Seoul, Republic of Korea, 2021. Available online: https://seoulsolution.kr (accessed on 3 October 2023).
  11. Fabian, P.; Kwon, H.; Vithanage, M.; Lee, J. Modeling, challenges, and strategies for understanding impacts of climate extremes (droughts and floods) on water quality in Asia: A review. Environ. Res. 2023, 225, 115617–115635. [Google Scholar] [CrossRef]
  12. Tiyasha, T.; Zaher, M. A survey on river water quality modelling using artificial intelligence models: 2000–2020. J. Hydrol. 2020, 585, 124670–124712. [Google Scholar] [CrossRef]
  13. Kim, J.; Won, J.; Kim, H.; Heo, J. Machine-Learning-Based Prediction of Land Prices in Seoul, South Korea. Sustainability 2021, 13, 13088. [Google Scholar] [CrossRef]
  14. Zhi, W.; Feng, D.; Tsai, W.; Sterle, G.; Harpold, A.; Shen, C.; Li, L. From Hydrometeorology to River Water Quality: Can a Deep Learning Model Predict Dissolved Oxygen at the Continental Scale? Environ. Sci. Technol. 2021, 55, 2357–2368. [Google Scholar] [CrossRef]
  15. National Institute of Environmental Research (NIER). Development of Water Quality and Aquatic Ecosystem Impact Assessment Model under Climate Change (I); National Institute of Environmental Research (NIER): Incheon, Republic of Korea, 2011; p. 297.
  16. National Institute of Environmental Research (NIER). Development of Water Quality and Aquatic Ecosystem Impact Assessment Model under Climate Change (II); National Institute of Environmental Research (NIER): Incheon, Republic of Korea, 2012; p. 189.
  17. Ahn, J. Water Quality Control and Management Measures in Response to Climate Change I; Korea Environment Institute: Seoul, Republic of Korea, 2010; p. 239.
  18. Ahn, J. Water Quality Control and Management Measures in Response to Climate Change II; Korea Environment Institute: Seoul, Republic of Korea, 2010; p. 221.
  19. Ahn, U.; Koh, D.; Heo, J.; Cho, B.; Kim, T.; Yum, B. Conceptualizing a multi-layered shingle aquifer model based on volcanic stratigraphy and water inflow to lava caves in Jeju Island, Korea. Hydrol. Process. 2021, 35, e14316. [Google Scholar] [CrossRef]
  20. Kim, B.; Kim, S.; Kim, H.; Jun, H. Evaluation of Water Resources in the Han River Basin Considering Climate Change and Land Cover Change. J. Korea Water Resour. Assoc. 2010, 43, 309–323. [Google Scholar] [CrossRef]
  21. Kim, J.; Choi, C. Analysis of the Impact of Climate and Land Cover Change on Runoff in a Watershed under Climate Change Scenarios. J. Korean Soc. Geospat. Inf. Sci. 2013, 21, 107–116. [Google Scholar]
  22. Han, H. Development of Land Use Prediction Model Considering Climate Change Scenarios; Korea Environment Institute: Seoul, Republic of Korea, 2011; p. 152.
  23. KMA (Korea Metrological Administration). KMA Weather Data Service, National Climate Data; KMA (Korea Metrological Administration): Seoul, Republic of Korea, 2022. Available online: https://data.kma.go.kr/cmmn/main.do (accessed on 29 November 2023).
  24. KMA (Korea Metrological Administration). KMA Climate Policy and Global Atmosphere Watch; KMA (Korea Metrological Administration): Seoul, Republic of Korea, 2023. Available online: http://www.climate.go.kr (accessed on 27 November 2023).
  25. Eastman, J.R. IDRISI Taiga Guide to GIS and Image Processing; Clark Labs, Clark University: Worcester, MA, USA, 2009. [Google Scholar]
  26. Jamali, L. Land use land cover mapping using advanced machine learning classifiers: A case study of Shiraz city, Iran. Earth Sci. Inform. 2020, 13, 1015–1030. [Google Scholar] [CrossRef]
  27. Jamali, L. Land use land cover modeling using optimized machine learning classifiers: A case study of Shiraz, Iran. Model. Earth Syst. Environ. 2020, 20, 1539–1550. [Google Scholar] [CrossRef]
  28. Sankarrao, L.; Kumar, D.; Rathinsamy, M. Predicting land-use change: Inter-comparison of different hybrid machine learning models. Environ. Model. Softw. 2021, 145, 105207–105219. [Google Scholar] [CrossRef]
  29. Rawat, P.; Bajaj, M.; Sharma, V.; Vats, S. A Comprehensive Analysis of the Effectiveness of Machine Learning Algorithms for Predicting Water Quality. In Proceedings of the International Conference on Innovative Data Communication Technologies and Application (ICIDCA), Uttarakhand, India, 14–16 March 2023; IEEE: Piscataway, NJ, USA, 2023; pp. 1108–1114. [Google Scholar] [CrossRef]
  30. Fattah, M.; Morshed, S.; Morshed, S. Multi-layer perceptron-Markov chain-based artificial neural network for modelling future land-specific carbon emission pattern and its influences on surface temperature. SN Appl. Sci. 2020, 3, 1–22. [Google Scholar] [CrossRef]
  31. Rezaeianzadeh, M.; Stein, A.; Cox, J.C. Drought forecasting using Markov chain model and Artificial Neural networks. Water Resour. Manag. 2016, 30, 2245–2259. [Google Scholar] [CrossRef]
  32. LeCun, Y.; Bengio, Y.; Hinton, G. Deep learning. Nature 2015, 521, 436–444. [Google Scholar] [CrossRef]
  33. Wu, W.; Xu, Y. Correlation analysis of visual verbs’ subcategorization based on Pearson’s correlation coefficient. In Proceedings of the International Conference on Machine Learning and Cybernetics, Qingdao, China, 11–14 July 2010; IEEE: Piscataway, NJ, USA, 2010; pp. 2042–2046. [Google Scholar] [CrossRef]
  34. Kim, N.; Chung, I.; Won, Y.; Arnold, J. Development and Application of the Integrated SWAT-MODLFOW Model. J. Hydrol. 2008, 356, 1–16. [Google Scholar] [CrossRef]
  35. Chung, I.; Kim, N.; Lee, J.; Sophocleous, M. Assessing Distributed Groundwater Recharge Rate Using Integrated Surface Water-Groundwater Modelling: Application to Mihocheon Watershed, South Korea. Hydrogeol. J. 2010, 18, 1253–1264. [Google Scholar] [CrossRef]
  36. Park, C.; Lee, J.; Koo, M. Development of a Fully-Distributed Daily Hydrologic Feedback Model Addressing Vegetation, Land Cover, and Soil Water Dynamics (VELAS). J. Hydrol. 2013, 493, 43–56. [Google Scholar] [CrossRef]
  37. Batelaan, O.; Smedt, F. GIS-based Recharge Estimation by Coupling Surface-Subsurface Water Balances. J. Hydrol. 2007, 337, 337–355. [Google Scholar] [CrossRef]
  38. Ministry of Environment. Korea National Environmental Assessment Map; Ministry of Environment: Sejong, Republic of Korea, 2024.
  39. Ministry of Environment. Korea Environmental Spatial Information Service; Ministry of Environment: Sejong, Republic of Korea, 2024. Available online: https://egis.me.go.kr/main.do (accessed on 14 November 2023).
  40. Seo, M.; Heo, J.; Kim, Y. Present and Potential Future Critical Source Areas of Nonpoint Source Pollution: A Case of the Nakdong River Watershed, South Korea. Environ. Sci. Pollut. Res. 2021, 28, 45676–45692. [Google Scholar] [CrossRef]
  41. Han River Basin Management Committee. Han River Basin Management Fund Statistics; Han River Basin Management Committee: Hanman-si, Republic of Korea, 2022. Available online: https://www.law.go.kr/LSW/lsInfoP.do?lsiSeq=191393#0000 (accessed on 7 December 2023).
  42. Geum River Basin Management Committee. Geum River Basin Management Statistics; Geum River Basin Management Committee: Daejeon-si, Republic of Korea, 2020. Available online: https://www.archives.go.kr/next/newsearch/listSubjectDescription.do?id=007046&pageFlag=C&sitePage=1-2-2 (accessed on 13 November 2023).
  43. Nakdong River Basin Management Committee. Nakdong River Basin Management Statistics; Nakdong River Basin Management Committee: Daegu-si, Republic of Korea, 2021.
  44. Yeongsan River and Seomjin River Basin Management Committee. Yeongsan River and Seomjin River Basin Management Fund Statistics; Yeongsan River and Seomjin River Basin Management Committee: Gwangju-si, Republic of Korea, 2022. Available online: https://www.kosenv.or.kr/upload/event (accessed on 27 October 2023).
  45. Huang, S.; Gan, Y.; Chen, N.; Wang, C.; Zhang, X.; Li, C.; Horton, D. Urbanization enhances channel and surface runoff: A quantitative analysis using both physical and empirical models over the Yangtze River basin. J. Hydrol. 2024, 635, 131194–1311201. [Google Scholar] [CrossRef]
  46. Kumar, V.; Agrawal, S. Evaluation and comparison of eight machine learning models in land use/land cover mapping using Landsat 8 OLI: A case study of the northern region of Iran. SN Appl. Sci. 2019, 1, 1448–1459. [Google Scholar]
  47. Whitehead, P.; Wilby, R.; Battarbee, R.; Kernan, M.; Wade, J. A Review of the Potential Impacts of Climate Change on Surface Water Quality. Hydrol. Sci. J. 2009, 54, 101–123. [Google Scholar] [CrossRef]
Figure 1. A perceptron expressed in a formula.
Sustainability 16 08805 g001
Figure 2. Multi-Layer Perception (MLP) neural network diagram in our study.
Sustainability 16 08805 g002
Figure 3. Transition potential analysis between different land use types: (a) bare area urbanization, (b) forest urbanization, (c) forest farmland, (d) farmland urbanization.
Sustainability 16 08805 g003
Figure 4. Comparison between (a) the actual land cover map and (b) the LCM model result.
Sustainability 16 08805 g004
Figure 5. ROC analysis result.
Sustainability 16 08805 g005
Figure 6. Historical land cover maps for (a) 1990 and (b) 2000.
Sustainability 16 08805 g006
Figure 7. Water supply management area subjected to the analysis.
Sustainability 16 08805 g007
Figure 8. Input data for land cover transition potential analysis using MLP.
Sustainability 16 08805 g008
Figure 9. Land-use changes in 2050 for (a) Han River, (b) Geum River, (c) Seomjin River area, and (d) Nakdong River area.
Sustainability 16 08805 g009
Figure 10. Predicted water balance distribution in 2050 for (a) Han River, (b) Geum River, (c) Seomjin River area, and (d) Nakdong River area.
Sustainability 16 08805 g010
Table 1. Large-scale land cover map classification.
Name (Classification Code)Notes
Habitation/construction area (100)Buildings such as residential, commercial, industrial, and transportation facilities
Agricultural area (200)Agricultural areas such as rice paddies and fields, fruit trees and street trees, livestock/dairy facilities
Forest area (300)Land-growing trees in clusters
Vegetative area (400)Land covered with vegetation (both natural and anthropogenic)
Wetlands (500)Wetlands where the moisture is maintained by natural environments
Bare soil (600)Bare land without any vegetation cover
Water bodies (700)Low areas of standing water, such as lakes, reservoirs, swamps
Disclaimer/Publisher’s Note: The statements, opinions and data contained in all publications are solely those of the individual author(s) and contributor(s) and not of MDPI and/or the editor(s). MDPI and/or the editor(s) disclaim responsibility for any injury to people or property resulting from any ideas, methods, instructions or products referred to in the content.

