1. Introduction
Unbalanced and uncoordinated regional development is common in countries worldwide [
1], and the southern and western regions of the United States, Hokkaido, Japan, and the southern region of Italy are relatively underdeveloped [
2,
3,
4]. From a worldwide perspective, serious regional development imbalances and uncoordinated development within any country can result in excessive income disparity, cause social problems, and further hinder sustainable economic development [
5]. Therefore, all countries attach great importance to the issue of eliminating disparities and achieving balanced development. The issue of regional coordination and balanced development has, thus, become a hot topic and the focus of research by scholars in economics, geography, and regional disciplines. At present, under this new development pattern, many serious challenges faced by regions in terms of economic development quality, urban function positioning, and ecological environmental protection [
6] are, for deep-seated reasons, prominent manifestations of unbalanced and uncoordinated regional development.
In long-term economic and social development, three models and theoretical schools of balanced growth, unbalanced growth, and coordinated development have been formed according to different regional development modes. The first two were proposed by Western economists, while the latter mainly originated from China’s regional development practices after its reform and opening up. With the expansion of the connotations of regional coordinated development, especially after the release of the SDGs, the goals of regional coordinated development have begun to pay more attention to the dimensions of ecological civilization, health and well-being, and social equality. This has also made it possible and inevitable for different disciplines in geography to study regional coordinated development from different perspectives [
7,
8]. The two concepts of equilibrium and non-equilibrium, and coordination and non-coordination are both contradictory and closely related in practice and are dialectically unified. China has achieved gratifying results in regional development, but it should be noted that the problems of disharmony and imbalance still widely exist in economic and social life. Therefore, it is important to explore the level of coordinated and balanced regional development based on a multidimensional perspective and propose a regulatory path of coordinated and balanced development according to local conditions, which is of theoretical and practical significance.
Optimizing and regulating the pattern of coordinated regional development has always been an important task at every stage of development in the YRD region. After the reform and opening up to the development of Pudong, the establishment of the Shanghai Economic Zone opened the initial exploration for the coordinated governance of the YRD region, but this process was terminated with the abolition of the Shanghai Economic Zone Planning Office in 1988. Also, the coordinated development of the YRD region entered the fast track with the establishment of the Joint Meeting of Directors of the Yangtze River Delta Collaboration Office (Commission) in 1992, which was upgraded to the Yangtze River Delta Cities Economic Coordination Council in 1997, and the establishment of the Shanghai–Suzhou–Zhejiang Economic Cooperation and Development Symposium system in 2004. The introduction of a series of important documents, such as the Yangtze River Delta Regional Plan in 2010, the Yangtze River Delta City Cluster Development Plan in 2016, and the Yangtze River Delta Regional Integrated Development Plan Outline in 2019, from the beginning of the new century to around the time of the first China International Import Expo in 2018 marked a new era of coordinated development in the YRD region.
On the basis of continuing the existing research results, this article constructed a regional coordinated and balanced development index system based on the guidance of the SDGs; quantitatively measured the evolution processes, stage characteristics, spatial patterns, and development trends of the coordinated and balanced development of various cities in the YRD region; and divided several development types of areas according to their spatial characteristics, proposing corresponding countermeasures and suggestions.
The remainder of this paper is organized as follows.
Section 2 reviews the literature on the connotations of regional coordinated and balanced development, traditional measurement methods, and regulatory strategies.
Section 3 constructs the evaluation indicators, evaluation methods, and data sources for coordinated and balanced development.
Section 4 analyzes the coordinated and balanced development levels and spatial heterogeneity in the YRD region in 2020.
Section 5 conducts a study on the zoning of the YRD region and proposes specific regulatory measures for each zone.
Section 6 summarizes the conclusions and suggests future research areas.
2. Literature Review
2.1. Connotations of Regional Coordinated and Balanced Development
Regional coordinated and balanced development, which was first proposed by Professor Cheng Changchun in 2015 [
9], refers to the promotion of more efficient, fair, and sustainable development of the regional economy, enabling the market to play a decisive role in optimizing the allocation of regional resources and better play the regulatory role of the government, and promoting coordinated and common development across regions while maintaining spatial balance in the economy, population, and ecology, ultimately forming general equality of public services between different regions. It pursues a state where living conditions are generally equal, living standards are generally equal, the economic and population distribution is generally balanced, and the economic and population distribution is coordinated with the local resources and environmental carrying capacity.
Specifically, it includes three aspects: coordination, balance, and integration. The connotation of “coordination” involves the four key areas of industrial, urban, social, and human–nature relationships for regional development. The connotation of “balance” comprises the three major goals proposed by the Chinese government: “striving to achieve equal access to basic public services, relatively balanced access to infrastructure, and roughly equivalent guarantees of people’s basic living standards.” The connotation of “integration” is based on General Secretary Xi Jinping’s requirement to “build the Yangtze River Economic Belt (including the YRD region) into a golden economic belt that is more ecologically beautiful, with smoother transportation, more coordinated economy, more unified market, and more scientific mechanisms” [
10].
2.2. Measurement Methods and Regulatory Strategies of Regional Coordinated Development
For the research on the comprehensive measurement of regional coordinated development, the American scholar R. J. Estes proposed the Index of Social Progress (ISP) in 1984, including a series of indicators in 10 areas such as education, health status, the status of women, national defense, and economy. In 2019, the Human Development Report pointed out that as the gap between people’s basic living standards continues to narrow and the number of people out of poverty, hunger, and disease shows unprecedented growth, the new generation of inequality will revolve around education as well as science, technology, and climate change. Based on this, foreign scholars have attempted to measure development by integrating environmental, economic, and social development [
11,
12,
13], adding infrastructural development, innovation development, and green development to the comprehensive measurement model [
14,
15,
16]. Domestic scholars’ research on the comprehensive measurement of coordinated regional development includes three categories. The first category studies the development gap and coordinated development between regions. The development gap is generally measured with statistical indicators such as the coefficient of variation and the Thayer index [
17,
18,
19]. The second category proposes countermeasures to promote coordinated regional development via the analysis of differences between regions and comparative analysis [
20,
21,
22]. The third category studies the coordinated development between various elements within regions [
23,
24,
25].
For the study of coordinated regional development regulation and countermeasures, the regional coordination of foreign governments began in the 1930s and went through four stages: the first three stages targeted employment and the economy and encouraged private investment, large-scale infrastructure construction, investment in human capital, the establishment of development funds, the adjustment of industrial structures, fiscal and financial support, and locational subsidies as means. The fourth stage began in the 1990s, focusing on integrated management, strengthening cooperation between universities and enterprises, strengthening investment in human capital, paying attention to ecological management, and developing a special economy [
26,
27,
28]. In a sense, the key to regional coordination is the balance of rights. Most domestic scholars believe that countermeasures to promote coordinated regional development include accelerating the innovation drive and industrial transfer, improving the mechanism of coordinated regional development, and building a legal system for coordinated regional development [
29,
30,
31]. In addition, other scholars believe that the equalization of basic public services in transportation, education, and medical care is key to effectively breaking the regional divide problem.
In summary, the existing research has laid a solid foundation for the in-depth exploration of coordinated development in this article. However, the aforementioned research focused on exploring coordinated and balanced development from a theoretical perspective or only conducting quantitative analysis in dimensions such as economic development, people’s living standards, and basic public services. In an era where the notion of “people-centered” sustainable development is becoming more prominent, the relevant research lacks consideration of dimensions such as coordination between humans and nature, ecological beauty, and reasonable mechanisms. Therefore, there are also few optimization paths proposed based on these dimensions. At present, there are many challenges to the integrated and high-quality development of the YRD region, the most important being the uneven and uncoordinated development between regions. Most existing studies have focused on exploring coordinated and balanced development on a theoretical level, and there is a lack of quantitative evaluation and regulation studies on the coordinated and balanced development of the region supported by this theory. Therefore, this study took the YRD region as an example, constructed an evaluation index system for coordinated and balanced development, conducted a multidimensional assessment of 41 prefecture-level-and-above cities in the region, systematically analyzed the current situation of coordinated and balanced development in the YRD region and its spatial pattern characteristics, and proposed heterogeneous regulation paths via clustering and zoning. Through this, we aimed to further deepen the knowledge of the concept of coordinated and balanced development at the theoretical and practical levels and provide intellectual support for promoting the knowledge of the concept of coordinated and balanced development at both the theoretical and practical levels and high-quality regional development. (High-quality regional development is an important goal of coordinated regional development and an important aspect of promoting Chinese-style modernization. It includes the stability of growth, the balance of development, and the sustainability of the environment, which are highly consistent with coordinated regional development).
3. Materials and Methods
3.1. Study Area
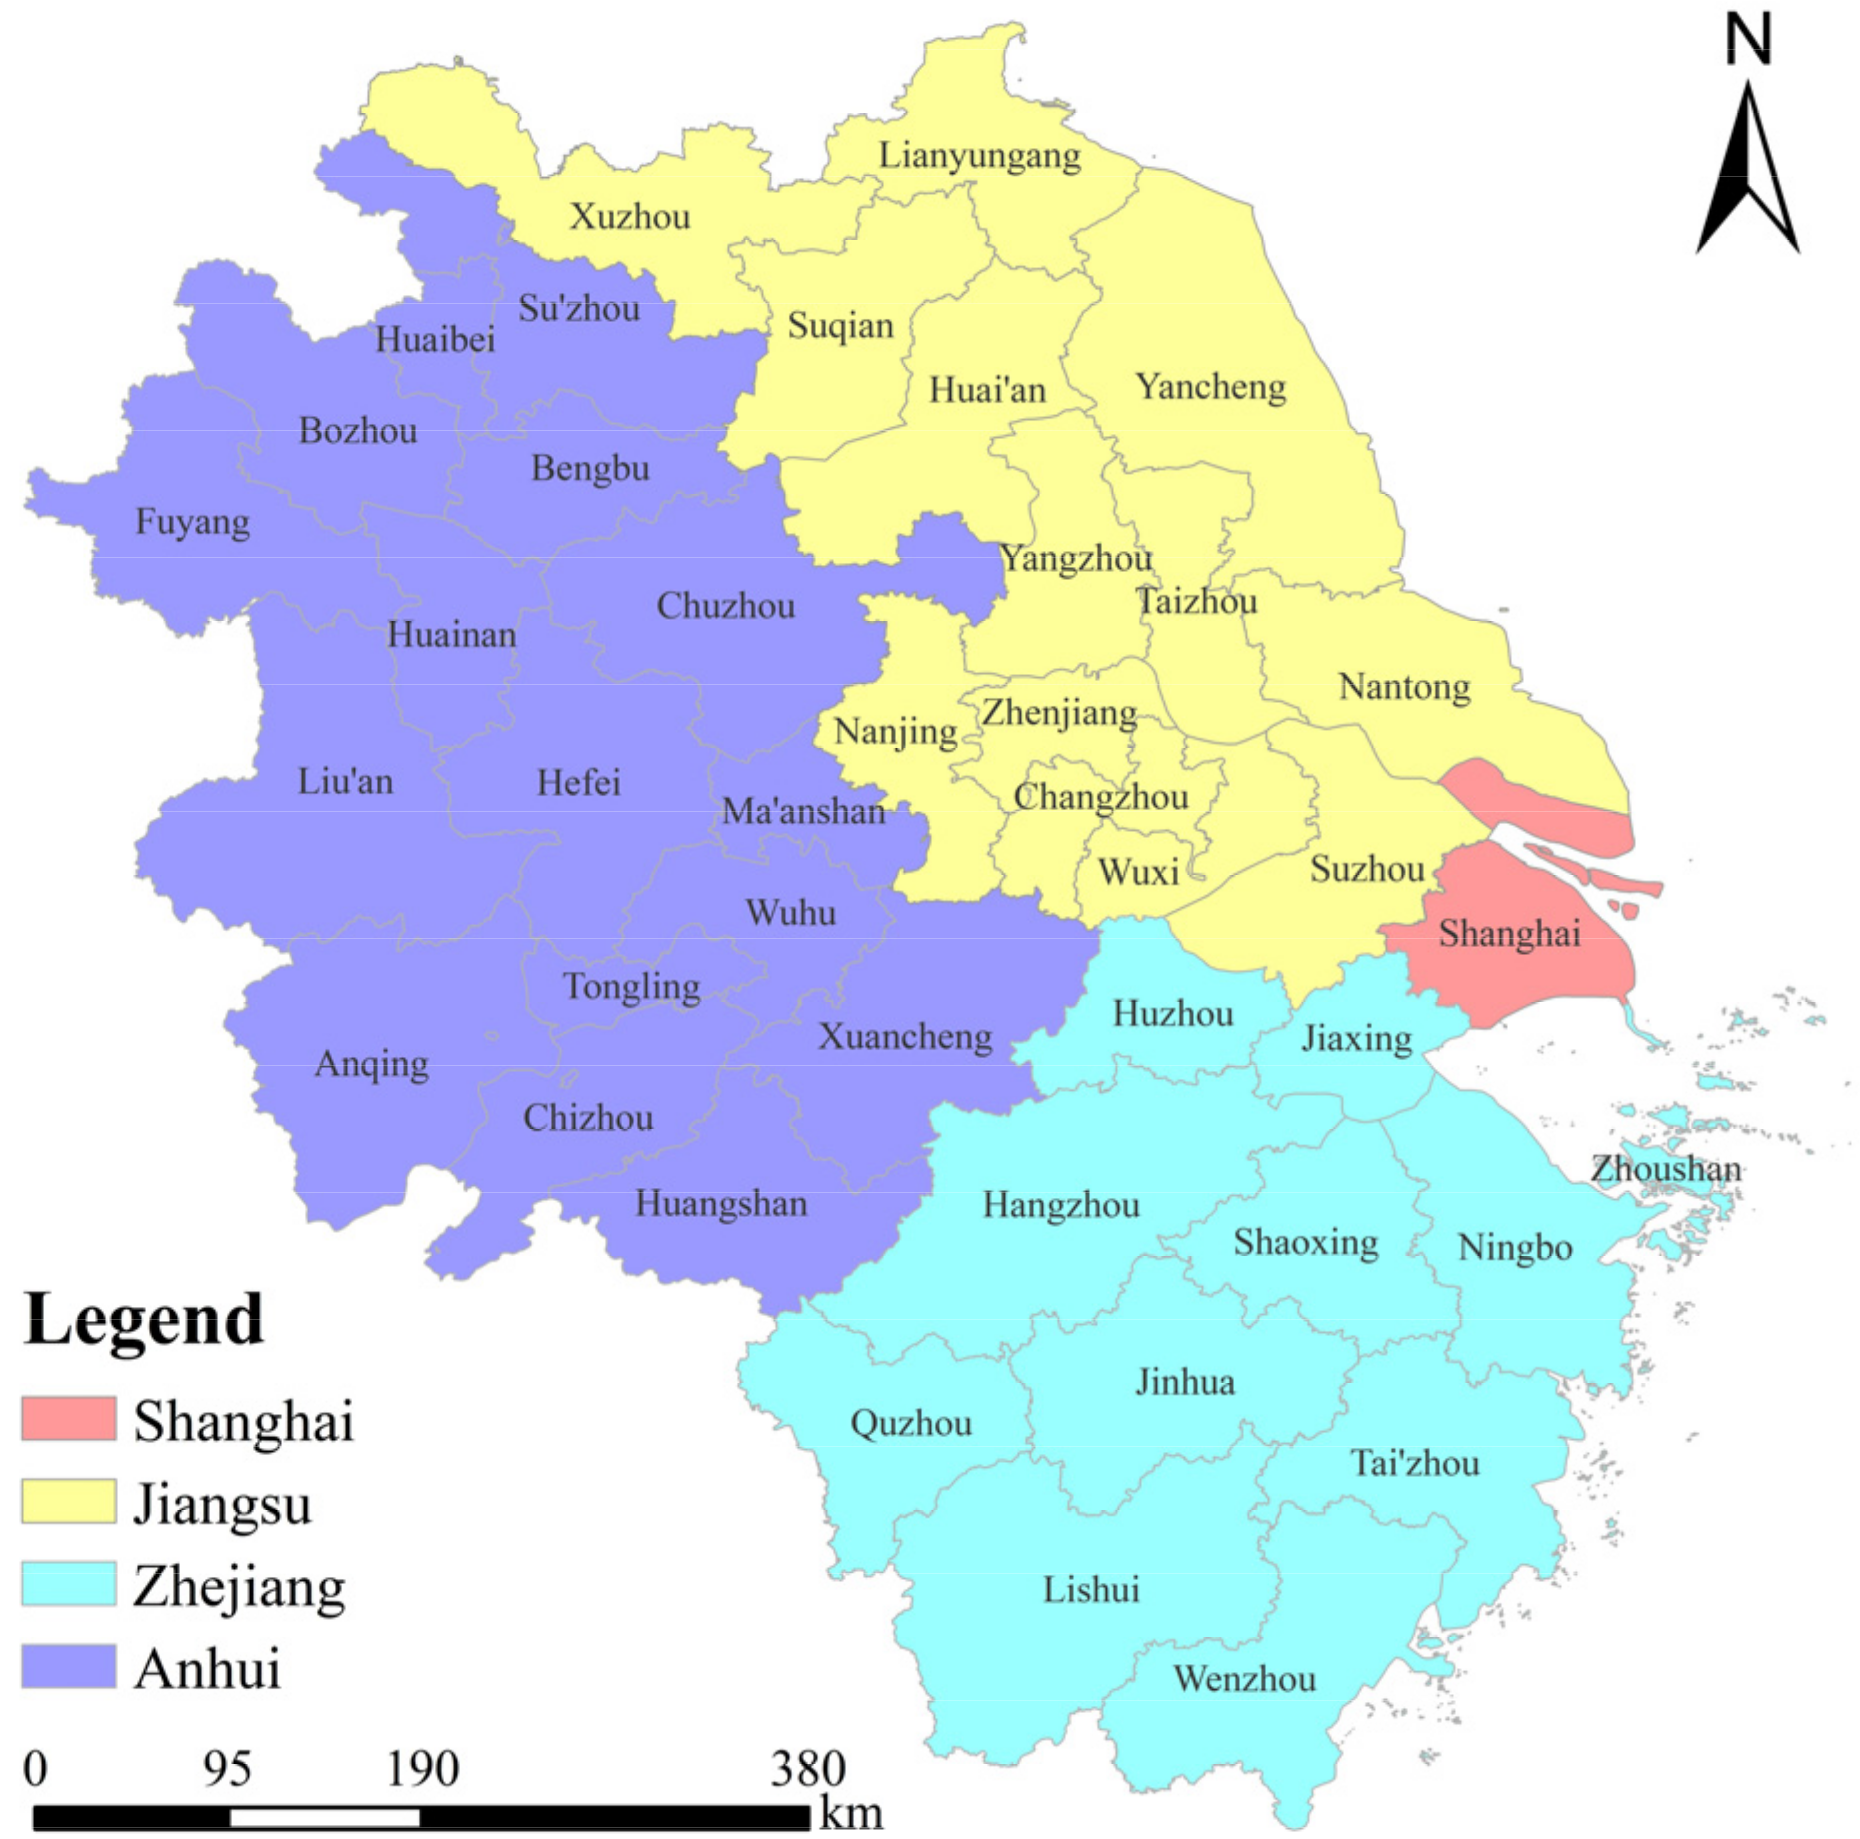
The YRD region consists of Shanghai, Jiangsu, Zhejiang, and Anhui (
Figure 1), which feature the highest comprehensive strength and deepest embedding in economic globalization in China, with a highly developed export-oriented economy, accounting for 16% of the population, 24% of the GDP, and 42% of the total imports and exports in 2022, with 3.7% of the national territory. In the context of regional integration, the coordinated and balanced development characteristics of the YRD region are the most fully manifested. It is not only a well-developed urban agglomeration with a high level of interconnection but also a well-developed sub-level metropolitan area.
3.2. Methods
3.2.1. Indicator System Construction
The theoretical foundation of regional coordinated and balanced development originates from the theory of coordinated development and focuses on the prominent manifestations of regional imbalance and disharmony, as well as the reality of studying vast territories, abundant resources, and complex and diverse regional situations. It integrates the orientation of the SDGs, making it significantly different from other regional development models. On this basis, the scientificity, applicability, reliability, objectivity, accessibility, comparability, and other aspects of the data indicators were also considered, striving to reflect the concept and connotations of regional coordinated and balanced development in the process of indicator construction. Compared with previous research, the indicator system still retained traditional indicators such as people’s living standards, basic public services, and industrial coordination but added new indicators such as human–nature coordination, ecological beauty, and mechanism science.
Based on the theoretical connotations of coordinated and balanced development, this study constructed an index system consisting of three aspects: balance, coordination, and integration (
Table 1). The construction of the ‘balance index’ was based on the ‘Opinions on Establishing a New Mechanism for More Effective Coordinated Regional Development’ issued by the State Council, which proposes ‘to strive to achieve equalization of basic public services, more balanced infrastructure access, and roughly the same level of people’s basic living security’. The ‘Coordination Index’ was constructed based on four key areas of regional development: industry, town, society, and people and nature. It was specifically designed as ‘industry coordination’, ‘society coordination’, and ‘people and nature coordination’. The ‘integration index’ was based on the ideal state achieved under the coupling mechanism of ‘integration and symbiosis’ and was specifically designed with five secondary indicators and ten tertiary indicators, such as ‘beautiful ecology’, ‘smooth transportation’, ‘economic coordination’, ‘market unification’, and ‘scientific mechanism’.
3.2.2. Entropy Value Method
The entropy method is based on the idea of information entropy and determines the weights of indicators according to their relative change degrees in the system, which can overcome the overlap of information between multiple indicator variables and the subjectivity of artificially determined weights and is suitable for the comprehensive evaluation of multiple indicators [
31]. The main function of this method was to calculate the index scores for each dimension of each city in the YRD region and summarize them to obtain the corresponding city’s coordinated and balanced development index. Its main steps are listed below.
- (1)
The construction of the original index data matrix: We supposed that there were m programs to be evaluated and n evaluation indicators, forming the original indicator data matrix . Then, was the indicator value of the j-th indicator of the i-th program to be evaluated.
- (2)
Data standardization: Because of the differences in the scale, order of magnitude, and positive and negative orientations of the indicators, the initial data had to be standardized. For the positive indicator,
and for the negative indicator,
The standardization matrix was defined as , where .
- (3)
The entropy value of the evaluation index was calculated.
- (4)
The coefficient of variability of the evaluation indicators was calculated.
- (5)
The weights of the evaluation indicators were defined.
- (6)
The evaluation value of the sample was calculated. The product of the weight of the j-th indicator and the proximity of the j-th evaluation indicator of the i-th sample in the standardized matrix were used as the evaluation values of , i.e., , and the evaluation value of the i-th sample .
3.2.3. Gini Coefficient
In this study, the Gini coefficient was used to quantitatively analyze the spatial differences in the coordinated development indices of the cities and stream segments in the YRD region. The Gini coefficient can visually reflect the spatial distribution of urban development within a certain region and can be calculated using multi-indicator data with high adaptability [
12]. The specific calculation formula is as follows:
where
G and
μ represent the Gini coefficient and the expected coordinated balanced development index of each group, respectively;
N represents the observed value; and
yi and
yj represent the coordinated and balanced development indices of cities
i and
j, respectively.
3.2.4. Local Spatial Autocorrelation
Spatial autocorrelation is used to reveal the potential interdependence between certain attribute data in space and can generally be divided into global and local autocorrelations [
32]. Among them, layout autocorrelation can reflect the clustering pattern of indices in regional cities, mainly including high–high clustering (HH), where high values are surrounded by high values; high–low clustering (HL), where high values are surrounded by low values; low–high clustering (LH), where low values are surrounded by high values; low–low clustering (LL), where low values are surrounded by low values; and no obvious clustering pattern. The main function of this method was to identify urban spatial agglomeration conditions with different levels of coordinated and balanced development. The formula is as follows:
where
is the attribute of element
I;
is the average of the corresponding attributes;
is the spatial weight between elements
i and
j; and
n is the total number of elements.
3.2.5. Hierarchical Cluster Analysis
Hierarchical cluster analysis is the most widely used method in cluster analysis. It is a multivariate statistical analysis method for quantitatively classifying multiple samples or indicators and research objects according to their characteristics regarding the distances of the relationships [
33]. In this study, the DPS data-processing system was used to cluster 41 cities in the YRD region. To better reflect the relative relationship between the characteristic quantities, the cardinality distance was selected as the metric function after the standardization change, and the 41 cities in the YRD region were divided into four major categories using the variable class averaging method. The main function of this method was to divide several development types based on the coordinated and balanced development indices of all cities. The recursive formula for the variable class averaging method is as follows:
where
is the interclass clustering,
n is the number of samples, the coefficient
β is < 1, and the size is determined by the relative importance between the two terms.
3.3. Data Sources and Processing
The data in this paper were mainly obtained from the China City Yearbook 2021, the China City Construction Statistical Yearbook 2021, the 2021 provincial and municipal statistical yearbooks, the 2021 annual reports of relevant enterprises, and the official website of the National Bureau of Statistics and additional statistics from other authoritative institutions (Other authoritative institutions included the ecological and environmental departments, transportation departments, and labor and social security departments of various provinces and cities in the YRD region.). For some missing data, this study adopted multi-year regression or interpolation to deal with them. To address the problem of inconsistent units of raw data, this study adopted the maximum and minimum value methods for standardization to eliminate the possible influence of the dimension on the calculation results.
4. Empirical Results and Analysis
4.1. Analysis of Coordinated and Balanced Development Index
From the comprehensive evaluation results of the ‘Coordinated and Balanced Development Index’ (
Table 2), the highest score among the 41 cities in the YRD region in 2020 was for Shanghai (2.7221), and its indices of balance (2.3927), coordination (2.3379), and integration (3.3529) were the highest, which represented a high level of balanced and coordinated development. Suzhou, Hangzhou, Nanjing, and Wuxi were ranked 2–5, with Jiangsu Province occupying three of the top five positions, indicating that the regional central cities in the YRD region had a clear advantage in their overall scores. Ningbo is a planned city, and Hefei, the capital of Anhui Province, also has obvious advantages. Changzhou ranked 8th and 7th in the indices of balance and coordination, respectively, but 15th in the ranking of integration, and Huzhou performed relatively well in three sub-categories, ranking 14th, 11th, and 14th, respectively. Among the top 20 cities in terms of scores, except for Shanghai, Jiangsu Province occupied 7 seats (Suzhou, Nanjing, Wuxi, Changzhou, Nantong, Zhenjiang, and Yangzhou) accounting for 35%; Zhejiang Province occupied 9 seats (Hangzhou, Zhoushan, Ningbo, Huzhou, Shaoxing, Jiaxing, Wenzhou, Taizhou, and Jinhua) accounting for 45%; and Anhui Province occupied 3 seats (Hefei, Wuhu, and Tongling) accounting for 15%. Overall, the results followed a trend of ‘high in the east and low in the west, decreasing in the northeast and southwest’.
In terms of the differences between the total index and the balance, coordination, and integration indices, the top 20 cities in each index obtained differences of 3.09 times, 2.47 times, 2.60 times, and 3.93 times, with the smallest gap in the coordination index and the largest gap in the integration index. The indices of the 41 cities obtained differences of 6.27 times, 10.17 times, 4.64 times, and 9.41 times, with the largest gap in the balance and integration indices and the smallest gap in the coordination index. The gap between the indices of balance and integration was the largest, and the gap between the indices of coordination was the smallest, which shows that the gap between the regional development of cities in the YRD region, especially in Anhui, Jiangsu, Zhejiang, and Shanghai, was still large.
4.2. Results of Three Sub-Indices
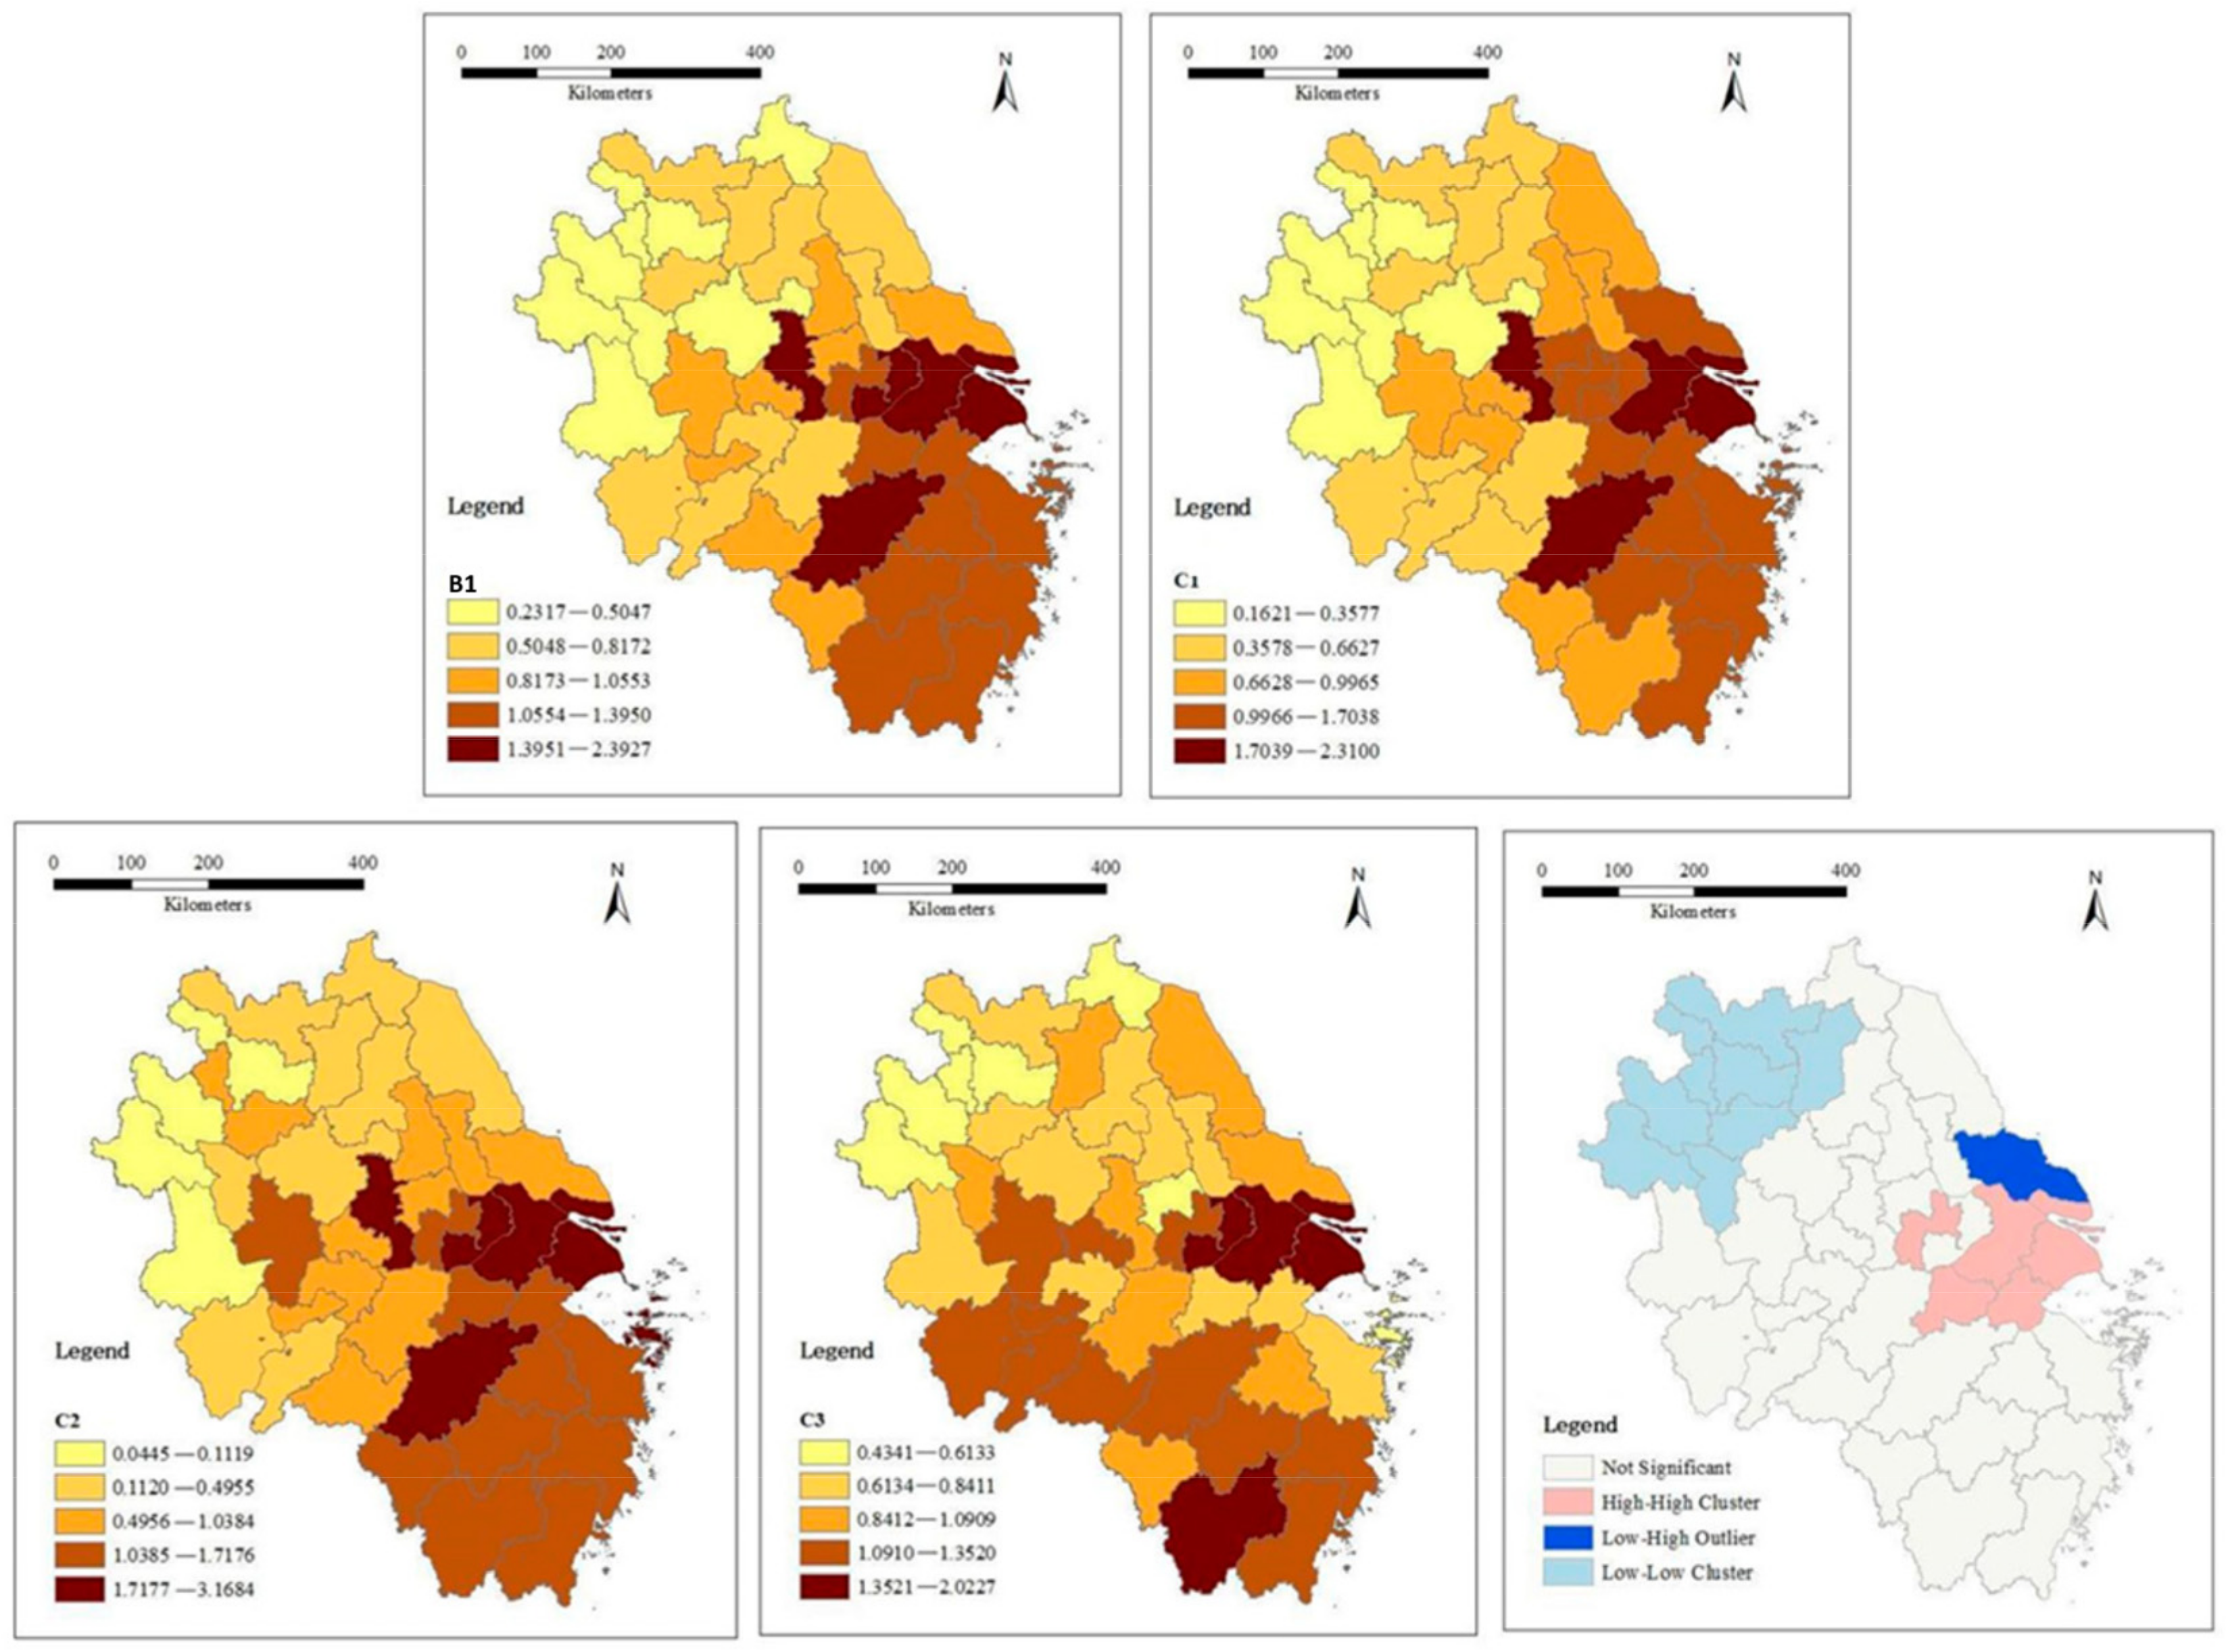
4.2.1. Balanced Index
The top 10 cities among the 41 cities in the YRD region were Shanghai, Suzhou, Hangzhou, Wuxi, Nanjing, Ningbo, Zhoushan, Changzhou, Jiaxing, and Shaoxing, and the ratio between Jiangsu, Zhejiang, Shanghai, and Anhui was 6:11:1:2, with Zhejiang Province significantly outperforming the other 2 provinces. The results of the local spatial autocorrelation also reflect this trend, with high values extending from southern Jiangsu to Shanghai and Zhejiang, and low–low values in northwestern Jiangsu and northern Anhui (see
Figure 2, the lower right Lisa diagram).
In terms of the balance index and degree of difference between the high and low levels of the three tertiary indicators, the gap in the basic public facilities index was relatively small (the highest in Wuxi (2.0227) was 4.66 times higher than the lowest in Huaibei (0.4341), while the gap in the basic public services index was extremely large (the highest in Shanghai (3.1684) was 71.2 times higher than the lowest in Bozhou (0.0445)). The main reason for this was the notable difference between regions in the index of public library collections per 10,000 people, with the highest value for Shanghai (54,838) and the lowest for Fuyang (1721), showing an extremely high ratio of 31.9.
In terms of the relationship between the balance index and the total index of the top 20 cities, except for a few cities such as Nantong (ranking 18th in the balance index but 13th in the total index), Jiaxing (ranking 9th in the balance index but 12th in the total index), and Hefei (ranking 17th in the balance index but 8th in the total index), the balance indices of the other cities showed large fluctuations. No significant inconsistencies were noted with the coordinated balanced index.
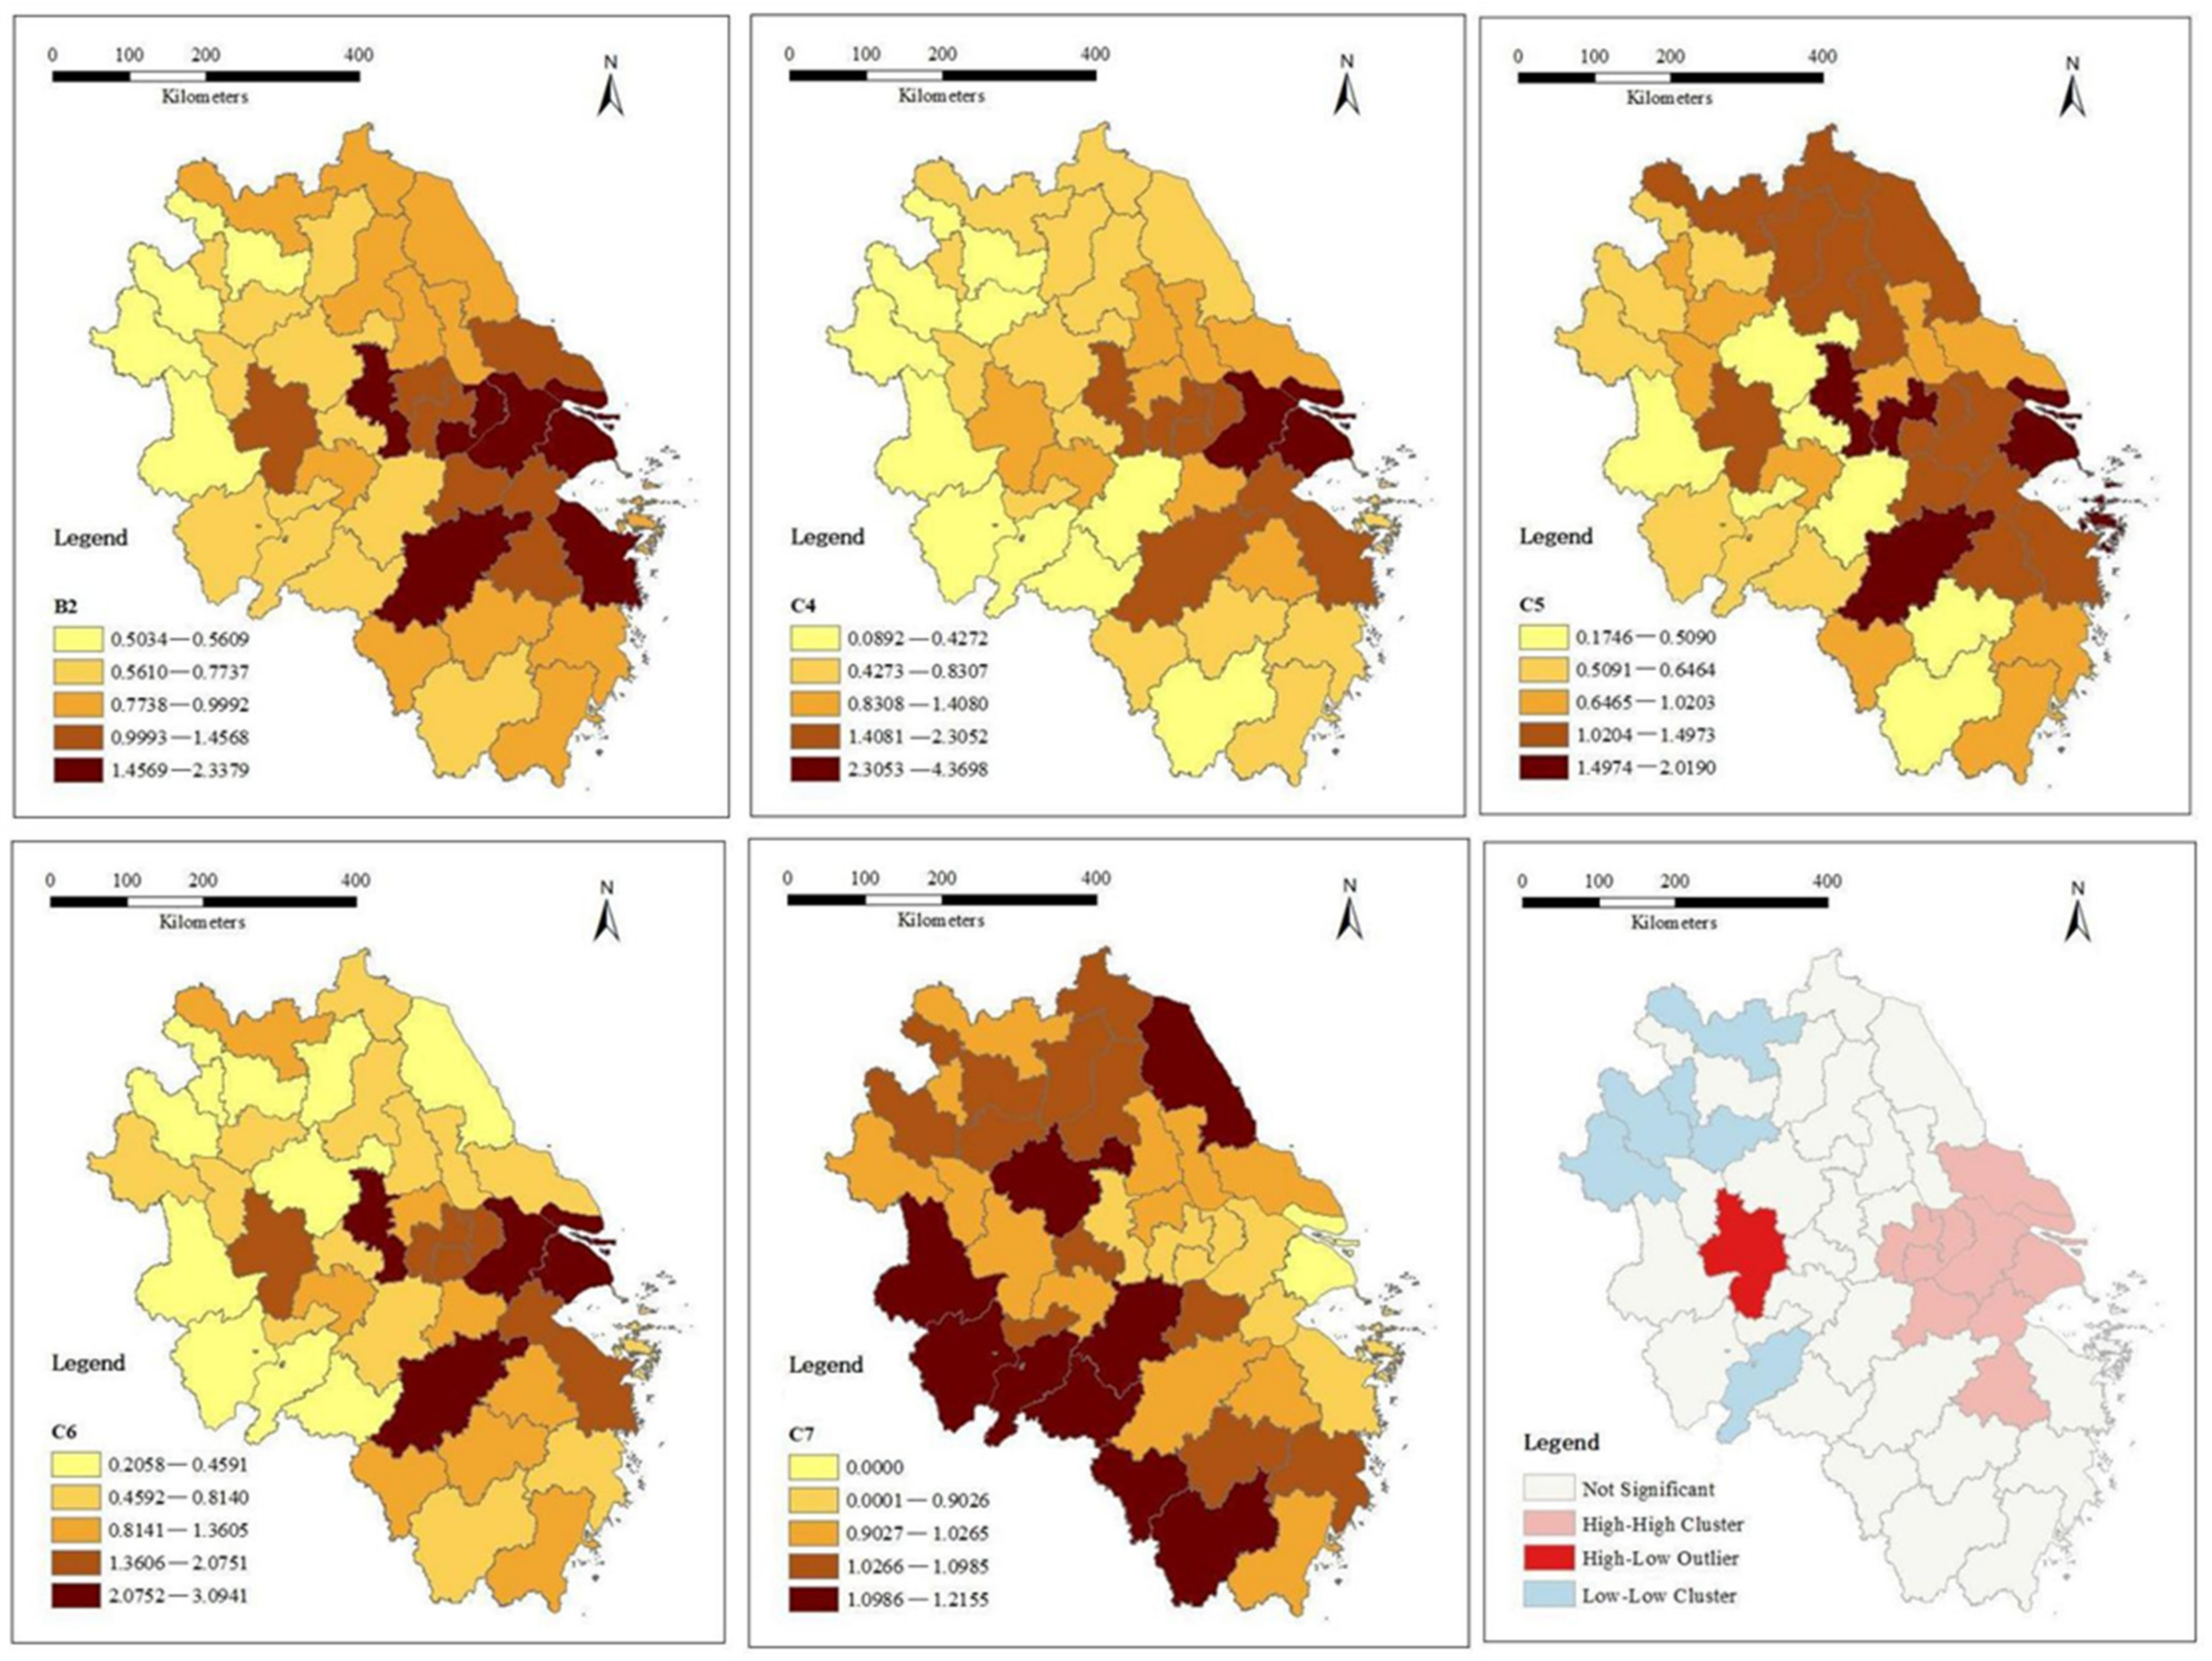
4.2.2. Coordinated Index
The top 10 cities among the 41 cities in the YRD region were Shanghai, Suzhou, Hangzhou, Nanjing, Wuxi, Ningbo, Changzhou, Jiaxing, Shaoxing, and Hefei. The ratio of Jiangsu, Zhejiang, Shanghai, and Anhui was 9:8:1:2. Anhui only had Hefei and Wuhu in the top 20, high–high values were distributed around Shanghai in various cities in Jiangsu and Zhejiang near Shanghai, and low values were almost all located in Anhui.
Compared with balance and integration, the gap in the coordination index was relatively small, but the degree of difference between the high and low coordination indices and the four tertiary indicators, including industrial coordination and human–nature coordination, was still large. The highest industrial coordination was in Shanghai (4.3698), which was 49 times higher than the lowest in Bozhou. The reason for this was that the total profits of enterprises above the scale in the industrial coordination sub-indicators vary greatly, and this indicator is, in a sense, one of the important reference indicators for the degree of regional economic development, which, in turn, directly determines the level of economic density. In human–nature coordination, as three of the indicators were the population density ratio, economic density ratio, and urban density ratio, the closer to one, the better the coordination. Therefore, Shanghai’s high population density and economic density were unfavorable from the perspective of ecological bearing (see
Figure 3, the lower right Lisa diagram).
Comparing the rankings of the coordination indices and total indices of the top 20 cities, except for individual cities such as Zhoushan (ranking 16th in the coordination index but 6th in the total index) and Yangzhou (ranking 14th in the coordination index but 19th in the total index), the coordination indices of all other cities were relatively stable and did not appear to be significantly inconsistent with the coordination balance indices.
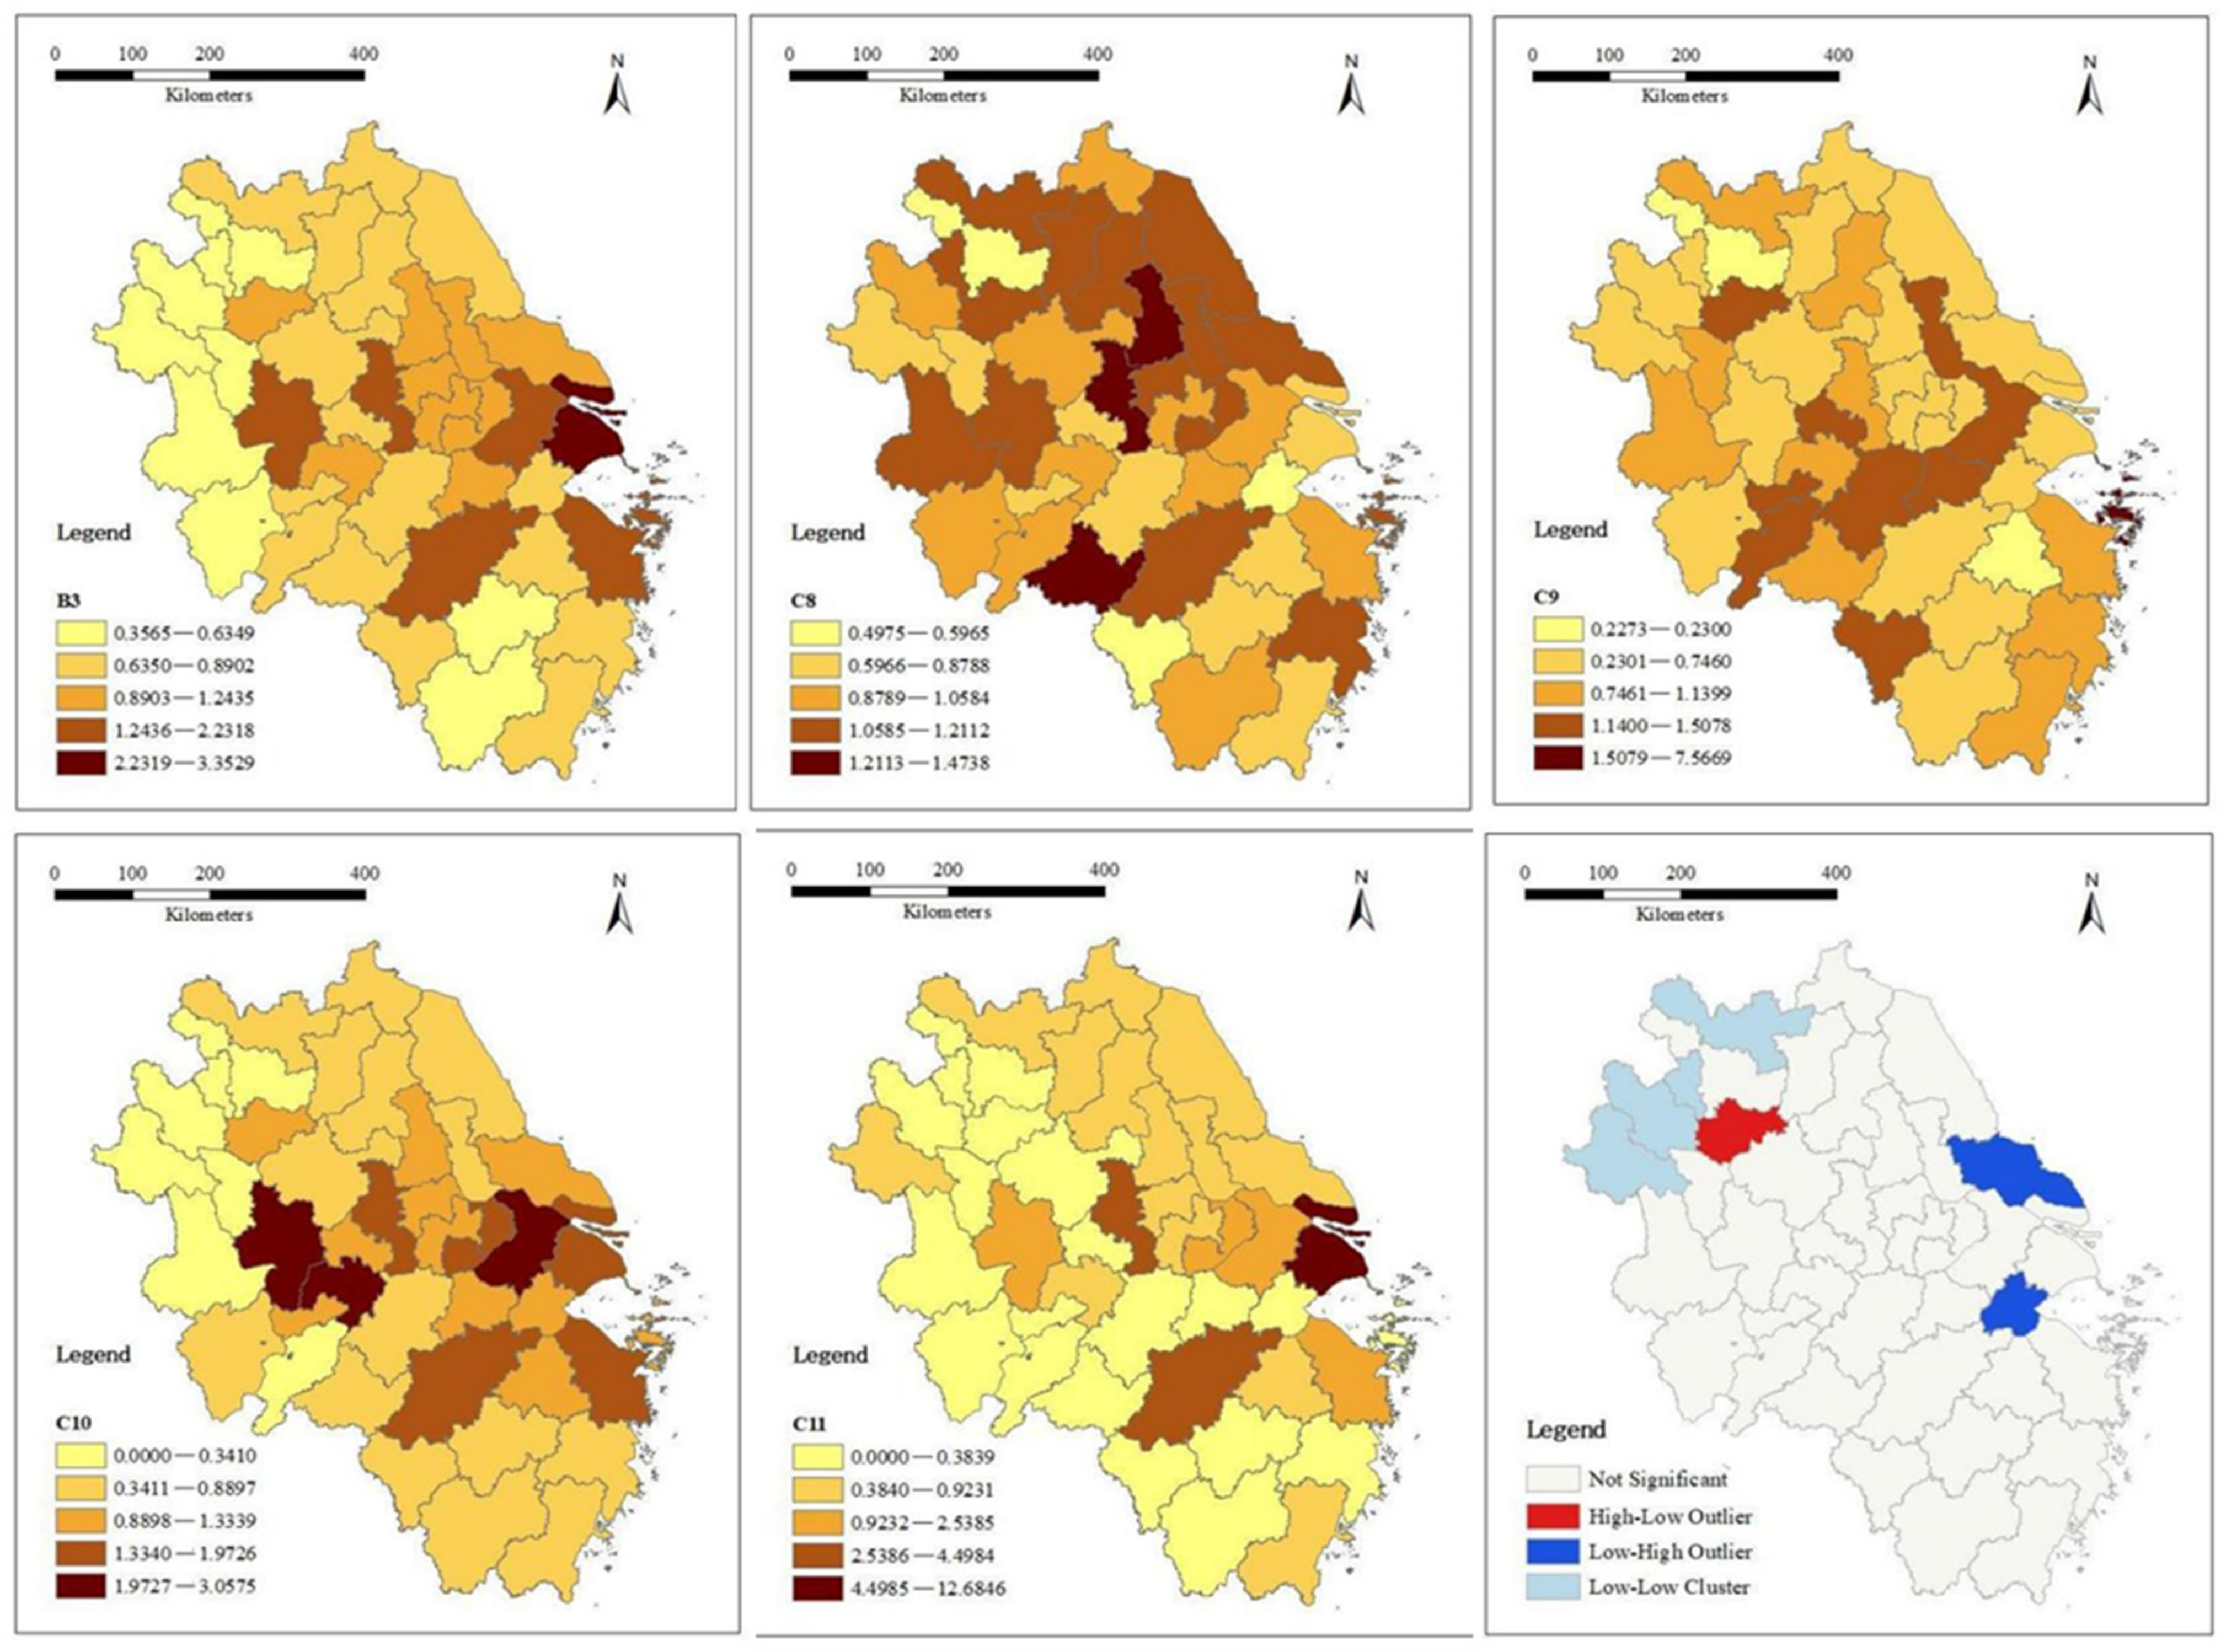
4.2.3. Integration Index
The top 10 cities among the 41 cities in the YRD region were Shanghai, Zhoushan, Hangzhou, Nanjing, Suzhou, Hefei, Ningbo, Wuhu, Wuxi, and Bengbu in order of score. The ratio between the top 20 cities in Jiangsu, Zhejiang, Shanghai, and Anhui was 9:5:1:5, and the number of cities in Anhui Province slightly increased (see
Figure 4).
Regarding the integration index and the degree of difference between the high and low values of the four tertiary indicators, the difference in the ecological index was the smallest (the highest was for Huangshan, which was 2.96 times than that of the lowest, Quzhou), but the difference in the market index was unusually large, with the highest being more than 560 times higher. This was mainly owing to the large difference between the two indicators of the market unification sub-index. For example, the number of branches of the world’s top 100 companies was 78 in Shanghai but only 1 in many cities, while the number of branches of the domestic top 100 companies also reflected this trend.
Comparing the ranking of the integration index values and the total index values of the top 20 cities, the difference was greater than that between the balance index and the coordination index values. Many cities that did not appear in the top 20 for the overall index appeared in the top 20 for the integration index, such as Taizhou (ranking 11th in the integration index but 21st in the total index) and Bengbu (ranking 10th in the integration index but 26th in the total index).
4.3. Regional Regulation Priorities for the YRD Region in the Future
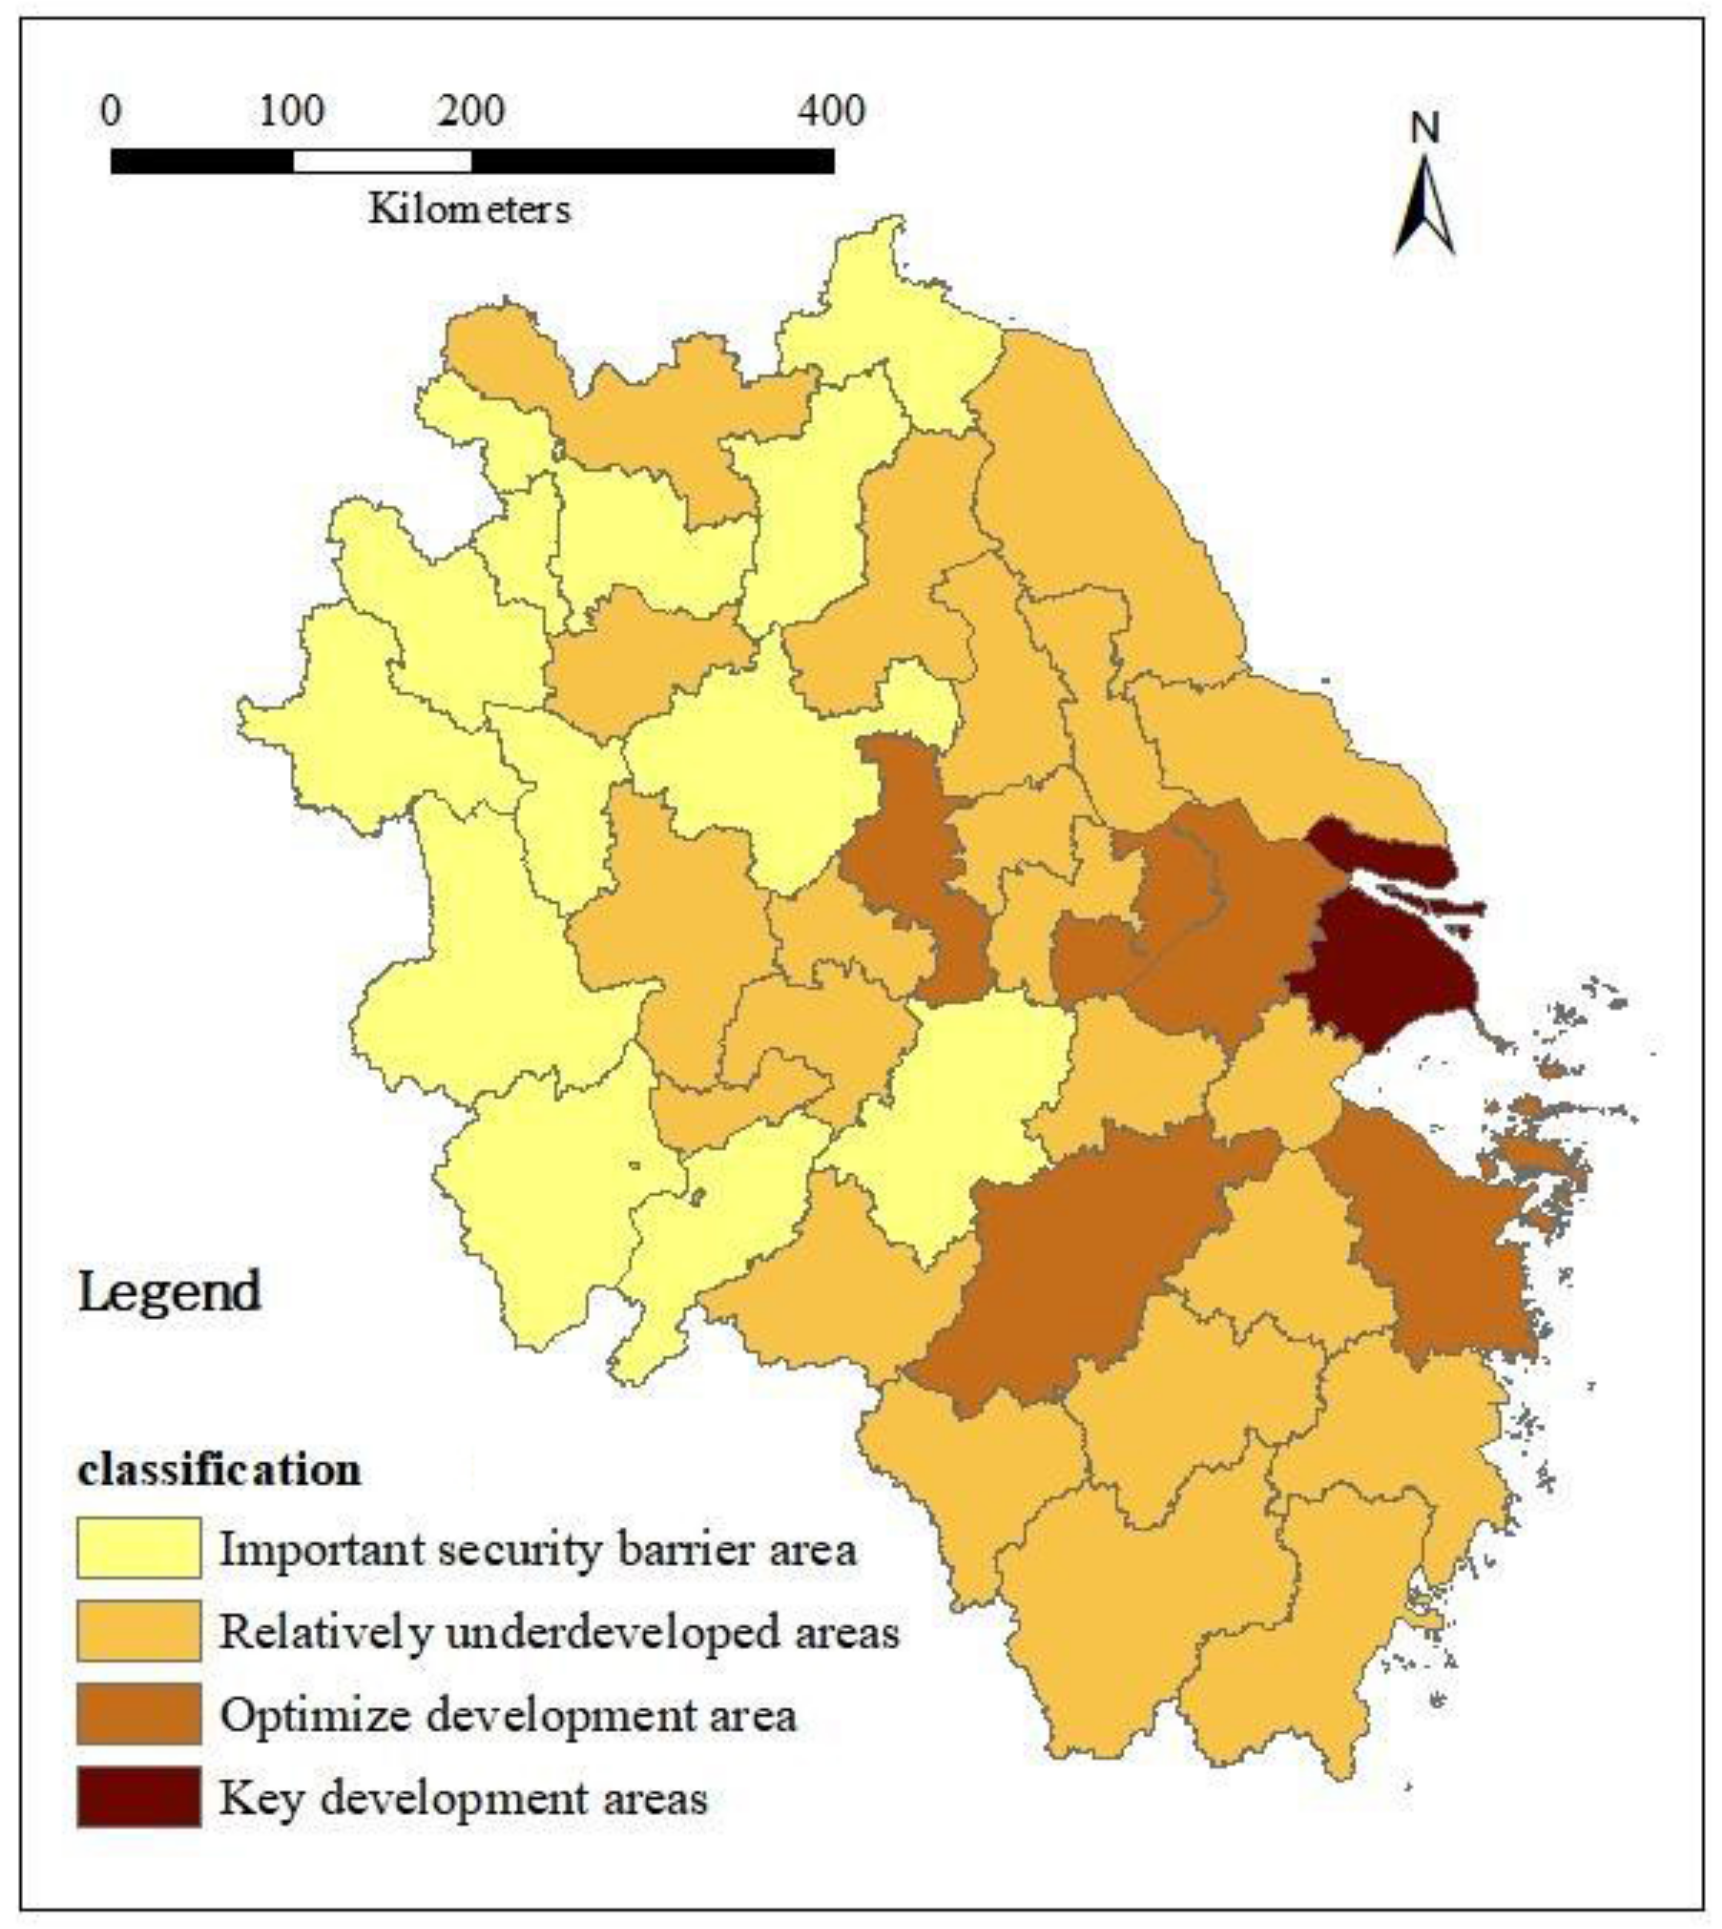
According to the law of the evolution of coordinated and balanced regional development and the general idea of promoting coordinated regional development in the new situation, the focuses of future zoning regulation in the YRD region are as follows: (1) to achieve a relative balance between the population and economy, that is, to gradually achieve a basic balance in the proportion of the resident population and GDP of one city and three provinces in the country; (2) to achieve the three major goals of national coordinated regional development, that is, to gradually achieve the equalization of basic public services, relatively balanced infrastructural access, and approximately equal living standards of people within one city and three provinces; and (3) to achieve relative coordination between the quality and quantity of development in one city and three provinces, that is, to achieve innovative, coordinated, green, open, and shared development while ensuring a certain rate of economic growth. Via the cluster analysis of the coordinated and balanced development index values of the 41 cities in the YRD region, they could be specifically classified into four categories of regions: key development areas, optimized development areas, relatively undeveloped areas, and important security barrier areas (
Figure 5). Therefore, with the goal of coordinated and balanced development in the YRD region over the next 20 years, the regulatory focus should be on the above four categories of regions and their interactions.
4.3.1. Key Development Areas
There is only one city in this region that is considered a key development area: Shanghai. This region should be guided by a series of policies and market regulations to gradually achieve a shift in the direction of a relatively balanced population distribution and economic concentration at the provincial level. The focus of this regulation should be as follows:
- (1)
Considering the role of the YRD region as a ‘ballast’ for the economic and social development of mainland China, it is foreseen that its population and economic share will continue to slowly rise over the next 20 years. Although the total volume of foreign trade may decline owing to the unstable international situation, the initially established internal circulation will play a greater role. According to this judgment, on the one hand, it is necessary to further promote the polarization process of the Shanghai metropolitan area so that more development factors can be concentrated in Shanghai; on the other hand, it is necessary to highlight the river–sea linkage and land–sea integration and make efforts to solve the developmental differences between the inner and outer parts of the Shanghai metropolitan area.
- (2)
At the provincial level, it is necessary to further accelerate the concentration of the population and economy in Shanghai, while at the prefecture level, it is necessary to guide the concentration of the population and economy in central cities. By improving the construction of comprehensive transportation channels between cities with highways, high-speed railroads, and high-grade waterways as the backbone, the developed cities will drive the surrounding small- and medium-sized cities to jointly build a new pattern of synergistic development. At the same time, the economic and other functions of the central cities will be appropriately evacuated to areas in northern Jiangsu, northern Anhui, and southwestern Zhejiang.
4.3.2. Optimized Development Areas
These cities are mainly located along the river, Taihu Lake, and Hangzhou Bay. They generally have stronger economic strength, more sound town systems, closer intrinsic economic ties, and a better foundation for regional integration. To promote the development of optimally developed areas in the future, we should, on the one hand, strengthen the division of labor and cooperation with cities in key development areas, stagger development, and improve the overall level of regional development and, on the other hand, promote the free flow of urban and rural production factors to improve the production efficiency on a larger scale. The focus of this regulation should be as follows:
- (1)
It is necessary to make full use of the opportunity for the integrated development of the YRD region as a national strategy, continuously improving the linkage mechanism of industrial collaboration, focusing on the goal of building high-tech industrial bases and advanced manufacturing bases, providing a support platform for the gathering of high-end elements, and driving the development of relatively less developed regions, as well as taking the construction of a unified domestic market as a breakthrough, accelerating the reform of government decentralization, decentralization, and optimization of services, promoting the cross-regional reorganization of industrial elements relying on advantageous enterprises, and automatically producing the endogenous effect of cross-regional integration and development.
- (2)
The common protection and governance of the ecological environment should be strengthened to the provincial scope of the Yangtze River ecological corridor, Huaihe-Hongze Lake, Taihu Lake, and other ecological barriers and coastal ecological protection belt construction to promote the joint prevention and treatment of regional air and water environments, the sharing of air and water environments, and the collection of pollution source monitoring data in the watershed.
4.3.3. Relatively Undeveloped Areas
Most of these regions are still in a period of rapid industrialization and urbanization with a relatively high proportion of high-energy-consuming and high-polluting industries. Compounded with the impact of the new crown epidemic, economic growth rate decline, and other common problems across the country, their coordinated and balanced development is not a smooth road. It must be based on regional comparative advantages and respect the laws of the market, building up local resource factor endowments to match the industrial system and regional development to have a more robust and sustainable regional output. The focus of this regulation should be as follows:
- (1)
We should insist on teaching fishing as the first and most effective way to enhance the endogenous power of the development of less developed areas. The fundamental way to achieve the development of less developed regions lies in promoting cooperation and complementarity between the government and the market, allowing the flow of the population from less developed regions to developed regions and the flow of capital from developed regions to less developed regions, and promoting convection at the macro-level.
- (2)
We should accelerate the pace of the equalization of basic public services for urban and rural residents. Based on the differences in the supply capacity of each city and the service needs of urban and rural residents, the configuration standards of various spatial units in urban and rural areas should be clarified, and the focus should be placed on public service projects that are visible, palpable, and accessible to people at their doorsteps to enhance the sense of access and satisfaction of urban and rural residents. Strengthen the common construction and sharing of urban and rural infrastructure, promote the extension of county infrastructure to townships, and focus on the construction of future infrastructure in townships.
4.3.4. Important Security Barrier Areas
These areas are mainly located in the southwest, northwest, and northeast of the YRD region, which aims to ensure ecological, food, and energy security in the region and the larger region, typically in Suqian, Huabei, Bozhou, etc. The focus of this regulation should be as follows:
- (1)
In addition to adhering to the development concept of ‘green water and green mountains are golden mountains’, in addition to the strict implementation of national policies, we should also adhere to the principle of who benefits and who compensates, improve the mechanism linking the effectiveness of environmental protection to the distribution of funds, and explore the establishment of an independent and fair ecological and environmental damage assessment and compensation system so that important security barrier areas can receive real development dividends to compensate for the economic sacrifices made by these areas to support ecological construction and environmental protection.
- (2)
Effective measures have been taken to adapt the level of population economic concentration to the local environmental carrying capacity. We should take the initiative to decentralize the overloaded population to the surrounding metropolitan areas and moderately reduce the population density and economic density of such areas to achieve ‘great agglomeration’ through ‘great decentralization’. In addition, we should give full play to the special advantages of the region’s excellent ecological environment, combined with the ‘live broadcast with goods’, ‘cloud tourism’, and other means under the premise of strengthening ecological protection and restoration, and constantly enhance the value of green water and green mountains, release the silver mountain dividends, promote the value of ecological products scientifically and reasonably, and continuously provide quality ecological products to society.
5. Discussion
The development of the YRD region is experiencing a dynamic process of “low-level equilibrium
→ imbalance
→ high-level equilibrium”, with a continuous rise in the contradictions between equilibrium and imbalance, coordination and lack of coordination. The imbalances and lack of coordination in China’s regional development are the spatial projection of the principal contradictions in the new era of our country, and the evaluation of the typical regional coordination and balanced development level in China has important implications for similar regions worldwide. The level of coordinated and balanced development in the YRD region in 2020 was evaluated in 12 dimensions, such as people’s living standards, industrial coordination, and smooth transportation. This showed the prominent advantages of the apparent improvement in the ecological environment, sustained and healthy economic development, and the accelerated construction of comprehensive transportation channels while also exposing significant contradictions, such as the region’s still significant ecological and environmental pressure, significant differences in economic development stages, and the need for further optimization of industrial structures. The results of our article are more comprehensive and in-depth compared with those of previous studies that used a single index methodology. While confirming existing conclusions, they showcase the level of regional coordinated development from a broader perspective. For example, Luo et al. used the ratio of the land expansion rate to the population growth rate as the coordination degree [
34], and Ye et al. used location quotients and industrial structural similarity coefficients as the regional coordinated development ability [
35], both of which presented the level and evolution of coordinated development in the YRD region from a single perspective. Of course, many studies have also used a comprehensive index methodology to evaluate the level of coordinated development in the YRD region, but the research perspectives have mostly been centered on resources, industries, and population [
36], with less attention paid to the connection with the SDGs. This paper, based on fully considering the existing research index systems and the SDGs, constructed a coordinated and balanced development index for the YRD region. It not only reflects the coordinated development level in traditional research dimensions, such as industrial development, social progress, ecological environment, and infrastructure, but also further reflects the coordinated development level in the SDG dimensions, such as poverty eradication, health and well-being, and harmonious coexistence between humans and nature. This may also be a major innovation of this article.
Insufficient and unbalanced regional development seriously restricts the improvement of the living environment and people’s well-being and also becomes a weakness in the investment and business environment, reducing the sustainability of natural ecosystems. The use of a regional coordinated and balanced development model in other developing countries around the world can better reflect the regional development concept of “people-centered”, that is, to achieve the same direction and basic step growth for human and ecological, social, and economic benefits in the process of sustained economic growth. Article 10 of the United Nations Sustainable Development Goals also clearly states, ‘reduce inequalities within and among countries’. As the world’s largest developing country, China completed the arduous task of eliminating absolute poverty by 2021 through the efforts of the past decade and has achieved a comprehensive victory in the battle against poverty, laying the foundation for the region to move toward a higher level and higher quality of coordinated and balanced development. As the region with the highest level of coordinated and balanced development in China, the successful practice of coordinated and balanced regional development in the YRD region can provide important references for other countries worldwide to reduce inequality and promote coordinated development.
In the future, efforts should be made to promote coordinated development in the YRD region in the following dimensions. The first is to take the initiative to integrate the YRD region as the entry point of interactions between regions, to further expand the two-way opening of the east and west, and connect the Huai River along the river and the coast to make up for the shortcomings of transportation and lengthen it, and to refresh the geographical distance with ‘economic distance’. The second is to break the cage of the dual structure of urban and rural areas and encourage farmers to move to cities while allowing urban capital, talents, and various factors to flow freely into the countryside. The third is to achieve a favorable situation where more prosperous areas help less affluent ones by means of inter-provincial support, intra-provincial assistance, and the joint construction of industrial parks.
Due to limitations in the research depth and data collection, this article still has shortcomings in its research scale, indicator system construction, and spatial analysis methods. Specifically, this study used prefecture-level cities as the basic research unit, resulting in relatively low study precision. The scientificity of the indicator system construction still needs to be further improved, and it needs further alignment with the SDGs. The spatial analysis methods are relatively traditional and lack spatial correlation analysis. To this end, further research in the future needs to be approached in terms of three aspects: first, to further refine the research units to the district level; second, to introduce more relevant indicators of SDGs and continuously optimize the existing indicator system; and third, to introduce kernel density models and hot spot analysis to enrich the methods of spatial analysis.
6. Conclusions
Despite being the most prosperous region in China in terms of economic activities, regional differences in the total indices of coordinated and balanced development in the 41 cities in the YRD region remain large. They show a pattern of spreading, with Shanghai as the center and southern Jiangsu and northern Zhejiang and northern Jiangsu, southern Zhejiang, and Anhui as circles, and Anhui Province, except for the provincial capital Hefei, which had a low overall index of coordinated and balanced development. At the provincial level, Jiangsu performed better in the coordination and integration sub-scales, and Zhejiang performed better in the balance sub-scale. Anhui performed better in the integration sub-scale, public basic services in the balance index, industrial coordination and human–nature coordination in the coordination index, and the market unification sub-scale in the integration index, indicating the main reasons for the significant differences between the cities.
This study further delineated four categories of regulation areas in the YRD region in the next 20 years based on the level of coordinated and balanced regional development of each city using cluster analysis: key development areas, optimally developed areas, relatively less-developed areas, and important security barrier areas. It is expected that such a division can provide more precise and vivid templates and cases for the coordinated development of similar regions globally. For example, key development areas should focus on the homogeneity of the population distribution and economic agglomeration; in optimized development areas, more emphasis should be placed on the division of labor and collaboration to facilitate the free flow of urban and rural factors; in relatively less developed areas, development should be leveraged to gradually build an industrial system that matches the local resource factor endowments; and in important security barrier areas, the ecological security, food security, and energy security of the region should be guaranteed.
The great achievement of coordinated development in the YRD region is not coincidental. There is no standard model of coordinated development in this region, and the greatest miracle of this region is that it has been able to ‘find its niche, develop its strengths, and move in the same direction’. The measurement and regulation of the level of coordinated and balanced development based on a multidimensional perspective is of vital value to other regions worldwide in similar situations.


