Abstract
The labor and energy inputs for milking and milk cooling, the preparation and distribution of feed, and manure removal were analyzed on eight farms in the Masovian, Podlaskie, Lower Silesian, and Kuyavian–Pomeranian voivodeships. In these facilities, milking was carried out using milking robots, which were also employed during feed preparation and discharge. The cleaning of manure channels and walking corridors were also automated. Based on labor, fuel, energy consumption, weight of machinery and equipment, and building area, the cumulative energy intensity of the farms was calculated, taking into account the average density of cow herds. The lowest energy input, 0.974 kWh∙LU−1∙day, and the lowest cumulative energy intensity, amounting to 19.601 MJ∙day−1∙LU−1 were observed in a farm with AF-AM5 technology, that is, an automated milking system (AMS) and an automated feeding system (AFS). The second lowest total energy intensity was measured in a farm utilizing the AF-AM7 technology and amounted to 22.505 MJ∙day−1∙LU−1. The highest cumulative energy intensity was measured in a farm practicing conventional milking in a fishbone milking parlor, with a traditional feeding wagon powered by an agricultural tractor. A high level of cumulative energy intensity, for the majority, was connected with a high energy and fuel consumption, especially during the preparation of feed and feed distribution.
1. Introduction
One of the goals of the Common Agricultural Policy 2022–2027 is to reduce greenhouse gas (GHG) emissions and improve animal welfare [1]. In line with the European Green Deal, in the “From Farm to Fork” strategy, agriculture should increasingly adapt to climate change, and actions should be taken to neutralize its negative impact [2]. A reduction in greenhouse gas emissions can be achieved, among other solutions, by using innovative technical solutions that save energy from conventional sources [3,4,5]. Sustainable development in agriculture includes, among other aims, minimizing agriculture’s negative impact on the environment [5].
The development of modern livestock breeding technologies should be associated with the rational storage and management of fertilizer through methane fermentation, allowing for the production of energy in the form of biogas [6,7] or other resources [8,9].
World leaders in milk production have introduced solutions that automate activities in the processes of milking, preparation and distribution of feed, and removal of natural fertilizers. Scientific centers dealing with the issue of energy and labor consumption in animal production include the following: Technische Universität München; Hochschule Weihenstephan-Triesdorf; College of Agriculture, Food and Natural Resources, at the University of Missouri; Agroscope; and Kuratorium für Technik und Bauwesen in der Landwirtschaft (KTBL).
On family dairy farms in Germany, Poland, and other European countries, as well as around the world, the role of automation in the milk production process is increasing [10]. In light of the shortage of hired labor resulting from two reasons—low wages and a high burden—the automation of milking and/or feeding is becoming more and more popular in Poland. On the one hand, thanks to automation, it is possible to increase the amount of milk obtained (by increasing the frequency of milking and feeding cows more frequently) [11], but compared to the traditional method of milking or feeding, the total energy demand in such automated systems increases [12,13].
The workload in milk production operations is divided into physical, mental, and sensorimotor work. Automation reduces the amount of physical work [14], and the nature of the remaining work changes towards mental work as a result. Milk producers often decide to robotize all technological procedures in the production process or robotize only selected procedures, an option which is most often due to limited investment capacity [15,16].
Milking robots, as the most modern automatic devices in milk production, introduced in Poland in the last fifteen years in several dozen free-stall barns, work without the presence of a human, performing all milking activities as follows: they recognize a cow using various types of sensors (ultrasound, laser, and camera) [17,18], provide a massage of the teats, put on the teat cups, remove them in the order in which the quarters are milked, wash the teat cups after each cow, and carry out hygienic spraying of the udders after milking [19]. The use of milking robots facilitates an increase in the frequency of milking cows, reducing labor intensity by 20% or even 50%, and increasing milking efficiency by 5% or even 25% [20,21,22]. Schick claims that the use of milking robots, compared to the traditional milking system, leads to a significant and even two-fold reduction in the labor intensity concerning milking procedure [23].
Similarly, according to Heitkämper et al. [24], the use of milking robots, compared to the traditional milking system, also leads to a significant reduction in labor intensity. Significantly lower human labor inputs in barns with AMS were obtained in the research by Poulopoulou et al. [25].
Due to increasing interest in investing in robotized systems for milk production, there is a lack of precise data about the energy efficiency of said systems. The aim of this study was to investigate the impact of the machines and devices used on the work and energy inputs in cattle production buildings as well as the cumulative energy inputs in order to indicate the best technology model with the lowest cumulative energy needs. The scope of this research included the assessment of the electrical and mechanical energy consumption required to produce 1 L of milk from eight herds of dairy cows ranging in size from 83 LU to 320 LU and with an average annual milk yield ranging from 7500 L to 11,400 L.
2. Materials and Methods
The subjects of the analysis in this article were the labor and energy expenditure concerning the activities of milking, milk pre-treatment, preparation and distribution of feed, and removal of natural fertilizers in robotic barns.
Eight barns characterized by high level-IV mechanization were selected for the study, i.e., the daily unit of labor input was less than five labor-minutes per 1 day and per livestock unit.
A description of the tested farms is presented in Table 1, including the types of technology tested, the herd size, the average annual unitary milk yield, and the total building area.

Table 1.
Main characteristics of the tested farms, including cattle barns.
Seven barns used a bedding-free box housing system for the cows, with deep manure channels. In one (AF-AM7) there were shallow manure channels and in another (CF-CM) a box bedding system. In the 7 barns with deep channels, the slotted floor was further cleaned by a robot. Robots for the slotted floors moved along the floors with slurry channels underneath, and pushed animal excrement into them. Such a robot avoids obstacles, including cow legs. It uses remote control, and it is possible to plan a route and enter it into the robot’s memory. In 1 barn (CF-CM), the slurry was scraped from the manure aisle using a “delta” scraper.
Milking in 7 barns was performed using milking robots (CF-AM1 to AF-AM7), while only 1 barn (CF-CM) used conventional milking with a fishbone milking parlor where 2 × 8 stalls were used. The number of milking robots differed depending on the herd size, but was from 1 to 3 milking units.
Table 2 shows the details for the feeding systems used in the barns.
Table 2.
Characteristics of the machinery and equipment used for the following treatments: TII—feeding and feed preparation; TIII —manure removal and storage.
In 6 barns, a pushing robot was used to push feed on the feed table. Only in two barns, AF-AM5 and AF-AM7, was the feed dispensing system fully automated, while in the remaining facilities, the PMR feed mixture was fed using a feed wagon.
In the case of automated milking, at least one milking box with one unit is located in the non-central part of the barn. In addition, robots automatically measure the milking volume and assess the milk quality, dispensing a portion of granulated concentrate feed. The milking robot was integrated electronically as part of a computer system for cow herd management [20]. In 6 of the tested barns with milking robots, automatization was organized for the feeding process, based on Total Mixed Ratio (TMR) feeding systems. Supplementary concentrate feed was provided at the milking robot station. The two fully automated barns (AF-AM5 and AF-AM7) were equipped with TMR robots, computer-controlled machines that collect feed components and, after mixing it, deliver feed to the feed aisle [26].
After programming the groups of animals in the computer (number of animals in a group, amount of feed per animal, feed mixtures, the share of individual components in the feed, corn, haylage, and food concentrate) and the feeding times, the TMR robot automatically controls the entire feeding process [27].
Feeding robots for concentrates and/or roughage may be used in stall barns and consist of independent dispensers and other equipment to identify the cow positions [28]. The dispenser works completely automatically, dispensing the feed according to a programmed daily feeding cycle, where the involvement of the service is limited to periodic changes in data in the controller memory along with inspections and repairs [29]. In a free-stall system, the automatic system for feeding cows with concentrates consists of a feeding machine and an electronic controller that identifies the cow anywhere on the farm. Such solutions have been used in two cattle barns tested with automated feeding and automated milking (AF-AM5 and AF-AM7).
In all eight barns, ventilation was natural, supported by air mixers, while electric dehornizers were used in the IV treatment. In the AF-AM5 barn, there was a system of air curtains, creating a barrier to the external environment.
In the matter of automation of other systems in all the locations, a cattle brush was used to meet the behavioral needs of the animals related to the given environment. There are two types of cattle brushes available: non-powered brushes, and electric brushes that include a motion sensor and an electric motor. The second type was used in all the locations.
The technological characteristics of all the facilities are presented here, along with the concentrations of the herds. The barns were characterized in terms of actual labor as well as the electrical and mechanical energy inputs. The daily labor inputs were determined using the timing of the working day. Machines and other equipment were identified for the mechanization of individual technological procedures constituting the raw material production processes, including the consumption of diesel fuel. Measurements of electrical consumption by the machines and other equipment were carried out using a porable 3-phase Elite Logger Pro recorder.
Cumulative energy consumption was calculated based on the technological data collected in a tabular form and the conversion factors (Table 3) provided by Wójcicki [30].
Table 3.
Conversion indicators of cumulative energy consumption.
Cumulative energy intensity was calculated as a product of particular items: labor, fuel, electrical energy, building area, and equipment weight multiplied by the indicator values. Cumulative energy intensity was the sum of the energy intensity resulting from the labor inputs, electrical energy, fuel, building area, and weight of the machinery and other equipment related to mechanization and robotization, as in Equation (1).
where the following are defined:
EC = ECL + ECF + ECE + ECM + ECB
- EC—cumulative energy intensity [MJ∙day−1∙LU−1];
- ECL—cumulative energy intensity for labor, [MJ∙day−1∙LU−1];
- ECF—cumulative energy intensity for fuel, [MJ∙day−1∙LU−1];
- ECE—cumulative energy intensity for electrical and mechanical energy, [MJ∙day−1∙LU−1];
- ECM—cumulative energy intensity for machinery, connected to weight, [MJ∙day−1∙LU−1];
- ECB—cumulative energy intensity for buildings, [MJ∙day−1∙LU−1];
- LU—livestock unit.
Statistical Analysis
In order to check whether there were any correlation between herd size and cumulative energy factors, a Pearson correlation analysis was performed using the Python language in a programing environment of a Jupiter Notebook. The results of the statistical analyses were tabularized and are presented in the Figures.
Equation (2) was used as follows:
where r is the Pearson correlation, X is LU (livestock Unit), and Y is the cumulative energy factors, respectively (for each technological treatment and/or cumulative energy sources: labor (ECL), fuel (EcF), electrical and mechanical energy (ECE), weight of machinery and equipment (ECW), and building area (ECB)).
3. Results
3.1. Technological Parameters Characterizing the Objects Tested
Table 4 shows the total weights (kg) of all machinery and equipment used in the mechanization and automatization of technological treatments TI, TII, and TIII. As the weight of the equipment for treatment TIV (other procedures) was relatively small, it was decided to remove this item from further analysis.
Table 4.
Total weight of machinery (kg) and equipment for particular technological treatments: TI—milk and milk cooling; TII—feeding; TIII—manure removal and storage.
The heaviest machinery and equipment were to be found in the cattle barn using a conventional feeding system, equipped with a tractor and feeding wagon along with milking by using two milking robots (CF-AM3). The lowest weight of the machinery was in the location with conventional feeding and milking (CF-CM).
In the conventional feeding technologies (CF) in treatment II (TII), the consumption of diesel fuel, presented in Table 5, resulted from the operation of an agricultural tractor with a mixing feed wagon and a loader for loading feed. In the robotic technology systems it was the consumption generated by the tractor for loading roughage into the feed hoppers as part of the “forage cuisine”. In the TIII technological procedure for removing natural fertilizers, this consumption resulted from the use of tractors to pump out the liquid natural fertilizer in the form of slurry.
Table 5.
Daily fuel consumption (F) by tractors used in the TII and TIII treatments [kg∙day−1∙LU−1].
The highest daily unitary diesel consumption (0.487 kg∙day−1∙LU−1) was observed in the conventionally mechanized cattle barn with a self-powered feeding wagon and conventional milking in the fishbone milking parlor (CF-CM). The high diesel consumption may be the result of the high weight of the machinery used for conventional feeding, because it depends on the power which needs to be supplied. In this case, a self-powered wagon was used, which is related to higher fuel needs.
Table 6 shows the results of tests on daily unitary labor inputs (L). The lowest total labor inputs (0.018 labor-hours∙day−1∙LU−1) were obtained in the most automatized barn, with automated feeding and automated milking (AF-AM). In contrast, as was expected, the highest labor needs were observed in the conventionally equipped cattle barn marked as CF-CM, at 0.057 labor-hours∙day−1∙LU−1.
Table 6.
Daily unitary labor inputs L for technological treatments: I (milk and milk cooling), II (feeding), III (manure removal and storage), and IV (other procedures).
Table 7 presents the electrical and mechanical energy inputs for particular technological treatments in the milk production procedure. The largest energy inputs were stated for treatment I, i.e., milking and milk cooling, and it was true for each object being tested. The lowest energy consumption for milking was related to conventional feeding and milking (CF-CM), meaning delivering the feed by using a tractor equipped with a mixing wagon and performing the milking procedure in a fish-bone milking parlor. Taking into account the whole technology process, which consisted of four main treatment procedures (milking, feeding, manure removing, and other procedures), the best results, namely the lowest energy supply, were needed in the fully automated (both feeding and milking) cattle barn, while the highest energy consumption occurred in the third barn with automated milking (CF-AM3) and the barn with conventional feeding and milking (CF-CM), where human labor still had a significant role.
Table 7.
Daily unitary electrical and mechanical energy inputs for production treatments [kWh∙day−1∙LU−1] (EI—milking and milk cooling; EII—feeding; EIII—manure removal and storage; EIV—other procedures).
Table 8, Table 9 and Table 10 present the cumulative energy intensity in the scope of particular technological treatments: milking (I), feeding (II), manure removal (III), and other procedures (IV). Regarding milking and milk cooling (Treatment II), the highest energy inputs were registered, while the highest values of cumulative energy were obtained in the automated milking barn CF-AM4 (Table 8).
Table 8.
Cumulative daily energy inputs for treatment TI—milking and milk cooling [MJ∙day−1∙LU−1].
Table 9.
Cumulative daily energy inputs ECII for treatment TII—feeding and preparation of feed [MJ∙day−1∙LU−1].
Table 10.
Cumulative daily energy inputs ECIII, IV for the following treatments: TIII—manure storage and removal; TIV—other procedures [MJ∙day−1∙LU−1].
In general, among all the technological treatments, feed preparation and feeding (Treatment II) was the most cumulatively energy-consuming process (Table 9). The highest cumulative energy intensity was achieved in barns equipped with conventional machinery for feeding (barns CF-CM and CF-AM3).
In treatment TIII—manure removal and storage—similarly to treatment TII, the highest cumulative energy inputs were obtained from the barn with conventional feeding, milking, and manure removal system by manure scraper, as shown in Table 10.
Figure 1 shows the cumulative energy inputs, divided into particular technological treatments for the different technologies tested. The lowest cumulative energy inputs were observed in two farms (AF-AM5 and AF-AM7) with totally automated milking and feeding, amounting to 19.344 and 22.446 MJ∙day−1∙LU−1. The highest (62.763 MJ∙day−1∙LU−1) occurred in one barn featuring totally conventional milking and feeding (CF-CM). In the group of farms with automated milking and with conventional feeding (CF-AM1 to CF-AM7), the average cumulative energy amounted to 40.739 MJ∙day−1∙LU−1 with a standard deviation of 10.652 MJ∙day−1∙LU−1. The highest share of cumulative energy (EC) was observed in treatment II—feeding and preparation of feed. Further, in terms of technology, CF-CM had the most energy-consuming treatments among all the barns tested, namely treatment III—manure removal and storage.

Figure 1.
Cumulative energy intensity in technological treatments I, II, III, and IV for the different technologies.
Figure 2 presents the cumulative energy intensity in the scope of particular items, including labor, energy fuel, weight of equipment, and building area.
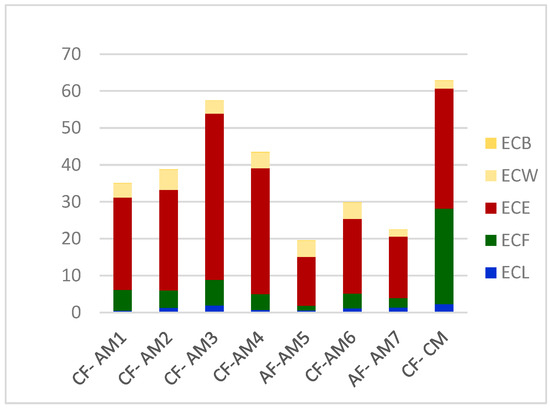
Figure 2.
Cumulative energy intensity in technological treatments I, II, III, and V for different technologies tested in the scope of labor (ECL), fuel (EcF), electrical and mechanical energy (ECE), weight of machinery and equipment (ECW), and building area (ECB).
3.2. Results of the Statistical Analyses
The main aim of the statistical analyses was to obtain knowledge about the relations between herd size, labor inputs, and the particular elements of cumulative energy, including in the scope of technological treatments. It could help to formulate the recommendations required for farmers in the area of best sustainable milk production technologies. The correlations were calculated according to Equation (2).
In general, very low Pearson correlation indicators were stated for all the correlations measured, both labor inputs and cumulative energy, in relation to the number of milking cows in particular locations tested with different milking and feeding technologies. The lowest correlation indicators were obtained in the relation between the number of livestock units (LU) versus daily unitary labor, where Table 11 presents the Pearson correlation factors for these results.
Table 11.
Pearson correlation factors between labor inputs (LI, LII, LIII, LIV) on technological treatments (I—milking and milk cooling; II—feeding; III—manure removal and storage; IV—other procedures), as well as number of cows (LU).
Continuing, Table 12 gives the correlation factors between herd size (number of livestock units, LU) and cumulative energy for all the technological treatments: ECI, ECII, ECIII, and ECIV.
Table 12.
Pearson correlation factors between cumulative energy (ECI, ECII, ECIII, and ECIV) on inputs on technological treatments I, II, III, and IV vs. number of cows (LU).
In order to know whether the herd size correlates with the sum of cumulative energy in the context of sources, a number of supplementary analyses were undertaken related to the dependences between the number of cows and particular cumulative energy sources (weight of machinery, labor, electrical energy, fuel, and building area), with Table 13 presenting the results. In the case of cumulative energy, correlation values r below 0.03 were calculated.
Table 13.
Pearson correlation factors between cumulative energy and number of cows (LU).
Additionally, those particular element (cumulative energy divided into 4 technological treatments) dependences are illustrated in Figure 3 (number of cows and cumulative energy in the scope of technological treatments), while the scope of the sources (elements) of cumulative energy intensity are shown in Figure 4.
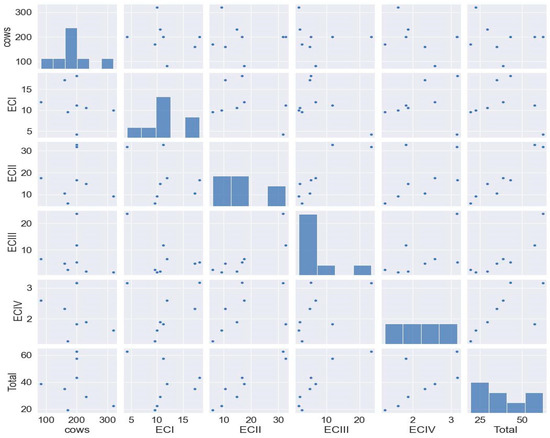
Figure 3.
Illustration of scatter plots for all pairs of variables: number of cows and cumulative energy EC in treatments I, II, III, and IV.
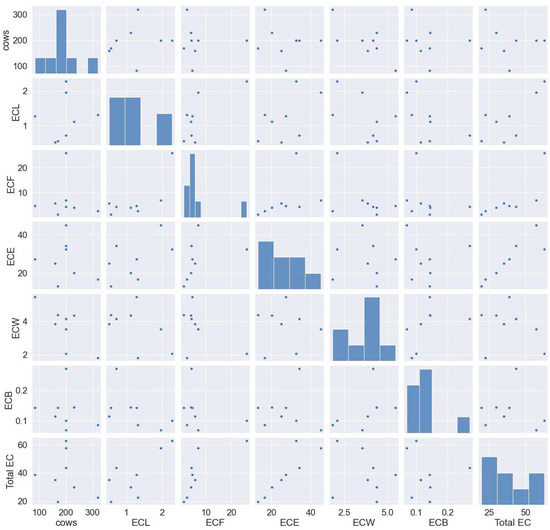
Figure 4.
Illustration of the scatter plots for all pairs of variables: number of cows and cumulative energy EC Illustration of scatter plots for all pairs of variables: number of cows and cumulative energy in the scope of energy sources.
The statistical analysis did not show any significant correlation between number of livestock units, and there was no correlation for any cumulative energy intensity values factors. In conclusion, it can be stated that the number of cows did not determine the level of the labor inputs or cumulative energy consumption in the scope of technological treatments or energy sources.
Among all the sources of cumulative energy tested here, the greatest part was the factors connected with machinery (fuel, mechanical and electrical energy intensity), resulting from the technological processes related to feeding and manure removal while using agricultural tractors. Milking, especially using automated milking systems (robots), required only a few percent of the total cumulative energy consumption.
4. Discussion
The capacity of the AMR automatic milking machine is approximately 90 cows/hour, and in this study, up to 75 cows were milked by 1 separate milking robot. This means that, theoretically, there is still potential for increasing the energy effectiveness.
A value of only 0.391 work-minutes∙LU−1∙day−1 for technical treatment I (milking and milk cooling) was observed for barn CF-AM with milking by four robots, AMS, which was the lowest inputs among all the tested barns. Similar results were presented by Freiberger, where labor inputs for milking at AMS ranged from 0.18 work-minutes∙LU−1∙day−1 to 1.06 work-minutes∙LU−1∙day−1, depending on the herd size (72 to 100 milk cows) [31].
According to Pommer et al. [32], with an average of 0.42 kWh per milking, the energy consumption of AMS is significantly higher than for conventional systems (0.28 kWh on average). In the barns examined in our experiment, the energy inputs for milking ranged from 0.648 kWh∙day−1∙LU−1 to 1.232 kWh∙LU−1∙day−1, which per milking gives from 0.297 kWh to 0.535 kWh. According to our findings, the data obtained from the experiments demonstrate the great advantages of automated milking systems, so the most sustainable solution could be indicated as automated milking together with a completely automated feeding procedure.
In our research, total energy inputs for all the technological treatments amounted to between 0.974 kWh∙LU−1∙day−1 and 3.309 kWh∙LU−1∙day−1. The use of a feeding robot almost completely eliminates the labor input for feeding concentrate feed, which may reduce its energy consumption. The more advanced the nutrition system is, the higher the energy inputs, as found in the study by Leola [33]. The results provided by our study differ from those presented in the literature [33]. In the barns with robotized feeding in our work, the human labor inputs amounted to only 0.838 and 2.020 for AF-AM5 and AF-AM7, respectively. Taking into account all the technological treatments with all the energy-related sources (machinery, equipment, electrical and mechanical energy, fuel consumption, labor inputs, and buildings), the most convenient solution was observed in the AF-AM7 barn with its full robotized systems of milking (four milking robots) and a TMR robot for feed preparation and distribution.
The cumulative energy intensity in the barns ranged from 19.344 for the AF-AM5 technology to 62.763 MJ∙day−1∙LU−1 for the barn with the lowest level of mechanization, where both milking and feeding was performed using conventional technologies, requiring heavy machinery, especially tractors, high fuel consumption and human labor services.
No comparison with other authors is possible in this matter. There is a lack of literature involving all the technological treatments in milk production, especially for the direct technological processes in barns, which were taken into account as a total, and this fact emphasizes the innovation of the research work conducted here.
The final results could help to indicate the best recommended technical solutions in sustainable milk production for owners of family farms. Further research could be performed on LCA analysis, taking into account the influence on the environment, level of advancement of the technology used, and social issues related to sustainable milk production.
5. Conclusions
1. Energy inputs for the production procedures amounted to 0.974 kWh∙LU−1∙day−1 and 3.309 kWh∙LU−1∙day−1. The majority of them were expenditures on preparing and serving feed. Labor expenditure ranged from 0.780 labor-minutes∙day−1∙DJP−1 to 3.410 labor-minutes∙day−1∙DJP−1, with the lowest related to treatment TIII—manure removal and storage.
2. Energy consumption accumulated in production activities, taking into account the energy consumption of the barn, amounted 19.344 to 62.763 MJ∙day−1∙LU−1. The lowest cumulative energy inputs occurred in the robotized barn in terms of milking and preparation and distribution of feed, while the highest energy consumption occurred in the barn using conventional methods of milking and feeding.
3. Automation and digital solutions in milk production involve increased energy inputs compared to traditional methods of mechanization. The solution to increased energy inputs in the case of milking robots or automatic feeding is the integration of the entire energy consumption system with its production system, e.g., through methane fermentation and then the production of energy from biogas.
4. Modern tools for forecasting energy consumption in animal production can be helpful in analyzing the energy consumption and creating model technological solutions that take into account modern solutions for automation and robotization of the production procedures.
Author Contributions
Conceptualization, K.E.M., J.B. and V.T.; methodology, K.E.M., J.B. and V.T.; software, K.E.M. and V.T.; validation, K.E.M., J.B. and V.T.; formal analysis, K.E.M., J.B. and V.T.; investigation, K.E.M., J.B. and V.T.; resources, K.E.M., J.B. and V.T.; data curation, K.E.M., J.B. and V.T. writing—original draft preparation, K.E.M., J.B. and V.T.; writing—review and editing, K.E.M., J.B. and V.T.; visualization, K.E.M., J.B. and V.T.; supervision, K.E.M., J.B. and V.T.; project administration K.E.M.; funding acquisition, K.E.M. and V.T. All authors have read and agreed to the published version of the manuscript.
Funding
This research received no external funding.
Institutional Review Board Statement
Not applicable.
Informed Consent Statement
Not applicable.
Data Availability Statement
Data are contained within the article.
Conflicts of Interest
The authors declare no conflicts of interest.
References
- Common Agricultural Policy 2022–2027, European Commission. Available online: https://agriculture.ec.europa.eu/common-agricultural-policy/cap-overview/cap-glance_en (accessed on 15 November 2023).
- Farm to Fork Strategy, European Commission. Available online: https://food.ec.europa.eu/horizontal-topics/farm-fork-strategy_en (accessed on 15 November 2023).
- O’Connor, S.; Ehimen, E.; Pillai, S.C.; Lyons, G.; Bartlett, J. Economic and Environmental Analysis of Small-Scale Anaerobic Digestion Plants on Irish Dairy Farms. Energies 2020, 13, 637. [Google Scholar] [CrossRef]
- Mazur, K.; Kierończyk, M. Animal welfare and methods of their improvement on example of cattle. In Doskonalenie Technologii Produkcji Rolnej, w Tym Energii Odnawialnej, z Uwzględnieniem Wymagań Zrównoważonego Rozwoju; Romaniuk, W., Ed.; ITP-PIB: Falenty, Poland, 2021; pp. 174–182. ISBN 978-83-65426-62-8. [Google Scholar]
- Piątek, M.; Bartkowiak, A.M. Effectiveness of using physical pretreatment of lignocellulosic biomass. J. Water Land Dev. 2023, 58, 62–69. [Google Scholar] [CrossRef]
- Kapłan, M.; Maj, G.; Klimek, K.E. The analysis of energy potential in vine leaves of the ‘Regent’ cultivar as bio-waste depending on the year of cultivation and the type of rootstock used. J. Water Land Dev. 2023, 58, 171–177. [Google Scholar] [CrossRef]
- Borek, K.; Romaniuk, W.; Roman, K.; Roman, M.; Kuboń, M. The Analysis of a Prototype Installation for Biogas Production from Chosen Agricultural Substrates. Energies 2021, 14, 2132. [Google Scholar] [CrossRef]
- Hryniewicz, M.; Roman, K. Simulations of fuels consumption in the CHP system based on modernised GTD-350 turbine engine. J. Water Land Dev. 2021, 51, 250255. [Google Scholar] [CrossRef]
- Skibko, Z.; Tymińska, M.; Romaniuk, W.; Borusiewicz, A. Impact of the Wind Turbine on the Parameters of the Electricity, Supply to an Agricultural Farm. J. Water Land Dev. 2021, 53, 7279. [Google Scholar] [CrossRef]
- Höhendinger, M.; Kern, S.; Stumpenhausen, J.; Treiber, M.; Bernhardt, H. Estimation of effects on the workload at dairy farms caused by automatization. In Proceedings of the 47th International Symposium: Actual Tasks on Agricultural Engineering, Opatija, Croatia, 5–7 March 2019; pp. 453–461. Available online: https://www.cabdirect.org/globalhealth/abstract/2019320219 (accessed on 10 December 2023).
- Aerts, J.; Kolenda, M.; Piwczyński, D.; Sitkowska, B.; Önder, H. Forecasting Milking Efficiency of Dairy Cows Milked in an Automatic Milking System Using the Decision Tree Technique. Animals 2022, 12, 1040. [Google Scholar] [CrossRef] [PubMed]
- Cabrera, V.E.; Fadul-Pacheco, L. Future of dairy farming from the Dairy Brain perspective: Data integration, analytics, and applications. Int. Dairy J. 2021, 121, 105069. [Google Scholar] [CrossRef]
- Shine, P.; Upton, J.; Sefeedpari, P.; Murphy, M.D. Energy Consumption on Dairy Farms: A Review of Monitoring, Prediction, Modelling, and Analyses. Energies 2020, 13, 1288. [Google Scholar] [CrossRef]
- Bernhardt, H.; Höhendinger, M.; Stumpenhausen, J. Development of the Technical Structure of the “Cow Energy” Concept. Agronomy 2021, 11, 1915. [Google Scholar] [CrossRef]
- Da Borso, F.; Chiumenti, A.; Sigura, M.; Pezzuolo, A. Influence of automatic feeding systems on design and management of dairy farms. J. Agric. Eng. 2017, 48, 48–52. [Google Scholar] [CrossRef]
- Cogato, A.; Brščić, M.; Guo, H.; Marinello, F.; Pezzuolo, A. Challenges and Tendencies of Automatic Milking Systems (AMS): A 20-Years Systematic Review of Literature and Patents. Animals 2021, 11, 356. [Google Scholar] [CrossRef] [PubMed]
- Alhomoch, F. Influence of Different Technical Elements and Settings in Automatic Milking Systems on the Quality of Dairy Cows’ Milk. Ph.D. Thesis, Humboldt University, Berlin, Germany, 2021. Available online: https://edoc.hu-berlin.de/bitstream/handle/18452/24337/dissertation_alhomoch_fadi.pdf?sequence=5 (accessed on 31 May 2021).
- Hogeveen, H.; Klaas, I.C.; Dalen, G.; Honig, H.; Zecconi, A.; Kelton, D.F.; Sánchez Mainar, M. Novel ways to use sensor data to improve mastitis management. J. Dairy Sci. 2021, 104, 11317–11332. [Google Scholar] [CrossRef] [PubMed]
- Bhoj, S.; Tarafdar, A.; Singh, M.; Gaur, G.K. Smart and Automatic Milking Systems: Benefits and Prospects. In Smart and Sustainable Food Technologies; Sehgal, S., Singh, B., Sharma, V., Eds.; Springer: Singapore, 2022. [Google Scholar] [CrossRef]
- Martin, T.; Gasselin, P.; Hostiou, N.; Feron, G.; Laurens, L.; Purseigle, F.; Ollivier, G. Robots and transformations of work in farm: A systematic review of the literature and a research agenda. Agron. Sustain. Dev. 2022, 42, 66. [Google Scholar] [CrossRef]
- Mathijs, E. Socio-economic aspects of automatic milking. In Automatic Milking—A Better Understanding; Academic Publishers: Wageningen, The Netherlands, 2004; pp. 46–55. [Google Scholar]
- Gaworski, M.; Kamińska, N.; Kic, P. Evaluation and optimization of milking in some Polish dairy farms differed in milking parlours. Agron. Res. 2017, 15, 112–122. [Google Scholar]
- Schick, M.; Moriz, C. Use of automatic milking systems in small-scale conditions. In Proceedings of the Bautagung Raumberg-Gumpenstein 2009, Technik in der Rinderhaltung, Emissionen, Rahmenbedingungen für die Schweinehaltung, Irdning, Austria, 27–28 May 2009; pp. 1–4. Available online: https://raumberg-gumpenstein.at/jdownloads/Tagungen/Bautagung/Bautagung_2009/3b_2008_bautagung_tagungsband_gesamt.pdf (accessed on 10 December 2023).
- Heitkämper, K.; Riegel, M.; Schick, M. Work economics and ergonomics in dairy farming. In Proceedings of the XVIIth World Congress of the International Commission of Agricultural and Biosystems Engineering (CIGR), Québec City, QC, Canada, 13–17 June 2010; Agroscope Reckenholz-Tänikon: Ettenhausen, Switzerland, 2015; p. 7. Available online: https://library.csbe-scgab.ca/docs/meetings/2010/CSBE100312.pdf (accessed on 10 December 2023).
- Poulopoulou, I.; Nock, M.C.; Steinmayer, S.; Lambertz, C.; Gauly, M. How can working time analysis contribute to the production efficiency of dairy farms in mountain regions? Ital. J. Anim. Sci. 2018, 17, 489–498. [Google Scholar] [CrossRef]
- Bae, J.; Park, S.; Jeon, K.; Choi, J.Y. Autonomous System of TMR (Total Mixed Ration) Feed Feeding Robot for Smart Cattle Farm. Int. J. Precis. Eng. Manuf. 2023, 24, 423–433. [Google Scholar] [CrossRef]
- Peng, L.; Jiang, Z. Intelligent automatic pig feeding system based on PLC. Rev. Científica Fac. Cienc. Vet. 2020, 30, 2479–2490. [Google Scholar]
- Karn, P.; Sitikhu, P.; Somai, N. Automatic cattle feeding system. In Proceedings of the 2nd International Conference on Engineering and Technology, KEC Conference 2019, Lalitpur, Nepal, 26 September 2019. [Google Scholar]
- Fiedorowicz, G. Technika w Chowie Bydła z Podstawowymi Elementami Zootechniki; Monograph; Institute of Building, Mechanization and Electrification of Agriculture: Warsaw, Poland, 2007; ISBN 978-8-389806-18-5. [Google Scholar]
- Wójcicki, Z. Metodyka badania energochłonności produkcji rolniczej. Probl. Inżynierii Rol. 2015, 14, 17–29. [Google Scholar]
- Freiberger, F.; Klindtworht, K.; Baumeister, J.; Gierse, A.; Lehman, B.; Ohnesorge, M.; Harms, J.; Wendl, G. Automatisches Melken in Modernen Milchviesiällen; KTBL: Darmstadt, Germany, 2005; ss. 141. [Google Scholar]
- Pommer, R.; Pache, S.; Heber, I.; Rindfleisch, A. Automatische Melksysteme in Sachsen, Schriftenreihe; Sächsisches Landesamt für Umwelt, Landwirtschaft und Geologie: Dresden, Germany, 2013; Volume 10, Available online: publikationen.sachsen.de/bdb/artikel/18690/documents/25137 (accessed on 10 December 2023).
- Leola, A.; Priekulis, J.; Česna, J.; Gaworski, M. Trend of cow herd size in Baltic states. Agron. Res. 2021, 19, 1052–1059. [Google Scholar]
Disclaimer/Publisher’s Note: The statements, opinions and data contained in all publications are solely those of the individual author(s) and contributor(s) and not of MDPI and/or the editor(s). MDPI and/or the editor(s) disclaim responsibility for any injury to people or property resulting from any ideas, methods, instructions or products referred to in the content. |
© 2024 by the authors. Licensee MDPI, Basel, Switzerland. This article is an open access article distributed under the terms and conditions of the Creative Commons Attribution (CC BY) license (https://creativecommons.org/licenses/by/4.0/).