Article

Competitiveness Evaluation and Cooperation Network Analysis of Tourist Attractions from the Perspective of Co-Opetition in the Yangtze River Delta (YRD)

1
School of Tourism Management, Shenyang Normal University, Shenyang 110034, China
2
School of Business, Economics Faculty, Liaoning University, Shenyang 110036, China
*
Authors to whom correspondence should be addressed.
Sustainability 2024, 16(2), 834; https://doi.org/10.3390/su16020834
Submission received: 29 October 2023 / Revised: 20 December 2023 / Accepted: 9 January 2024 / Published: 18 January 2024

Abstract

:
Cooperation among tourist attractions has encouraged a new form of competition among tourist destinations. Regional tourism cooperation can create win–win scenarios for participating tourist destinations, such as complementary advantages and improved comprehensive competitiveness. This study constructed a competitiveness measurement model and evaluated the competitiveness of tourist attractions. The index variables were set to modify and establish the gravity models (GMs). The cooperation network was established using Ucinet 6.0 software, and the competitive value of the tourist attractions and the structure characteristics of the network were analyzed. The results indicate that the competitiveness of tourist attractions in Jiangsu Province and Zhejiang Province is strong, while that of attractions in Anhui Province and Shanghai is weak. Tourist attractions in Shanghai, Suzhou, and Hangzhou have strong gravity for cooperation. Furthermore, the density of the cooperation network is high. The core members of the network are mainly distributed in the eastern region of the YRD and play a core role in the tourism cooperation therein. The cooperation network can be divided into four subgroups at level 2 and seven subgroups at level 3. The conclusions of this study can help the government formulate more targeted regional tourism cooperation policies.

1. Introduction

The co-opetition mode emphasizes the competition and cooperation between tourism regions. The competition between the tourist areas is characterized by similar tourism resource characteristics or regional proximity, and the relevant interests of the tourism development are based on the economic, social, cultural, and ecological benefits of the tourism industry, which is based on competition-based organic cooperation. Compared with the above, competition is the objective, and cooperation is the complement and improvement of the competition [1]. The competition is a kind of game of the interest group; the purposes are to build an unobstructed tourist area, realize regional tourism integration, and promote regional tourism coordination and sustainable development.
Sustainable tourism development often faces difficulties because of the contradiction between the immobility of tourism resources and the selectivity of destinations. With the development of tourism resources, new tourist destinations continue to emerge, and tourists are becoming increasingly selective about their destination choices. The unbalanced spatial distribution of tourism flows has led to fierce competition among tourist destinations. Coordinating the relationships among tourist destinations has become the focus of sustainable regional tourism. Cooperation enhances regional tourism competitiveness [1,2,3,4,5]. Regional tourism cooperation indicates that most tourist destinations do not exist in isolation and often depend on each other. Many tourist destinations can be abstracted into a series of nodes or ties, forming a network of tourist destinations through close cooperation [6,7]. In this network, destinations can form close links through information exchange and tourist routes and achieve “1 + 1 > 2” regional tourism development goals [8,9]. Thus, destination cooperation can be viewed as an inter-organizational relationship, with destinations as actors already deeply embedded in the network formed by formal or informal and cooperative or competitive relationships [10]. Destination networks can be seen as a type of strategic network where the interaction between destinations goes beyond their respective boundaries, and their competitive advantage derives from strategic relationship construction and innovation in the network [11].
The YRD is the first region in China to put forward the idea of regional tourism cooperation. As early as the 1980s, the YRD, the most active area of economic development in China, began regional tourism cooperation. Since then, the “YRD Tourism City Summit Forum” has been held continuously; regional tourism cooperation agreements have been signed, and barrier-free tourism circles have been advocated. The number of cities participating in tourism cooperation has continued to expand from 16 in 2003 to 20 in 2004, 24 in 2005, 26 in 2006, and 27 in 2019, and the development of tourism cooperation has achieved remarkable results [12]. In 2019, the Outline of the YRD Integration Development Plan was officially released and marked that YRD integration development had officially risen to a national strategy. However, for a long time, there has been a problem of unbalanced regional tourism development in the YRD. Also, the administrative barriers to the development of the tourism economy have severely hindered the development of regional tourism cooperation. The phenomenon of antagonistic competition and mutual barriers among tourist destinations are not conducive to the development of regional tourism cooperation and limit the formation of the overall image of YRD tourism and the improvement in the overall influence [13].
Isaac Newton’s law of gravitation, published in 1687 in Principia Mathematica Naturae, states that two particles are attracted to each other along concentric lines. Since then, many scholars have regarded the connection between tourism economies in different regions as a mutual force and attraction among tourist destinations [14,15]. Therefore, the gravity model (GM) [16,17] or a modified GM [18,19] can be adopted to describe and quantify the strength of inter-regional tourism cooperation. Similarly, the use of the GM to construct spatial connection matrices is the basis for studying spatial network structures [20].
Academic scholars have expressed different views regarding the key factors affecting regional tourism cooperation. Teye (1988) regards the joint development and marketing of multiple destinations as important factors that influence cooperation among tourism destinations [21]. Wang et al. (2007) believe that cooperative behavior occurs only to better cope with competition and avoid risk [22]. Fyall et al. (2004) believe that the political environment, policy agreements, and tourist demands and expectations can be considered as influencing factors of regional tourism cooperation [23]. Li et al. (2021) have divided the political, economic, legal, and other factors affecting regional tourism cooperation into three categories [24]. Furthermore, Yin et al. (2020) posit that the political environment, regional governance level, and other factors affect tourism cooperation between China and ASEAN [25]. In addition, some scholars have analyzed regional tourism cooperation from the perspective of the tourism flow. Tourists’ multidestination travel behavior is considered as a driving factor for cooperation among tourist destinations [26,27]. Tourists’ free choice of spatial behavior and movement objectively connect different tourist destinations, which leads to the formation of cooperative relationships between tourist destinations [12].
Although scholars have explained the key factors affecting regional tourism cooperation in previous studies, some of these factors represent the competitiveness of tourist destinations, and some partially reflect cooperation among tourist destinations; however, none comprehensively describe regional tourism cooperation. Factors influencing cooperation have not been systematically considered from the perspectives of the competitiveness of tourism destinations and the relationships among tourism destinations. Only when tourist destinations are competitive can they cooperate to achieve integrated development and maximized benefits [1,2,3,4,5]. Although there have been previous studies on the competitiveness measurement of tourism destinations, there is a lack of relevant research regarding the construction and characteristics of cooperation networks based on the GM and the competitiveness values of tourism destinations. Empirical research on the cooperation network of tourist attractions in the Yangtze River Delta is even scarcer. The basic structural features of regional tourism include scattered or continuous cooperation among related and diversified tourist attractions [28]. Therefore, cooperation among tourist attractions is an important aspect of regional tourism cooperation.
To solve these problems, this study follows the logic of “node–relationship–structure” to construct a cooperation network. The research objectives of this study are threefold. First, the competitiveness of tourist attractions is measured, followed by the measurement of the cooperation gravity between tourist attractions. Next, the structure of the cooperation network is evaluated. Consequently, our research poses the following six questions: What is the competitiveness of tourist attractions? What is the intensity of the cooperation among tourist attractions? What kind of cooperation network structure do tourist attractions exhibit? What are their characteristics? What are the positions of different tourist attractions in the cooperation network? What role does the network play?
The primary contributions of our study are as follows: First, four indicators are used to evaluate competitiveness: attraction of tourism resources (ATR), instantaneous bearing capacity (IBC), number of tourists (NT), and tourism income (TI). Second, according to the GM, the indicators in the model are modified to improve the cooperative GM. Third, a cooperation network is constructed using the modified GM and social network analysis (SNA), and network structural features, such as density and centrality, are analyzed using Ucinet 6.0 software. Fourth, this study provides new ideas for governments to formulate regional tourism cooperation policies.

2. Materials and Methods

2.1. Study Area

The YRD is located in the lower reaches of the Yangtze River, China. It comprises a total of 1240 national A-level tourist attractions, including 53 5A, 469 4A, 488 3A, 227 2A, and 3 1A tourist attractions. In addition, the YRD has held the “YRD Tourism City Summit Forum” annually since 2003. The number of cities participating in the cooperation expanded from 16 in 2003 to 20 in 2004, 24 in 2005, and 26 in 2006. Remarkable results have been achieved in planning, making this area a model for regional tourism cooperation in China.
This study draws on the research of other scholars [29,30] by selecting 4A and 5A tourist attractions that are highly attractive to tourists in 16 core cities (from the official websites of provincial and municipal governments). The destinations’ categorizations were determined based on the National A-Level Scenic Spots List, published by the Tourism Bureau of Provinces and Cities in the YRD in 2022. The 16 cities include eight cities in Jiangsu Province, including Nanjing; seven cities in Zhejiang Province, including Hangzhou; and Shanghai, which is separate from the two provinces.

2.2. Research Framework

Using this research framework, we analyzed the competitiveness, cooperation gravity, and cooperation network structure of the selected destinations (Figure 1). Data, such as the level of tourist attractions and their occupied land area, the number of tourists received, and the level of tourism income, were obtained through the China Tourism Statistical Yearbook and official government website documents.
The following steps were followed in this study framework. First, at the node level, the competitiveness measurement indicators were screened, a competitiveness measurement model was constructed, and the competitiveness was evaluated. Second, at the relationship level, according to the competitiveness value, indicator variables were set to modify the GM and build a tourist attraction cooperation GM. Finally, at the structural level, according to the cooperation GM, Ucinet 6.0 software was used to build the cooperation network. The structure of the network and its characteristics were analyzed comprehensively.

2.3. Data Sources and Processing

2.3.1. Data Sources

This study collected multiple data points from various channels to analyze the cooperation network. The data mainly include official statistics, geospatial data, transaction data, and tourist route data from online travel agency (OTA) websites.
NT: Using the transaction volume of OTA websites, we determined the stripping factors of tourist attractions in the tourism markets of their counties (urban areas). We searched for group and independent tour products published by travel companies in Ctrip, Tongcheng, and Tuniu. Relevant data covering the full tourist itinerary and cumulative transaction data of tourist attractions (accessed on 8 October 2021) were retrieved. It was assumed that the actual tourist flow was determined by the tourist route, and the tourist reception of the tourist attraction was calculated accordingly. Ctrip (www.ctrip.com), Tongcheng (www.ly.com), and Tuniu (www.tuniu.com) are the three one-stop travel platforms in China. The three platforms provide information such as public and free accommodation bookings, transport tickets and itineraries, and travel diaries of tourists.
Shortest Transportation Time: By searching the Amap big data, we were able to obtain the actual distance between tourist attractions and the speed for using the most convenient mode of transportation.
Other Sources of Data: Other data mainly include the tourist attention, level of tourist attractions, land area, and tourism income. The tourist attention was calculated based on the overall daily average of the Baidu Index of Tourist Attractions. The data on tourist attraction levels were obtained from official websites.

2.3.2. Data Processing

Selection of Tourist Attractions: To ensure the effective selection of tourist attractions, it was necessary to clean the data. First, when there were duplicate tourist routes, we kept only one of the same tourist attractions, and the superfluous destinations were deleted. Second, tourist routes and attractions that were not within the study area were deleted. Finally, for the selected tourist routes, we extracted individual tourist attractions. If several extracted scenic spots belonged to the same tourist attraction, they were merged into a single tourist attraction. We collected 26,061 tour routes and selected 16,666 valid routes. These effective tourist routes contained 383 tourist attractions, from which 55 effective tourist attractions were extracted.
Data Standardization Processing: Because different indicators were not comparable owing to different dimensions, this study first made the indicators dimensionless and then conducted the following analysis after eliminating the impact of the dimension. In this study, the normalization method was adopted; that is, the data were uniformly mapped to the interval (0,1).

2.4. Research Methods

2.4.1. Construction of the Mathematical Model

Competitiveness measurement model of tourist attractions
Index selection
ATR: ATR directly determines the competitiveness. The ATR can be measured in two ways. One is the level of tourist attractions [31]. This is because the evaluation of China’s A-level tourist attractions largely depends on the attractiveness of its tourism resources: the more attractive the tourist resources, the higher the grade of the tourist attractions. Second, the size of the ATR depends on tourists’ attention to tourist attractions [32,33]. In this study, the Baidu Index, which reflects the degree of tourists’ online attention, was selected for the analysis. Specifically, figures such as the number of clicks and search volume were obtained by entering the name and abbreviation of the tourist attraction on the webpage, and the attention of tourists was studied.
Our ratings on tourism resource attractions followed these steps: First, out of 55 tourist attractions, we assigned 10 points to the AAAAA tourist attractions and eight points to the AAAA tourist attractions. Second, regarding the attention of the tourist attractions, we assigned 10 points to a Baidu Index of more than 1000, nine points to indexes between 900 and 1000, and eight points to indexes between 800 and 899. Thus, the division continued until the Baidu Index was less than 100 tourist attractions. The ATR can be expressed by the following formula [31,32,33]:
A T R i = L T A i + T A T A i
where the ATR of tourist attraction i is ATRi, the level of tourist attraction i is expressed as LTAi, the tourist attention of tourist attraction i is TATAi, and the ATR of tourist attraction i is the sum of LTAi and TATAi.
IBC: The selection of an IBC index is significant for the sustainable development of tourist attractions [34]. IBC refers to tourists who can accommodate most tourist attractions for a certain amount of time if tourists and environmental security are ensured. The IBC is a comprehensive measurement of the size and time of travel, including ecological, environmental, facility, and social capabilities. The larger the land area, the more visitors will be accommodated, and the greater the IBC of tourist attractions.
Tourist attractions are important indicators of sustainable development. The IBC measures the maximum number of visitors at tourist attractions. IBC is calculated as follows [34]:
I B C i = X i Y i
where the IBC of the ith tourist attraction is IBCi, the effective tourist area of the ith tourist attraction is Xi, and the unit area occupied by tourists in the ith tourist attraction is Yi. We obtained Xi and Yi data from a document on the maximum bearing capacity of AAAAA tourist attractions, as released by China’s Ministry of Culture and Tourism.
NT: NT directly reflects the strength of the competitiveness [35]. The stripping factor of a tourist attraction in its county’s (urban area’s) tourism market is determined by the ratio of the online tourism transaction data of a tourist attraction obtained using OTA websites to the sum of the online tourism transactions of all the tourist attractions in the same county (urban area). On this basis, further analysis of the regional county (urban) tourism statistics scale is used to calculate NT according to the following Formula (3) [36,37,38]:
N T i = S C i N T R i ;   S C i = N O T i i n N O T i
where the NT in the ith tourist attraction is represented as NTi, the total number of online travel transactions of the ith tourist attraction on the tourist route is denoted as NOTi, the stripping coefficient of the ith tourist attraction is expressed as SCi, the annual total NT received by the county (urban area) where the ith tourist attraction is located is expressed as NTRi, and the total number of tourist attractions in the county (urban area) where the ith tourist attraction is located is expressed as N.
Tourism income (TI) also reflects the competitiveness of tourist attractions [36,37,38]. If there is no significant difference in the per capita consumption level of tourist attractions within a county (or urban area), TI can be obtained by multiplying the per capita consumption level by NT. Therefore, TI can be expressed using the following formula [36,37,38]:
T I i = P C C i N T i ;   P C C i = A T I i A T i
where the TI of the ith tourist attraction is TIi, the per capita consumption level of the county (or urban area) where the ith tourist attraction is located is expressed as PCCi, and the annual number of tourists and annual TI of the county (urban area) where the ith tourist attraction is located are expressed as ATi and ATIi, respectively. ATIi can be obtained by querying the Statistical Yearbook.
Index Weight: We applied the entropy weight method to determine the index weight of the tourist attraction competitiveness [39]. The specific weight values are listed in Table 1.
Using the entropy weight method to multiply the weights and their corresponding index values, a competitiveness measurement model for tourist attractions can be obtained. The formula is as follows [31,32,33,34,35,36,37,38,39]:
T A C i = w 1 A T R i + w 2 I B C i + w 3 N V i + w 4 T I i
where T A C i , A T R i , I B C i , N V i , and T I i represent the competitiveness, ATR, IBC, NT, and TI of tourist attraction i, respectively, and their value ranges are (0,1). The w coefficient represents the weight of each index.
(1)
GM Modification
In previous studies on tourism cooperation, many scholars have regarded the relationship of the tourism economy as a mutual force and attraction among tourist destinations. The degree of correlation between the competitiveness of tourist attractions can reflect the mutual radiation between two tourist destinations and the degree of regional tourism cooperation development [36]. The GM or modified GM is used to describe and quantify the strength of inter-regional tourism links; that is, gravity is measured using a mathematical model. The use of the GM to construct a spatial connection matrix is the basis for studying the spatial network structure [20]. Based on the basic GM, this study used a modified GM to describe the cooperation level of tourist attractions, drawing on the practice of Gan et al. (2021). Using Equation (6), the modified GM was used to investigate the level of cooperation among the competitiveness values of various tourist attractions in the YRD [40].
F i j = K i j E i · E j D i j 2 ,   K i j = E i E i + E j
In Equation (6), the strength of the cooperation gravity is expressed as Fij; the gravitational coefficient is expressed as Kij, and the competitiveness values of the I tourist attractions (i) and the jth tourist attraction are represented as Ei and Ej, respectively. The spherical distance between the competitiveness value of the ith tourist attraction and the jth tourist attraction is expressed as Dij. The spatial correlation matrix between the tourist attractions was constructed through this model, and the mean value of each row of data in the matrix was taken as the threshold of binarization. When Fij was greater than the mean value, it was equal to 1. When Fij was less than the mean value, its value was zero.

2.4.2. Social Network Analysis (SNA)

The cooperation network of tourist attractions constructed by modifying the GM was used for the SNA. This study analyzed the composition of all the members and their relationships in the cooperation network of tourist attractions through density, centrality, location, and cohesive subgroups. Density is the degree of close contact between various tourist attractions on a network map. It is important to determine how the network distribution is related to that of the complete network. Centrality analysis includes the degree, closeness, and betweenness centrality analyses. It examines the degree of the direct connection between a tourist attraction and other tourist attractions, the degree of resource control, and the extent to which other tourist attractions are controlled. Location refers to the core, semi-peripheral, or peripheral status of a tourist attraction. The main analysis focused on the closeness of the links between various tourist attractions. In the cooperation network, if tourist attractions are closely related and even combined into a secondary group, such groups are called agglomerations in the SNA. This study analyzes the characteristics of the relationship between the number of subgroups in a cooperation network, the characteristics of the relationship between tourist attractions in a subgroup, and the relationships between subgroups.

3. Results

3.1. Evaluation of Competitiveness

The competitiveness measurement model was applied to calculate and rank the competitiveness values. Owing to the large size of the original data table, this study shows only the top 20 tourist attractions regarding competitiveness values (see Table 2).
The maximum competitiveness value of these 20 tourist attractions was 0.4682; the minimum value was 0.2725, and the mean value was 0.371, with little difference in general. The standard deviation was 0.05376, indicating that the competitiveness value of these tourist attractions was more balanced. However, from the overall perspective of the 55 selected tourist attractions, the difference between the minimum and maximum values of their tourism competitiveness was 46 times, and the standard deviation was 0.16542, indicating that the competitiveness of each tourist attraction was significantly different. Regarding the geographical distribution, 13 of the 20 tourist attractions were located in Jiangsu Province, accounting for 65%, and the remaining seven were located in Zhejiang Province, accounting for 35%. This shows that the competitiveness of tourist attractions in Jiangsu Province and Zhejiang Province is relatively strong, whereas tourist attractions in Anhui Province and Shanghai are not ranked among the top 20, indicating that their competitiveness must be improved.

3.2. Measurement of Cooperation Gravity

The measurement results for the tourist attraction cooperation are listed in Table 3. Only a few results are presented in this paper owing to space limitations. The average cooperation gravity of the 55 tourist attractions was 444.0247, and 16 tourist attractions were beyond this average, accounting for 29.11%. These include the Lion Grove Garden, Pingjiang Road Historic Street, Sightseeing Hall Jinmao Tower, Shanghai World Financial Center Observatory, Top of Shanghai Observatory, Classical Gardens of Suzhou, Small Lujiazui, Shanghai Oriental Pearl Radio and TV Tower, Qing He Lane, West Lake, Shantang Street, Hanshan Temple, Songcheng, the Temple of the City God, Leifeng Tower, and Yu Garden, which are mainly distributed in Shanghai, Suzhou, and Hangzhou, among which the highest ranked is the Lion Grove Garden in Suzhou. The overall ranking of tourist attractions in Suzhou is relatively high, while the cooperation gravity of the Sightseeing Hall Jinmao Tower in Shanghai is approximately 126 times that of Shanghai Haichang Ocean Park. The cooperation gravity of the Qing He Lane tourist attraction in Hangzhou is about 32 times that of the QianDao Lake tourist attraction, and the difference between the cooperation gravities of tourist attractions within the city is large, reflecting the characteristics of unbalanced cooperation development.

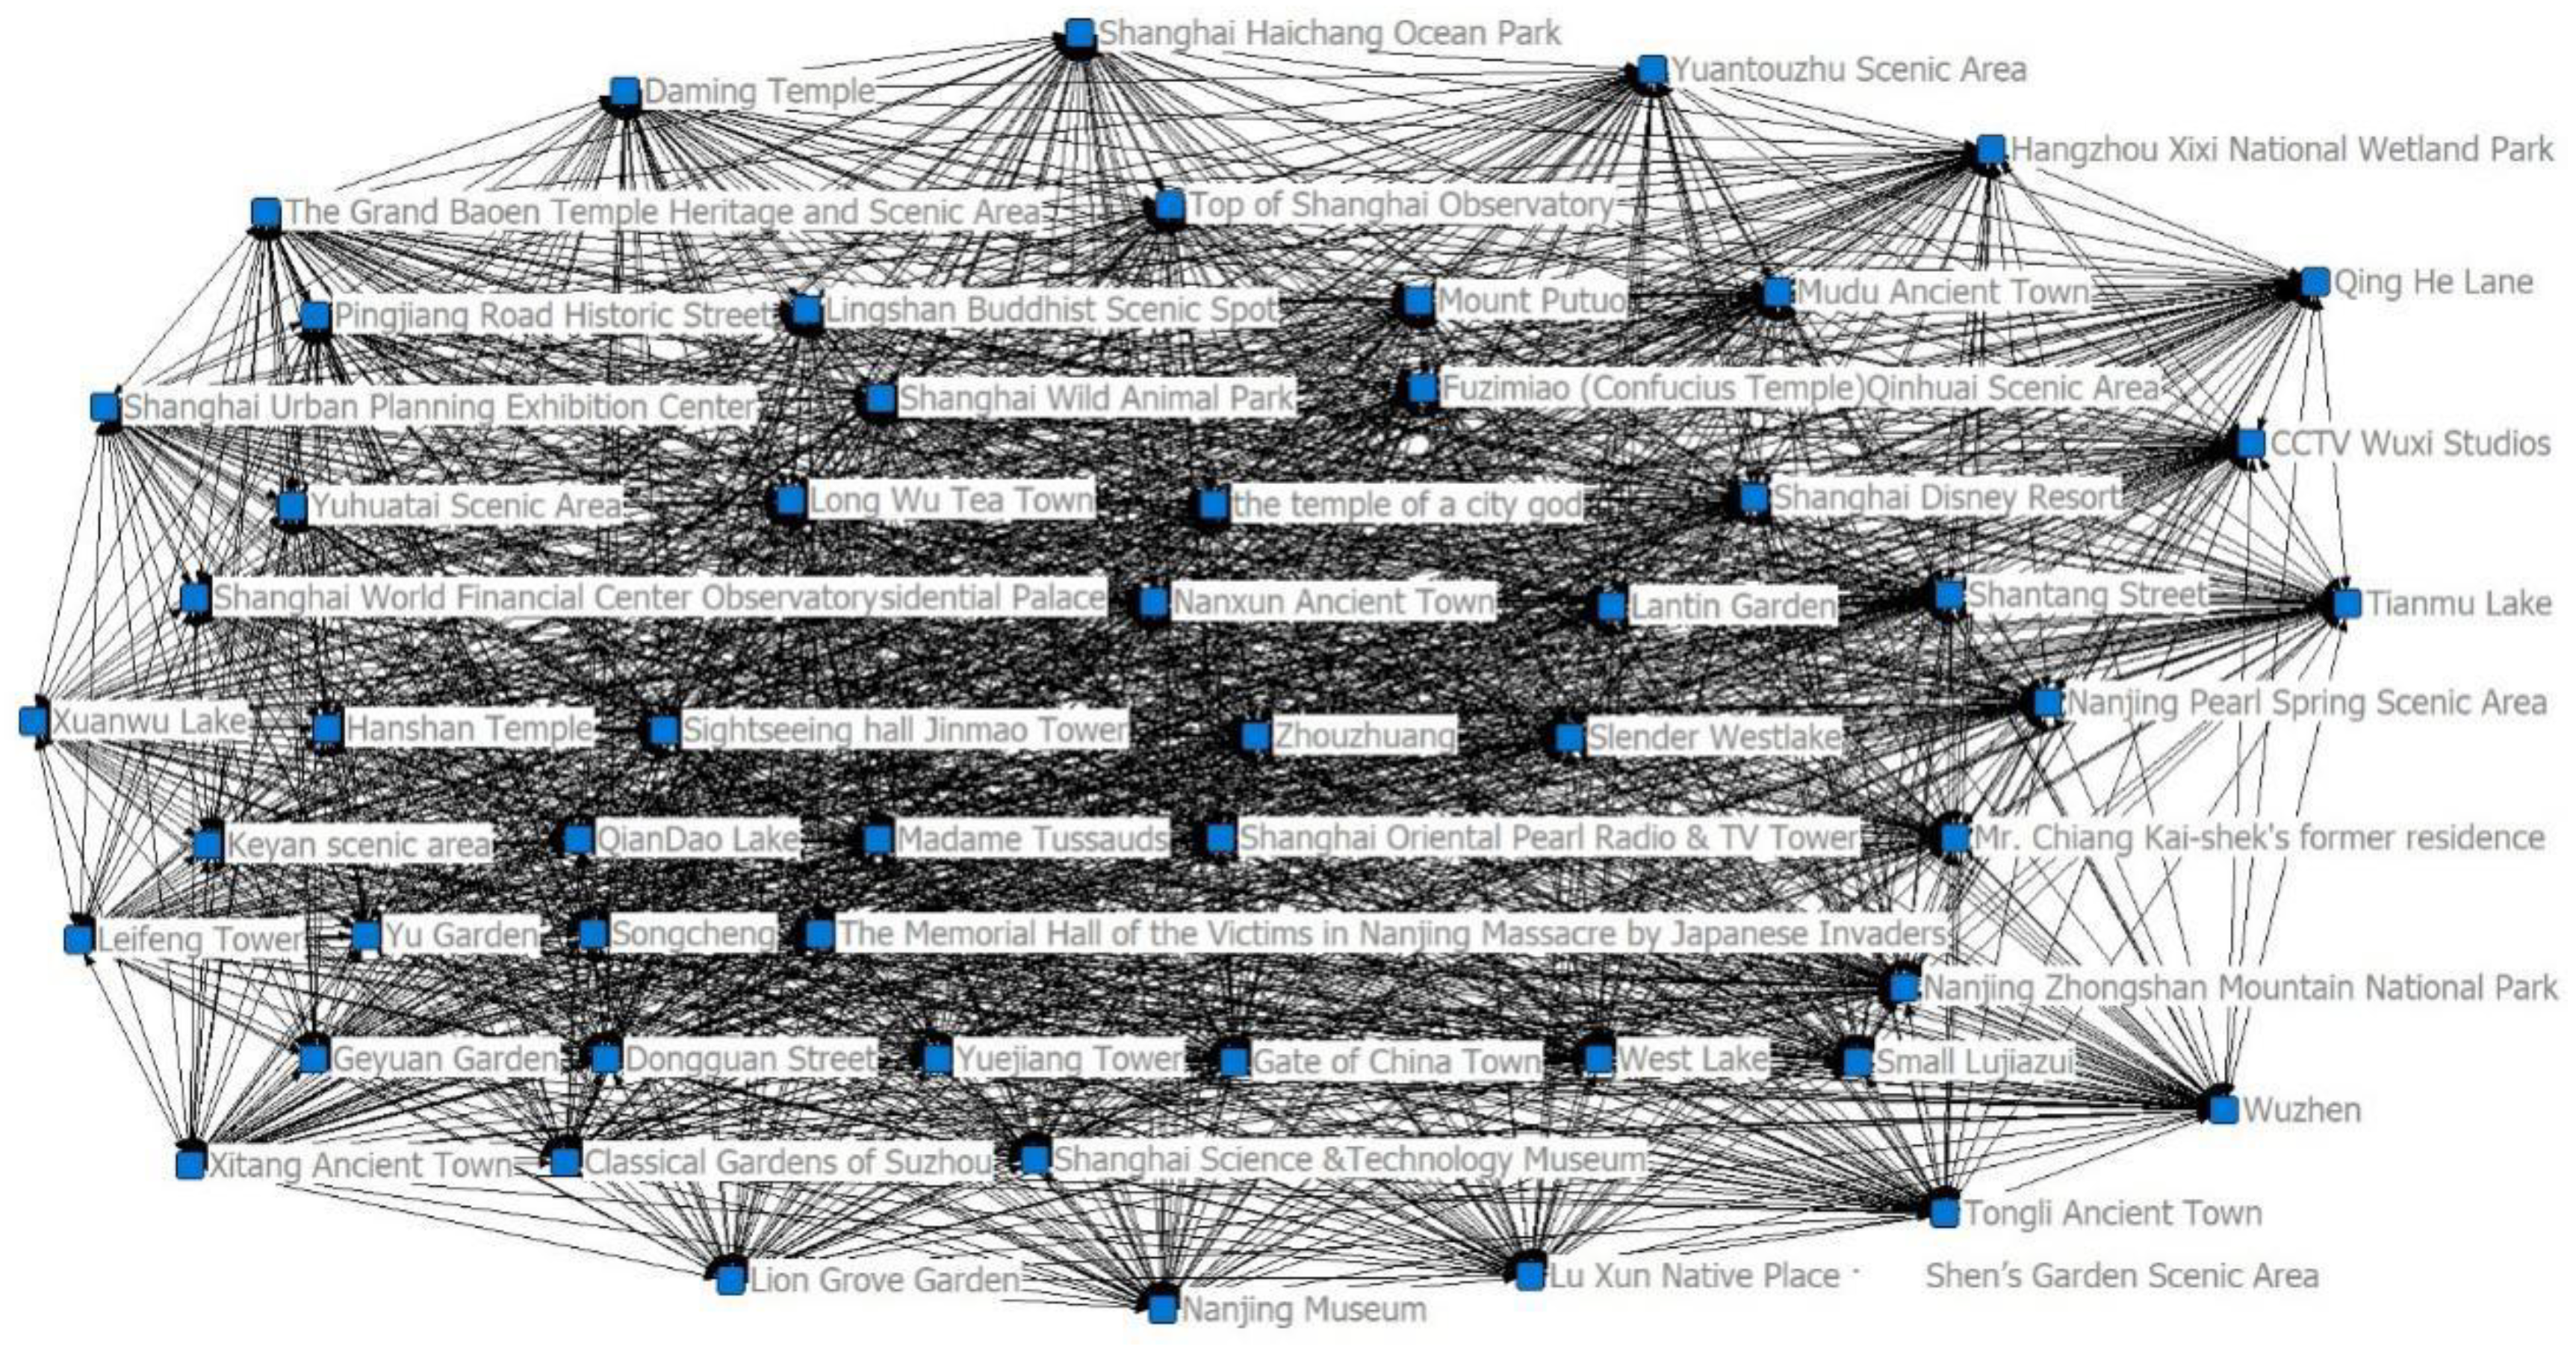
3.3. Construction and Structural Characteristics of the Cooperation Network

Based on the modified GM, the cooperative gravity values of 55 tourist attractions in the YRD were calculated, and a cooperative relationship matrix of tourist attractions was constructed. According to this matrix, Netdraw, a visualization tool in Ucinet 6.0 software, was used to build a cooperation network of 55 tourist attractions in the YRD (Figure 2). Through the network diagram, we found that there were no isolated phenomena in the development of tourist attractions, and there was an obvious correlation in space; that is, there was a cooperative relationship among all the tourist attractions.

3.3.1. Network Density Analysis

In the cooperation network, the total number of actual correlation relations among the 55 selected tourist attractions in the YRD was 1484, and the maximum possible number of correlations was 2970. Generally, the network density was relatively high (0.4997), indicating that the degree of cooperation among the tourist attractions was relatively high and that the network connection was relatively dense. In addition, the network correlation degree is 1, indicating that there are direct or indirect cooperative relations between all the tourist attractions. The network efficiency is 0.4901, which indicates that the structure is fairly stable and that each tourist attraction can use the overall network structure to conveniently develop tourism cooperation with other tourist attractions.

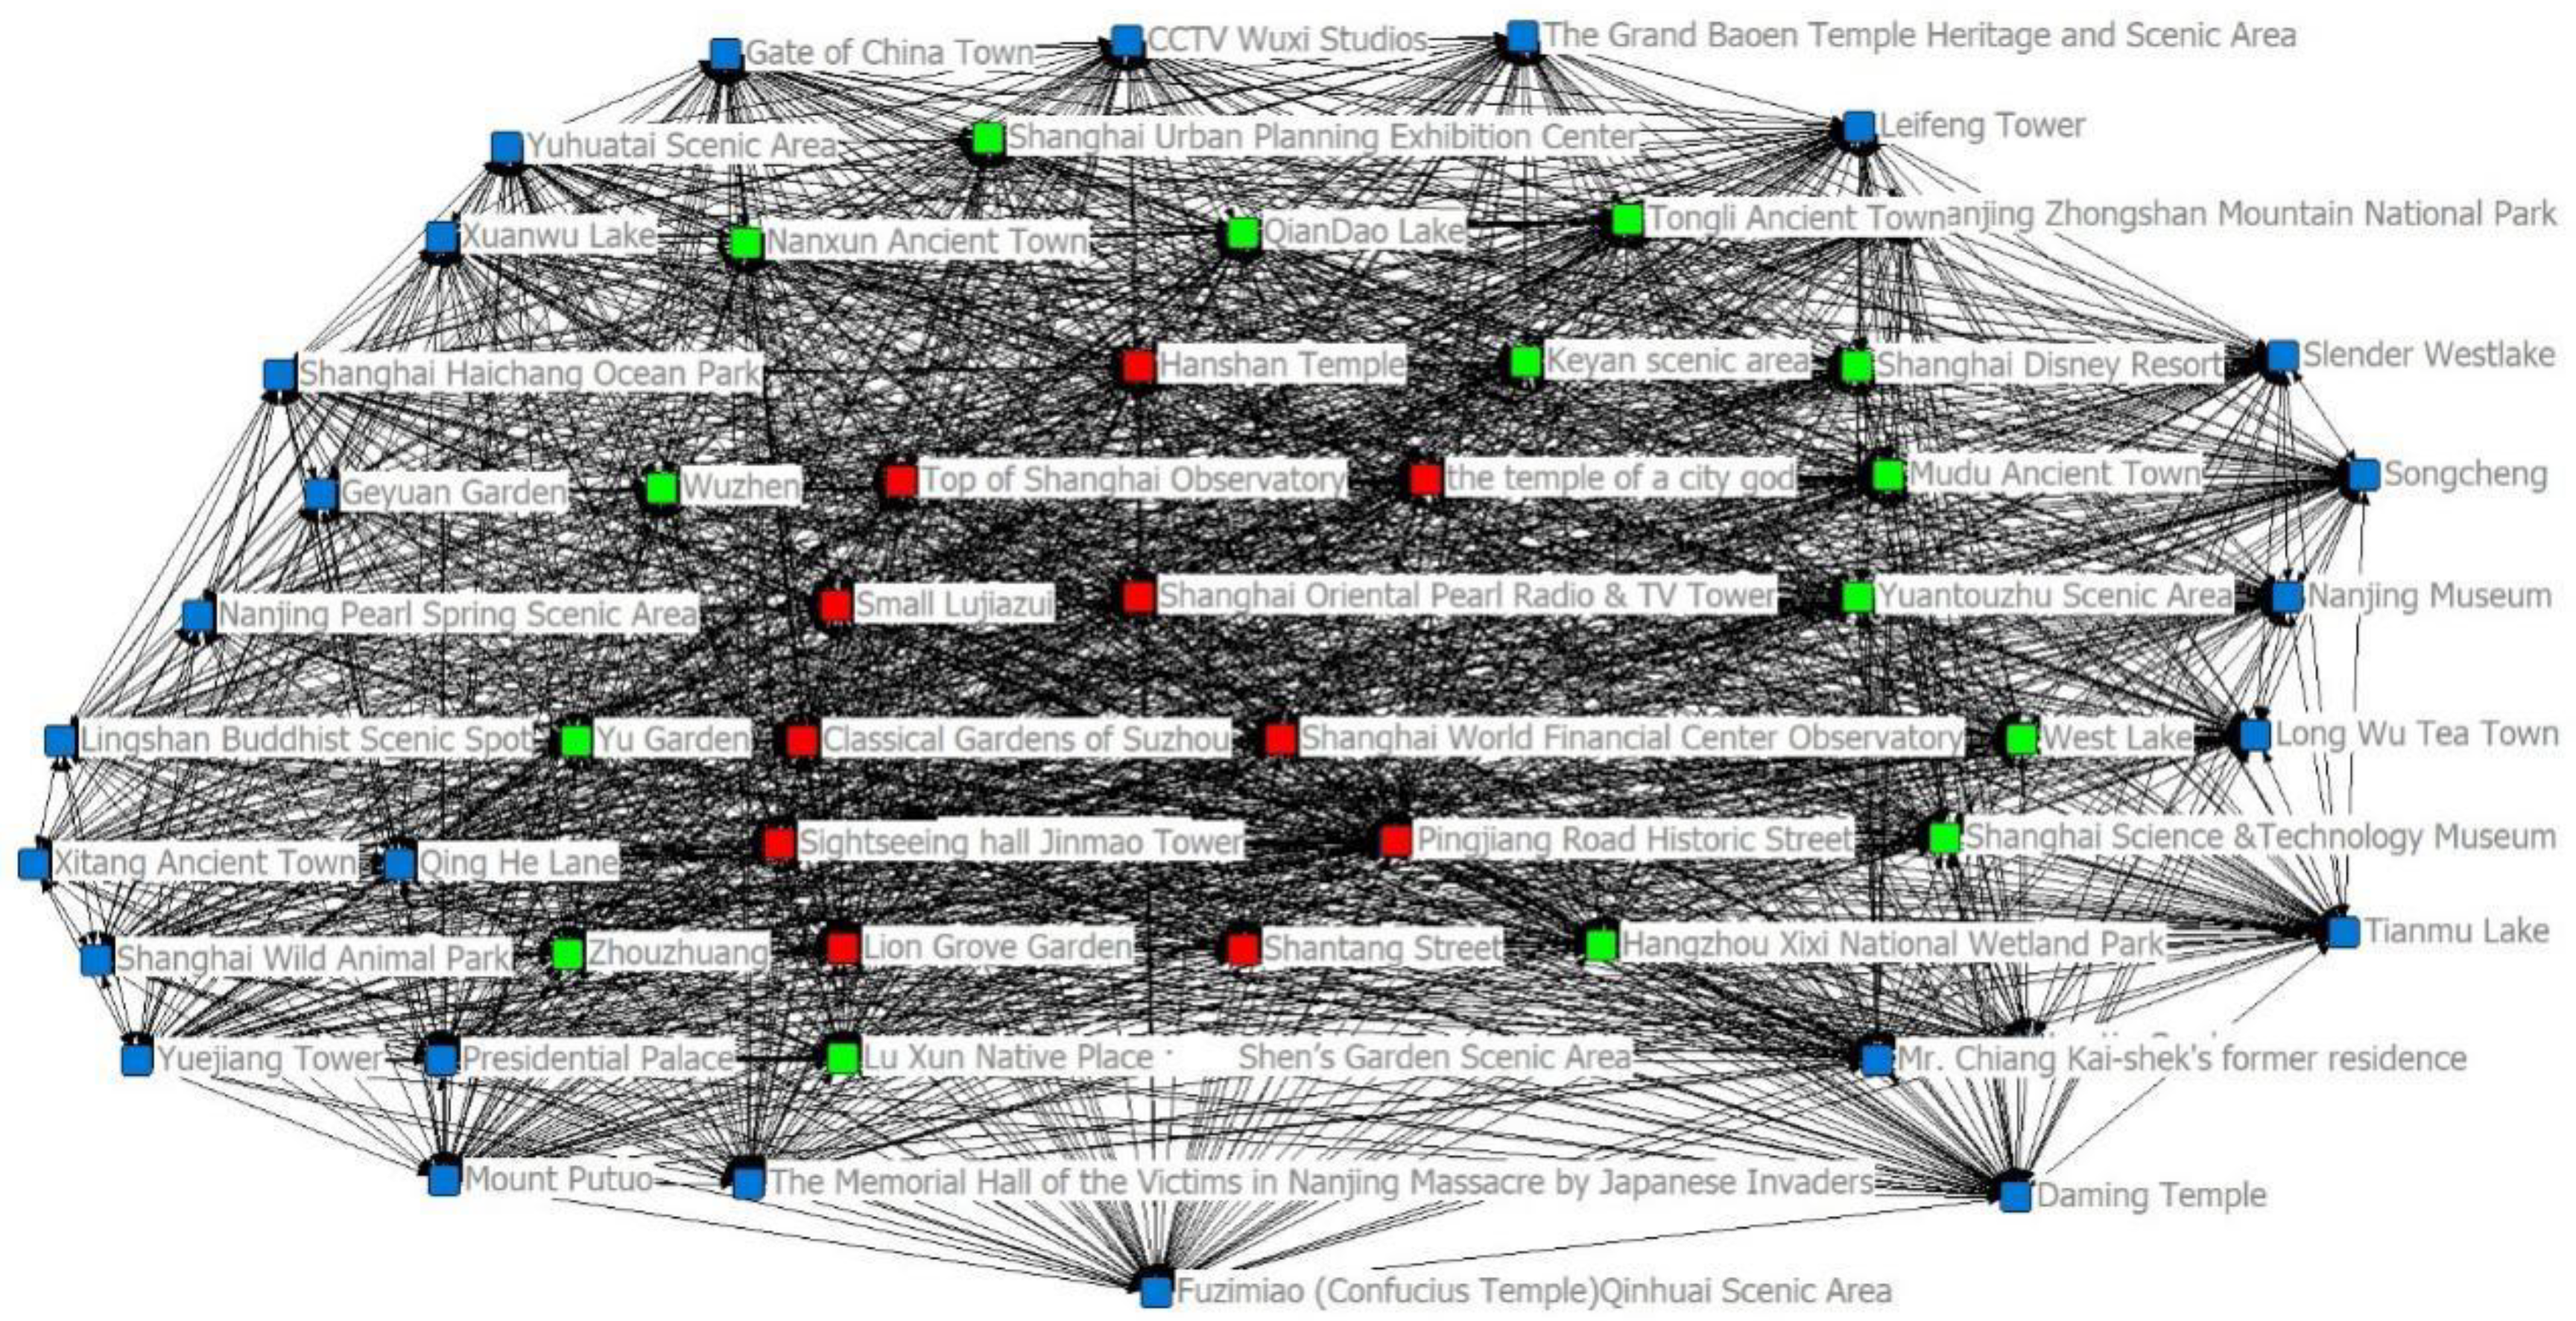
3.3.2. Core, Semi-Peripheral, and Peripheral Analyses

Continuity analysis was used to quantitatively analyze the core, semi-peripheral, and peripheral structures, using the Ucinet 6.0 software Network/Core–Periphery program for this purpose. The results (Figure 3) show obvious hierarchical differences in the cooperation network structure. From the perspective of the spatial distribution, the core members (red spots in Figure 3) are mainly distributed in the eastern region of the YRD’s urban agglomeration, which comprises 11 tourist attractions in Shanghai and Suzhou. Because Suzhou is close to and driven by Shanghai and relies on its own tourism resource quality and tourist attention, it has great cooperation advantages in the network structure. It has frequent tourism exchanges and cooperation with other tourist attractions, which often produce spillover effects on the tourism economy for tourist attractions in surrounding cities. It also plays a core role in tourism cooperation in the YRD. Thirteen tourist attractions (green spots in Figure 3), including Tongli Ancient Town, constitute the semi-peripheral area concentrated in southern Jiangsu, northern Zhejiang, and a part of Shanghai. The peripheral members (blue spots in Figure 3) are mainly composed of tourist attractions of the second- and third-tier cities in Jiangsu Province and Zhejiang Province and are generally in the peripheral area of the YRD. These tourist attractions have relatively weak economic strength, remote geographical locations, and relatively low tourist participation. Their tourism cooperation with other tourist attractions is low, and they are in a relatively disadvantaged position in the tourism cooperation network.

3.3.3. Centrality Analysis

To further analyze the characteristics of the cooperation network, this study measured the degree, closeness, and betweenness centralities of the 55 selected tourist attractions. Table 4 shows the calculation results and the corresponding rankings of the indicators.
(2)
Degree centrality
The highest and lowest degree centralities of the 55 tourist attractions were 100.000 and 48.148, respectively, with a mean of 64.242. The degree centrality values of tourist attractions in Suzhou, Hangzhou, and Shanghai were significantly higher than those of other tourist attractions; therefore, these tourist attractions were in a more central position in the network. The five lowest-degree centrality values were exhibited by Daming Temple, Slender Westlake, Hangzhou Xixi National Wetland Park, Long Wu Tea Town, and CCTV Wuxi Studios. These five tourist attractions are in a subordinate position in the network, possibly owing to their remote geographical locations and limitations in transportation and resources. This also indicates that the spatial imbalance in cooperation remains relatively obvious. In addition, mutual connections and cooperation among tourist attractions in the YRD are mainly conducted through tourist attractions in Shanghai, Suzhou, and Hangzhou. This is primarily because there are fewer spatial obstacles to cooperation among tourist attractions in the three cities mentioned above. First, most of these tourist attractions are in the hub position, and their geographical locations are superior. Second, the hub position provides better transportation conditions for strengthening tourism cooperation and affects the tourism links of other tourist attractions. In addition, these attractions have attracted tourists’ attention because of their high popularity. To meet their higher tourism needs, tourists travel to multiple destinations, thereby driving the tourism development of surrounding tourist attractions and, thus, forming cooperative ties.
(3)
Closeness centrality
The highest value was 100.000, the lowest was 65.854, and the mean was 75.219. These values are generally high, and the closeness centrality distribution is relatively balanced compared with that of the degree centrality. This shows that tourist attractions in the YRD cooperate quickly with each other. This may be a result of the following factors: First, with the deepening of the integrated development of tourism in the YRD, there are increasing numbers of cross-administrative regions and diversified products on a series of tourist routes, and the cooperation among tourist attractions across different administrative regions, such as provinces and cities, is getting closer. Second, because of the strengthening of the interactive and complementary capabilities of the tourism industry, the depth and breadth of cooperation among tourist attractions have been further enhanced. In addition, there are 18 tourist attractions with higher values nearer to the center than the average, including the Classical Gardens of Suzhou, Shantang Street, Hanshan Temple, Mudu Ancient Town, Lion Grove Garden, Tongli Ancient Town, Pingjiang Road Historic Street, and Zhouzhuang in Suzhou; Shanghai Oriental Pearl Radio and TV Tower and Sightseeing Hall Jinmao Tower in Shanghai; Yuantouzhu Scenic Area and Lingshan Buddhist Scenic Spot in Wuxi; Wuzhen and Xitang Ancient Town in Jiaxing; Nanxun Ancient Town and Tianmu Lake in Changzhou; and Qing He Lane and West Lake in Hangzhou. These tourist attractions are rich in tourism resources and are either well known, such as the Classical Gardens of Suzhou, Zhouzhuang, West Lake, and Wuzhen, or have superior locations and traffic conditions, such as Shanghai Oriental Pearl Radio and TV Tower and Sightseeing Hall Jinmao Tower. This indicates that tourist attractions with high tourism resource endowments have more connections to other tourist attractions in the tourism cooperation network.
(4)
Betweenness centrality
The mean value of the betweenness centrality was 0.675, with 14 tourist attractions having greater betweenness centrality values than the mean: the Classical Gardens of Suzhou, Shantang Street, Hanshan Temple, Mudu Ancient Town, Lion Grove Garden, Tongli Ancient Town, Pingjiang Road Historic Street, Yuantouzhu Scenic Area, Nanxun Ancient Town, Lingshan Buddhist Scenic Spot, Wuzhen, Zhouzhuang, Tianmu Lake, and QianDao Lake. The total score of the betweenness centralities of these tourist attractions was 30.459, accounting for 82.180%, indicating that the formation of the most cooperative relations in tourist attractions was completed through these tourist attractions. Tourist attractions play an “intermediary” role in cooperation networks.
In addition, the top 15 tourist attractions with a betweenness centrality score not only included popular tourist attractions in Shanghai, Hangzhou, Suzhou, and Nanjing but also Nanxun Ancient Town in Huzhou, Tianmu Lake in Changzhou, and Xitang Ancient Town in Jiaxing. This shows that not only do some popular tourist attractions, as the collection and distribution centers of tourism flows, have the “intermediary” function for connecting tourist attractions but also some unpopular tourist attractions show an outstanding “intermediary” ability. These tourist attractions are key “intermediaries” in the cooperation networks of tourist attractions in the YRD.
It is worth noting that the bottom five tourist attractions regarding the betweenness centrality are the Nanjing Pearl Spring Scenic Area, Shanghai Urban Planning Exhibition Center, Yu Garden, Shanghai Haichang Ocean Park, and Shanghai Wild Animal Park. It is difficult for them to play intermediate or dominant roles in a cooperation network. In short, from the perspective of the centrality value, 55 tourist attractions in the YRD have universal cooperative relations. Tourist attractions with strong tourism distribution functions, obvious location advantages, and high tourism resource endowments not only have a significant central position in the cooperation network but also have a strong intermediary role.

3.3.4. Cohesive Subgroup Analysis

Cohesive subgroup analysis can explain the clustering characteristics of each node in a network. Cohesive subgroup analysis was designed to explore the internal substructure of the network, divide the subgroups under certain conditions, and identify the members of each subgroup. Therefore, the application of cohesive subgroup analysis can further determine whether there are “small groups” in the cooperation network that reveal which tourist attractions in the YRD have closer cooperation links. We used the CONCOR program in Ucinet 6.0 to conduct cluster analysis on the internal structure of the cooperation network and obtained the cohesive subgroup density table (Table 5) and tree diagram of the YRD tourist attraction cooperation network.
The cooperation network of tourist attractions in the YRD has an obvious multilevel subgroup structure. The cohesive subgroups (Table 6) can be further divided into four subgroups at level 2. First, is the southeastern cooperative subgroup of the YRD, which is composed of 11 tourist attractions. From the spatial perspective, this subgroup is based on the tourist attractions in Hangzhou as the core and drives the common development of the tourist attractions in Shaoxing and Zhoushan.
Second, is the eastern cooperation subgroup of the YRD, including 27 tourist attractions in Shanghai, Suzhou, Wuxi, and Jiaxing. Spatially, the Shanghai second subgroup consists of Yu Garden, the Shanghai World Financial Center Observatory, the Top of Shanghai Observatory, the Shanghai Urban Planning Exhibition Center, the Temple of the City God, Shanghai Haichang Ocean Park, Shanghai Science and Technology Museum, Shanghai Wild Animal Park, Shanghai Disney Resort, Madame Tussauds, Sightseeing Hall Jinmao Tower, Shanghai Oriental Pearl Radio and TV Tower, Small Lujiazui, and Tongli Ancient Town. Hanshan Temple, Mudu Ancient Town, Lion Grove Garden, Shantang Street, Pingjiang Road Historic Street, and the Classical Gardens of Suzhou form the main body of the Suzhou second subgroup, and the tourist attractions in Wuxi and Jiaxing are dependent on the two subgroups.
Third, is the central cooperative subgroup of the YRD, including QianDao Lake in Hangzhou and Tianmu Lake in Changzhou, which are located at the periphery of the entire network.
Fourth, is the northern cooperative subgroup of the YRD, including 15 tourist attractions in Nanjing and Yangzhou. Nanjing’s tourist attractions have close cooperation, whereas Yangzhou’s tourist attractions are in a relatively marginal position. The inner density of these four subgroups is close to 1, indicating that the members of these cohesive subgroups are closely connected and frequently interact through information sharing and cooperation.
According to the subgroup division at the third level of the cohesive subgroups (Table 6), tourist attractions can be divided into seven subgroups. Tourist attractions in Shanghai and Suzhou are at the core of the tourist attraction cooperation network and have a strong tourism correlation effect on each cohesive subgroup. Owing to its comprehensive economic strength and transportation-hub-center status, Shanghai has become a single cohesive subgroup, driving the cooperation and development of Wuxi and Jiaxing tourist attractions through radiation and diffusion. Suzhou is rich in tourism resources and has a good reputation that is favored by tourists. Most of its domestic tourist attractions formed a single cohesive subgroup. In addition, among these seven cohesive subgroups, the 1st, 3rd, 4th, and 6th cohesive subgroups are all formed by tourist attractions in the same province (city) and adjacent geographical locations. It can be inferred that provincial (city) administrative divisions may have an important impact on regional tourism cooperation. Therefore, removing policy obstacles is the premise for promoting regional tourism cooperation.

4. Discussion

Findings

This study follows the logic of “nodes, relationships, and structures” to build a cooperation network and evaluates the competitiveness, cooperation gravity, and cooperation network structure of the tourist attractions in the YRD. Compared with previous studies, this study explains the premise and reason for cooperation and establishes a systematic concept and new research paradigm for the study of regional tourism cooperation. The construction and measurement of a cooperation network of tourist attractions is greatly significant to the sustainable development of tourism in the YRD.
First, at the node level, based on the selection of tourist attractions and data collection, the competitiveness measurement indicators of tourist attractions were screened, a competitiveness measurement model was constructed, and competitiveness was evaluated. The analysis revealed that from the overall situation of the 55 selected tourist attractions, the difference between the minimum and maximum values of their tourism competitiveness is 46 times, and the standard deviation is 0.16542, indicating that the competitiveness of each tourist attraction is greatly different. Regarding the geographical distribution, 13 of the 20 tourist attractions were located in Jiangsu Province, accounting for 65%; the remaining seven were located in Zhejiang Province, accounting for 35%. This shows that competitiveness in Jiangsu and Zhejiang Provinces is relatively strong, while tourist attractions in Anhui Province and Shanghai are not ranked in the top 20, indicating that their competitiveness must be improved.
This is consistent with the conclusions of Lin et al. (2022) [41], Zhou and Jiang (2015) [42] and Wang et al. (2022) [27], who similarly believe that competitiveness in Zhejiang and Jiangsu is strong in the YRD. However, the difference is that tourist attractions in Shanghai failed to enter the top 20. This may be because the tourist attractions in Jiangsu and Zhejiang have strong tourism competitiveness and unique tourism resources, tourism capital flow, and tourism flow that are relatively concentrated with convenient transportation. Although Shanghai and Anhui have also achieved sustained and rapid social and economic development, their domestic tourist attractions have obvious regional advantages. However, compared with Jiangsu and Zhejiang, Shanghai and Anhui have fewer 5A tourist attractions, and tourism competitiveness is somewhat lacking. In addition, owing to the influence of their thematic culture, individual tourist attractions where the tourists are younger and the tourist source group is limited (such as Shanghai Disneyland) result in a relatively low tourism competitiveness.
Second, at the relationship level, based on the competitiveness index value of tourist attractions, indicator variables were set to modify the GM and build the tourist attraction cooperation GM. The analysis results show that the average cooperative gravity of the 55 selected tourist attractions in the YRD is 444.0247 and that 16 tourist attractions exceed the average, accounting for 29.11%, and are mainly distributed in Shanghai, Suzhou, and Hangzhou. These findings support those of Wang et al. (2022) [13] and Yin et al. (2020) [25]. This may be because Shanghai, Suzhou, and Hangzhou have rich tourism resources and high visibility in addition to convenient transportation between tourist attractions, tourism development, and cooperation advantages.
The overall ranking of tourist attractions in Suzhou was relatively high, while the cooperation gravity in Shanghai and Hangzhou differed. For example, the cooperation gravity of the Sightseeing Hall Jinmao Tower is approximately 126 times that of the Haichang Ocean Park in Shanghai, and the cooperation gravity of Qing He Lane is approximately 32 times that of QianDao Lake in Hangzhou. This shows that the cooperation between Shanghai and Hangzhou is unbalanced. In addition, the competitiveness of northeast Zhejiang tourist attractions is strong, but the advantages of cooperation are not obvious, and the transportation and publicity of tourist attractions and the supply of route products must be further strengthened. Tourism competitiveness in northern Jiangsu Province is weak, and there is a lack of good cooperation.
Finally, at the structural level, with the cooperation GM, Ucinet 6.0 software was used to build the cooperation network, and the characteristics of the network were analyzed. Our analysis revealed the following: First, the density of the cooperation network was high. This indicates that the 55 YRD tourist attractions selected in this study have a high degree of cooperation. The cooperation network structure has a certain stability, and each tourist attraction can conveniently realize tourism cooperation with other tourist attractions through the network structure. This finding supports those reported by Wu et al. (2010) [43] and Zhang et al. (2020) [44]. Second, from the centrality value, we establish that tourist attractions with a high economic development level, obvious location advantages, convenient transportation, and a high tourism resource endowment are mostly located in the center of the cooperation network, and their “intermediary” role in the cooperation network is also stronger.
In addition, the core, semi-peripheral, and peripheral structural analyses identified that the level of difference in the cooperation network structure is significant. Regarding the spatial distribution, core members were mainly distributed in the eastern region of the YRD and played a key role in tourism cooperation in the area. Tongli Ancient Town and another 13 tourist attractions constitute a semi-peripheral area concentrated in southern Jiangsu, northern Zhejiang, and some areas of Shanghai. The peripheral members are mainly composed of second- and third-tier cities in Jiangsu and Zhejiang and are generally in the peripheral areas in the YRD. The economic strength of these tourist attractions is relatively weak; their geographical locations are fairly remote, and their participation in tourism cooperation is low in comparison with that of tourist attractions. This finding supports those of Wang et al. (2022) [27].
Our analysis uncovered additional findings. The branch map of the condensed subgroups can be divided into four subgroups at level 2: the southeast, eastern, central, and northern cooperative subgroups of the YRD. Tourist attractions within these subgroups engage in frequent exchanges and close cooperation. According to the branch diagram of the condensed subgroups at the third level, tourist attractions were divided into seven subgroups. In general, the condensed subgroups of the cooperation network mainly show the following characteristics. First, the distribution of the cooperation network’s condensed subgroups is significantly related to the geographical location of tourist attractions. When tourist attractions are geographically close, it is easier for them to form small groups. Second, cooperation is in the group mode, and cooperation between tourist attractions within the same subgroup has strong similarity and dependence. The number of high-density cohesive subgroups was greater than that of the low-density cohesive subgroups, and the spatial patterns of the tourism cooperation were relatively balanced. Finally, cross-regional tourism cooperation and interaction were evident, and there were small groups of cross-provincial (city) tourist attractions. However, there are more small groups formed by several tourist attractions in the province’s (city’s) administrative region. This shows that the provincial- (city)-level administrative division is a key factor hindering cross-provincial tourist attraction cooperation and regional tourism integration and development. This finding supports those of Yang (2018) [26] and Rachel and Catheryn (2020) [45].

5. Conclusions

Implications, Limitations, and Further Research

The centrality of each node in the cooperation network was quite different. The core members have a high degree of centrality; from the core, semi-peripheral, and peripheral structural diagrams, it can be seen that the relationship between the core members is relatively close, and the advantages are obvious. There is a large gap between the core and peripheral members, indicating that the core members have limited leading effects on the periphery members. Therefore, it is necessary to recognize and support the leading function of the core members in the surrounding area and further improve their driving ability. For example, with the help of government policy support, we can improve the traffic road between the core and peripheral areas and design tourism routes between them to promote cooperation between tourism enterprises.
In the context for integrating the YRD, tourism enterprises should break through the static view of isolated tourist attractions and expand the scale of development to a wider range of spaces. The government should also break down administrative boundaries and institutional barriers and advocate for forming a “tourist-attraction-group mode” of cooperation and development. Simultaneously, priority should be given to the establishment of tourism destination collaborative innovation demonstration zones in the core areas of the network, such as in Shanghai, Nanjing, Hangzhou, Suzhou, and Wuxi, to assume a demonstration and radiation role in the network. These core areas of the network are economically developed, have obvious tourism distribution locations, and have high characteristic tourism resource endowments. Taking these initiatives will optimize the cooperation environment regarding policies, resources, and transportation and cultivate a model for tourism cooperation and development. Through the development of core tourist attractions, the reasonable and orderly spread to the semi-peripheral and peripheral areas of tourist attractions and further promotion of their development will encourage the balanced development of regional tourism and enhance the tourism competitiveness of the entire region.
This study has some limitations. For example, because of the large number of tourist attractions in the YRD, this study only selected AAAAA- and AAAA-level tourist attractions. Therefore, the cooperation network built in this study is inevitably imperfect, making it difficult to fully reflect its characteristics. In addition, this study only used data from OTA websites and lacked offline data collection. Future research should consider a combination of online and offline data to conduct more comprehensive and convincing research on a larger sample. In addition to the YRD, future studies should also test the above models at more tourist destinations to draw more objective conclusions. The spatial and temporal characteristics of the research samples can also be reflected using geographic information system analysis to provide an even more profound analysis of the characteristics of the cooperation network.

Author Contributions

Methodology, H.C.; Software, C.L.; Validation, L.A.; Writing—original draft, Y.W. All authors have read and agreed to the published version of the manuscript.

Funding

This research was funded by the National Social Science Foundation of China (to Yuewei Wang) (Grant No. 19BGL145).

Institutional Review Board Statement

Not applicable.

Informed Consent Statement

Not applicable.

Data Availability Statement

Data are contained within the article.

Conflicts of Interest

The authors declare no conflict of interest.

References

  1. Zhang, H.; Gu, C.-L.; Gu, L.-W.; Zhang, Y. The evaluation of tourism destination competitiveness by TOPSIS & information entropy—A case in the Yangtze River Delta of China. Tour. Manag. 2011, 32, 443–451. [Google Scholar]
  2. Pasquinelli, C. Competition, cooperation and co-opetition: Unfolding the process of inter-territorial branding. Urban Res. Pract. 2013, 6, 1–18. [Google Scholar] [CrossRef]
  3. Nguyen, C.T. Competition as cooperation. J. Philos. Sport 2017, 44, 123–137. [Google Scholar] [CrossRef]
  4. Herring, J. Cooperative Equilibrium in Biosphere Evolution: Reconciling Competition and Cooperation in Evolutionary Ecology. Acta Biotheor. 2021, 69, 629–641. [Google Scholar] [CrossRef] [PubMed]
  5. Bengtsson, M.; Kock, S. Cooperation and competition in relationships between competitors in business networks. J. Bus. Ind. Mark. 1999, 14, 178–194. [Google Scholar] [CrossRef]
  6. Asero, V.; Gozzo, S.; Tomaselli, V. Building tourism networks through tourist mobility. J. Travel Res. 2016, 55, 751–763. [Google Scholar] [CrossRef]
  7. Thi, Q.T.; Patricia, J.; Tamara, Y. Networking, coopetition and sustainability of tourism destinations. J. Hosp. Tour. Manag. 2022, 50, 400–411. [Google Scholar] [CrossRef]
  8. Czernek-Marszałek, K. Social embeddedness and its benefits for cooperation in a tourism destination. J. Destin. Mark. Manag. 2020, 15, 100401. [Google Scholar] [CrossRef]
  9. Gao, J.; Peng, P.; Lu, F.; Claramunt, C. A multi-scale comparison of tourism attraction networks across China. Tour. Manag. 2022, 90, 104489. [Google Scholar] [CrossRef]
  10. Hong, T.; Ma, T.; Huan, T.C. Network behavior as driving forces for tourism flows. J. Bus. Res. 2015, 68, 146–156. [Google Scholar] [CrossRef]
  11. Sthapit, A. Cooperation and Collaboration for Sustainable Tourism: Key to Recovery and Growth in post-Pandemic Era. Nepal. J. Hosp. Tour. Manag. 2021, 2, 5–6. [Google Scholar] [CrossRef]
  12. Sun, J.H. Research on cooperation strategy between government, tourist attraction and travel agency under the background of low carbon. Value Eng. 2019, 38, 18–23. [Google Scholar]
  13. Jesus, C.; Franco, M. Cooperation networks in tourism: A study of hotels and rural tourism establishments in an inland region of Portugal. J. Hosp. Tour. Manag. 2016, 29, 165–175. [Google Scholar] [CrossRef]
  14. Dejean, S. The role of distance and social networks in the geography of crowdfunding: Evidence from France. Reg. Stud. 2019, 54, 329–339. [Google Scholar] [CrossRef]
  15. Reilly, W.J. The Law of Retail Gravitation; Knickerbocker Press: New York, NY, USA, 1931. [Google Scholar]
  16. Chang, J.; Lu, Z. Policy effect, economy gravitation and border effect—Empirical research based on spatial econometrics. West Forum. 2011, 21, 66–75. [Google Scholar]
  17. Bellino, E.; Serrano, F. Gravitation of market prices towards normal prices: Some new results. Contrib. Political Econ. 2018, 37, 25–64. [Google Scholar] [CrossRef]
  18. Ali, A.F.; Tawfik, A. Modified newton’s law of gravitation due to minimal length in quantum gravity. Adv. High Energy Phys. 2013, 2, 126528. [Google Scholar]
  19. Cataldo, C. Beyond the metrics: Qualitative introduction to the modified gravitation. Res. Rev. 2016, 2, 31–32. [Google Scholar]
  20. Gan, C.; Voda, M.; Wang, K.; Chen, L.; Ye, J. Spatial network structure of the tourism economy in urban agglomeration: A social network analysis. J. Hosp. Tour. Manag. 2021, 47, 124–133. [Google Scholar] [CrossRef]
  21. Teye, V.B. Prospects for regional tourism cooperation in Africa. Tour. Manag. 1988, 9, 221–234. [Google Scholar] [CrossRef]
  22. Wang, Y.; Fesenmaier, D.R. Collaborative destination marketing: A case study of Elkhart County, Indiana. Tour. Manag. 2007, 28, 863–875. [Google Scholar] [CrossRef]
  23. Fyall, A.; Garrod, B. Tourism Marketing: A Collaborative Approach; Channel View Publications: Tonawanda, NY, USA, 2004; p. 27. [Google Scholar]
  24. Li, C.; Chang, K.K.; Ou, S.M. Using fuzzy sampling survey to explore the factors influencing regional cooperation: Changsha-Zhuzhou-Xiangtan case. IOP Conf. Ser. Mater. Sci. Eng. 2021, 1113, 012020. [Google Scholar] [CrossRef]
  25. Yin, J.; Bi, Y.; Ji, Y. Structure and Formation Mechanism of China-ASEAN Tourism Cooperation. Sustainability 2020, 12, 5440. [Google Scholar] [CrossRef]
  26. Yang, Y. Understanding tourist attraction cooperation: An application of network analysis to the case of Shanghai, China. J. Destin. Mark. Manag. 2018, 8, 396–411. [Google Scholar] [CrossRef]
  27. Wang, Y.; Xi, M.; Chen, H.; Lu, C. Evolution and driving mechanism of tourism flow networks in the Yangtze River Delta urban agglomeration based on social network analysis and geographic information system: A double-network perspective. Sustainability 2022, 14, 7656. [Google Scholar] [CrossRef]
  28. Baggio, R. Collaboration and cooperation in a tourism destination: A network science approach. Curr. Issues Tour. 2011, 14, 183–189. [Google Scholar] [CrossRef]
  29. He, R.; Li, G.; Cao, J. Does “Good Wine Needs No Bush”, Really Hold Good? A Study on Location Selection of Chinese National Parks. Tour. Trib. 2018, 33, 94–107. [Google Scholar]
  30. Xing, F. Research on countermeasures of cross-administrative region cooperation in tourist attractions: A case study of ancient towns in Jiangnan. Bus. Econ. 2006, 8. [Google Scholar]
  31. Deasy, G.F.; Griess, P.R. Impact of a tourist facility on its Hinterland. Ann. Assoc. Am. Geogr. 1966, 56, 290–306. [Google Scholar] [CrossRef]
  32. Haahti, A.; Yavas, U. Tourists’ perceptions of Finland and selected European countries as travel destinations. Eur. J. Mark. 1983, 17, 34–42. [Google Scholar] [CrossRef]
  33. Haahti, A.J. Finland’s competitive position as a destination. Ann. Tour. Res. 1986, 13, 11–35. [Google Scholar] [CrossRef]
  34. Kaharuddin, S.; Sibolga, I.; Napitupulu, J.; Saragih, E.L.L. Determinants of tourist attraction of the heritage tourism. J. Environ. Manag. Tour. 2021, 12, 507–514. [Google Scholar] [CrossRef]
  35. Henry, I.; Jackson, G. Sustainability of management processes and tourism products. J. Sustain. Tour. 1996, 4, 17–28. [Google Scholar] [CrossRef]
  36. Pearce, D.G. Competitive destination analysis in Southeast Asia. J. Travel Res. 1997, 35, 16–24. [Google Scholar] [CrossRef]
  37. Enright, M.J.; Newton, J. Determinants of tourism destination competitiveness in Asia pacific: Comprehensiveness and universality. J. Travel Res. 2005, 43, 339–350. [Google Scholar] [CrossRef]
  38. Dwyer, L.; Livaic, Z.; Mellor, R. Competitiveness of Australia as a tourist destination. J. Hosp. Tour. Manag. 2003, 10, 60–78. [Google Scholar]
  39. Wang, Y.; An, L.; Chen, H.; Zhao, Y. Spatial Correlation and Influencing Factors of Tourism Eco-Efficiency in the Urban Agglomeration of the Yangtze River Delta Based on Social Network Analysis. Land 2022, 11, 2089. [Google Scholar] [CrossRef]
  40. Bao, J.; Liang, F. Spatial competition analysis about the development of coastal beach tourism resources. Econ. Geogr. 1991, 11, 89–93. [Google Scholar]
  41. Lin, Z.; Chen, Y.; Liu, X. Spatial-temporal pattern and driving factors of China’s inbound tourism city cooperation network. J. Geogr. Sci. 2022, 77. [Google Scholar]
  42. Zhou, L.; Jiang, J. Comprehensive evaluation and spatial differentiation of urban tourism competitiveness in Yangtze River Delta. J. Econ. Geogr. 2015, 1. [Google Scholar] [CrossRef]
  43. Wu, G.; Yang, G. Research on regional tourism cooperation and multi-level governance in Yangtze River Delta. East China Econ. Manag. 2010, 24. [Google Scholar]
  44. Zhang, X.; Zuo, Y.; Li, J.; Jin, X. Spatial pattern and influencing factors of tourism development in Yangtze River Delta urban agglomerations. Stat. Decis. 2020, 36. [Google Scholar]
  45. Perkins, R.; Khoo-Lattimore, C. Friend or foe: Challenges to collaboration success at different lifecycle stages for regional small tourism firms in Australia. Tour. Hosp. Res. 2020, 20, 184–197. [Google Scholar] [CrossRef]
Figure 1. Research framework for analyzing the tourism cooperation network.
Sustainability 16 00834 g001
Figure 2. Cooperation network of tourist attractions in the YRD.
Sustainability 16 00834 g002
Figure 3. The core, semi-peripheral, and peripheral structures of the cooperation network.
Sustainability 16 00834 g003
Table 1. Weights of the competitiveness evaluation indexes.
Serial NumberIndexWeight CodeWeight Value
1ATRW10.4362
2IBCW20.2781
3NTW30.1416
4TIW40.1441
Table 2. The competitiveness scores and rankings of the top 20 tourist attractions.
CodeName of the Tourist AttractionCounty (Urban Area)ScoreRanking
N13Nanxun Ancient TownHuZhou0.46821
N12QianDao LakeHangZhou0.46692
N18WuzhenJiaXing0.43193
N35Lingshan Buddhist Scenic SpotWuXi0.42454
N36Yuantouzhu Scenic AreaWuXi0.41155
N39Tongli Ancient TownSuZhou0.4026
N46Mr. Chiang Kai-shek’s Former ResidenceNingBo0.39467
N43Mudu Ancient TownSuZhou0.37258
N40ZhouzhuangSuZhou0.37089
N37Classical Gardens of SuzhouSuZhou0.368110
N16West LakeHangZhou0.366511
N42Hanshan TempleSuZhou0.358512
N24Fuzimiao (Confucius Temple) Qinhuai Scenic AreaNanJing0.357713
N44Lion Grove GardenSuZhou0.351614
N41Pingjiang Road Historic StreetSuZhou0.347415
N38Shantang StreetSuZhou0.343316
N27Nanjing Zhongshan Mountain National ParkNanJing0.328117
N30Tianmu LakeChangZhou0.307818
N15SongchengHangZhou0.276519
N14Mount PutuoZhouShan0.272520
Table 3. Cooperative gravities of tourist attractions.
CodeNameValueCodeNameValue
N44Lion Grove Garden1759.1547N38Shantang Street967.3726
N41Pingjiang Road Historic Street1718.0320N42Hanshan Temple853.6177
N51Sightseeing Hall Jinmao Tower1647.6408N15Songcheng815.5829
N52Shanghai World Financial Center Observatory1646.8048N3Temple of the City God759.7152
N53Top of Shanghai Observatory1588.2833N49Leifeng Tower508.1491
N37Classical Gardens of Suzhou1568.6285N7Yu Garden499.5376
N54Small Lujiazui1204.5225N43Mudu Ancient Town442.9338
N55Shanghai Oriental Pearl Radio TV Tower1179.6203N39Tongli Ancient Town416.7540
N1Qing He Lane1157.1491N2Shanghai Urban Planning Exhibition Center375.0172
N16West Lake1035.4335N40Zhouzhuang299.1843
Table 4. Individual characteristic indexes for cooperation network of tourist attractions.
NameDegree CentralityCloseness CentralityBetweenness Centrality
OutDegreeInDegreeDegreeSortClosenessSortBetweennessSort
Qing He Lane273972.222 678.26160.60410
Shanghai Urban Planning Exhibition Center272251.852 1767.500160.02640
Temple of the City God272753.704 1668.354150.15624
Madame Tussauds271653.704 1668.354150.13326
Shanghai Haichang Ocean Park271250.000 1866.667170.02441
Shanghai Science and Technology Museum272051.852 1767.500160.04338
Yu Garden272051.852 1767.500160.02640
Shanghai Wild Animal Park271250.000 1866.667170.02441
Shanghai Disney Resort272757.407 1470.130130.26719
Lantin Garden27950.000 1866.667170.14725
CCTV Wuxi Studios26348.148 1965.854180.16723
QianDao Lake272564.815 1073.973100.7359
Nanxun Ancient Town275194.444 394.73732.310 4
Mount Putuo27150.000 1866.667170.076 31
Songcheng272859.259 1371.053120.299 16
West Lake273972.222 678.26160.532 11
Keyan Scenic Area271655.556 1569.231140.249 20
Wuzhen274888.889 490.00041.804 6
Presidential Palace271650.000 1866.667170.041 39
Nanjing Museum271751.852 1767.500160.118 28
Gate of China Town271450.000 1866.667170.041 39
Memorial Hall of the Victims of the Nanjing Massacre by Japanese Invaders271550.000 1866.667170.041 39
Grand Baoen Temple Heritage and Scenic Area271550.000 1866.667170.045 37
Fuzimiao (Confucius Temple) Qinhuai Scenic Area272553.704 1668.354150.125 27
Xuanwu Lake271650.000 1866.667170.041 39
Nanjing Pearl Spring Scenic Area271450.000 1866.667170.041 39
Nanjing Zhongshan Mountain National Park272357.407 1470.130130.277 18
Yuejiang Tower271450.000 1866.667170.098 30
Yuhuatai Scenic Area271850.000 1866.667170.304 15
Tianmu Lake273368.519 876.05680.783 8
Dongguan Street271250.000 1866.667170.109 29
Geyuan Garden271450.000 1866.667170.109 29
Daming Temple271350.000 1866.667170.172 22
Slender Westlake271550.000 1866.667170.053 34
Lingshan Buddhist Scenic Spot274888.889 490.00041.945 5
Yuantouzhu Scenic Area275194.444 394.73732.368 3
Classical Gardens of Suzhou2754100.000 1100.00012.742 1
Shantang Street2754100.000 1100.00012.742 1
Tongli Ancient Town275398.148 298.18222.579 2
Zhouzhuang 274787.037 588.52551.646 7
Pingjiang Road Historic Street275398.148 298.18222.579 2
Hanshan Temple2754100.000 1100.00012.742 1
Mudu Ancient Town2754100.000 1100.00012.742 1
Lion Grove Garden2754100.000 1100.00012.742 1
Lu Xun Native Place–Shen’s Garden Scenic Area271451.852 1767.500160.057 33
Mr. Chiang Kai-shek’s Former Residence271153.704 1668.354150.065 32
Xitang Ancient Town273870.370 777.14370.420 12
Hangzhou Xixi National Wetland Park271150.000 1866.667170.049 36
Leifeng Tower271551.852 1767.500160.057 33
Long Wu Tea Town27850.000 1866.667170.051 35
Sightseeing Hall Jinmao Tower273768.519 876.05680.355 13
Shanghai World Financial Center Observatory273464.815 1173.973100.285 17
Top of Shanghai Observatory273161.111 1272.000110.192 21
Small Lujiazui273666.667 975.00090.311 14
Shanghai Oriental Pearl Radio and TV Tower273870.370 777.14370.420 12
Table 5. Subgroup density of tourist attraction cooperation networks.
1234567
110.7920.2891100.167
210.8040.3750.9380.6880.010
30.6890.0170.910.9780.0330.010.033
40.9720.1040.65610.50.0190.583
510.3750.067110.3851
60.0260.0290.0210.8910.84611
70.500110.8081
Table 6. The subgroups and members of the cooperation network of tourist attractions.
SubgroupsMembers
Level 2Level 3
11Qing He Lane; Songcheng; West Lake
2Keyan Scenic Area; Lu Xun Native Place; Shen’s Garden Scenic Area; Mr. Chiang Kai-shek’s Former Residence; Lantin Garden; Hangzhou Xixi National Wetland Park; Leifeng Tower; Long Wu Tea Town; Mount Putuo
23Yu Garden; Shanghai World Financial Center Observatory; Top of Shanghai Observatory; Shanghai Urban Planning Exhibition Center; Temple of the City God; CCTV Wuxi Studios; Shanghai Haichang Ocean Park; Shanghai Science and Technology Museum; Xitang Ancient Town; Shanghai Wild Animal Park; Shanghai Disney Resort; Madame Tussauds; Sightseeing Hall Jinmao Tower; Shanghai Oriental Pearl Radio and TV Tower; Small Lujiazui
4Nanxun Ancient Town; Tongli Ancient Town; Hanshan Temple; Mudu Ancient Town; Lion Grove Garden; Wuzhen; Yuantouzhu Scenic Area; Zhouzhuang; Lingshan Buddhist Scenic Spot; Classical Gardens of Suzhou; Shantang Street; Pingjiang Road Historic Street
35QianDao Lake; Tianmu Lake
46Daming Temple; Yuhuatai Scenic Area; Slender Westlake; Dongguan Street; Geyuan Garden; Presidential Palace; Nanjing Museum; Gate of China Town; Memorial Hall of the Victims of the Nanjing Massacre by Japanese Invaders; Grand Baoen Temple Heritage and Scenic Area; Xuanwu Lake; Nanjing Pearl Spring Scenic Area; Yuejiang Tower
7Fuzimiao (Confucius Temple); Qinhuai Scenic Area; Nanjing Zhongshan Mountain National Park
Disclaimer/Publisher’s Note: The statements, opinions and data contained in all publications are solely those of the individual author(s) and contributor(s) and not of MDPI and/or the editor(s). MDPI and/or the editor(s) disclaim responsibility for any injury to people or property resulting from any ideas, methods, instructions or products referred to in the content.

