Article

The Impact of Green Space on University Students’ Mental Health: The Mediating Roles of Solitude Competence and Perceptual Restoration

College of Landscape Architecture, Northeast Forestry University, Harbin 150040, China
*
Author to whom correspondence should be addressed.
Sustainability 2024, 16(2), 707; https://doi.org/10.3390/su16020707
Submission received: 26 October 2023 / Revised: 6 January 2024 / Accepted: 11 January 2024 / Published: 13 January 2024

Abstract

:
With the prevalence of mental health problems among college students, perceptual recovery and the sensory dimensions of perception (PSD) have emerged as crucial environment-related factors for psychological well-being. However, there has been relatively limited research on how these factors directly and indirectly impact the restoration experience of college students in green spaces on campuses. Therefore, the aim of this study was to determine the influence of college students’ intrinsic motivation on their psychological well-being when exposed to campus green spaces. Special attention was given to the role of solitude and perceptual recovery in this process. Research Methodology: Based on a literature review and field research, we classified campus green spaces into eight types based on perceptual dimensions. We collected 550 questionnaires on campus, and the data processing involved structural equation modeling (SEM) and mediation analysis. Findings: A positive correlation was found between perceived sensory dimensions and the recovery experience. College students’ perceptual recovery and ability to be alone emerged as mediating variables in this process. In essence, this study sheds light on the mechanism through which intrinsic motivation impacts the mental health of college students when they engage with campus green spaces.

1. Introduction

A previous study reported that campus green spaces help improve mental health levels. With the increasing awareness of mental health issues among college students, more attention has been devoted to this aspect [1]. The study points out that green spaces play an important role in promoting positive mental health in the context of psychological recovery between human health and the environment. Direct exposure to a green environment helps to restore and relax an individual’s mind, creating a unique sense of calm and tranquility in the natural environment. This, in turn, makes a positive contribution to overall mental health [1]. Psychological recovery is the direct effect of contact with green spaces in promoting positive mental health outcomes. The main theoretical sources are the attention restoration theory and the stress relief theory, which specifically refer to the positive effects that natural environments have on the emotional and physiological aspects of a person. Later researchers have also proposed a variety of ways to measure health outcomes based on this including attention restoration, emotional restoration, well-being, and stress relief [2].
Contact with campus green space has a positive effect on mental health. Campus green space plays a positive role in influencing the mental health of students, and the green environment of a campus can significantly enhance the psychological well-being of students and reduce psychological stress [3]. The number of studies investigating the mechanisms underlying the relationship between green spaces and mental health is increasing [4]. William C. Sullivan et al. showed, using quantitative testing of physiological indicators, that exposure to green space can help students recover from stress and mental fatigue [5]. Additionally, studies indicate that fostering emotional intelligence has positive effects on university performance [6], enhances teacher creativity [7], and positively influences the learning outcomes of both students and teachers, as well as organizational performance [8,9]. This demonstrates the crucial importance of emotional well-being among knowledge workers for the development of a university. Numerous studies have addressed the restorative nature of campus green space and its importance to student health, with campus green space being an important medium of exposure for college students, and emotional and mental health being important observables [2,10].
For example, the restorative effects of different types of campus environments were explored, and both physical and psychological tests were conducted to determine which spaces were most conducive to the recovery of students’ mental health. This recovery was attributed to perceptual recovery categories such as feelings of escape, attraction, and compatibility [11]. Most of the current research on campus green space focuses on external spatial features, proving the influence of spatial features such as area and accessibility on mental health. However, there is a lack of research that explores the inner transformative mechanisms of green space and mental health from a subjective psychological perspective [12,13]. Social ecology emphasizes that the impact of the environment on human health is not independent but is influenced by a number of mediating effects [8]. Some studies explored the intrinsic mechanism between green space and mental health by examining intermediary factors. This was generally performed using the mediating effect mechanism to explore the influence of the intrinsic motivation of exposure to campus green space on the mental health of college students, while also investigating the correlation between green perceptions and mental health [14]. Therefore, the influence of campus green space on college students’ mental health is also not independent but is influenced by some mediating effects, which are multi-dimensional factors [15].

1.1. Solitude Competence and Mental Health

Almost everyone desires occasional solitude, a personal space to be alone. However, societal attitudes toward loneliness and solitude are generally not positive. Even those who cherish moments of solitude may fear that their need for it might burden others, potentially leading to increased psychological stress [16]. Consequently, a well-designed space for solitude can offer emotional solace akin to the companionship of a friend. Unfortunately, this need is often overlooked due to public concerns regarding the practicality and functionality of such spaces [17].
Definitions of human solitude in the field of psychology have evolved. Initially viewed as a negative state, research now shows that the effects of solitude are not necessarily detrimental [18]. It is now understood that people have a genuine need for solitude, and providing individuals with conducive spaces for solitude can have positive effects on mental health [19]. Research has demonstrated that solitude contributes to an individual’s capacity for self-reflection, self-awareness, independent thinking, and evaluation. The ability to be alone is considered a part of healthy maturation [20]. Including positive reflections on solitude can help individuals break habitual and reactive thought patterns, stimulate curiosity, increase awareness, and reduce self-judgment and the judgments of others. Additionally, it may offer a temporary reprieve from various common stressors [21].
Winnicott later argued that the ability to be alone is an early life phenomenon that underlies the gradual independence of the individual. He explored the contribution of the ability to be alone to physical and mental health [22]. Bond points out that during solitude, individuals may experience both positive and negative emotions. However, a certain degree of solitude enables individuals to be attuned to changes in their emotions and gradually alleviate negative feelings [23]. College students’ solitude is characterized by autonomy and purpose. Autonomy means they choose to be alone voluntarily and relish this liberated state of activity. Purpose signifies that students opt for solitude not by chance, but with intent—engaging in activities that interest them, finding solace, releasing stress, and seeking self-knowledge and self-reflection [24]. However, on most campuses, outdoor spaces are in the public realm and often lack areas for meditation and contemplation.

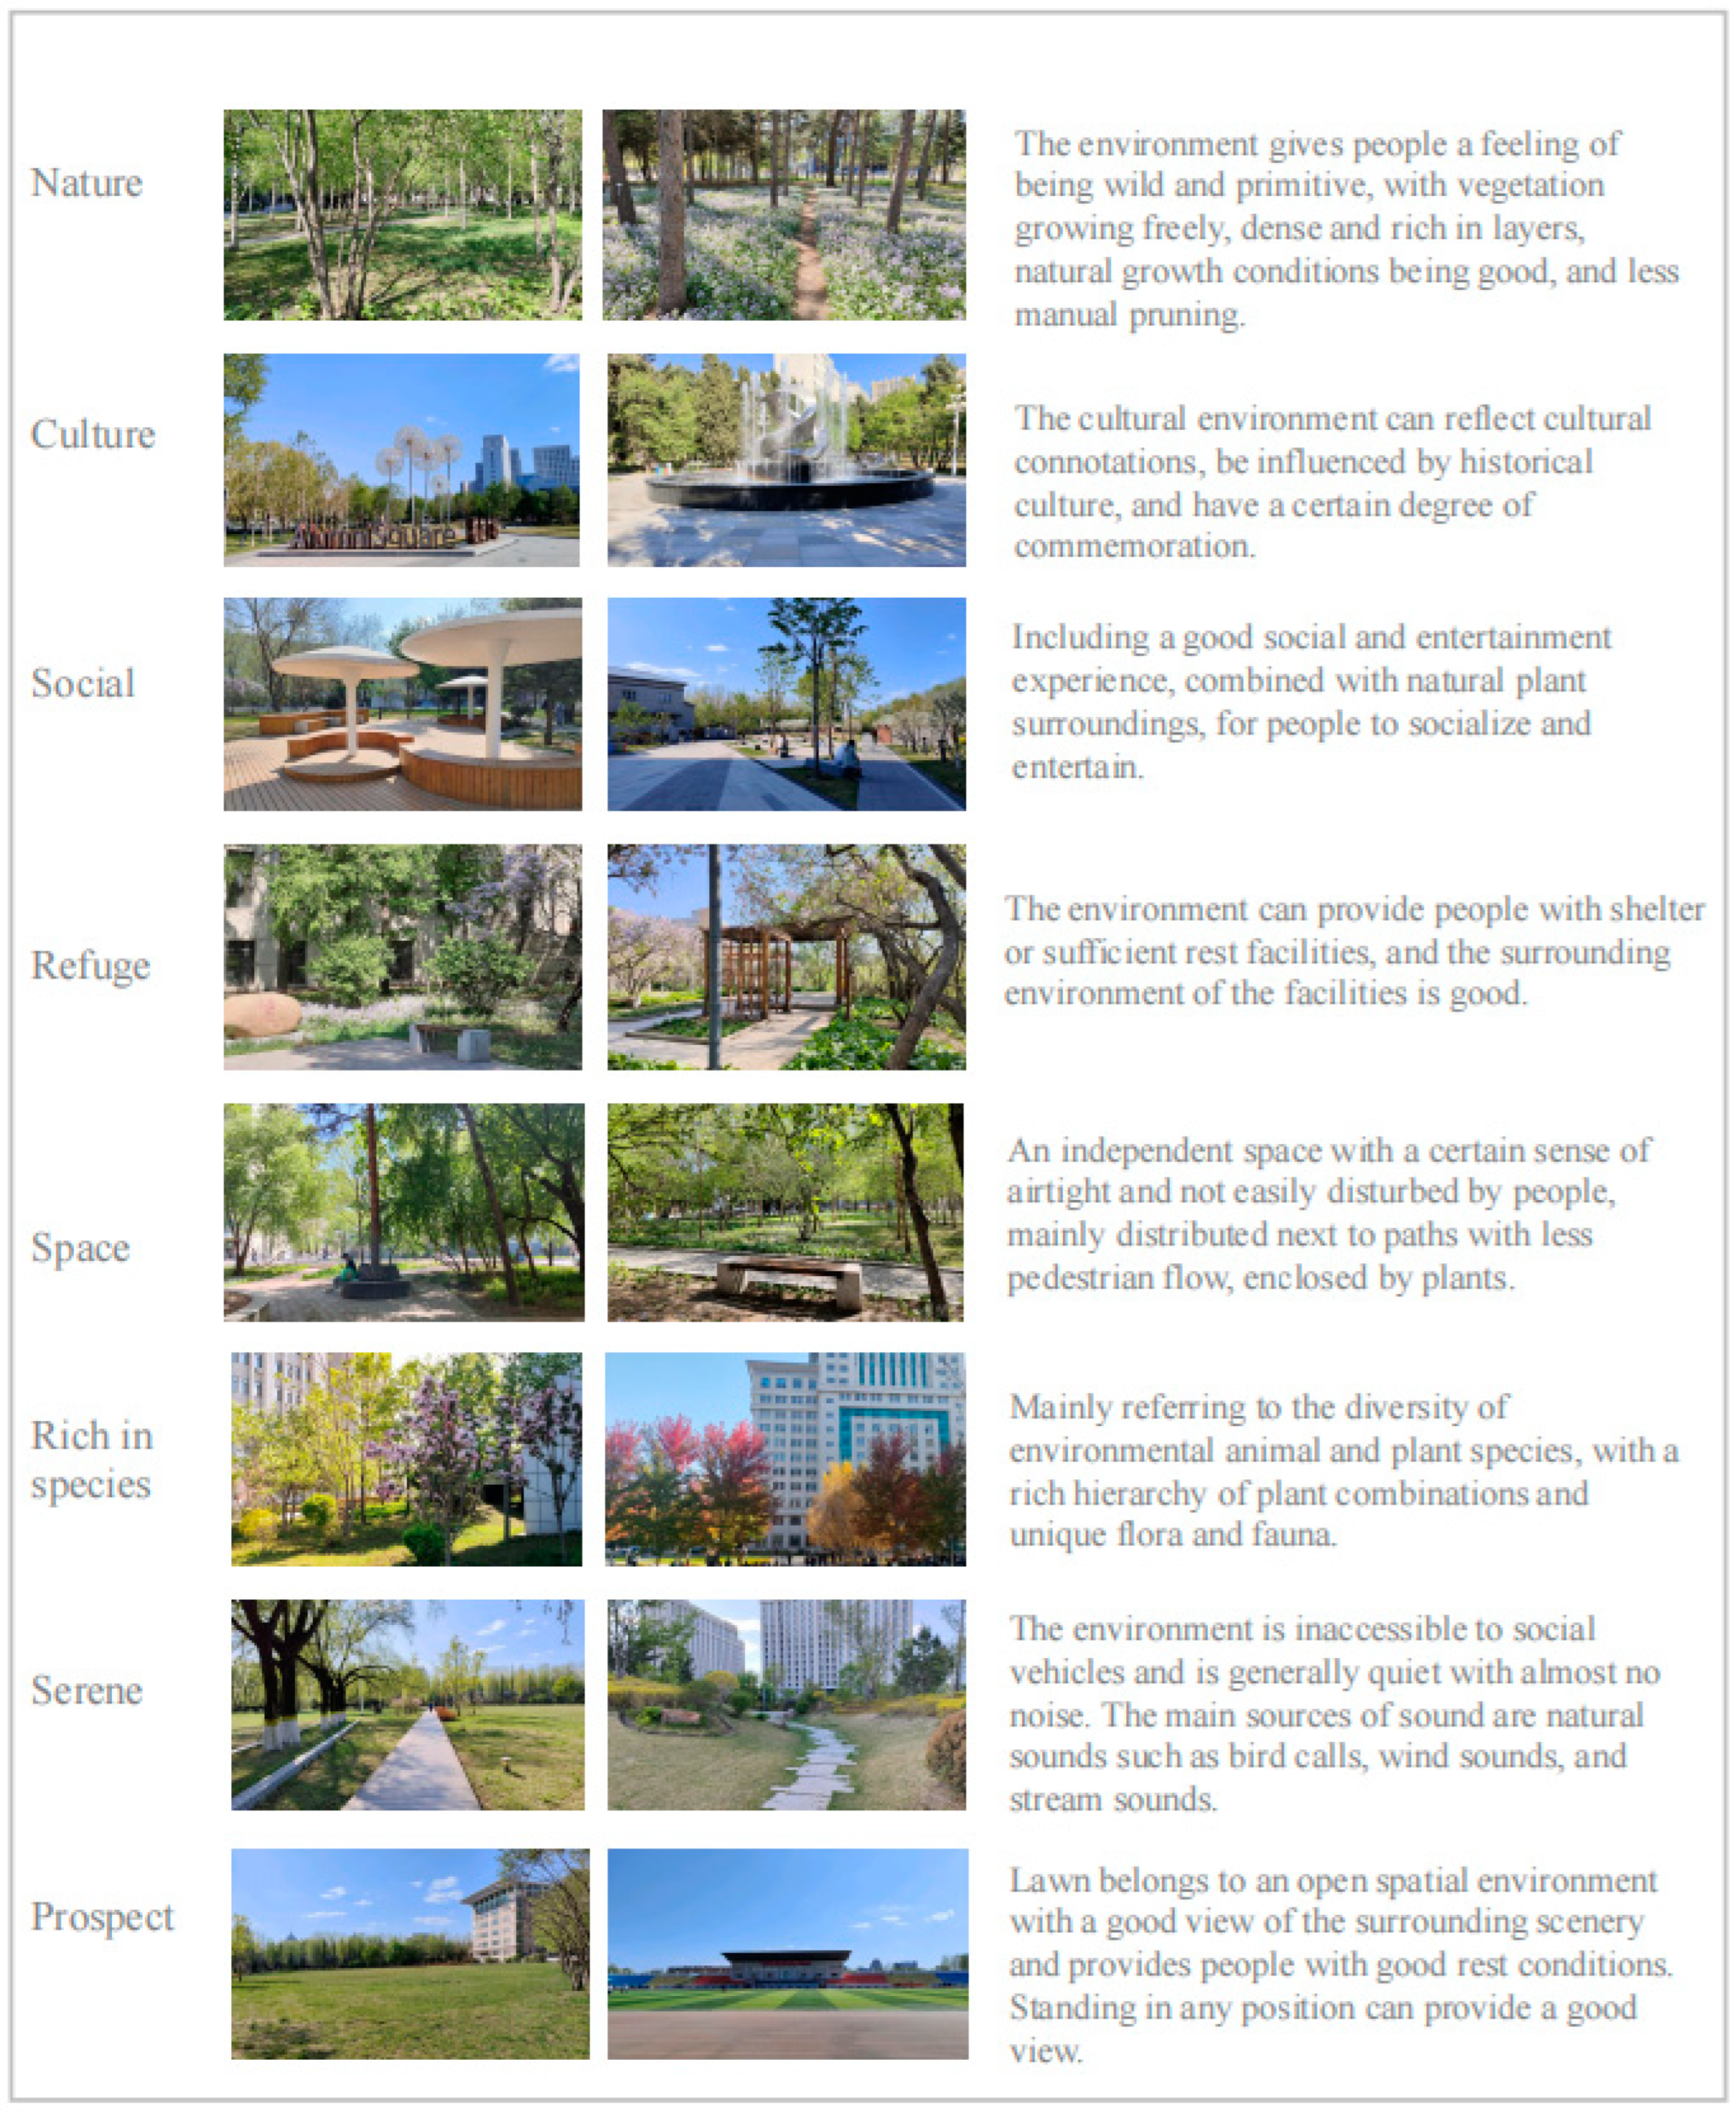
1.2. Conceptualization and Measurement Dimensions of Sensory Perception

Perception has been described as the process of gaining awareness and understanding of sensory information (Bell, 1999). The brain interprets information from all our senses, as well as our memories of earlier events, allowing us to have a full experience and understanding of our environment [25]. Landscape perception is the result of a perception–action process that includes a combination of movements, stimuli, and all the sensory systems throughout the body. Research has shown that perception is the experience of emotional changes in one’s surroundings and that different people can experience different sensations in a fixed environment, often interpreted as “memorable personal feelings” or “states of mind and body”. Urban green spaces have the value of creating subtle perceptions and transforming them from spatial to spiritual [26]. Nowadays, most research results tend to agree that different people feel differently when they are in the same environment. When exploring the correlation between environmental characteristics and mental health regarding urban green spaces, environmental perception must involve all our sensory behaviors. By evaluating and identifying environments from the point of view of people’s perceptions, it is possible to discover many characteristics that are not recognizable using objective evaluations [27,28].
Over the last 30 years, scales have been developed to categorize natural features. Kaplan developed these dimensions and applied them primarily to determine the public’s preference for green spaces, suggesting that green spaces can promote recovery from mental fatigue [29]. In his study, Nukarinen, Tused five dimensions including natural, cultural, social, spatial, and tranquility to assess woodlands, while Stessens P et al. introduced the visionary dimension [30,31]. Some of these dimensions have been used in related studies, for example, to assess the quality of park preferences, and have proved to be a successful method for analyzing urban parks [32].
The latest version of the Perception of the Environment Scale (PSD) was developed by researchers at the Swedish University of Agricultural Sciences. It was designed to create a classification system based on the cognitive experiences of nearly 1000 randomly selected individuals who reported their preferences from a long list of natural qualities. Factor analyses of all variables in the list were then conducted, and eight dimensions of environmental perception were identified [33]:
Serene: an undisturbed atmosphere of tranquility and peace, free from distractions.
Nature: people are in a place as if they are in nature, plants are free to grow, and there are some natural paths.
Rich in species: an abundance and variety of animal and plant life.
Space: a space that can be used for people to move around, created by plants and described as a small area with space.
Prospect: a wide view, allowing people to look out over a distance.
Refuge: a relatively secure, private, and enclosed space. It is a space where people can watch others relax and enjoy themselves, or where they can perform activities themselves.
Social: socializing in a green space, e.g., gathering for a meal.

1.3. Sensory Perception and Perceptual Recovery

Kaplan proposed the attention restoration theory (ART), and refinement proposes four qualities of restorative knowing: distance, extension, glamour, and compatibility [33]. Perceptual restoration is the restorative effect that occurs after a person interacts with a space, so more and more studies have also explored whether a green environment is a restorative environment based on ART, deriving the effects of different types of green spaces as well as different landscape factors on the restorative effects on people and their mental health [34,35]. In order to measure the extent to which the environment affects people’s restorative properties, many scholars have developed different scales based on ART [29].
Recent research has begun to delve into the impact of the environment on intrinsic human motivation. For example, studies by Marselle et al. and Hipp et al. focused on the mediating role of perceived restorability to explain the strong link between perceived naturalness, biodiversity, individual emotional well-being, and quality of life. These studies demonstrate the significance of environmental elements in shaping human psychological states and life experiences, providing robust support for a deeper understanding of the complex relationship between the environment and individual intrinsic motivation [2,36]. Many similar research studies have also highlighted the important role of green space as a mediating variable in maintaining human physical and mental health. These findings further emphasize the close relationship between environmental perception and individual mental health, providing strong empirical support for our in-depth understanding of this field. It has also been shown that there is a relationship between PSD in natural environments and human health, with perceptual restoration playing a mediating role between PSD and the recovery experience [35,37].
There is a relationship between the sensory perception of natural environments and human health: people perceive green space in certain dimensions, individuals want to experience these characteristics firsthand for intrinsic satisfaction, green space traits may stimulate and reinforce inherent intrinsic motivation, and some of these dimensions lead to better restorative experiences [38]. The aim is to identify and describe the nature of perceptual dimensions and determine which dimensions people generally prefer; to explore whether the ability to be alone and perceptual restoration have an impact on an individual’s mental health through the natural environment; and, accordingly, to investigate whether the ability to be alone and perceptual restoration have an impact on the restorative effects of green environments.
Therefore, this study aims to examine the effects of green space on mental health on university campuses through the perceptual–sensory dimension and focuses on the mediating roles of solitude ability and perceptual restorativeness. In the next phase of our major research, we focus on exploring the multiple relationships between recovery experience, perceptual recovery, PSD, and potential mediating variables. This helps us build a conceptual model that provides a theoretical framework for our upcoming empirical hypothesis testing. We then describe the methodology of this study in detail, with a focus on three main aspects: measurement modeling, structural modeling, and mediation effects. Finally, we integrate the findings with our hypotheses, the existing literature, and discussions on green space and mental health, along with broader psychosocial interventions. We also consider connections to relevant landscape design, aiming to provide a deeper understanding of the impact of green space on mental health. Our research mainly addresses the following research questions:
  • Is the association between sensory perception and psychological restoration experience in green spaces positive?
  • Does college students’ ability to be alone affect their mental health recovery in campus green spaces?
  • Does the perceptual recovery of college students affect the mental health recovery in campus green space?

2. Materials and Methods

Research has shown a relationship between sensory perception of the natural environment and human mental health. However, most studies have examined the relationship between natural environments and mental health from the perspective of physical space, and few studies have examined which dimensions of green space are popular with students from the perspective of their intrinsic motivation. Moreover, most studies have focused on gathering and interaction spaces, and few studies have examined students’ need for space for reflection or meditation from the perspective of students’ need for solitude in group life.
In this study, a survey and an analysis of university campuses are used to propose and screen the restorative elements of restorative spaces in university campuses. A field questionnaire survey is used to collect the solitude behaviors of college students with different solitude abilities in different places, and a correlation analysis of the above results is carried out to explore the correlation between solitude abilities and restorative evaluation. In the end, the restorative aspects of different functional spaces under the element of students’ preference for solitude are summarized to create a better campus with restorative effects. Taking the theory of positive preference for solitude on university campuses as an entry point and the spiritual function of space as a guideline, we explore the influence and effect of the spatial environment on university campuses on students’ mental health and spiritual activities and seek new ways to improve human cognitive ability and thinking and creative ability.
Our hypothesis is that human perceptual sensory dimensions are positively related to restorative experiences and that perceptual recovery is partially mediated by the ability to be alone. Therefore, a questionnaire was administered to students on the campus of Northeast Forestry University, which consisted of five sections: personal information collection and the Solitude Recovery Scale, Perceptual Recovery Scale, Sensory Perception Dimensions Scale, and Restorative Outcome Scale.
For data analysis, the direct and mediating effects were tested using the nonparametric percentile method of bias correction for structural equation modeling (Bootstrapping) using SPSS 25.0, PROCESS V 3.5, and AMOS 24.0.

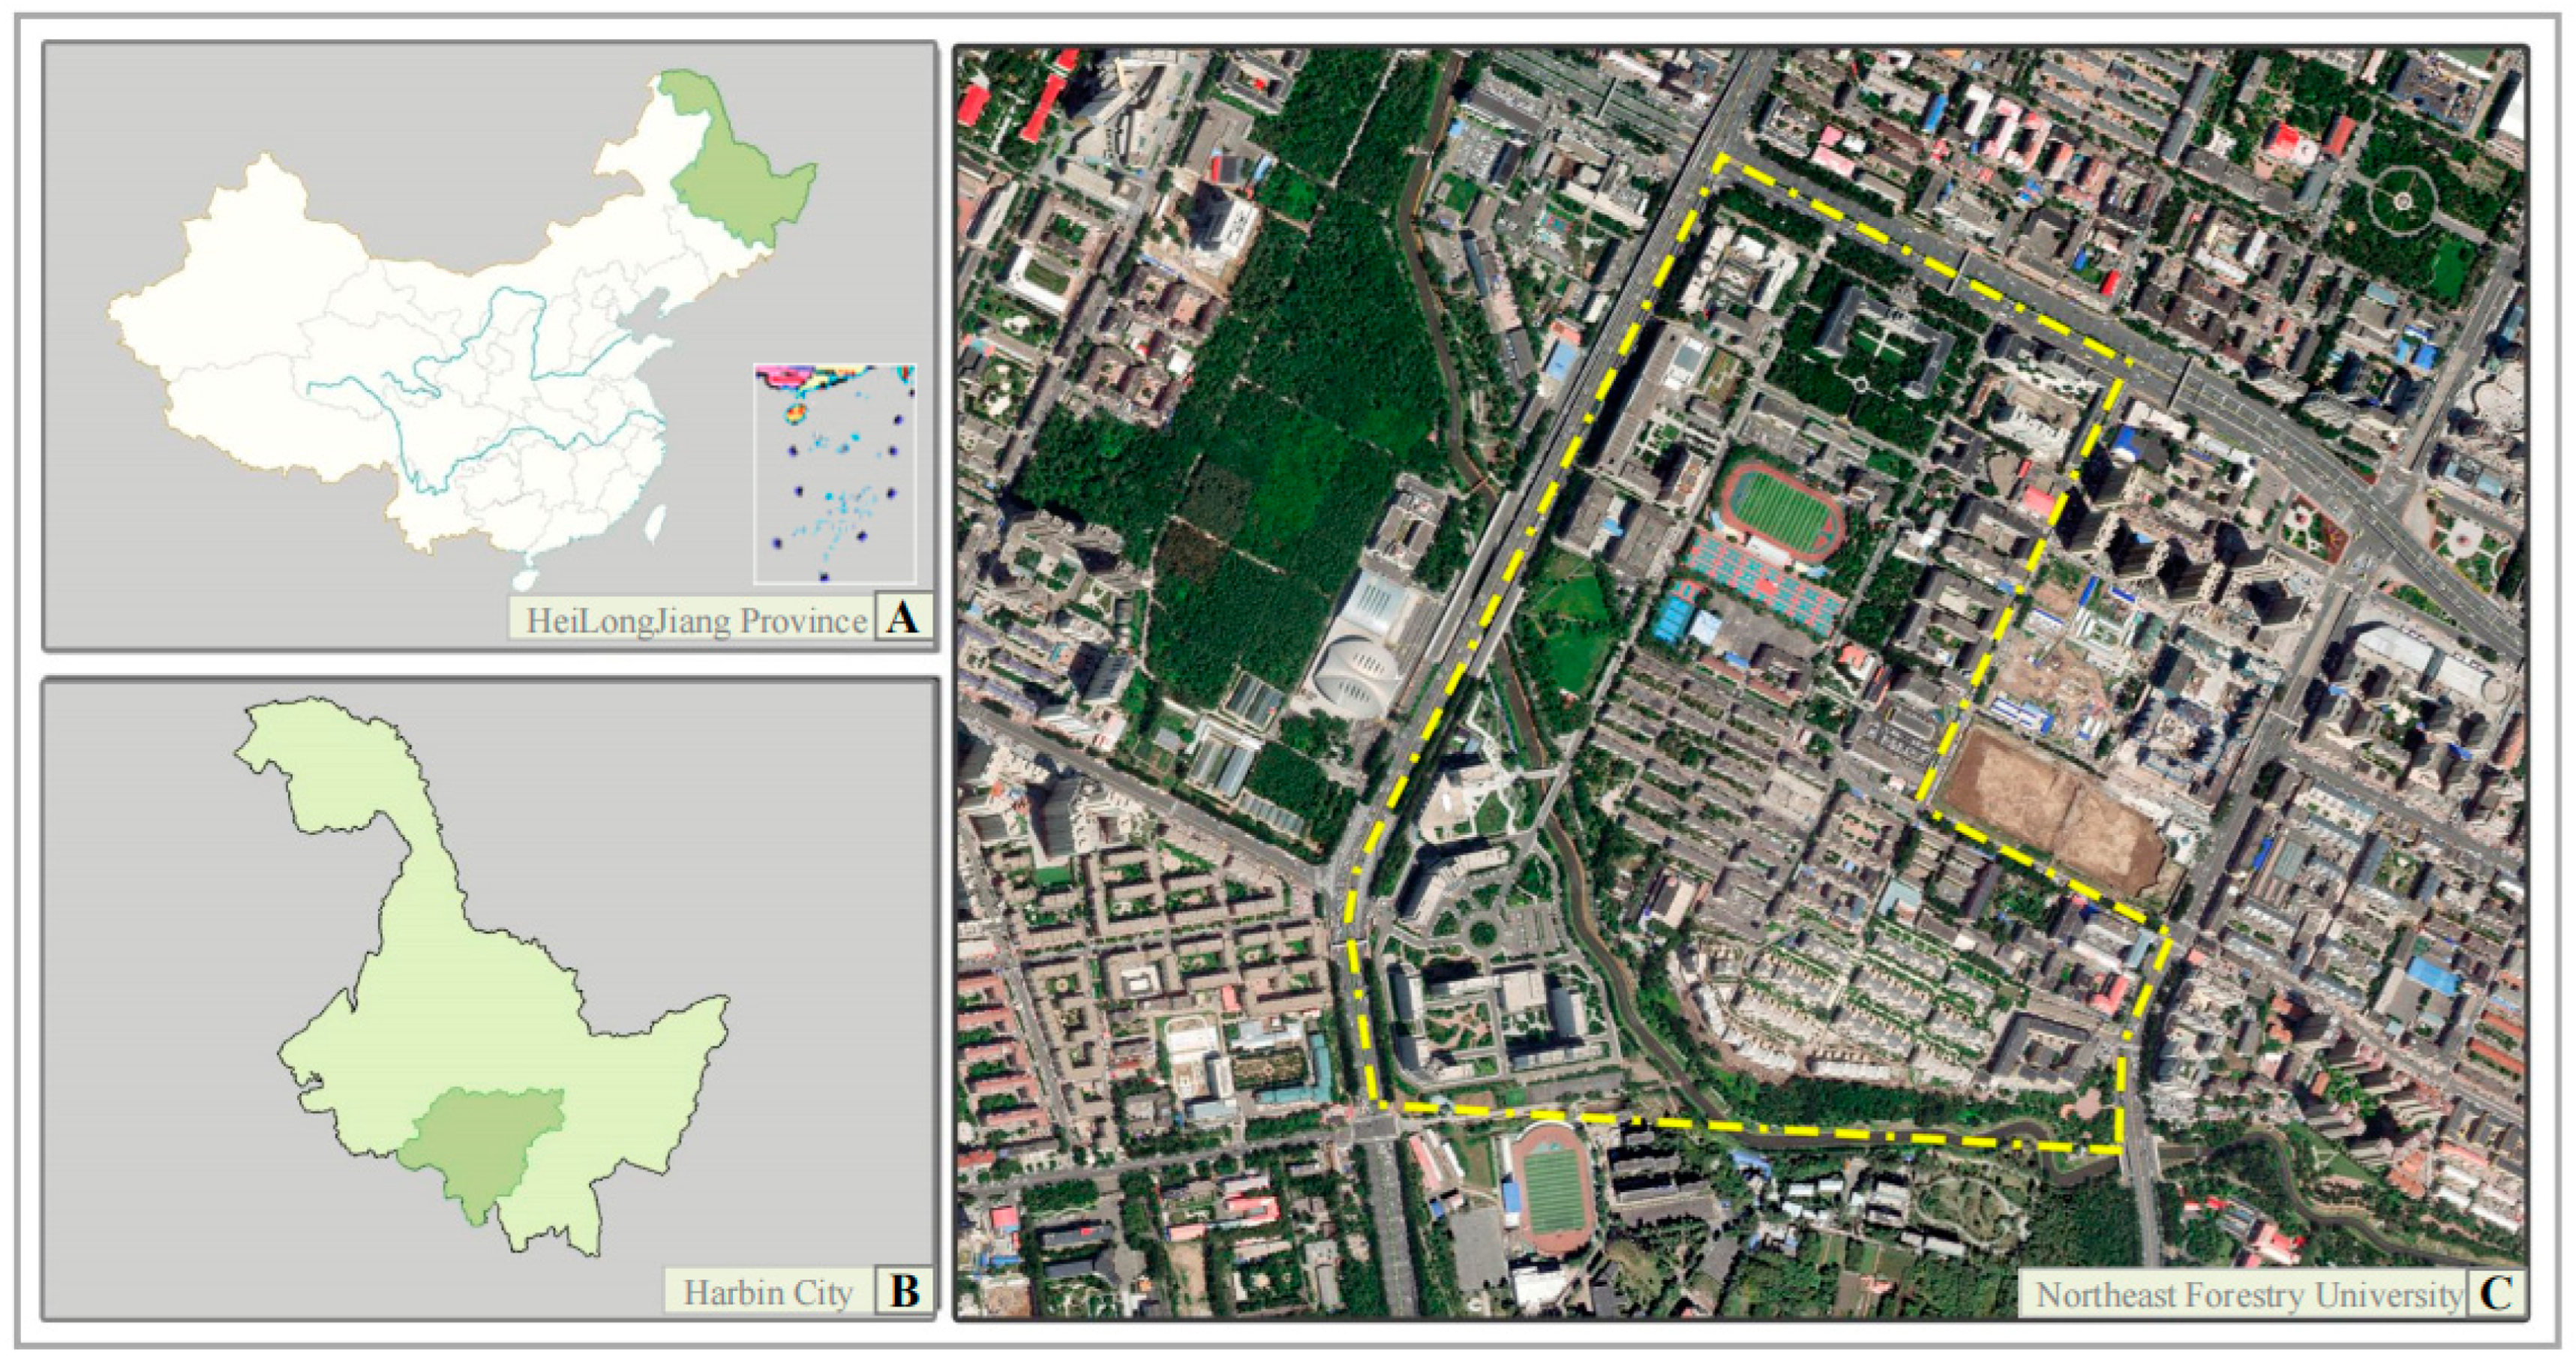
2.1. Description of the Study Site and Landscape

Northeast Forestry University is located in the northwestern part of Xiangfang District, Harbin City, Heilongjiang Province, China. The campus of Northeast Forestry University covers an area of “63 hectares”, of which the student living area is “14 hectares”, the family dormitory area is “19 hectares”, and the teaching and research area is “35 hectares”. The campus of Northeast Forestry University, on the north side of WuXing Road, and the campus of the banking school are almost green-free and have a small flow of people and activities. The experimental forest area is planted in a pure forest mode, and the main campus has a large flow of people and rich plant species in the green space compared with other areas. The main campus has a large flow of people compared with other areas and a rich variety of plants in the space, so this paper selects it as the object of study, and the scope of this study is shown in the Figure 1 and Table 1 below.
During the course of this study, a sample of different green space locations within the campus was selected for questionnaire surveys and was categorized into eight categories based on descriptions of the sensory perception dimensions: natural, cultural, social, sanctuary, spatial, species-rich, tranquility, and overlook. The detailed descriptions are shown in Figure 2.

2.2. Study Population and Data Collection

Studies have shown a relationship between the sensory perception of natural environments and human health, including research on campus green spaces and college students’ mental health [12,40]. Our hypothesis is that people perceive green spaces in certain dimensions, some of which are more important and preferred than others for reducing stress. The aims were to determine which dimension is preferred by students from the sensory perception dimensions, as well as to evaluate the restorative experience of different environments and to investigate whether high or low levels of an individual’s ability to be alone mediate restorative perceptions.
General data were obtained from an electronic questionnaire survey of university students at Northeast Forestry University, who selected and answered questions about different green spaces on campus.
Survey instrument: The Questionnaire Star platform is an electronic questionnaire distribution platform. As Questionnaire Star is an open questionnaire platform, the participating students were asked to answer specific questions related to the Individual Situation Questionnaire, the choice of solitary environment on campus, the Solitary Capability Scale, the assessment of campus green space in sensory perception as well as perceptual restoration dimensions, and restorative experience. In the end, 550 students participated in the survey, and after removing the questionnaires of those who chose not to visit campus green spaces on a regular basis, the validity rate of the recovered questionnaires was 91%, resulting in a final sample of 503 valid samples. In addition, each college student participant voluntarily completed the questionnaire. The survey included the Individual Profile Questionnaire, the Ability to Live Alone Scale, the Sensory Perception Dimension Scale, and the Perceptual Recovery Scale.
The following subset of questions was used in this study: The Ability to be Alone Scale (ABA), developed by Larson, assesses an individual’s capability to be alone and comprises two subscales: the Solitary Coping Scale (SCS) and The Ability to be Alone Scale, each consisting of 10 questions [41,42]. The Ability to be Alone Scale (AAS) examines how individuals use solitude as a means to cope with stress while also gauging their comfort level with being alone. A 5-point Likert scale was used, where 1 indicates “not at all” and 5 indicates “completely”. Higher scores denote a greater ability to be alone, as shown in Table 2.
The Perceptual Recovery Scale is adapted from the scale originally developed by Hartig et al. The version utilized in this study was translated and validated by Xinxin Wang et al. Table 3 presents items rated on a Likert scale ranging from 1 to 7, encompassing four dimensions: distance, charisma, consistency, and compatibility, with a total of 22 items [43,44].
As shown in Table 4, the Sensory Perception Dimensions Scale consists of 33 questions divided into eight dimensions: nature, culture, outlook, society, shelter, space, species richness, and tranquility. Much of the scale is derived from the scale developed by Grahn and Stigsdotter et al. and is based on a 5-point Likert scale [39].
The Restoration Outcome Scale (ROS-6 items) was used to measure restoration experiences, as was performed in a previous study of perceived restoration outcomes during visits to green environments [45,46]. As shown in Table 5, this scale subjectively measures the psychological restoration of college students after entering a campus green space in terms of restoration of “direct attention restoration”, “removal of distracting thoughts”, and “relaxation and calmness”. The scale measures the psychological recovery of college students after entering the campus green space. The scale ranges from “not at all” to “completely” on a scale of 1 to 7.

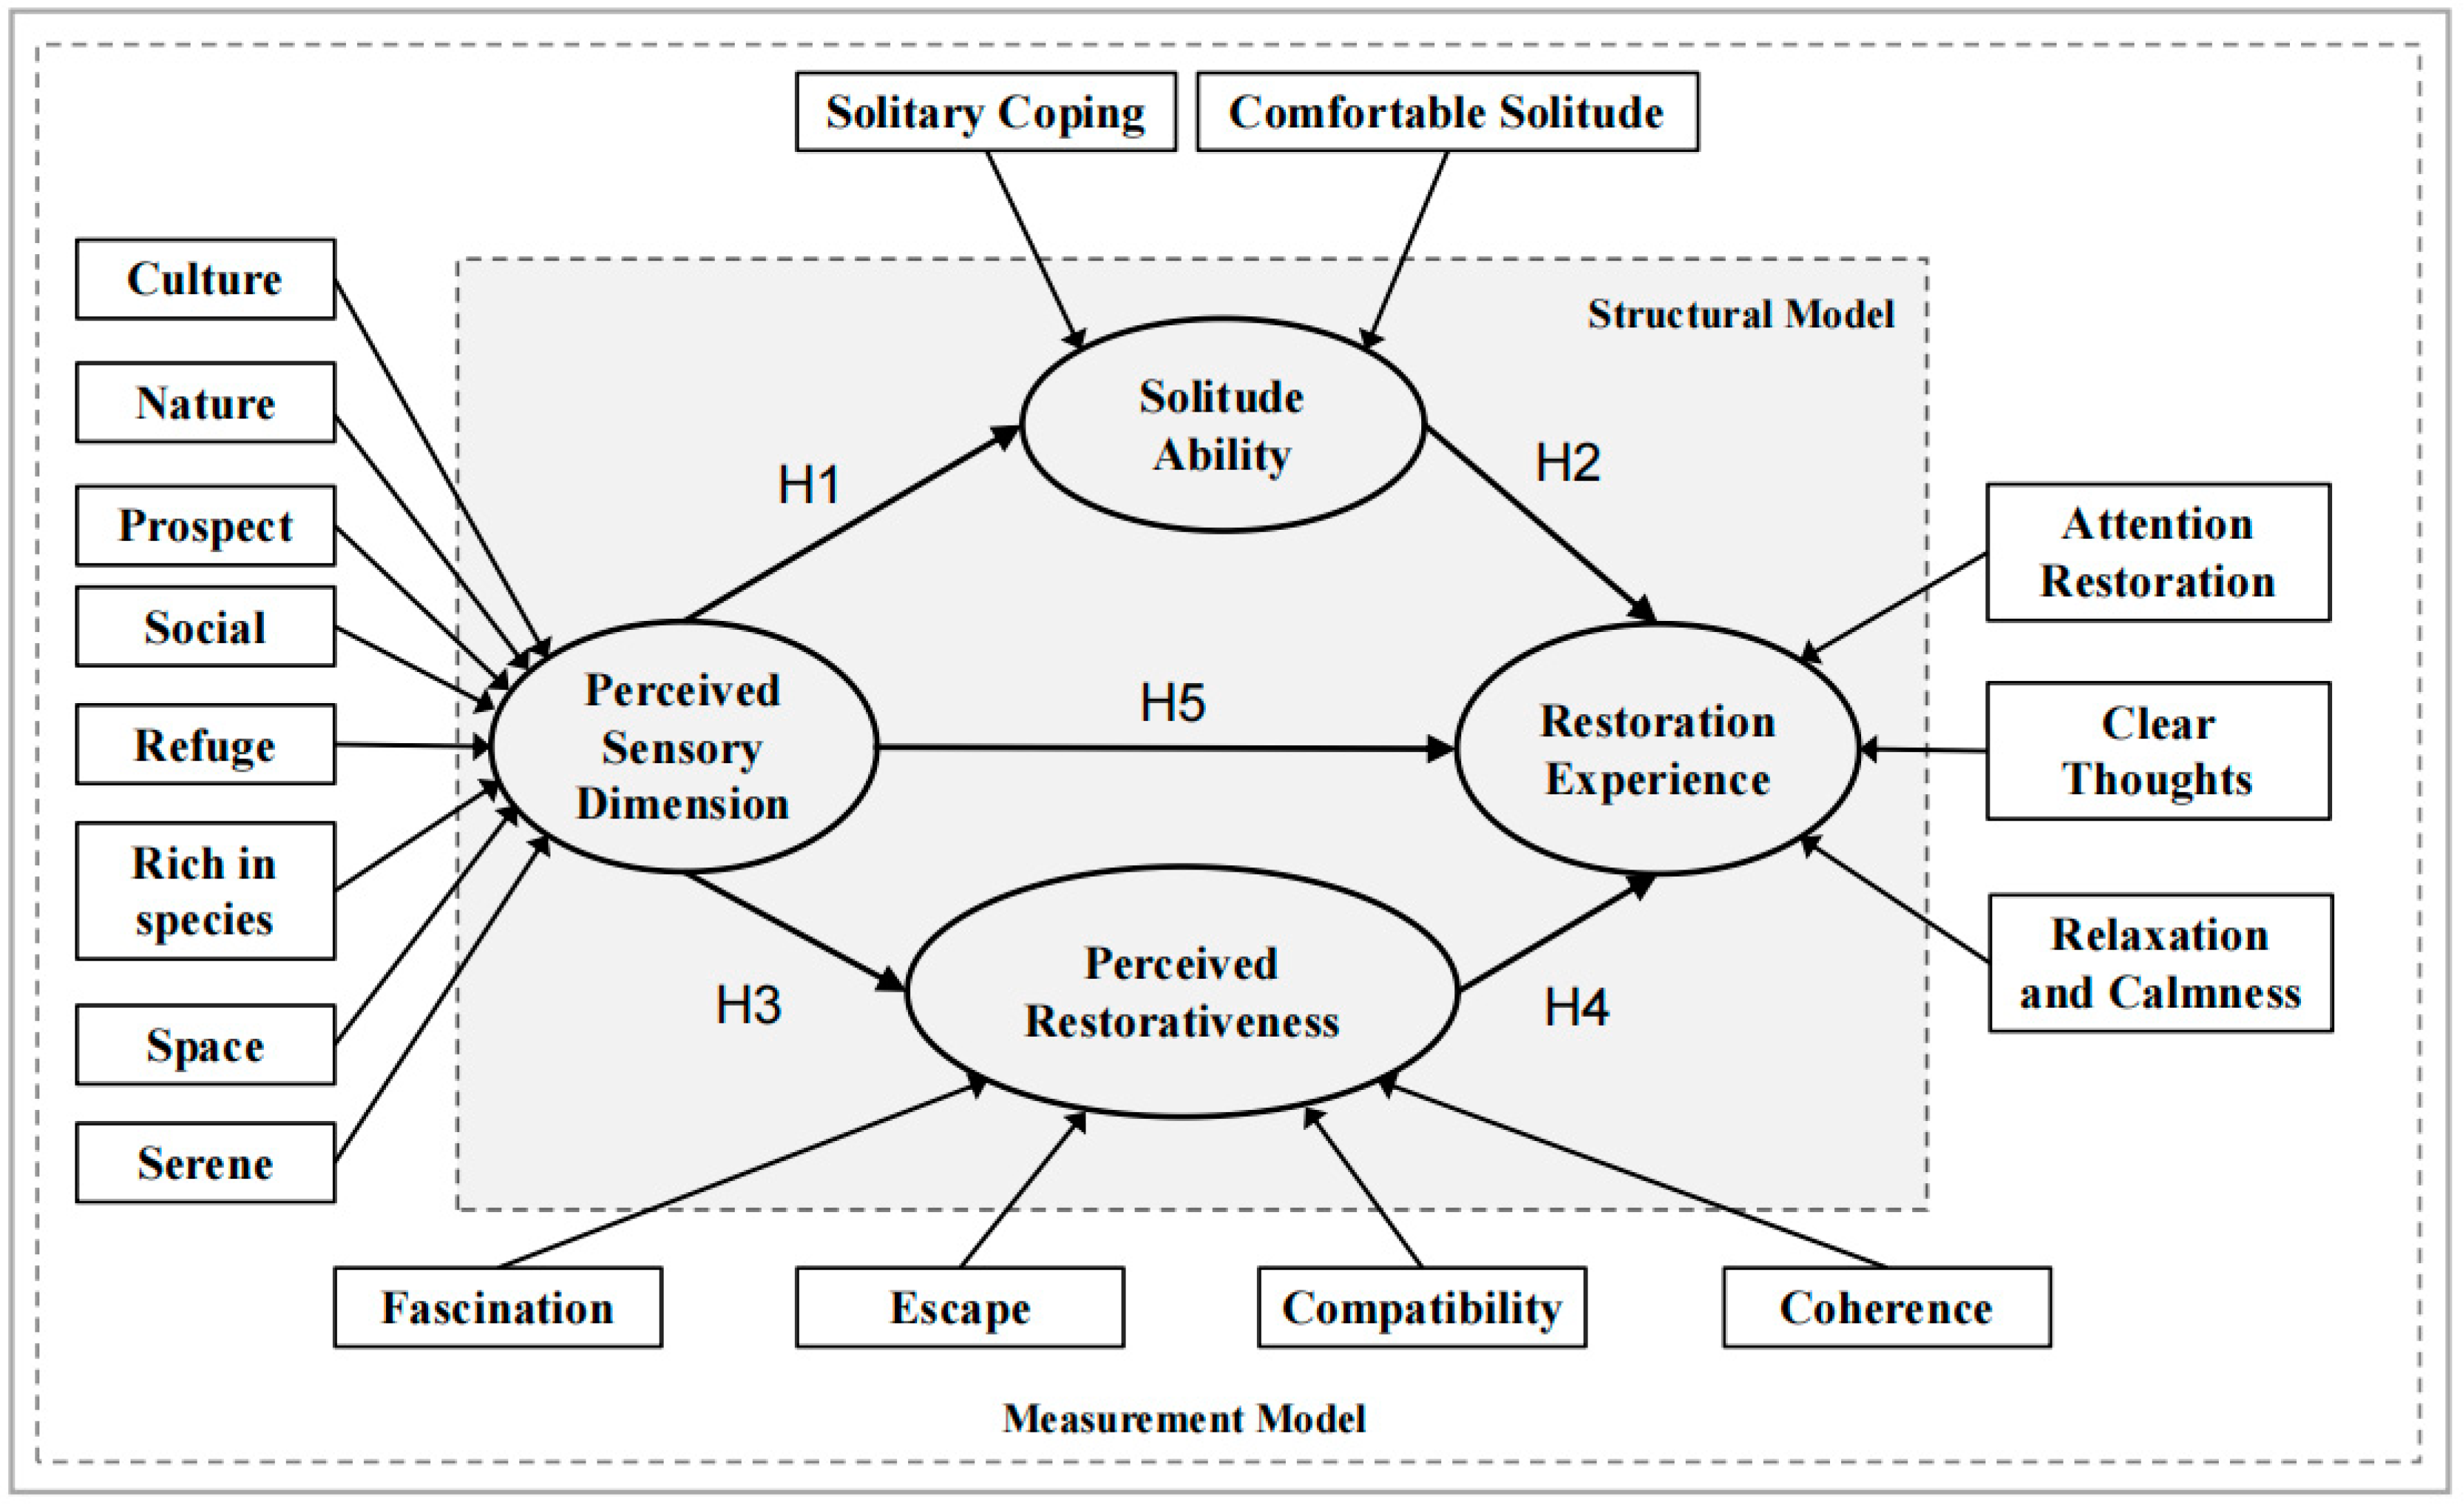
2.3. Statistical Analysis of Hypothetical Models

Currently, most studies on campus green space focus on spatial characteristics or students’ visiting behaviors, with limited attention to their intrinsic motivation. This study, however, analyses the intrinsic mechanism in-depth and concludes that there is a relationship between college students’ perceptual recovery and ability to be alone and the restorative experience of green space, for which the hypothesis shown in Figure 3 is proposed.
The pathway model includes two key elements: the structural model, which outlines the hypothesized relationships derived from underlying theories, and the measurement model. The structural model contains the hypothesized relationships between constructs developed from the underlying theories and concepts. As the name suggests, the measurement model contains the metric variables or metrics. The conceptual framework in Figure 3 is built on the aforementioned assumptions. The structural model contains hypothesized relationships developed from existing past theories and research, while the measurement model contains specific measurement variables and indicators.
As shown in the framework in the figure, this study proposes five sets of hypotheses based on the above analyses:
H1. 
PSD has a positive effect on college students’ ability to be alone;
H2. 
College students’ ability to be alone has a positive effect on restorative experiences;
H3. 
PSD has a positive effect on perceptual recovery;
H4. 
Perceptual recovery has a positive effect on college students’ restorative experience;
H5. 
PSD has a positive effect on college students’ restorative experience.

2.4. Reliability Analysis

In this study, the main factors were assessed using a scale, making it crucial to evaluate the quality of the measured outcomes. Initially, we conducted reliability tests using Cronbach’s coefficient to analyze the internal consistency in each dimension. The Cronbach coefficient value ranges from 0 to 1, with higher values indicating greater reliability. Generally, a reliability coefficient of 0.6 or higher is considered reliable, demonstrating a high level of consistency in the measurement tool’s assessment of the corresponding dimension. This step is crucial in ensuring that the scale we used exhibits good reliability and stability. In the current analysis, the reliability coefficients for the Ability to be Alone Scale, Perceptual Recovery Scale, Sensory Perception Scale, and Recovery Outcome Scale, as well as each of the secondary dimensions shown in the reliability analysis table, all fall within the range of 0.8 to 1. This indicates that all the scales used in this study exhibit strong internal consistency and high reliability.

2.5. Validity Analysis

According to the model fit test results in Table 6, it is evident that the values of solitude ability (CMIN/DF = 2.069), perceptual recovery (CMIN/DF = 2.397), and sensory perception (CMIN/DF = 2.782) all fell within the ideal range, specifically between 1 and 3. Additionally, the RMSEA values were below 0.08, at 0.046, 0.053, and 0.060, respectively, indicating an excellent fit. The other test indicators such as IFT/TLI and TLI also achieved high levels of 0.9 or higher, respectively. Therefore, the comprehensive analysis results unequivocally demonstrate that the CFA models of the Solitude Ability Scale, Perceptual Recovery Scale, and Perceptual Sensory Scale fit well, affirming the reliability and validity of these scales in the current study.
From the analysis results in Table 7, it is evident that in the effectiveness tests of the Solitude Ability Scale, Perceptual Recovery Scale, and Perceptual Sensory Scale, the AVE value of each dimension exceeds 0.5, while the CR value exceeds 0.7. These data indicate that all dimensions exhibit good convergence validity and comprehensive reliability. Given that the CFA model for the Solitude Ability Scale, Perceptual Sensory Scale, and Perceptual Recovery Scale fit well, we further assessed the convergence validity (AVE) and comprehensive reliability (CR) of each scale dimension. The testing procedure used the established CFA model to calculate the loading factor of each measurement item in the corresponding dimension. Subsequently, the values of convergence validity and comprehensive reliability for each dimension were computed using the AVE and CR formulas. According to the standard, the minimum AVE value should be 0.5 or higher, and the minimum CR value should be 0.7 or higher, to ensure good convergence validity and overall reliability across all dimensions.
According to the results of the analysis in Table 8, Table 9 and Table 10, it can be seen that the standardized correlation coefficients between the two variables of each dimension in this test of differential validity are less than the square root of the AVE value corresponding to the dimension. This indicates that there is good differentiated validity between the dimensions.

3. Results

The survey data were imported into statistical software, including SPSS 25.0 and AMOS 24.0, for reliability and validity analysis. Cronbach’s α for the total scale and the α coefficients for each latent variable were obtained to study the relationships between the latent variables and observed variables, while also verifying that the measured variables exhibit high convergent validity. To validate the proposed conceptual model, this paper used structural equation modeling (SEM) for analysis. SEM can simultaneously handle latent and observed variables and analyze complex relationships between multiple variables. The analysis was conducted using the AMOS software method to obtain the final parameter estimates of the model, including the standardized path coefficients. Direct and indirect effects were tested using SPSS 25.0 and PROCESS V 3.5.

3.1. Descriptive Statistics

Participant inclusion and exclusion criteria: Questionnaire data were collected randomly from green space visitors on campus. A total of 550 students participated in this study. In the data screening procedure, students who selected “Yes”, students who answered the question “never visit green space”, and students who answered the question with a suspicious pattern (n = 47) were excluded. In total, 503 responses were obtained for analysis. The response rate was 91%. The characteristics of the study population included in the analysis (N = 503) are presented in Table 11. This table provides descriptive statistics for the college students who visited campus green spaces in the past week, along with individual information about students who, due to limited personal space in a group living environment, opted to be alone in an outdoor setting that suited them.
Table 11 shows that 50.89 percent of the sample chose “male”. The proportion of women was 49.11 percent. In terms of place of domicile, the highest percentage of respondents was 63.62 percent for “urban”. Overall, 36.38 percent of the respondents were from rural areas. The proportion of only children was 66.00 percent. The remaining 34.00 percent of the sample was “No”. In terms of the distribution of student groups, the majority of the samples were “undergraduate” with a percentage of 58.25 percent. In total, 36.58 percent of the samples reported visiting green spaces “4–6 times a week”. Another 35.59 percent of the samples reported visiting “1–3 times per week”. The proportion of the sample choosing “yes” was 67.20 percent. An additional 32.80 percent of the sample chose “no”. For the question, which space would you choose to be alone on campus?, the highest preference, amounting to 74 students (14.71 percent), was for shelter in the Perceived Sensory Dimension and the lowest preference was for space (10.54 percent).

3.2. Regression Analysis

3.2.1. Correlation Analysis

In order to explore whether there is a significant correlation between the ability to be alone, sensory perception, and perceptual recovery, a Pearson correlation analysis was performed using SPSS. The mean value of each dimension was calculated by summing up the corresponding question items of each dimension of the three scales. As shown in Table 12, in this analysis, the correlation between each variable was analyzed with a Pearson correlation analysis for exploratory purposes. According to the results of the analysis, it can be seen that there is a significant correlation between each variable, and all of them are significant at the 99% level of confidence. Based on the results of the correlation coefficients, the correlation coefficients (r) between the variables are all greater than 0. This suggests that in this analysis, there is a significant positive correlation between the variables.
Upon examining the results of the correlation analyses, it becomes evident that the mean values of the two dimensions related to the ability to be alone, as well as the eight dimensions concerning sensory perception, and the four dimensions pertaining to restorative experiences, exhibit significant correlations. Most of the correlation coefficients fall within the range of 0.3 to 0.5. Overall, these findings align with our initial hypotheses, suggesting avenues for further investigation.
While the correlation analysis of the ability to be alone, PSD, and PRS revealed significant associations, it is crucial to note that causality cannot be inferred from these results alone. To delve deeper into the causal mechanisms between the ability to be alone, perceptual recovery, and sensory perception, additional analyses such as multiple regression and mediation effect analyses are warranted. This aims to not only ascertain the strength of the relationship between PSD, PRS, and restorative experiences but also to specifically evaluate whether the ability to be alone and PRS mediate the relationship between PSD and restorative experiences. Given the extensive elements encompassed in the Ability to be Alone, Perceptual Recovery, Sensory Perception, and Restoration Outcome Scales, a streamlined analytical approach was used by aggregating these elements. This allowed for a focused exploration of the mediating effects among the four variables.

3.2.2. Regression Analysis

As shown in Table 13, linear regression analyses were conducted using the ability to be alone, perceptual recovery, and sensory perception as independent variables, and recovery outcome as the dependent variable. The model was formulated as ROS = 0.660 + 0.251 ∗ Ability to be alone + 0.210 ∗ PRS + 0.574 ∗ PSD, resulting in an R2 of 0.438, indicating good interpretability.
Multicollinearity testing revealed that all VIF values were below 5, indicating no issues of covariance. The Durbin–Watson statistic (D-W) was around 2, suggesting no autocorrelation in the model. Moreover, the F-test for the model yielded a significant result (F = 129.518, p = 0.000 < 0.05), indicating that at least one of the variables—ability to be alone, perceptual recovery, or sensory perception—significantly influences the recovery results.
Upon specific examination, the regression coefficient for the ability to be alone was 0.251 (t = 3.643, p = 0.000 < 0.01), signifying a significant positive influence on recovery outcome. Similarly, the regression coefficient for perceptual recovery, with a value of 0.210 (t = 3.360, p = 0.001 < 0.01), indicates a significant positive relationship with recovery outcome.
Furthermore, the regression coefficient for sensory perception, at 0.574 (t = 6.019, p = 0.000 < 0.01), suggests a significant positive impact on recovery outcome.
In summary, the analysis demonstrates that the ability to be alone, perceptual recovery, and sensory perception exert a significant positive effect on the recovery outcome.

3.3. Tests of the Mediating Effect of the Ability to Be Alone and Perceptual Recovery

3.3.1. SEM Model Fitness Test

Based on the results of the model fitness test in Table 14, it can be observed that CMIN/DF = 1.959, which falls within the acceptable range of 1–3. Additionally, the RMSEA value is 0.044, indicating an excellent fit (<0.05). The supplementary tests of IFI, TLI, and CFI all achieved an excellent level of 0.9 or higher. Therefore, the combined results of this analysis suggest that the SEM model of perceived sensory influences demonstrates a good fit.

3.3.2. SEM Model Path Relationship Assumption Results

The structural equation model in this study was examined for its goodness of fit. The subsequent step involved using the maximum likelihood method. Path coefficients were estimated, and a path test table was generated to verify the significance of the hypothesized path regression coefficients. The research hypotheses underwent evaluation for accuracy, and if found to be incorrect, they were subject to modification and correction. The structural equations were then incorporated into the path model based on the conceptual framework. Subsequently, the model was executed using AMOS 24.0, resulting in the determination of path coefficients and the compilation of the path test table presented in Table 15. The regression coefficients of the hypothesized paths were deemed significant when the absolute value of CR exceeded 1.96 and the p-value was less than 0.05.
To further probe into the impacts of perceived sensory dimensions on mental well-being and to verify the mediating roles of the “ability to be alone” and “perceptual restoration”, we used structural equation modeling via Amos 20.0. The model is shown in Figure 4 demonstrated favorable fit indices: CMIN/DF = 1.574, well within the 1–3 range, and RMSEA = 0.045, remarkably below the threshold of <0.05. Additionally, IFI, TLI, and CFI all exceeded 0.9, further affirming the model’s robust fit.
Notable significant paths emerged in our analysis. For instance, “consistency” ← “nature” (β = 0.163) and “solitude coping” ← “nature” (β = 0.216) demonstrated significance. Similarly, paths such as “solitude coping” ← “culture” (β = 0.14), “solitude comfort” ← “culture” (β = 0.188), and “glamour” ← “culture” (β = 0.219) were found to be significant.
However, certain paths, such as “solitude comfort” ← “serene” (β = 0.025, p = 0.571), did not reach significance in the tranquility dimension. Subsequently, these non-significant paths were omitted from the model, and an adjusted mediation model was recalculated.
Following the recalibration of the adjusted mediation model, the path coefficients for the models depicted in Figure 5 all exhibited statistical significance. The absolute fit index, CMIN/DF = 2.003, coupled with an RMSEA < 0.05 further attested to the model’s accuracy. The TLI (0.902), CFI (0.906), and IFI (0.907) all exceeded 0.90, signifying an exemplary model fit.
Our findings revealed that the “naturalness” dimension of sensory perception had no discernible impact on “solitary comfort”. Conversely, all other dimensions significantly influenced both facets of the “ability to be alone”. Additionally, the “ability to be alone” and “comfort” exhibited no significant influence on ROS, whereas the “ability to be alone” and “coping” significantly elevated an individual’s ROS. Furthermore, all four dimensions of perceptual restoration demonstrated a positive effect on ROS, although only the “serenity” dimension of sensory perception significantly influenced all four dimensions of perceptual restoration.

3.4. Analysis of Mediating Effects

Further analyses revealed a more complex relationship between perceived sensation and ROS. As shown in Table 16, parallel mediation effects were analyzed using PROCESS in SPSS. The mediating roles of perceptual recovery and the ability to be alone in the relationship between the perceived sensory and recovery outcome were analyzed under the conditions of Model 4. The regression analyses showed that PSD had a direct positive predictive effect on the ability to be alone (β = 0.840, p < 0.001) and recovery outcome (β = 0.574, p < 0.001). PSD also had a positive effect on PRS and the recovery outcome. Therefore, the hypothesized relationships between PSD and the ability to be alone (H1), between the ability to be alone and restorative experience (H2), between PSD and perceptual recovery (H3), between perceptual recovery and restorative experience (H4), and the total effect of PSD on restorative experience (H5) were all valid.
Parallel mediation effects were analyzed using PROCESS V3.5 in SPSS 25.0. The mediating roles of perceptual recovery and the ability to be alone in the relationship between sensory perception and recovery outcome were analyzed under the conditions of Model 4.
The regression analyses showed that PSD had a direct positive predictive effect on the ability to be alone (β = 0.840, p < 0.001) and recovery outcome (β = 0.574, p < 0.001). PSD also had a positive effect on PRS and the recovery outcome. This mediating effect explained 52.5% of the variance in solitude ability, 60.3% of the variance in PRS, and 43.4% of the variance in restoration experience.
There were four models involved in the mediated effects analysis, as follows: Restoration Outcome = 0.931 + 1.013 ∗ Sensory Perception, Solitude Ability = 0.449 + 0.840 ∗ Sensory Perception, Perceptual Restoration = 0.755 + 1.087 ∗ Sensory Perception, and Restoration Outcome = 0.660 + 0.574 ∗ Sensory Perception + 0.251 ∗ Solitude Ability + 0.210 ∗ Perceptual Restoration.
As shown in Table 17, the mediation effect was further examined using the bias-corrected pairwise non-parametric percentile Bootstrap method, which indicated that the mediation effect of sensory perception on recovery outcome was significant, with a mediation effect value of 0.211.
Specifically, the mediation effect was generated through two mediation chains. In the first chain, the indirect effect consisted of perceived sensory → ability to be alone → recovery outcome (β = 0.211, p < 0.05, CI [0.053, 0.213]), with Bootstrap 95% confidence intervals that did not include 0, suggesting a significant mediating effect of the ability to be alone. In the second chain, indirect effect 2 (β = 0.228, p < 0.05, CI [0.049, 0.231]) consisted of perceived sensory → perceptual recovery → recovery outcome, with Bootstrap 95% confidence intervals did not contain 0, indicating a significant mediating effect of perceptual recovery.
There is a direct positive effect of sensory perception on ROS, on the one hand, and an indirect positive effect on ROS through the ability to be alone and perceptual recovery on the other. This means that the higher the solitude ability and the higher the perceptual recovery, the better the individual’s recovery in the campus green space, and the more it can promote the individual’s emotional recovery and psychological health.

4. Discussion

4.1. Campus Green Space Has a Positive Effect on College Students’ Mental Health

The restorative nature of campus green spaces supports students’ psychological recovery and is associated with various environmental factors, consistent with previous research findings [14]. The quantification of various factors in the green space led to the identification of PSD environmental characteristics, perceived restorativeness, and the students’ ability to be alone, all of which contribute to the psychological recovery of college students in outdoor campus green spaces. This research also sheds light on potential environmental and intrinsic motivational factors influencing mental health recovery, providing valuable insights for the design of campus outdoor environments. This study’s results confirm that PSD correlates with restorative experiences. In the design and planning of mental health promotion in campus environments, perception is a key factor contributing to the restorative aspects. These findings offer new insights into the perception of campus quality and support previous research results regarding the perceived quality and restorative nature of campus environments [10]. However, it is not solely the environmental features themselves but rather the perceived environmental features by college students, and the degree of this perception, that enhance the restorative experiences of students in the environment. This contributes to the overall results of psychological recovery.
Nature (β = 0.238) and serene (β = 0.245) were positively correlated with psychological repair. The results showed that when individuals perceived nature and a peaceful environment, psychological repair levels significantly increased. This indicates that natural and tranquil environments play a positive role in the psychological recovery of college students. However, the path analysis indicated that the influence of culture, prospect, and social dimensions on psychological recovery is limited, suggesting a relatively weak direct impact of these three traits on college students’ psychological recovery. Finally, refuge (β = −0.273), space (β = −0.282), and rich in species (β = −0.384) were negatively correlated with psychological repair. According to the path analysis results, sheltered environments, limited spaces, and environments with high species richness may attenuate the psychological repair effect for college students. Cognitive scales of spatial perception, species richness, and sense of shelter influenced people’s landscape preferences, consistent with previous findings [47].
In summary, there are notable differences between various dimensions of environmental perception and the level of psychological repair. Nature and peaceful environments have a positive impact on mental health, while the influence of other traits appears to be relatively weaker. However, whether other variables come into play in this relationship requires further research and verification, providing a crucial direction for the design of campus green spaces.

4.2. Choice of Solitude Space in Relation to Perceived Sensation

According to the statistical results, college students predominantly choose sheltered and social characteristics when selecting a solitary space in the campus study area. Following this, the remaining dimensions, in descending order of preference, were culture, nature, species richness, serenity, and lastly, space. It is important to note that the dimensional area may also encompass multiple non-dominant dimensions, which can influence students’ perceptions to some extent. Sheltered and social spaces emerge as the most desired solitude spaces for college students, and solitude coping demonstrates a significant correlation with both. This indicates a positive correlation between college students’ perception and solitude coping. Of the two dimensions related to the ability to be alone, solitary coping showed a stronger correlation with perceived sensation and recovery outcome, suggesting that the individual student’s capacity and willingness to be alone play pivotal roles in the mechanism.
The natural dimension showed significant positive correlations with the congruence (β = 0.163) and solitary coping (β = 0.216) pathways, indicating that individuals are more likely to feel inner congruence in an environment with natural traits, and a natural environment is also more likely to provide an environment for students to deal with psychological pressure alone. This may be because the environment with natural characteristics provides a peaceful and quiet solitary environment, making it easier for individuals to focus their attention and experience the surrounding natural environment more deeply, enabling them to face inner pressure and problems more easily. There was a significant positive correlation between the tranquility dimension and perceptual recovery. In a tranquil environment, students were more likely to notice the charm of the environment and feel relaxed and serene. Resonating with surrounding individuals makes them more likely to feel inner consistency, and such an environment makes people feel more isolated from the world, so they can easily relax away from the noise there. In campus spaces, providing private solitude areas requires attention to their reasonable placement away from noise sources to minimize or isolate visual and auditory intrusions. This is one of the main ways to achieve the privacy of solitude spaces. When creating privacy, it is essential not only to avoid excessive exposure but also to consider the appropriate scale of the space. This helps prevent feelings of emptiness or confinement caused by excessive closure or improper spatial scale. Various methods can be used to enclose solitary spaces, including isolating water systems, using wall fences, and using natural vegetation as a visual barrier to obstruct others’ views and create a sense of seclusion.
Culture (β = 0.172), social (β = 0.209), and refuge (β = 0.172) were all positively correlated with the ability to be alone. A campus environment with cultural characteristics will affect the form of relaxation of students, and the cultural environment will make students more attractive. It may be that being in a specific cultural environment for a long time makes it easy for people to feel familiar and secure, thus improving the quality of people’s solitude and making people feel comfortable. The open landscape provides individuals with opportunities for relaxation, creating a harmonious psychological experience. In social environments that offer both social infrastructure and natural conditions, the ability of individuals to be alone is slightly enhanced, making them more likely to feel comfortable and pleased in such spaces. This feeling may stem from past social interactions with others. On the contrary, when individuals are alone in such spaces, they can still cope with stress and emotional issues while being attracted by the environment. This also provides students with an opportunity to escape from stress. In secluded or quiet environments, students’ compatibility with solitude improves. Secluded and quiet environments are suitable for individuals to handle emotions and stress alone. It also provides an opportunity for individuals to engage in self-emotional regulation and meditation in a quiet environment, allowing students to feel a sense of security in observing others without being scrutinized by others, providing an experience of harmonious resonance with the environment.
Both space and being rich in species significantly correlated positively with the two dimensions of solitude ability, indicating that in an open and species-rich environment, a rich natural environment provides an attractive space for people to think more actively, and an open space easily makes people feel enlightened. In such an environment, people can focus on self-thinking and adjustment, and it is easier to enhance the experience of solitude.
Offering students a comfortable space for self-awareness not only fulfills their need for privacy in the landscape but also addresses the ecological requirements of the environment. Campus grounds should be designed to create a healing environment characterized by spatial integrity, tranquility, and proximity to nature. Such an environment plays a crucial role in reducing students’ stress and promoting emotional recovery.

4.3. Mediating Effects of the Ability to Be Alone and PRS

The current study tested the hypothesis that PRS and the ability to be alone would serve as mediating variables between PSD and ROS, respectively. The mediating effect of PSD on ROS through PRS aligns with findings from previous studies. Additionally, in this study, we identified another variable: students’ ability to be alone. The parallel mediation effect analysis, conducted using PROCESS V3.5 in SPSS 25.0, revealed that under the conditions of Model 4, the ability to be alone played a positive and mediating role in the relationship between the perceived sensory experience and recovery outcome. The final results indicated that individuals with higher scores in PRS or in their ability to be alone experienced greater psychological restoration in the green campus space. Of the two dimensions related to the ability to be alone, the role of the solitary response was more prominent than that of being comfortable with solitude. This is consistent with the results of psychological studies showing that solitude skills training promotes mental health and is effective as a clinical intervention [20]. However, this correlation was not exceptionally strong. Factors such as environmental noise or a stressful situation experienced by the student on a given day may have contributed to variations in scores on the scale. Further research may be necessary to explore these aspects in greater detail.

4.4. Limitations and Future Research

This study has some limitations: Firstly, as participants were from the same university, the results may not represent the general university population, limiting the generalizability of the findings. Secondly, since the results are based on participants’ self-reports, the evaluation of campus green spaces is subjective and may be influenced by individual perspectives. Future research could enhance the exploration of the relationship between campus green spaces and college students’ mental health by incorporating more objective evaluation methods. This work lays the foundation for further research into the broader psychosocial value of green spaces, delving deeper into this field by considering mediating effects and individual perception dimensions. Future research endeavors could delve into precisely identifying which dimensions of PSD offer greater support for perceived resilience and solitude. Additionally, exploring the direct effects of PSD and restorative experiences could be a promising avenue. Nevertheless, the current study assessed these relationships primarily on a theoretical level. Subsequent studies might consider incorporating physiological indicators for a more precise understanding of the connection with human health.

5. Conclusions

This study measured the psychological state of college students and verified a significant association between PSD and the experience of psychological recovery, in which the recovery of campus green spaces was enhanced by the effects of the ability to be alone and perceptual recovery. While previous studies suggested that PSD itself promotes psychological recovery outcomes [10], this study illustrated that perceived restorativeness and solitude capability provide an additional mechanism to explain this relationship. In this study, the examination of the relationship between perceptual dimensions and psychological repair was primarily grounded in Kaplan’s theory of attentional repair and Ulrich’s theory of stress reduction. We used an SEM model for analysis and conducted a mediation effects analysis. Using a series of statistical tests, we arrived at the following conclusions:
This study is the first attempt to quantify college students’ ability to be alone, and the results indicate that the ability to be alone is a mediating variable between perceived dimensions and recovery outcomes. This suggests that students with a greater ability to be alone have positive recovery experiences when alone in campus green spaces. Previous studies have not explicitly explored which perceptual dimensions or recovery factors in PSD have a significant impact on the recovery experience, nor have they examined precisely which dimensions or recovery factors of PSD influence the integration of recovery experiences and intrinsic motivation in college students. Regarding the sensory perception dimension, students showed the highest preference for shelter, suggesting a need for relatively semi-enclosed spaces when everyone is alone. In a subsequent validation of the model, the paths for nature and the ability to be alone were not significant, indicating that free-growing vegetation in the space, as well as aquatic space, were not necessary features for students with a greater ability to be alone.
The present study specifically examined the effects of PSD on each of the four dimensions of perceptual recovery. Previous research has elucidated the positive effects of PSD environmental features on perceptual recovery and psychological recovery, which are consistent with the results derived in the current study. However, according to structural equation modeling (SEM), it appears that the serenity dimension of perception was significantly correlated with all four dimensions of the PRS in each specific theme, while the species richness dimension was not significantly correlated with all four dimensions of the pathways in the PRS. Therefore, based on the results of the current study, it is suggested that the tranquility dimension of spatial perception has the greatest impact on psychological recovery, while species richness has the least.
In conclusion, by identifying the mediating effects of PRS and solitude in the relationship between PSD and the restorative experience, this study made significant progress in the field of restorative experience. The design of green spaces on university campuses should not only focus on ecological and landscape effects but also involve a profound understanding of the psychological characteristics and needs of the campus community. This will contribute to the creation of sustainable campus green spaces and leisure areas for mental health. A people-oriented planning and design approach should include the reasonable division of functional areas, the scientific layout of humane spaces, and a comprehensive understanding of the psychological and behavioral needs of both teachers and students. This will enable the construction of sustainable campus green spaces and green leisure areas that promote mental well-being and cater to diverse usage needs.
Therefore, creating a campus rehabilitation landscape is not only conducive to the alleviation of college students’ stress but also helps their character development and emotional formation, which is an essential lesson for college campuses and an important part of cultivating high-quality talents.

Author Contributions

Conceptualization, J.J. and J.Z.; methodology, J.J. and J.Z.; software, J.J.; validation, J.J., J.Z. and Y.L.; formal analysis, J.Z.; investigation, J.J.; resources, J.Z.; data curation, Y.L.; writing—original draft preparation, J.J.; writing—review and editing, J.Z.; visualization, J.J.; supervision, Y.L.; project administration, Y.L.; All authors have read and agreed to the published version of the manuscript.

Funding

This research received no external funding.

Institutional Review Board Statement

Not applicable.

Informed Consent Statement

Not applicable.

Data Availability Statement

Data are contained within the article.

Conflicts of Interest

The authors declare no conflicts of interest.

References

  1. Julia, F.; Thomas, K.; Carmen, A. Academic Greenspace and Well-Being—Can Campus Landscape be Therapeutic? Evidence from a German university. Wellbeing Space Soc. 2021, 2, 100003. [Google Scholar]
  2. Hipp, J.A.; Gulwadi, G.B.; Alves, S.; Sequeira, S. The relationship between perceived greenness and perceived restorativeness of university campuses and student-reported quality of life. Environ. Behav. 2016, 48, 1292–1308. [Google Scholar] [CrossRef]
  3. Holt, E.W.; Lombard, Q.K.; Best, N.; Smiley-Smith, S.; Quinn, J.E. Active and passive use of green space, health, and well-being amongst university students. Int. J. Environ. Res. Public Health 2019, 16, 424. [Google Scholar] [CrossRef]
  4. Fan, Y.; Das, K.V.; Chen, Q. Neighborhood green, social support, physical activity, and stress: Assessing the cumulative impact. Health Place 2011, 17, 1202–1211. [Google Scholar] [CrossRef]
  5. Wilkie, S.; Clouston, L. Environment preference and environment type congruence: Effects on perceived restoration potential and restoration outcomes. Urban For. Urban Green. 2015, 14, 368–376. [Google Scholar] [CrossRef]
  6. Shafait, Z.; Huang, J. Exploring the Nexus of Emotional Intelligence and University Performance: An Investigation through Perceived Organizational Support and Innovative Work Behavior. Psychol. Res. Behav. Manag. 2023, 16, 4295–4313. [Google Scholar] [CrossRef]
  7. Shafait, Z.; Huang, J. From knowledge-oriented leadership to emotional intelligence to creative performance: Teachers’ assessment from Chinese higher education. Curr. Psychol. 2023, 1–14. [Google Scholar] [CrossRef]
  8. Shafait, Z.; Huang, J. Nexus of Emotional Intelligence and Learning Outcomes: A Cross-Country Study of China and Pakistan Higher Educational Institutes. Int. J. Environ. Res. Public Health 2022, 19, 16215. [Google Scholar] [CrossRef]
  9. Cai, B.; Shafait, Z.; Chen, L. Teachers’ Adoption of Emotions-Based Learning Outcomes: Significance of Teachers’ Competence, Creative Performance, and University Performance. Front. Psychol. 2022, 13, 812447. [Google Scholar] [CrossRef]
  10. Lu, M.; Fu, J. Attention restoration space on a university campus: Exploring restorative campus design based on environmental preferences of students. Int. J. Environ. Res. Public Health 2019, 16, 2629. [Google Scholar] [CrossRef]
  11. Wang, X.; Zhang, Y.; Zhao, R.; Niu, L. Study on the Effects of Four Campus Green Landscapes on College Students’ Physiological and Psychological Indicators. Chin. Landsc. Archit. 2020, 36, 92–97. [Google Scholar]
  12. Rehman, A.U.; Bhuttah, T.M.; You, X. Linking burnout to psychological well-being: The mediating role of social support and learning motivation. Psychol. Res. Behav. Manag. 2020, 13, 545–554. [Google Scholar] [CrossRef]
  13. White, M.P.; Hartig, T.; Martin, L.; Pahl, S.; van den Berg, A.E.; Wells, N.M.; Costongs, C.; Dzhambov, A.M.; Elliott, L.R.; Godfrey, A. Nature-based biopsychosocial resilience: An integrative theoretical framework for research on nature and health. Environ. Int. 2023, 181, 108234. [Google Scholar] [CrossRef]
  14. Gulwadi, G.B.; Mishchenko, E.D.; Hallowell, G.; Alves, S.; Kennedy, M. The restorative potential of a university campus: Objective greenness and student perceptions in Turkey and the United States. Landsc. Urban Plan. 2019, 187, 36–46. [Google Scholar] [CrossRef]
  15. Malekinezhad, F.; Courtney, P.; bin Lamit, H.; Vigani, M. Investigating the mental health impacts of university campus green space through perceived sensory dimensions and the mediation effects of perceived restorativeness on restoration experience. Front. Public Health 2020, 8, 578241. [Google Scholar] [CrossRef]
  16. Leiqing, X.; Yu, Y. Restorative spatial planning practice in response to isolation, segregation, and inequality. Landsc. Archit. Front. 2019, 7, 24–38. [Google Scholar]
  17. Gandong, C.; Mingjie, C. Urban mental desire--Tokyo loneliness tree hole plan. Landsc. Archit. Front. 2020, 8, 120–127. [Google Scholar]
  18. Long, C.R.; Averill, J.R. Solitude: An exploration of benefits of being alone. J. Theory Soc. Behav. 2003, 33, 21–44. [Google Scholar] [CrossRef]
  19. Maas, J.; Van Dillen, S.M.; Verheij, R.A.; Groenewegen, P.P. Social contacts as a possible mechanism behind the relation between green space and health. Health Place 2009, 15, 586–595. [Google Scholar] [CrossRef]
  20. Thomas, V. Solitude skills and the private self. Qual. Psychol. 2023, 10, 121. [Google Scholar] [CrossRef]
  21. Pasanen, T.P.; Neuvonen, M.; Korpela, K.M. The psychology of recent nature visits: (How) are motives and attentional focus related to post-visit restorative experiences, creativity, and emotional well-being? Environ. Behav. 2018, 50, 913–944. [Google Scholar] [CrossRef]
  22. Winnicott, D. The capacity to be alone. In The Maturational Process and the Facilitating Environment; Winnicott, D.W., Ed.; International Universities Press: New York, NY, USA, 1965. [Google Scholar]
  23. Bond, D. Loneliness and solitude: Some influences of object relations on the experience of being alone (Doctoral dissertation, Boston University, 1990). Diss. Abstr. Int. 1991, 51, 4585. [Google Scholar]
  24. Long, C.R.; Seburn, M.; Averill, J.R.; More, T.A. Solitude experiences: Varieties, settings, and individual differences. Personal. Soc. Personal. Soc. Psychol. Bull. 2003, 29, 578–583. [Google Scholar] [CrossRef]
  25. Bell, S. Landscape pattern, perception and visualisation in the visual management of forests. Landsc. Urban Plan. 2001, 54, 201–211. [Google Scholar] [CrossRef]
  26. Lindström, M.; Jönsson, S. How to Measure Landscape Experiences: From Quantitaitive to Qualitative Research; Department of Human Sciences, University of Kalmar: Kalmar, Sweden, 2009. [Google Scholar]
  27. Kühne, O.; Koegst, L.; Edler, D. Theory and Meaning of Multisensory Landscapes. In Multisensory Landscapes: Theories and Methods; Springer: Berlin/Heidelberg, Germany, 2023; pp. 13–29. [Google Scholar]
  28. Li, J.; Chen, S.; Xu, H.; Kang, J. Effects of implanted wood components on environmental restorative quality of indoor informal learning spaces in college. Build. Environ. 2023, 245, 110890. [Google Scholar] [CrossRef]
  29. Nukarinen, T.; Rantala, J.; Korpela, K.; Browning, M.H.; Istance, H.O.; Surakka, V.; Raisamo, R. Measures and modalities in restorative virtual natural environments: An integrative narrative review. Comput. Hum. Behav. 2022, 126, 107008. [Google Scholar] [CrossRef]
  30. Stessens, P.; Canters, F.; Huysmans, M.; Khan, A.Z. Urban green space qualities: An integrated approach towards GIS-based assessment reflecting user perception. Land Use Policy 2020, 91, 104319. [Google Scholar] [CrossRef]
  31. Berg Olsson, M. Tätortsnära Natur-Och Hållbar Utveckling; Tunon, H., Ed.; Swedish Biodiversity Centre: Uppsala, Sweden; ISBN 978-91-89232-42-6 2021.
  32. de Jong, K.; Albin, M.; Skärbäck, E.; Grahn, P.; Wadbro, J.; Merlo, J.; Björk, J. Area-aggregated assessments of perceived environmental attributes may overcome single-source bias in studies of green environments and health: Results from a cross-sectional survey in southern Sweden. Environ. Health 2011, 10, 4. [Google Scholar] [CrossRef]
  33. Angelstam, P.; Manton, M.; Green, M.; Jonsson, B.-G.; Mikusiński, G.; Svensson, J.; Sabatini, F.M. Sweden does not meet agreed national and international forest biodiversity targets: A call for adaptive landscape planning. Landsc. Urban Plan. 2020, 202, 103838. [Google Scholar] [CrossRef]
  34. Cao, Y.; Huang, L. Research on the Healing Effect Evaluation of Campus’ Small-Scale Courtyard Based on the Method of Semantic Differential and the Perceived Restorative Scale. Sustainability 2023, 15, 8369. [Google Scholar] [CrossRef]
  35. Yang, X. Relationship of Perceived Emotional Response to the Soundscape and Urban Green Space Based a Deep Learning Approach. Ph.D. Thesis, De Montfort University, Leicester, UK, 2022. [Google Scholar]
  36. Marselle, M.R.; Irvine, K.N.; Lorenzo-Arribas, A.; Warber, S.L. Does perceived restorativeness mediate the effects of perceived biodiversity and perceived naturalness on emotional well-being following group walks in nature? J. Environ. Psychol. 2016, 46, 217–232. [Google Scholar] [CrossRef]
  37. Huang, S.; Zhu, J.; Zhai, K.; Wang, Y.; Wei, H.; Xu, Z.; Gu, X. Do emotional perceptions of visible greeneries rely on the largeness of green space? verification in Nanchang, China. Forests 2022, 13, 1192. [Google Scholar] [CrossRef]
  38. Scannell, L.; Gifford, R. Place attachment enhances psychological need satisfaction. Environ. Behav. 2017, 49, 359–389. [Google Scholar] [CrossRef]
  39. Grahn, P.; Stigsdotter, U.K. The relation between perceived sensory dimensions of urban green space and stress restoration. Landsc. Urban Plan. 2010, 94, 264–275. [Google Scholar] [CrossRef]
  40. Uysal, M.; McGehee, N.G.; Loker-Murphy, L. The Australian international pleasure travel market: Motivations from a gendered perspective. J. Tour. Stud. 1996, 7, 45–57. [Google Scholar]
  41. Larson, R.W. The solitary side of life: An examination of the time people spend alone from childhood to old age. Dev. Rev. 1990, 10, 155–183. [Google Scholar] [CrossRef]
  42. Larson, R.W. The emergence of solitude as a constructive domain of experience in early adolescence. Child Dev. 1997, 68, 80–93. [Google Scholar] [CrossRef]
  43. Hartig, T. Validation of a Measure of Perceived Environmental Restorativeness; Goteborg Psychological Reports; Department of Psychology, Göteborg University: Göteborg, Sweden, 1996; Volume 26. [Google Scholar]
  44. Wang, X.; Wu, C.; Yan, J. Experimental study of the perceived restorative scale (PRS) in Chinese by evaluating the restorative qualities of urban park scenes. Chin. landsc. Archit. 2019, 35, 45–48. [Google Scholar]
  45. Korpela, K.M.; Ylén, M.; Tyrväinen, L.; Silvennoinen, H. Determinants of restorative experiences in everyday favourite places. Health Place 2008, 14, 636–652. [Google Scholar] [CrossRef]
  46. Johnsen, S.Å.K. Exploring the use of nature for emotion regulation: Associations with personality, perceived stress, and restorative outcomes. Nord. Psychol. 2013, 65, 306–321. [Google Scholar] [CrossRef]
  47. Duan, Y.; Li, S. Study of different vegetation types in green space landscape preference: Comparison of environmental perception in winter and summer. Sustainability 2022, 14, 3906. [Google Scholar] [CrossRef]
Figure 1. Map of the experimental location. (A) Heilongjiang Province, China; (B) Harbin City, Heilongjiang Province; and (C) Northeast Forestry University with the study sites.
Sustainability 16 00707 g001
Figure 2. Analysis of the environmental characteristics survey results.
Sustainability 16 00707 g002
Figure 3. Conceptual framework.
Sustainability 16 00707 g003
Figure 4. Model path map and standardized estimates (SEM).
Sustainability 16 00707 g004
Figure 5. From left to right: perceptual sensory CFA, perceptual recovery CFA, and the ability to be alone CFA.
Sustainability 16 00707 g005
Table 1. Variables and factor loadings for the perceived sensory dimensions.
FactorVariablesFactor Loading
NatureThe green space has a nature quality.0.71
The green space has a wild and untouched quality.0.63
There are free growing lawns.0.54
It is possible to light a fire in the green space.0.5
It feels safe spending time in the green space.0.49
One is able to spend time in the green space without coming into contact with too many people.0.47
The green space contains hilly areas.0.44
Culture The green space is decorated with fountains.0.73
The green space is decorated with statues.0.65
The green space contains a wide range of foreign plants, ornamental plants, and kitchen plants.0.65
The green space has the characteristics of a city park.0.57
The green space has different water features, such as ponds and canals.0.52
The green space is ornamented with flowers.0.5
The green space has a wooded pasture quality.0.46
ProspectThe green space contains lawns and well-cut grass surfaces.0.87
It is possible to gain an overview with vistas over the surroundings. 0.78
The lawns are cut.0.76
The green space has grass football pitches. 0.68
The green space has gravel football pitches.0.5
The football pitches are lit up.0.48
The green space has small ball grounds on asphalt.0.47
Showers and changing rooms are available.0.43
SocialIt is possible to observe entertainment, like a park concert. 0.94
It is possible to observe exhibitions.0.92
It is possible to visit a restaurant or a simple open-air restaurant in the green space. 0.89
It is possible to shop at market stalls, kiosks, etc.0.78
There are plenty of people and movement in the green space. 0.74
The green space contains roads and gravel paths.0.72
The green space has special park animals, like swans, ducks, and deer. 0.66
The green space has generally good lighting. 0.64
The roads are well lit. 0.63
There is access to washrooms.0.6
There are places in the green space sheltered from the wind.0.59
There are sunny places.0.54
There are shady places.0.52
The green space contains several seats and benches.0.5
It feels safe spending time in the green space.0.44
There are tables and benches.0.38
The green space contains roads and paths with hard surfaces, such as asphalt and concrete bricks.0.33
SpaceThe green space is experienced as spacious and free.0.89
lt is possible to find areas not crossed by roads and paths.0.87
The green space has numerous trees.0.58
It is possible to find places where a group of several people can gather.0.52
There are places in the green space sheltered from the wind.0.49
There are sunny places.0.44
There are shady places.0.42
Rich in speciesOne can detcct several animals, such as birds and insects.0.97
The green space consists of natural plant and animal populations.0.96
There are many native plants to study.0.87
RefugeThe green space contains many bushes.0.93
The green space has animals that children and adults may feed and pet.0.87
There are sand boxes.0.77
There is play equipment, such as swings, slides, etc.0.73
It is possible to watch other people being active, playing, engaging insports, etc.0.58
It feels safe spending time in the green space.0.57
There are tables and benches.0.36
SereneThe green space is silent and calm.0.94
There are no bikes in the green space.0.89
One is able to spend time in the green space without coming into contact with too many people.0.84
There are plenty of people and movements in the green space.−0.78
There are no mopeds.0.74
It is possible to watch other people being active, playing, practicing sports, etc.−0.69
The area is clean and well-maintained.0.6
There is no traffic noise from the surroundings.0.57
It feels safe spending time in the green space.0.5
(Source: Grahn and Stigsdotter, 2010 [39]).
Table 2. Solitary Recovery Scale.
CharacteristicsNumberItems
Solitary copingSC1Being away from crowds helps me think about the issues I currently face.
SC2Being alone helps me relax.
SC3Being alone does not help alleviate my pain.
SC4When I am alone, I can think more clearly.
SC5Being alone for a while makes me feel truly rejuvenated inside.
SC6Sometimes, doing things alone lets my emotions settle.
SC7Being alone does not help me understand the situation I am in.
SC8Sometimes, getting away from people is the only way to release my anger and stress.
SC9When I am in a bad mood, being alone only makes me feel worse.
SC10When I am under a lot of pressure, I need someone to accompany me.
Comfortable solitudeCS1I enjoy being alone.
CS2Sometimes, I feel happy when I am alone.
CS3When I am alone, I feel empty.
CS4I cannot be happy when I am alone unless someone is with me.
CS5I try not to be alone as much as possible.
CS6Being alone does not bring inner peace to me.
CS7If I cannot share my feelings or activities with others, then they are meaningless.
CS8When I am alone, I am content with myself.
CS9When I am alone, I always find things to do.
CS10When I am alone, I feel inner tranquility.
Table 3. Perceptual Recovery Scale.
CharacteristicsNumberItems
FascinationFS1This place helps me relax and focus less on getting things done.
FS2I find this environment to be attractive.
FS3Many interesting things here catch my attention.
FS4I hope to better understand this place.
FS5There are many areas worth exploring and discovering here.
FS6I wish I could spend more time appreciating the surroundings.
FS7This place is quite dull.
FS8This place is very charming.
EscapeEC1I feel a sense of relief here.
EC2It allows me to set aside daily tasks and take a break.
EC3I can temporarily escape the pressures of everyday life and studies here.
EC4It helps me relax mentally.
EC5It aids in reducing unnecessary attention demands.
CompatibilityCM1I feel a sense of belonging here.
CM2I can engage in activities I want to do here.
CM3I feel that I blend well with this environment.
CM4This place suits me well.
CM5I can enjoy happiness here.
CoherenceCH1This place makes me feel puzzled.
CH2There are too many things here that distract my attention.
CH3It is very chaotic here.
CH4There are too many things in this place
Table 4. Perceived Sensory Scale.
CharacteristicsNumberItems
NaturalNA1Freely growing vegetation
NA2Natural
NA3Diverse aquatic features
CulturalCL1Cultural building
CL2Cultural architecture
CL3Cultural ambiance
ProspectPS1Broad lawns
PS2Expansive views
PS3Open spaces
PS4Vast water areas
SocialSL1Suitable for socializing
SL2Recreational activities
SL3Many recreational facilities
SL4Catering or sales services
SL5Many people and activities
SL6Convenient for observing others’ activities
RefugeRU1Sheltered from wind and rain
RU2Providing resting benches
RU3Gathering places for people
SpaceSP1Private areas
SP2Independent areas
Rich in speciesRIS1Unique flora and fauna
RIS2Diverse flora and fauna population
RIS3Many shrubs
RIS4Animals that can be fed
SereneSE1No traffic noise
SE2Quiet and calm
SE3Clean and well-maintained
SE4Not disturbed by people
SE5Inaccessible to vehicles
Table 5. Restoration Outcome Scale.
CharacteristicsNumberItems
Restoration ExperienceROS1I feel clear-headed.
ROS2I am enthusiastic and energetic about my daily life.
ROS3I feel focused and alert.
ROS4I feel calm.
ROS5My thoughts are clear.
ROS6I can forget my daily troubles
Table 6. Reliability and validity analyses.
VariableCronbach’s Alpha
Solitude abilitySolitary Coping0.9520.953
Comfortable Solitude0.950
Perceived restorativenessFascination0.9330.929
Escape0.902
Compatibility0.908
Coherence0.907
Perceived sensory dimensionNature0.8780.937
Culture0.883
Prospect0.902
Social0.923
Refuge0.885
Space0.864
Rich in species0.907
Serene0.916
Restoration experience 0.882
Total 0.968
Table 7. Model fitness test.
Common IndicesCMIN/DFRMSEAIFLTLICFI
Solitude ability2.0690.0460.9790.9760.979
Perceived restorativeness2.4330.0530.9630.9580.963
Perceived sensory dimension2.7820.0600.9400.9300.940
Table 8. Factor loading coefficients table.
FactorObservationStd.EstimateCRAVE
Solitary copingSC10.9180.6680.952
SC20.793
SC30.784
SC40.794
SC50.835
SC60.803
SC70.795
SC80.799
SC90.814
SC100.833
Comfortable solitudeCS10.9440.6580.951
CS20.788
CS30.798
CS40.791
CS50.797
CS60.782
CS70.794
CS80.809
CS90.805
CS100.793
NatureNA10.9030.7240.887
NA20.825
NA30.823
CultureCU10.9050.7310.890
CU20.827
CU30.831
ProspectPS10.9270.710.907
PS20.827
PS30.806
PS40.806
SocialSL10.910.6730.925
SL20.795
SL30.804
SL40.801
SL50.797
SL60.811
RefugeRU10.9060.7350.892
RU20.836
RU30.829
SpaceSP10.7880.8010.888
SP20.991
Rich in speciesRIS10.9270.720.911
RIS20.835
RIS30.823
RIS40.805
SereneSE10.9090.6950.919
SE20.806
SE30.818
SE40.826
SE50.805
FascinationFC10.9310.6410.934
FC20.769
FC30.786
FC40.79
FC50.787
FC60.796
FC70.787
FC80.748
EscapeEC10.9390.6610.906
EC20.783
EC30.764
EC40.766
EC50.802
CompatibilityCM10.9370.6740.911
CM20.778
CM30.797
CM40.808
CM50.775
CoherenceCH10.920.6890.898
CH20.791
CH30.791
CH40.807
Table 9. Results of the differentiated validity test for each dimension of the Sensory Perception Scale.
VariableNatureCultureProspectSocialRefugeSpaceRich in SpeciesSerene
Nature0.724
Culture0.3130.731
Prospect0.4520.3330.71
Social0.4220.3930.350.673
Refuge0.3540.3070.320.3380.735
Space0.3620.3580.4370.3260.3740.801
Rich in species0.3670.3640.4150.3990.390.3880.72
Serene0.370.3620.3810.3790.3540.3670.410.695
SQRT (AVE)0.8510.8550.8430.820.8570.8950.8490.834
Table 10. Results of the differentiated validity test for each dimension of the Perceptual Recovery Scale.
VariableFascinationEscapeCompatibilityCoherence
Fascination0.641
Escape0.3460.661
Compatibility0.3710.3540.674
Coherence0.4090.3340.3810.67
SQRT (AVE)0.8010.8130.8210.819
Table 11. Descriptive statistics results.
CategoryOptionFrequencyPercentage (%)
GenderMale25650.89
Female24749.11
Registered residenceUrban32063.62
Rural18336.38
Are you the only child?Yes33266
No17134
Student groupUndergraduate29358.25
Master13526.84
Doctoral7514.91
Frequency of visiting green spaces on campusOne to three times per month7114.12
One to three times per week17935.59
Four to six times per week18436.58
Seven times or more per week6913.72
Experienced stress in the past weekYes33867.2
No16532.8
Preferred space for solitude on campusSpace 1254.97
Space 2285.57
Rich in Species 1203.98
Rich in Species 2428.35
Serene 1285.57
Serene 2316.16
Prospect 1265.17
Prospect 2295.77
Nature 1316.16
Nature 2326.36
Culture 1377.36
Culture 2316.16
Social 1295.77
Social 2407.95
Refuge 1305.96
Refuge 2448.75
Total503100
Table 12. Results of the Pearson correlation analysis between dimensions.
DimensionSCCSCLNAPSSLRURISSPSEFCECCHCM
SC1
CS0.527 **1
CL0.400 **0.418 **1
NA0.464 **0.410 **0.292 **1
PS0.380 **0.397 **0.357 **0.362 **1
SL0.483 **0.464 **0.333 **0.434 **0.393 **1
RU0.438 **0.395 **0.374 **0.399 **0.375 **0.352 **1
RIS0.441 **0.456 **0.357 **0.364 **0.378 **0.441 **0.328 **1
SP0.378 **0.405 **0.279 **0.330 **0.332 **0.312 **0.305 **0.344 **1
SE0.461 **0.379 **0.361 **0.362 **0.417 **0.417 **0.391 **0.395 **0.358 **1
FC0.491 **0.414 **0.417 **0.391 **0.374 **0.443 **0.362 **0.408 **0.382 **0.447 **1
EC0.470 **0.344 **0.292 **0.358 **0.420 **0.402 **0.360 **0.380 **0.313 **0.411 **0.362 **1
CH0.421 **0.429 **0.329 **0.382 **0.424 **0.406 **0.371 **0.375 **0.255 **0.423 **0.422 **0.358 **1
CM0.393 **0.420 **0.326 **0.388 **0.363 **0.393 **0.392 **0.345 **0.308 **0.445 **0.398 **0.385 **0.395 **1
** Significant correlation at the 0.01 level (two-tailed).
Table 13. Results of regression analysis.
Non-Standardized CoefficientsStandardized CoefficientstpCollinearity Diagnostics
BSEBetaVIFTolerance
Constant0.6600.166-3.9750.000 **--
Solitude Ability0.2510.0690.1823.6430.000 **2.2150.451
PRS0.2100.0620.1843.3600.001 **2.6560.376
PSD0.5740.0950.3596.0190.000 **3.1650.316
R20.438
Adj. R20.434
FF (3,499) = 129.518, p = 0.000
D-W1.774
Dependent variable: recovery outcome, ** p < 0.01.
Table 14. Model fit indices model fit indices.
IndicatorsCMIN/DFRMSEAIFITLICFI
Observed results1.9590.0440.910.9060.910
Assessment criteria<3<0.05>0.9>0.9>0.9
Table 15. Path analysis.
Pathway RelationshipECtimateS.E.C.R.p
FS<---NA0.1310.0792.9190.004
EC<---NA0.0970.0852.0890.037
CM<---NA0.1420.0833.0830.002
CH<---NA0.1630.083.474***
SC<---NA0.2160.0524.879***
CS<---NA0.1340.0553.0240.002
SC<---CL0.1470.0513.358***
CS<---CL0.1880.0554.226***
FS<---CL0.2190.0784.818***
EC<---CL0.0260.0840.5710.568
CM<---CL0.0910.0811.9810.048
CH<---CL0.1040.0792.220.026
SC<---PS0.0060.0510.1350.893
CS<---PS0.0830.0551.9110.056
FS<---PS0.0490.0781.1110.267
EC<---PS0.1920.0864.177***
CM<---PS0.0730.0821.6130.107
CH<---PS0.1910.084.123***
SC<---SL0.2090.0524.793***
CS<---SL0.20.0564.567***
FS<---SL0.1920.084.299***
EC<---SL0.1640.0873.576***
CM<---SL0.1310.0842.8780.004
CH<---SL0.1470.0813.1990.001
SC<---RU0.1720.0523.942***
CS<---RU0.1180.0562.6930.007
FS<---RU0.0620.0791.3960.163
EC<---RU0.1070.0862.340.019
CM<---RU0.1670.0843.641***
CH<---RU0.1390.08130.003
SC<---SP0.1510.0493.402***
CS<---SP0.2060.0534.565***
FS<---SP0.1590.0753.492***
EC<---SP0.0760.0811.6320.103
CM<---SP0.0670.0781.4540.146
CH<---SP−0.0130.075−0.2840.777
CH<---RIS0.1010.082.20.028
CM<---RIS0.0620.0831.3690.171
EC<---RIS0.1270.0862.7840.005
FS<---RIS0.1120.0792.5310.011
CS<---RIS0.2020.0564.608***
SC<---RIS0.1560.0523.597***
CH<---SE0.1750.0813.774***
CM<---SE0.2410.0855.222***
EC<---SE0.1750.0873.813***
FS<---SE0.1920.084.288***
CS<---SE0.0250.0560.5670.571
SC<---SE0.1830.0524.207***
ROS<---NA0.2380.0663.989***
ROS<---CL−0.0530.041−0.8390.401
ROS<---PS−0.0330.038−0.5170.605
ROS<---SL−0.130.038−2.0090.045
ROS<---RU−0.2730.044−3.782***
ROS<---SP−0.2820.069−3.494***
ROS<---RIS−0.3840.088−4.04***
ROS<---SE0.2450.0634.184***
ROS<---SC0.3360.0635.7***
ROS<---CS0.1440.0622.5330.011
ROS<---FS0.3050.0665.141***
ROS<---EC0.2750.0644.764***
ROS<---CM1.2710.4547.336***
ROS<---CH0.330.0645.717***
*** p < 0.001.
Table 16. Results of the mediation effects analysis.
Restoration ExperienceSolitude AbilityPRSRestoration Experience
BSEtpβBSEtpβBSEtpβBSEtpβ
Constant0.931 **0.1635.7170.000-0.449 **0.1054.2630.000-0.755 **0.1166.5010.000-0.660 **0.1663.9750.000-
PSD1.013 **0.05518.3630.0000.6340.840 **0.03623.5540.0000.7251.087 **0.03927.6570.0000.7770.574 **0.0956.0190.0000.359
Solitude ability 0.251 **0.0693.6430.0000.182
PRS 0.210 **0.0623.3600.0010.184
R20.4020.5250.6040.438
Adj. R20.4010.5250.6030.434
FF(1,501) = 337.199, p = 0.000F(1,501) = 554.783, p = 0.000F(1,501) = 764.928, p = 0.000F(3,499) = 129.518, p = 0.000
** p < 0.01.
Table 17. Summary of the results of the mediating role test.
ItemC (Total Effect)aba ∗ ba ∗ b
(Boot SE)
a ∗ b
(z)
a ∗ b
(p)
a ∗ b
(95 per Cent Boot CI)
C′ Direct EffectTest Conclusion
Sensory perception => solitude ability => recovery outcome1.013 **0.840 **0.251 **0.2110.0415.1180.0000.053~0.2130.574 **Partial Mediation
Sensory perception => perceived recovery => recovery outcome1.013 **1.087 **0.210 **0.2280.0474.8900.0000.049~0.2310.574 **Partial Mediation
** p < 0.01.
Disclaimer/Publisher’s Note: The statements, opinions and data contained in all publications are solely those of the individual author(s) and contributor(s) and not of MDPI and/or the editor(s). MDPI and/or the editor(s) disclaim responsibility for any injury to people or property resulting from any ideas, methods, instructions or products referred to in the content.

