Abstract
We aim to map the ESG patterns of emerging-market companies from 2018 to 2021 in order to determine whether the COVID-19 pandemic exerted any influence on sustainable corporate behavior. Thus, the ESG performances were assessed by employing the Kohonen Self-Organizing Map (also known as the Kohonen neural network) for clustering purposes at three levels: (i) ESG overall, including country and sectoral perspectives; (ii) ESG thematic; and (iii) ESG four-folded (stakeholder, perspective, management, and focus strategic views). Our results show that emerging-market companies focus their ESG efforts on social and governance issues rather than on environmental. However, environmental and social behavior differ more acutely than governance behavior across clusters. The analyses of country-level ESG performance and that of eleven market-based economic sectors corroborate the geographic and sector dependence of ESG performance. The thematic-level analysis indicates that operational activities and community issues received more attention, which suggests that emerging-market companies address distinct ESG topics according to their particularities and competitiveness. Furthermore, our empirical findings provide evidence that the ESG behavior of companies has changed over the course of the COVID-19 pandemic. Thus, our findings are relevant to policy makers involved in regulating ESG disclosure practices, investors focused on enhancing their sustainable investment strategies, and firms engaged in improving their ESG involvement.
1. Introduction
The GSIA (2020) defines sustainable investment as investment that considers environmental, social, and governance (ESG) factors in its portfolio selection and management. In their latest biannual report, the GSIA showed that global sustainable investment reached USD 35.3 trillion in the five major markets, corresponding to 35.9% of total assets under management and amounting to a 15% increase over the past two years (2018–2020) and a 55% increase over the past four years (2016–2020). This increased awareness of sustainability has altered the economic environment, affecting firm behavior, causing profound changes in capital markets [1], and reducing uncertainty, business risk, and the cost of capital [2,3].
Widyawati [4] highlighted that there are two types of socially responsible investment (SRI): ethical and financial. Ethical SRI views SRI as an instrument with which to pressure companies to change their policies and operate more ethically and sustainably, while financial SRI views SRI as new financial services offered to specific groups of investors and consequently assumes that SRI retains characteristics of traditional financial products. Notably, the literature has focused extensively on ESG integration from the financial perspective, yet there has been scarcely any discussion regarding sustainable corporate development [5].
To address this, in this paper, we focus on mapping the sustainability patterns of emerging-market companies to analyze their sustainable corporate behavior without considering their financial/economic performance. We believe that scrutinizing corporate sustainability patterns and classifying them by similar ESG performance may offer valuable insights into how companies address ESG challenges and endure in their sustainability efforts. This classification is also essential for organizations interested in improving or comparing their ESG performance to their peers as well as for policy makers hoping to achieve sustainability objectives.
Thus, this research serves as an extension of Iamandi et al.’s paper [6] and involves a three-level analysis. In the first level, we analyze the sustainability behavior of emerging-market companies by mapping the three pillars—environmental, social, and governance—as a reflection of the total ESG performance, aiming to provide insights into the economic sectors of various countries. In the second level, we investigate the corporate performance of eight specific ESG themes in forming the ESG pillars. Then, in the third level, we adopt a four-folded approach to the organizational sustainability features (stakeholders, perspective, management, and functional focus of the ESG behaviors).
The method used in this paper involves analyzing the sustainability behavior of emerging-market companies from 2018 to 2021 using the Kohonen Self-Organizing Map (SOM), also known as the Kohonen neural network. This approach clusters companies based on their environmental, social, and governance (ESG) achievements and enables a nuanced understanding of how emerging-market companies adapt their ESG efforts across different dimensions and over time.
Our main contributions are three-fold. First, since most studies on ESG focus on developed countries and regions, such as Australia, Canada, Europe, and the United States, few studies investigate the impact of ESG disclosure and corporate sustainability performance in the context of developing countries [7]. Second, we show that during the COVID-19 pandemic, the ESG behavior of the sample companies has changed, suggesting that periods of crisis can influence financial performance and corporate sustainability performance. Third, since clustering techniques are rarely employed in empirical studies, especially when considering the emerging-market context, this paper demonstrates that an artificial neural network is an interesting and useful tool to analyze sustainable corporate behavior. Moreover, to the best of our knowledge, this is the first in-depth study on the ESG corporate performance of emerging-market companies to be conducted using a Kohonen neural network analysis.
2. Literature Review
The successful implementation of sustainable development firms’ strategies is related to their organizational structure, culture, leadership, management control, internal and external communication, employee motivations, and qualifications [8]. In this sense, Ortas et al. [9] show that not only institutional but also national contexts—and the associated complex economic, social, political, and legal factors—influence the ESG performance of companies in regard to key sustainability issues. Indeed, ESG performance varies across countries [9,10] and economic sectors/industries [9]. ESG performance is also influenced by firm size [11], strategy choices [12], business context [13], board composition [14,15], and mandatory sustainability reporting laws and regulations [16].
Thus, this paper relates to the growing ESG corporate performance literature and argues that organizations, stakeholders, and investors should consider overall ESG scores but also consider the ESG pillars and the links between them to aid in their decision-making.
Several previous studies [17,18,19,20] have found that each ESG pillar has unequal effects on overall corporate sustainability performance. However, Alsayegh et al. [21] find that the economic, environmental, and social performances make identical contributions to the overall corporate sustainability performance.
Jitmaneeroj [17] argues that the overall ESG score is affected both by the direct effects of each pillar score and the indirect effects from the causal interrelations among those pillars. Despite, while Engelhardt et al. [18] argues that the social pillar score is the main driver of corporate financial performance, Giese et al. [19] show that in the short term, governance is the dominant pillar; however, in the long term, environmental, and social pillars become more critical. Miralles-Quirós et al. [20] find that the stock market positively values the environmental practices of companies unrelated to environmentally sensitive industries, and the social and corporate governance practices of companies belonging to environmentally sensitive industries.
In terms of sustainable investment performance, there is still no consensus in the literature, since the empirical results have found to differ significantly depending on the ESG methodologies and financial metrics used to assess the impact of ESG on stock performance [22], to be heterogeneous worldwide [10], dependent on the region, variant over time, and influenced by the type of filter or screening used [23]. Besides, as Cornell highlighted well, the results can be dubious since there are no noncontroversial ESG ratings and the available sample period over ESG data is relatively short. Moreover, investor preferences for highly rated ESG companies can higher the stock prices, and lower the cost of capital [24].
There is also mixed evidence in the literature regarding whether ESG is valuable in times of crisis. Ref. [25] show that the COVID-19 pandemic had a negative impact on the electricity sector and that each ESG pillar scores affected those companies differently. Engelhardt et al. [18] find that high-ESG-rated firms have higher abnormal returns and lower stock volatility during the COVID-19 pandemic, while Bansal et al. [26] conclude that stocks with high ESG ratings outperform low-rated stocks in favorable economic periods, such as when there is high aggregate consumption and stock market value. Conversely, these stocks underperform in bad periods, such as in recessions.
Although there is still no empirical unanimity between ESG and corporate financial performance, several researchers found that ESG companies have some advantages related to creating business value. Jia and Li [27] show that for a group of 72 countries, better sustainable performance is associated with a higher enterprise value in times of external uncertainty in the economy. Eccles et al. [13] find that ESG companies have reinforced stakeholder engagement and trust. Kluza et al. [28] argues that innovations and social factors positively impact sustainable business models. Alsayegh et al. [21] results suggest an interdependency between the companies’ economic value and the broader value they create for society.
Therefore, despite the mixed evidence in the literature regarding whether ESG investment is valuable or not, especially in times of crisis, it seems to be unanimous that the increased awareness of sustainability promoted by global initiatives has affect firm behavior. Although, there are still gaps to be filled since previous studies indicates that each pillar of ESG has unequal effects on overall corporate sustainability depending on the country and economic sector. Hence, scrutinizing corporate sustainability patterns and classifying them by similar ESG performance may offer valuable insights into how companies address ESG challenges and endure in their sustainability efforts.
3. Methods
3.1. Data
The data we used were collected from Thomson Reuters (TR) EIKON and refers to 2018, 2019, 2020, and 2021 emerging-market companies’ fiscal year reports, which contain the following: the ESG scores; the Environmental, Social, and Corporate Governance pillar scores; the ten ESG category scores; the ESG Controversies scores; and the ESG Combined scores (the ESG scores adjusted with the controversies scores).
This paper aims to analyze the emerging market’s corporate sustainability. To do this, we use the available ESG reporting data from the TR EIKON database for all companies that are simultaneously headquartered in a particular emerging country and listed on their local stock exchange. Hence, our sample is formed of the 25 countries that compose the MSCI Emerging Markets Index.
Figure 1 presents a preliminary analysis of the sample companies voluntarily dedicated to reporting their ESG performances. It reveals a range between 6.79% and 10.23% of all companies engaged in ESG reporting from 2018 to 2021, one possible explanation for this is the development of global initiatives as the Sustainable Development Goals, the Paris Agreement, and the Sustainable Financial Roadmap Initiative, which have impacted the sustainable investing industry and the expectations of the investors.
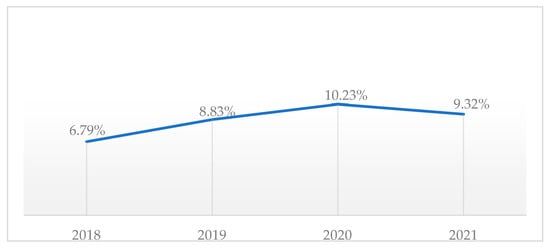
Figure 1.
ESG reporting degree. Note: Figure 1 reports the percentage of ESG emerging-market companies, considering all the stocks listed on a local exchange. For more details regarding the data, see Appendix A.
Figure 2 presents a sectoral analysis of the sample companies’ ESG reporting degree and reveals that the ESG transparency between the eleven economic sectors is still very low among the emerging-market companies. Moreover, there are discrepancies between these sectors once the Utilities, Energy, and Financial companies lead the ranking of the companies involved in ESG reporting, while, at the opposite end, only approximately 5%, or less, of the Academic and Educational Services firms report on their sustainability efforts.
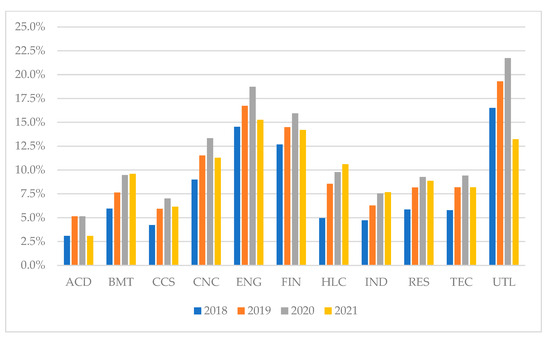
Figure 2.
Sectoral analysis of the ESG reporting degree. Note: Figure 2 presents a sectoral analysis of the sample emerging-market companies ESG reporting degree. Considering the TR EIKON database, the eleven investigated economic sectors are as follows: ACD = Academic and Educational Services, BMT = Basic Materials, CCS = Consumer Cyclicals, CNC = Consumer Non-Cyclicals, ENG = Energy, FIN = Financials, HLC = Healthcare, IND = Industrials, RES = Real State, TEC = Technology, and UTL = Utilities. For more details about the data, see Appendix A.
Table 1 reports the growth rate of ESG companies in the sample countries. Figure 3 displays the allocation of ESG companies by country, showing that, in the period under analysis, those from China dominate the sample, followed by Taiwan, South Korea, and India. By analyzing the graphic, we can deduce that for some countries, such as Malaysia, the number of ESG companies increased during the COVID-19 pandemic while in other countries the number decreased.

Table 1.
Growth rate of the number of ESG companies.
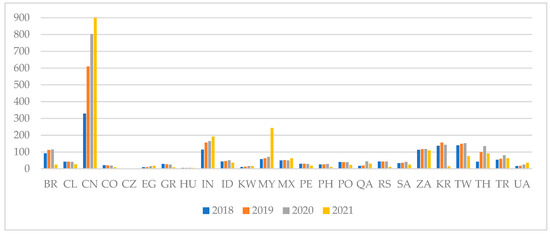
Figure 3.
Number of sample companies by country. Note: Figure 3 shows the allocation of ESG companies by emerging country. The country names are represented by the TR EIKON Code as follows: BR = Brazil, CL = Chile, CN = China, CO = Colombia, CZ = Czech Republic, EG = Egypt, GR = Greece, HU = Hungary, IN = India, ID = Indonesia, KW = Kuwait, MY = Malaysia, MX = Mexico, PE = Peru, PH = Philippines, PO = Poland, and QA = Qatar. RS = Russia, SA = Saudi Arabia, ZA = South Africa, KR = South Korea, TW = Taiwan, TH = Thailand, TR = Turkey, and UA = United Arab Emirates. For more details regarding the data, see Appendix B.
The results presented in Table 1 show that in 2019 the number of ESG companies increased in almost all the sample emerging countries compared to 2018, with only three countries experiencing a decrease and seven remaining the same. However, during the COVID-19 pandemic, especially based on the number of ESG companies in 2021, we can infer that, for most of the sample countries, the pandemic negatively affected companies’ ESG efforts. Indeed, for 18 of 25 countries, the number of companies voluntarily reporting their ESG performances has fallen. Only in China, India, Malaysia, and the United Arab Emirates has the number of ESG companies increased yearly.
Table 2 reports the persistency with which companies engaged in ESG reporting during the period of 2018–2021. The results show that in 2018, there were 1499 emerging-market companies engaged in ESG reporting. However, in 2021, only 923 of those companies continued to report their ESG achievements. Despite the 520 new companies that began to report their ESG performance, the persistency of companies that were already reporting their ESG efforts, and continued to do so, fell considerably in 2021—the second year of the COVID-19 pandemic. However, this finding does not corroborate the Bifulco et al. results, since they discovered that the COVID-19 pandemic did not affect the European firm’s tendency to follow the best ESG practices.
Table 2.
Persistency of companies engaged in ESG reporting.
3.2. The Self-Organizing Map (SOM)
The Self-Organizing Map (SOM), also known in the literature as the Kohonen map, is a feedforward artificial neural network architecture for visual pattern analysis with many practical applications. For example, it is widely applied to address several clustering problems and data exploration in industry, finance, natural sciences, and linguistics [29]. The SOM uses an unsupervised competitive learning algorithm that reduces multi-dimensional data to a lower-dimensional map (or grid) of neurons (or nodes).
Creating an SOM requires only two layers: an input layer containing processing units for each element in the input vector and an output layer of processing units fully connected with those at the input layer, i.e., there is no hidden layer or processing units. When input data are presented to the network, the units in the output layer compete, and the winner (or the best matching unit (BMU)) will be the output unit whose synaptic weights are the closest to the input data (Equation (1)). Then, the synaptic weights of the BMU are adjusted, i.e., moved in the direction of the input data, a principle known as “winner-takes-all” [30], and the synaptic weights of its neighbors are also adjusted to improve matching with the input data (Equation (2)). A commonly used neighborhood function is the Gaussian (Equation (3)).
where X is the input data vector , W is the output unit vector , t denotes time, k is the total number of output units, and c is the BMU. The smallest Euclidean distance defines the BMU.
where X is the input data vector , W is the output unit vector , t denotes time, α is the learning rate , and is the neighborhood function centered on the BMU c.
where σ is the neighborhood radius and is the distance between output unit c and j on the map grid.
In terms of limitations, the architecture of the SOMs needs to be predefined and fixed, i.e., the size of the network, node weights, and neighborhood must be defined before the training phase. Furthermore, the SOMs results is static, which means that the algorithm must be estimated again for different periods of time. Another limitation of the SOMs is referring to the limited interpretability, since the meaning of the patterns found may be unclear, especially when there is not a deeper understanding of the data.
In this paper, an SOM is employed to group the emerging-market companies into distinct clusters according to their ESG achievements and relative sustainable conduct resemblance. In this competitive learning method, the ESG entry data form input vectors that, while presented to the neurons of the input layer, are transmitted to a two-dimensional map space also consisting of neurons—the output layer. To this end, we use the three-part methodology proposed by [6] by employing the following input fields in the Kohonen neural network model:
- The three ESG pillar scores (environmental, social, and governance)—to map the total ESG performance in emerging-market companies.
- Eight out of ten TR EIKON ESG themes scores (Resource Use, Emissions, Environmental Innovation, Workforce, Human Rights, Community, Product Responsibility, and CSR Strategy)—to represent theme-based emerging-market ESG behavior.
- A four-folded strategic approach based on and calculated according to the ten TR EIKON ESG themes scores, as presented in Table 3.
Table 3. ESG score approaches based on TR EIKON.
In Appendix C, we present all the descriptive statistics of the ESG variables considered in this paper. They indicate that the companies in the sample are, on average, medium ESG performers, with mean scores of approximately a 40-medium threshold. Moreover, on average, they seem to perform slightly better on the Corporate Governance component and less well on the Environmental component, although precisely the opposite is found in Iamandi et al.’s [6] research on European companies. The thematic ESG perspective conveys the highest average performance for the Workforce constituent and the lowest for the Environmental Innovation component. As for the strategic ESG approaches, the sample companies achieve the following:
- ESG Stakeholder View: highest average score for the ESG component related to employees (ESG.Em_S) and the lowest score on the consumer-oriented ESG score (ESG.Cr_S).
- ESG Perspective View: highest average score for the ESG component related to internal issues (ESG.In_S) over external issues (ESG.Ex_S).
- ESG Management-Level View: highest average score for the ESG component related to the strategic level (ESG.St_S) over operational (ESG.Op_S) and tactical (ESG.Ta_S) levels.
- ESG Focus View: highest average score for the ESG component related to communication orientation (ESG.Co_S) over technology innovation (ESG.Po_S) and human related (ESG.Ho_S) issues.
In Appendix C, we also report the descriptive statistics for the ESG controversies score, which are based on public and media disclosure of ESG-related corporate exposures or firm’s failures to deal with and mitigate associated risks. The results show that the mean is very high, while the median, the 25th, the 50th, and the 75th percentile are 100 for all the periods in the analysis. This finding suggests that emerging-market companies are not particularly susceptible to issues related to anti-competition, business ethics, intellectual properties, public health, tax fraud, child labor, etc.
The emerging-market companies exhibit uniformity in ESG performance in terms of their medium, mean, and median values. The comparison of the medians illustrates a similar situation as in the case of the mean values, with equivalent edges for the total, thematic, and innovative ESG approaches, while the skewness and kurtosis coefficients indicate that the sample data do not have a normal distribution.
Table 4 reports the three main levels of exposure to ESG risks. The results indicate that at least 95% of the emerging-market companies have no exposure to ESG risks, while less than 2% experience greater exposure to ESG risks. It is worth noting that our results differ from those of [6], who found that 69.4% of the European companies in 2018 had no exposure to ESG risk while 28.6% experienced greater exposure to ESG risks, which suggests that the emerging-market companies undergo considerably less exposure to ESG risks than the European companies.
Table 4.
Companies’ exposure to ESG risks.
3.3. Statistics and Computational Details
First, we standardize (z-score normalization) all the input data. Then, we employ the following parameters in order to train the SOMs for each of the three-level ESG analyses:
- Grid size: 10 × 7.
- Hexagonal topology, Gaussian neighborhood function, Euclidean distance, a standard linearly declining learning rate from 0.1 to 0.01, and 1000 epochs.
- Non-supervised training with PCA (principal component analysis) initialization.
- The number of ideal clusters was obtained by employing two methodologies: WCSS (Within-Cluster Sum of Square) for k-means, and PAM (Partition Around Medoids) clustering, both return the number of three.
In terms of limitations, the SOMs can be sensitivity to initial parametrization of the network, which means that, for example, different initialization methods can result in different results. Additionally, determining the optimal network size can be difficult, since considering too few neurons can result in poor representation of the input data, while using too many neurons can lead to overfitting, to address this issue we employ the WCSS and PAM methodologies.
The empirical results of this research were obtained from R (R version 4.1.3) through the “kohonen” [31,32], “aweSOM” [33], “caret” [34], and “cluster” [35] packages. The modeling was carried out in Windows 11 x86_64-w64-mingw32/x64 (64-bit) com 11th Gen Intel(R) Core(TM) i7-11800H @ 2.30 GHz.
4. Results and Discussion
We employ the SOM in order to group the sample companies based on their ESG performance. To this end, we use the three-level methodology proposed by [6], which generates six different Kohonen maps according to the total ESG performance, the thematic ESG performance, and the four-folded approach to the ESG performance.
4.1. Average Silhouette Measure
Silhouette is a technique utilized for verification of consistency within clusters and interpretation of how well each object has been classified [36]. In other words, the silhouette is a measure of cohesion, i.e., how similar an object is to its own cluster, and separation, i.e., how distinguished an object is to the other clusters. The value ranges from −1 to +1, so that the closer the object is to unity, better is the match to its own cluster and less to neighboring clusters. Table 5 reports the average silhouette measure of each Kohonen map, which, as shown below, range between 0.26 and 0.36.
Table 5.
Average silhouette width.
4.2. Mapping the Total ESG Performance for the Emerging-Market Companies
First, we analyze the sustainability behavior of emerging-market companies by mapping the three pillars—environmental, social, and governance—as a reflection of the total ESG performance.
Figure 3 reports the results of the Kohonen map’s topology. Overall, we can infer that companies in the Higher ESG cluster seem to have more consistent sustainable behaviors, especially for the environmental and social dimensions. Additionally, despite very low scores for the other two pillars, we can see a higher governance score for several companies included in the Middle and Lower ESG clusters. This can be explained by the fact that several companies must follow specific regulations, governance, and compliance practices inherent to their business.
Figure 4 and Table 6 report that the SOM consistently found a three-clusters solution; however, some differences can be seen too. While in 2018, most of the sample companies (47.4%) belonged to the Higher ESG performance group, in 2021, this scenario changed drastically, with most of the sample companies (47.1%) entering the Lower ESG performance group. These findings are significant because they suggest that during the COVID-19 pandemic, the ESG behavior of emerging-market companies changed.
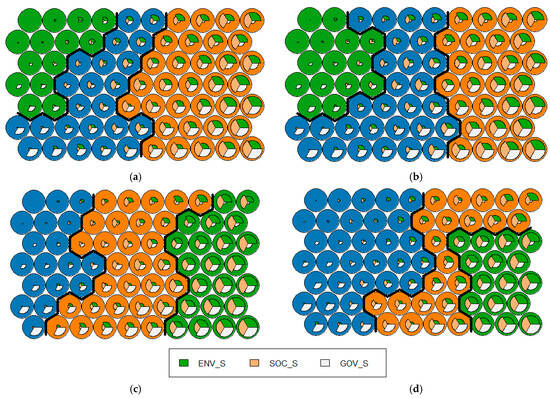
Figure 4.
Kohonen maps for E, S, and G performance. (a) 2018. (b) 2019. (c) 2020. (d) 2021. Note: Figure 4 presents the Kohonen maps for the sample companies’ E, S, and G performance during the period of 2018–2021. The maps reveal the existence of three distinguishable clusters and show the nodes’ weight vector. The fan in each node indicates the variables of prominence that link the datapoints assigned to the neuron. The Higher ESG performance cluster is on the right, the Middle ESG performance cluster is in the Middle, and the Lower ESG performance cluster is on the left.
Table 6.
Cluster size by number of companies.
In Appendix F, we report the median for the clusters’ total ESG score, each ESG pillar score, and the ESG Combined score. Overall, the Lower ESG cluster achieves medians below the 25th percentile of the sample. In contrast, the Middle ESG cluster achieves medians below the 50th percentile of the sample, except for the governance pillar. The Higher ESG cluster achieve medians higher than the 75th percentile. However, it can be seen that, during the COVID-19 pandemic, the medians for the governance pillar in the Middle and Lower ESG clusters achieve values higher than the 50th and 25th percentiles of the sample, respectively, suggesting that during the global crisis the emerging-market companies strived to improve their governance performance. Additionally, in 2021, all variables in the Middle ESG cluster achieve medians above the 50th percentile of the sample. These results indicate that both social (SOC_S) and governance (GOV_S) performance medians are higher than the environment (ENV_S) performance at the level of each cluster, which suggests that emerging-market companies focus their ESG efforts on social and governance issues, rather than on environmental issues. This can be explained by the predominancy of best environmental performance in those companies that are seen as sensitive or as being more likely to cause damage to society and who therefore tend to disclose their ESG performance solely as a means of protecting their reputation [37]. However, our finding is somewhat different from Amosh and Khatib’s research, since they found that the COVID-19 pandemic exerts a positive impact on environmental and social performance, but it had a negative impact on governance performance.
Table 7 reports the contribution level of each ESG pillar for the clustering. The results show that, especially during the years of the COVID-19 pandemic, the environmental and social achievements are more diverse within the clustering solution when compared with the governance performance. This suggests that the environmental and social requests that companies must comply with may vary according to the economic sector or regulations and legislations of the country under study.
Table 7.
Characterizing clusters.
The quantization error, the topographic error, and the percentage of explained variance obtain the quality measures of the SOM. The quantization error determines the learning quality indicator [38], while the topographical error measures the projection quality of the map [39]. If the values of both errors are small, the SOM is assumed to have good quality. The percentage of explained variance is the share of total variance explained by the clustering. Thus, a higher result is better. Table 8 reports the results of these quality measures while taking into account the Kohonen map’s analysis of the ESG pillars. The results indicate that the accuracy of the map is satisfactory.
Table 8.
Quality measures of the SOM.
ESG controversies may positively impact firms’ value [40] and the value of firms’ stocks [41], which undermines the natural assumption that such controversies may negatively impact corporate financial results. This could be evidence of the notion that “there is no such thing as bad publicity” and that the positive impact is solely the result of increased corporate visibility. Thus, the analysis of ESG controversies is essential not only for mapping sustainable corporate behavior but also for understanding corporate financial results. Table 9 reports the Controversies Scores for each ESG cluster. The results indicate that approximately 90% of the emerging-market companies did not undergo any ESG controversies during the period under analysis. Most companies with controversies belong to the Higher ESG cluster, suggesting that companies with higher sustainable corporate performance are more susceptible to ESG controversies. Additionally, we observe a decrease in the percentage of companies with no ESG controversies from 2020 to 2021 but an increase compared to the years before the global crisis. This suggests that at the beginning of the COVID-19 pandemic, the sample companies were involved in a high number of ESG controversies but then quickly concentrated their efforts on mitigating these issues.
Table 9.
Controversies scores.
In Appendix D, we provide a detailed spread of companies at country and cluster level:
- The percentage of companies included in the Higher ESG cluster decreased yearly during the analysis period. In 2018, there were 18 countries in which the majority of companies fell within the Higher ESG cluster, whereas in 2021, this applied to only eight countries.
- Brazil, Chile, Colombia, Greece, Hungary, South Korea, Taiwan, and Turkey had the most companies included in the Higher ESG cluster from 2018 to 2021.
- The percentage of companies included in the Lower ESG cluster increased yearly during the analysis period. In 2018, there were four countries in which the majority of companies fell within the Lower ESG cluster, but, by 2021, this number had fallen to nine countries.
- Qatar was the only country in which the majority of companies fell within the Lower ESG cluster from 2018 to 2021, which can be explained by the fact that it was only in 2016 that the Qatar Stock Exchange joined the United Nations initiative on sustainable development and thereafter promoted ESG standards.
- Caution is advised when determining the national prevalence of a specific cluster, primarily because of the pronounced differences in the number of investigated companies from each country and certain countries’ specificities as regulations.
In Appendix E, we report the distribution of companies across economic sectors between the ESG clusters and show that it is only in the “Energy” sector that the majority of companies fell within the Higher ESG cluster from 2018 to 2021. A change in the behavior of ESG companies concerning the economic sectors can be seen in 2018, when almost all economic sectors, except “Academic and Educational Services”, “Healthcare”, and “Real Estate”, had the majority of their companies included in the Higher ESG cluster, while in 2021 the majority of companies were included in the Lower ESG cluster for all economic sectors. Thus, contrary to the findings of Iamandi et al. [6], we did not conclude that services-oriented economic sectors perform better or have a lower negative impact than production-oriented sectors in regard to environmental issues. These findings suggest that over the course of the COVID-19 pandemic, the ESG behavior concerning the economic sectors of emerging-market companies has changed.
4.3. Mapping the Thematic ESG Performance for the Emerging-Market Companies
We conducted the thematic ESG performance analysis for eight out of the ten main categories. Two ESG variables related to shareholders and management were eliminated because the information that companies provide regarding corporate governance issues may be very similar as the disclosure of such information tends to be mandatory and is therefore provided by most companies in their financial reports.
Figure 4 reports the Kohonen map topology results for the main ESG themes obtained by mapping the relationships between eight out of ten themes—Resource Use, Community, Emissions, Human Rights, CSR Strategy, Workforce, Product Responsibility, and Environmental Innovation. Table 10 reports a certain consistency between the ESG clusters, with most of the sample companies belonging to the Lower ESG performance group over the entirety of the period, except for 2020, in which the majority belonged to the Middle ESG performance group.
Table 10.
Cluster size by number of companies for the thematic ESG performance.
In Appendix F, we report the clusters median of the ten thematic ESG scores: overall. We observe similar behavior across all the periods under analysis for all variables, but the performances are heterogeneous. The results indicate that the Lower ESG cluster companies have a median zero for the Environmental Innovation and Human Rights themes, suggesting that those companies do not take any action related to these two topics. In contrast, sustainability themes associated with everyday operational activities (Resource Use, Emissions, and Workforce) and Community issues received more attention. We also show that the medians of each cluster of the variables Management and Shareholders are very similar, suggesting that the behavior concerning each of these variables is similar during the period under analysis. Additionally, during the COVID-19 pandemic, especially in 2021, the variables related to Resource Use, Emissions, Product Responsibility, Management, and CSR Strategy achieved considerably higher medians for the Lower ESG cluster. The behavior of emerging-market companies concerning the ten thematic ESG scores is different from those found for the European companies [6], especially in regard to the medians, which are lower for all three clusters. This finding indicates that European companies have better ESG performance at a thematic level, primarily in the Middle and Lower ESG clusters.
Figure 5 and Table 11 show that, overall, the employed variables differ to a reasonable extent between ESG paths. Resource Use, Emissions, and Human Rights differ the most within the three clusters because the sample companies belong to different economic sectors with different production patterns. Interestingly, as also found by [6], the Environmental Innovation and the Product Responsibility categories are the most similar among the grouping solutions.
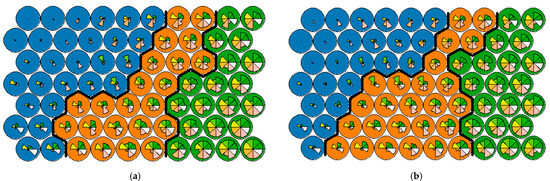
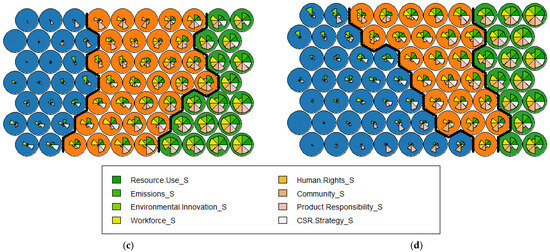
Figure 5.
Kohonen maps for main thematic ESG performance. (a) 2018. (b) 2019. (c) 2020. (d) 2021. Note: Figure 5 presents the Kohonen maps for the sample companies’ thematic ESG performances from 2018 to 2021. The maps suggest the existence of three distinguishable clusters and show the nodes’ weight vector. The fan in each node indicates the variables of prominence that link the data points assigned to the neuron. The Higher ESG performance cluster is on the right, the Middle ESG performance cluster is in the Middle, and the Lower ESG performance cluster is on the left.
Table 11.
Characterizing clusters.
Figure 5 reports the Kohonen map topology results for the main ESG themes obtained by mapping the relationships between eight out of ten themes—Resource Use, Community, Emissions, Human Rights, CSR Strategy, Workforce, Product Responsibility, and Environmental Innovation. Table 10 reports a certain consistency between the ESG clusters, with most of the sample companies belonging to the Lower ESG performance group over the entirety of the period, except for 2020, in which the majority belonged to the Middle ESG performance group.
Table 12 reports the results of these quality measures of the Kohonen maps, which is useful for the analysis of the thematic ESG performance and indicates that the accuracy of the map is satisfactory.
Table 12.
Quality measures of the SOM.
4.4. Mapping the Different Approaches of the ESG Performance for the Emerging-Market Companies
We also analyze the ESG performance in a four-folded strategic way proposed by [6]. The measures and detailed composition of these four ESG Views are presented in detail in Table 2. Table 13, meanwhile, reports the share of companies in each ESG cluster, from which we can see that the clustering distribution is very heterogeneous, suggesting no clear pattern connecting these strategic views. This indicates that emerging-market companies address distinct ESG topics according to their economic sector, country, everyday operational activities, particularities, and how they want to position themselves in the market in such a way as to improve their competitiveness.
Table 13.
The share of companies in each ESG cluster according to the four strategic views.
In Appendix F, we report the median for the clusters in regard to each ESG strategic view:
- ESG Stakeholder View: The medians within the Middle and Higher ESG clusters show that the sustainability efforts related to employees’ issues receive more attention, which is likely due to an acknowledgment of their decisive role in the organizational results. However, for the Lower cluster, the owner-related issues are preferred. Additionally, as the companies shift from Lower to Middle clusters, less attention is paid to owner-related issues, except for in 2020. These results suggest that it is in fact business (short-term) motivations that guide the companies as opposed to their desire to contribute positively to wider society.
- ESG Perspective View: The medians within each cluster show that emerging-market companies are addressing ESG internal and external issues, which suggests they understand the necessity to address sustainable actions in both directions. However, it is notable that there is a higher level of consideration for the inner-oriented sustainability firm issues than for the outer-oriented issues, especially for the Middle and Lower clusters.
- ESG Management-Level View: Interestingly, the emerging-market companies in the Lower and Middle clusters addressed more ESG strategic issues than operational and tactical issues, suggesting that they are trying to improve their sustainable behavior by concentrating on long-term sustainability matters. However, in the Higher cluster, the companies are more focused on operational issues yet remain interested in long-term strategic sustainability issues due to integrated competitive reasons.
- ESG Focus View: Overall, companies prefer to concentrate on sustainable communication-related issues in order to enhance their image through ESG involvement. The hierarchy within clusters between these three pillars is the same. The sustainable-oriented process is situated in the last position, suggesting that the sample companies do not concentrate their efforts or have difficulties implementing sustainable technologies and innovations.
Figure 6 and Table 14 show that the following ESG patterns are emphasized for the components that are good differentiators at the cluster level:
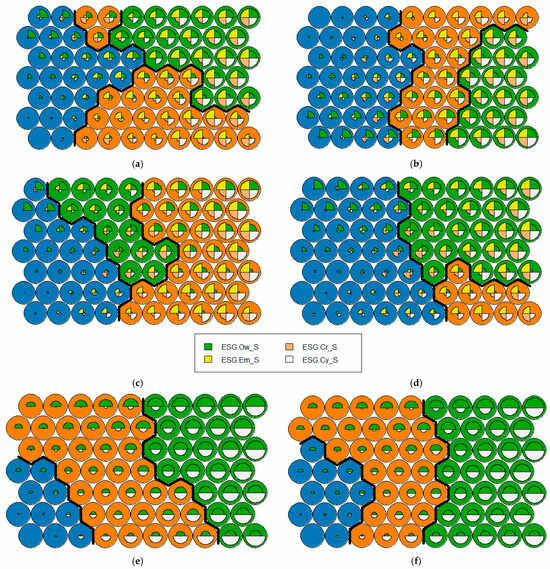
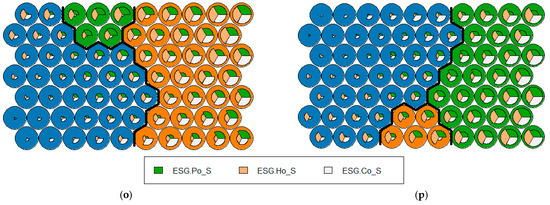
Figure 6.
Kohonen maps of the four-folded strategic ESG performance. (a) Stakeholder’s View—2018. (b) Stakeholder’s View—2019. (c) Stakeholder’s View—2020. (d) Stakeholder’s View—2021. (e) Perspective View—2018 (f) Perspective View—2019. (g) Perspective View—2020 (h) Perspective View—2021. (i) Management View—2018 (j) Management View—2019. (k) Management View—2020 (l) Management View—2021. (m) Focus View—2018. (n) Focus View—2019. (o) Focus View—2020. (p) Focus View—2021. Note: Figure 6 presents the Kohonen maps for the sample companies’ four-folded strategic ESG performances from 2018 to 2021. The maps suggest the existence of three distinguishable clusters and show the nodes’ weight vectors. The fan in each node indicates the variables of prominence that link the data points assigned to the neuron. The Higher ESG performance cluster is on the right, the Middle ESG performance cluster is in the Middle, and the Lower ESG performance cluster is on the left.
Table 14.
Characterizing clusters.
- From a Stakeholder’s View, between 2018 and 2020, the Community (ESG.Cy_S)-related issues differ the most across the three clusters, while Owner (ESG.Ow_S)-related topics are the most similar. This indicates that better ESG performers’ sustainable corporate behaviors were more guided by societal reasons than by purely business-based motivations, corroborating the idea that for an organization to be sustainable, it must adopt a strategy to generate a competitive advantage that is in line with societal expectations [42,43]. However, by 2021, this behavior had scarcely changed, and, despite the highest corporate sustainable contribution still being dedicated to Community (ESG.Cy_S)-related issues, more attention was focused on Owner (ESG.Ow_S)-related issues in the Higher ESG cluster, which may be due to the urge to protect shareholders and the company during the COVID-19 pandemic. These results corroborate [42] findings and indicate that the sample companies also considered stakeholders to be as crucial as their shareholders, even during periods of global crisis.
- From a Perspective View, the ESG internal-oriented (ESG.In_S) impact more effectively discriminates the sustainable corporate behaviors of the emerging-market companies. Integrating ESG in companies’ internal policies and operating practices may increase their competitiveness and enhance their economic and social performance [44,45]. This result is exactly the opposite of that found for the European companies in Iamandi et al.’s [6] research.
- From a Management View, ESG Operational (ESG.Op_S) and ESG Tactical (ESG.Ta_S) issues differ the most across the three clusters, indicating that companies with higher sustainable behavior prefer to concentrate on these topics in order to increase organizational efficiency and competitiveness. In contrast, European companies prefer to focus on ESG Strategic level (ESG.St_S).
- From a Focus View, the communication (ESG.Co_S) orientation variable differs the most across the three clusters during the COVID-19 pandemic, suggesting that preserving and projecting a good organizational image for companies in the Higher ESG cluster was a priority over process-oriented and human-oriented issues.
Table 15 reports the results of the quality measures of the Kohonen maps for the analysis of the four strategic views proposed by [6]. The results indicate that the accuracy of the map is suitable for all views.
Table 15.
Quality measures of the SOM.
The limitation of our results, beyond to our methodological choices, consists in a non-consideration of any control variables and economic/financial performance, since the purpose of the paper was to conduct an analysis based on ESG criteria only. Moreover, we also indicate a possible bias that can emerge from considering a different number of companies to each industry sector and across countries.
5. Conclusions
ESG-responsible firms enjoy advantages such as enhanced efficiency and competitiveness, reduced operating costs and financial risks, and increased corporate reputation and consumer trust. However, several features can influence the sustainability behavior of a company in national and organizational contexts. Despite their potential for ESG performance analysis, clustering techniques are rarely employed in empirical studies, especially when considering the emerging-market context; therefore, this paper attempts to fill this gap. To this end, we aimed to map the ESG patterns of emerging-market companies from 2018 to 2021 in order to analyze the corporate sustainable behavior of the sample companies and to determine whether the COVID-19 pandemic influenced this behavior. Thus, using the methodology proposed by [6], the environmental, social, and governance performances of these companies were assessed by employing the Self-Organizing Map for clustering purposes at three levels: (1) ESG overall level, including country and sectoral perspectives; (2) ESG main thematic level; and (3) ESG four-folded level (stakeholder, perspective, management, and focus views).
Our preliminary analysis shows that the emerging-market companies voluntarily reported their ESG performance range from 6.79% to 10.23% of all companies listed on the local stock market from 2018 to 2021. We also have evidence that the ESG transparency between the eleven economic sectors is still very low among the sample companies. Utilities, Energy, and Financial companies are the most involved in ESG reporting.
Our empirical results indicate the existence of three clusters on all Kohonen maps, confirming that the ESG emerging-market companies are grouped into three distinct groups according to their sustainable behavior. The relatively low number of achieved clusters indicates the strong cohesion, separation, and accuracy between corporate ESG behaviors at the emerging-market level, suggesting that each emerging-market company should consider a particular ESG approach considering its specificities and objectives, but in a common macroeconomic context.
We provide evidence that the medians for both social and governance performance are higher than the environmental performance at the level of each cluster, which suggests that emerging-market companies focus their ESG efforts on social and governance issues, rather than on environmental issues. This can be explained by the predominancy of best environmental performance in those companies that are seen as sensitive or more likely to cause damage to society, who tend to disclose their ESG performance to protect their reputation [37]. However, the environmental and social goals differ more acutely than the governance issues across clusters. This can be explained by the fact that several companies must follow specific governance and compliance regulations inherent to their business. Additionally, our results also indicate that approximately 90% of the emerging-market companies have not undergone any ESG controversies during the period under analysis. Most companies that did experience controversies fall within the Higher ESG cluster, suggesting that companies with higher sustainable corporate performance are more susceptible to ESG controversies.
The analyses of country-level ESG performance and that of eleven market-based economic sectors corroborate the geographic and sector dependence of ESG performance. The thematic-level analysis results also indicate that everyday operational activities (especially those related to Resource Use, Emissions, and Workforce) and community issues received more attention at cluster level. This suggests that emerging-market companies address distinct ESG topics according to their particularities, the way they want to position themselves in the market, and their competitiveness.
The results related to the ESG Stakeholder View show that emerging-market companies are more guided by business (short-term) motivations than by the desire to positively contribute to wider society, while community-related issues are shown to mor effectively discriminate the sustainable corporate behaviors of the sample companies. By contrast, companies with higher ESG performance are driven more by societal reasons than by purely business-based motivations. The results regarding the ESG Perspective View show that emerging-market companies are addressing ESG internal and external issues altogether. However, there is a higher consideration for the inner-oriented sustainability firm issues over the outer-oriented issues. The ESG Management-Level View results indicate that companies in the Lower and Middle clusters addressed more ESG strategic issues than operational and tactical issues, suggesting that they are trying to improve their sustainable behavior by concentrating on long-term sustainability issues. However, in the Higher cluster, the companies are more focused on operational matters yet remain interested in long-term strategic sustainability issues for integrated competitive reasons. The results related to the ESG Focus View show that, especially for the better ESG performers, emerging-market companies prefer to concentrate on sustainable communication-related issues in order to enhance their image through ESG involvement. Moreover, the variable related to the sustainable-oriented process received less attention, suggesting that the sample companies do not concentrate their efforts or have difficulties implementing sustainable technologies and innovations.
Our paper also indicates that the ESG behavior of emerging-market companies has changed over the course of the COVID-19 pandemic. First, we provide evidence that for most sample countries, the global crisis negatively influenced companies’ ability to persist with their ESG efforts. Indeed, the persistence of companies that were already engaged in reporting their ESG performance and continued to do so fell considerably in 2021. Second, the SOM shows that whereas in 2018 most of the sample companies (47.4%) fell within the Higher ESG performance group, by 2021 this scenario had changed drastically, with most of the sample companies (47.1%) belonging to the Lower ESG performance group. Third, the emerging-market companies strived to improve their governance performance, dedicating more attention to Owner (ESG.Ow_S)-related issues. A communication orientation (ESG.Co_S) was preferred to enhance the company image through ESG involvement. Fourth, we observe a decrease in the percentage of companies with no ESG controversies in 2020 to 2021, although there was an increase in the years before the global crisis, suggesting that at the beginning of the COVID-19 pandemic, the sample companies were involved in more ESG controversies but then started to concentrate their efforts in mitigating these issues.
Lastly, our empirical findings suggest that the Kohonen neural network is an exciting and useful tool for investors attempting to identify long-term socially responsible companies, for organizations interested in improving their ESG performance or comparing it to that of their peers, and for policy makers that want to better understand the sustainable corporate behavior required to successfully implement initiatives, regulations, and projects to aid towards their sustainability objectives.
Author Contributions
Conceptualization, B.R.G. and M.C.K.; methodology, B.R.G., M.C.K. and T.V.B.; software, B.R.G. and T.V.B.; validation, B.R.G., T.V.B., I.-S.R., I.C.C., C.-M.B. and T.C.; formal analysis, B.R.G.; investigation, B.R.G.; resources, T.V.B., I.-S.R., I.C.C., C.-M.B. and T.C.; data curation, B.R.G., M.C.K. and T.V.B.; writing—original draft preparation, B.R.G.; writing—review and editing, T.V.B.; visualization, B.R.G., M.C.K. and T.V.B.; supervision, M.C.K.; project administration, T.V.B.; funding acquisition, I.-S.R., I.C.C., C.-M.B. and T.C. All authors have read and agreed to the published version of the manuscript.
Funding
This work was carried out with the support of Conselho Nacional de Desenvolvimento Científico e Tecnológico (Brazilian National Council for Scientific and Technological Development—CNPq), grant number 303693/2022-3, Fundação Carlos Chagas Filho de Amparo à Pesquisa do Estado do Rio de Janeiro (Carlos Chagas Filho Foundation for Research Support in the State of Rio de Janeiro—FAPERJ), grant number E-26/201.015/2022 and Coordenação de Aperfeiçoamento de Pessoal de Nível Superior (Coordination for the Improvement of Higher Education Personel—Brasil/CAPES), Finance Code 001.
Data Availability Statement
The original contributions presented in the study are included in the article.
Conflicts of Interest
The authors declare no conflict of interest.
Appendix A. Sectoral Analysis of the ESG Reporting Degree
Table A1.
Sectoral analysis of the ESG reporting degree.
Table A1.
Sectoral analysis of the ESG reporting degree.
| Year | Indicator | Economic Sector | |||||||||||
|---|---|---|---|---|---|---|---|---|---|---|---|---|---|
| ACD | BMT | CCS | CNC | ENG | FIN | HLC | IND | RES | TEC | UTL | TOTAL | ||
| 2018 | No. of ESG reporting companies | 3 | 184 | 153 | 154 | 80 | 298 | 73 | 193 | 74 | 189 | 95 | 1499 |
| No. of total listed companies | 97 | 3093 | 3625 | 1710 | 550 | 2352 | 1471 | 4093 | 1262 | 3262 | 575 | 22,090 | |
| % of ESG reporting companies in total companies | 3.09 | 5.95 | 4.22 | 9.00 | 14.54 | 12.67 | 4.96 | 4.72 | 5.86 | 5.79 | 16.52 | 6.79 | |
| 2019 | No. of ESG reporting companies | 5 | 236 | 215 | 197 | 92 | 341 | 126 | 257 | 103 | 267 | 111 | 1950 |
| No. of total listed companies | 97 | 3093 | 3625 | 1710 | 550 | 2352 | 1471 | 4093 | 1262 | 3262 | 575 | 22,090 | |
| % of ESG reporting companies in total companies | 5.15 | 7.63 | 5.93 | 11.52 | 16.73 | 14.50 | 8.56 | 6.28 | 8.16 | 8.18 | 19.30 | 8.83 | |
| 2020 | No. of ESG reporting companies | 5 | 293 | 254 | 228 | 103 | 375 | 144 | 309 | 117 | 307 | 125 | 2260 |
| No. of total listed companies | 97 | 3093 | 3625 | 1710 | 550 | 2352 | 1471 | 4093 | 1262 | 3262 | 575 | 22,090 | |
| % of ESG reporting companies in total companies | 5.15 | 9.47 | 7.01 | 13.33 | 18.73 | 15.94 | 9.79 | 7.55 | 9.27 | 9.41 | 21.74 | 10.23 | |
| 2021 | No. of ESG reporting companies | 3 | 297 | 223 | 193 | 84 | 334 | 156 | 314 | 112 | 267 | 76 | 2059 |
| No. of total listed companies | 97 | 3093 | 3625 | 1710 | 550 | 2352 | 1471 | 4093 | 1262 | 3262 | 575 | 22,090 | |
| % of ESG reporting companies in total companies | 3.09 | 9.60 | 6.15 | 11.28 | 15.27 | 14.20 | 10.60 | 7.67 | 8.87 | 8.19 | 13.22 | 9.32 | |
Note: Considering the TR EIKON database, the eleven investigated economic sectors are: ACD= Academic and Educational Services, BMT = Basic Materials; CCS = Consumer Cyclicals; CNC = Consumer Non-Cyclicals; ENG = Energy; FIN = Financials; HLC = Healthcare; IND = Industrials; RES = Real State; TEC = Technology; UTL = Utilities.
Appendix B. Number of Sample Companies by Economic Sector and Country
Table A2.
Number of sample companies by economic sector and country.
Table A2.
Number of sample companies by economic sector and country.
| 2018 | |||||||||||||
|---|---|---|---|---|---|---|---|---|---|---|---|---|---|
| Country | Economic Sector | ||||||||||||
| ACD | BMT | CCS | CNC | ENG | FIN | HLC | IND | RES | TEC | UTL | TOTAL | % | |
| BR | 2 | 11 | 6 | 12 | 5 | 14 | 4 | 9 | 9 | 4 | 16 | 92 | 6.14 |
| CL | - | 4 | 4 | 6 | 3 | 7 | - | 5 | 2 | 2 | 9 | 42 | 2.80 |
| CN | - | 34 | 34 | 16 | 14 | 66 | 29 | 65 | 13 | 42 | 16 | 329 | 21.95 |
| CO | - | 2 | - | 2 | 2 | 8 | - | 2 | - | 1 | 4 | 21 | 1.40 |
| CZ * | - | - | - | - | - | 2 | - | - | - | - | 1 | 3 | 0.20 |
| EG | - | 2 | - | 1 | - | 3 | - | 1 | 1 | 2 | - | 10 | 0.67 |
| GR * | - | - | 3 | 2 | 2 | 10 | - | 5 | 1 | 1 | 5 | 29 | 1.93 |
| HU * | - | - | - | 1 | 1 | 1 | 1 | - | - | 1 | - | 5 | 0.33 |
| IN | - | 18 | 12 | 11 | 9 | 22 | 11 | 10 | 4 | 11 | 6 | 114 | 7.61 |
| ID | - | 7 | 5 | 7 | 6 | 6 | 1 | 2 | 4 | 4 | 1 | 43 | 2.87 |
| KW | - | - | - | ‘ | - | 5 | - | 1 | 2 | 2 | - | 11 | 0.73 |
| MY | - | 4 | 7 | 11 | 5 | 9 | 3 | 6 | 4 | 5 | 4 | 58 | 3.87 |
| MX | - | 9 | 7 | 12 | - | 10 | 1 | 7 | 3 | 1 | - | 50 | 3.34 |
| PE | - | 12 | 1 | 5 | - | 5 | - | 3 | - | - | 4 | 30 | 2.00 |
| PH | - | - | 2 | 7 | - | 4 | - | 1 | 5 | 2 | 5 | 26 | 1.73 |
| PO * | - | 6 | 2 | 3 | 4 | 12 | - | 4 | 1 | 4 | 4 | 40 | 2.67 |
| QA | - | 1 | - | 1 | 3 | 7 | - | - | 2 | 2 | 1 | 17 | 1.13 |
| RS* | - | 13 | 2 | 1 | 9 | 6 | - | 1 | 1 | 3 | 7 | 43 | 2.87 |
| SA | - | 10 | 1 | 2 | 2 | 13 | 1 | - | 2 | 2 | 1 | 34 | 2.27 |
| ZA | 1 | 23 | 13 | 18 | 1 | 21 | 4 | 11 | 12 | 9 | - | 113 | 7.54 |
| KR | - | 12 | 20 | 19 | 5 | 20 | 11 | 27 | - | 20 | 3 | 137 | 9.14 |
| TW | - | 12 | 20 | 5 | 1 | 17 | 3 | 19 | 2 | 61 | - | 140 | 9.34 |
| TH | - | 2 | 5 | 4 | 5 | 7 | 2 | 5 | 2 | 5 | 5 | 42 | 2.80 |
| TR | - | 5 | 9 | 6 | 3 | 14 | 2 | 8 | 1 | 3 | 3 | 54 | 3.60 |
| UA | - | - | - | 1 | - | 9 | - | 1 | 3 | 2 | - | 16 | 1.07 |
| TOTAL | 3 | 184 | 151 | 154 | 80 | 293 | 70 | 187 | 73 | 187 | 94 | 1499 | 100 |
| 2019 | |||||||||||||
| Country | Economic Sector | ||||||||||||
| ACD | BMT | CCS | CNC | ENG | FIN | HLC | IND | RES | TEC | UTL | TOTAL | % | |
| BR | 3 | 11 | 14 | 13 | 6 | 15 | 5 | 13 | 12 | 4 | 16 | 112 | 5.74 |
| CL | - | 4 | 4 | 5 | 3 | 7 | - | 5 | 3 | 2 | 9 | 42 | 2.15 |
| CN | 1 | 75 | 57 | 44 | 21 | 81 | 70 | 111 | 26 | 104 | 20 | 610 | 31.28 |
| CO | - | 2 | - | 2 | 2 | 8 | - | 2 | - | 1 | 3 | 20 | 1.03 |
| CZ * | - | - | - | - | - | 2 | - | - | - | - | 1 | 3 | 0.15 |
| EG | - | 2 | - | 1 | - | 3 | - | 1 | 1 | 2 | - | 10 | 0.51 |
| GR * | - | - | 3 | 2 | 2 | 8 | - | 5 | 1 | 1 | 5 | 27 | 1.38 |
| HU * | - | - | - | 1 | 1 | 1 | 1 | - | - | 1 | - | 5 | 0.26 |
| IN | - | 22 | 21 | 12 | 9 | 33 | 14 | 16 | 7 | 13 | 9 | 156 | 8.00 |
| ID | - | 8 | 6 | 7 | 6 | 6 | 1 | 2 | 4 | 5 | 1 | 46 | 2.36 |
| KW | - | - | - | 1 | - | 7 | - | 1 | 2 | 2 | - | 13 | 0.67 |
| MY | - | 3 | 8 | 13 | 6 | 9 | 4 | 6 | 4 | 5 | 4 | 62 | 3.18 |
| MX | - | 9 | 6 | 12 | 1 | 11 | 1 | 7 | 4 | 1 | - | 52 | 2.67 |
| PE | - | 12 | 1 | 5 | - | 5 | - | 3 | - | - | 4 | 30 | 1.54 |
| PH | - | - | 2 | 7 | - | 4 | - | 1 | 5 | 2 | 5 | 26 | 1.33 |
| PO * | - | 6 | 1 | 3 | 4 | 12 | - | 4 | 1 | 4 | 4 | 39 | 2.00 |
| QA | - | 1 | - | 2 | 3 | 8 | - | - | 2 | 2 | 1 | 19 | 0.97 |
| RS * | - | 13 | 2 | 1 | 9 | 6 | - | 1 | 1 | 3 | 7 | 43 | 2.21 |
| SA | - | 10 | 1 | 3 | 1 | 13 | 1 | 1 | 2 | 3 | 1 | 36 | 1.85 |
| ZA | 1 | 22 | 17 | 19 | 1 | 21 | 4 | 11 | 12 | 9 | - | 117 | 6.00 |
| KR | - | 14 | 25 | 20 | 4 | 23 | 14 | 30 | - | 23 | 3 | 156 | 8.00 |
| TW | - | 12 | 20 | 4 | 1 | 18 | 4 | 20 | 2 | 68 | - | 149 | 7.64 |
| TH | - | 4 | 16 | 10 | 9 | 16 | 5 | 8 | 10 | 7 | 15 | 100 | 5.13 |
| TR | - | 6 | 11 | 9 | 3 | 14 | 2 | 8 | 1 | 3 | 3 | 60 | 3.08 |
| UA | - | - | - | 1 | - | 10 | - | 1 | 3 | 2 | - | 17 | 0.87 |
| TOTAL | 5 | 232 | 213 | 197 | 92 | 335 | 123 | 251 | 100 | 265 | 110 | 1950 | 100 |
| 2020 | |||||||||||||
| Country | Economic Sector | ||||||||||||
| ACD | BMT | CCS | CNC | ENG | FIN | HLC | IND | RES | TEC | UTL | TOTAL | % | |
| BR | 2 | 12 | 14 | 15 | 6 | 14 | 6 | 13 | 12 | 4 | 17 | 115 | 5.09 |
| CL | - | 4 | 3 | 6 | 3 | 6 | - | 5 | 3 | 2 | 9 | 41 | 1.81 |
| CN | 1 | 115 | 83 | 57 | 27 | 93 | 84 | 153 | 30 | 132 | 28 | 803 | 35.53 |
| CO | - | 2 | - | 2 | 2 | 8 | - | 2 | - | 1 | 2 | 19 | 0.84 |
| CZ * | - | - | - | - | - | 2 | - | - | - | - | 1 | 3 | 0.13 |
| EG | - | 1 | 1 | 2 | 1 | 4 | - | 1 | 3 | 2 | - | 15 | 0.66 |
| GR * | - | - | 2 | 2 | 2 | 8 | - | 4 | 1 | 1 | 5 | 25 | 1.11 |
| HU * | - | - | 1 | 1 | 1 | 1 | 1 | - | - | 1 | - | 6 | 0.27 |
| IN | - | 23 | 23 | 13 | 9 | 34 | 14 | 16 | 6 | 16 | 11 | 165 | 7.30 |
| ID | - | 8 | 7 | 7 | 6 | 7 | 1 | 3 | 4 | 7 | 1 | 51 | 2.26 |
| KW | - | - | - | 1 | - | 9 | - | 2 | 2 | 2 | - | 16 | 0.71 |
| MY | - | 7 | 10 | 13 | 6 | 9 | 6 | 6 | 4 | 6 | 4 | 71 | 3.14 |
| MX | - | 8 | 7 | 12 | 1 | 9 | 1 | 7 | 4 | 1 | - | 50 | 2.21 |
| PE | - | 12 | 1 | 5 | - | 4 | - | 3 | - | - | 4 | 29 | 1.28 |
| PH | - | - | 3 | 8 | - | 4 | - | 1 | 5 | 2 | 6 | 29 | 1.28 |
| PO * | - | 6 | 2 | 3 | 4 | 12 | - | 3 | 1 | 4 | 4 | 39 | 1.73 |
| QA | - | 4 | 1 | 8 | 3 | 14 | 2 | 3 | 5 | 3 | 1 | 44 | 1.95 |
| RS * | - | 13 | 2 | 1 | 9 | 6 | - | 1 | 1 | 3 | 7 | 43 | 1.90 |
| SA | - | 11 | 1 | 3 | 2 | 14 | 2 | 1 | 2 | 3 | 2 | 41 | 1.81 |
| ZA | 1 | 22 | 17 | 19 | 1 | 21 | 4 | 11 | 13 | 9 | - | 118 | 5.22 |
| KR | - | 14 | 21 | 17 | 3 | 23 | 11 | 28 | - | 23 | 3 | 143 | 6.33 |
| TW | - | 13 | 21 | 4 | 1 | 18 | 5 | 20 | 2 | 69 | - | 153 | 6.77 |
| TH | - | 7 | 21 | 16 | 12 | 22 | 6 | 15 | 12 | 9 | 15 | 135 | 5.97 |
| TR | - | 10 | 13 | 12 | 3 | 19 | 1 | 9 | 4 | 5 | 5 | 81 | 3.58 |
| UA | 1 | 1 | - | 1 | 1 | 14 | - | 2 | 3 | 2 | - | 25 | 1.11 |
| TOTAL | 5 | 289 | 252 | 227 | 103 | 369 | 140 | 302 | 114 | 305 | 124 | 2260 | 100 |
| 2021 | |||||||||||||
| Country | Economic Sector | ||||||||||||
| ACD | BMT | CCS | CNC | ENG | FIN | HLC | IND | RES | TEC | UTL | TOTAL | % | |
| BR | - | 3 | 1 | 6 | 3 | 3 | 1 | 3 | 1 | 2 | 2 | 25 | 1.21 |
| CL | - | 3 | 1 | 3 | 2 | 5 | - | 5 | 2 | 2 | 4 | 27 | 1.31 |
| CN | 1 | 139 | 87 | 66 | 33 | 102 | 98 | 170 | 37 | 141 | 26 | 900 | 43.71 |
| CO | - | 1 | - | 2 | 1 | 4 | - | 1 | - | 1 | - | 10 | 0.49 |
| CZ * | - | - | - | - | - | 2 | - | - | - | - | - | 2 | 0.10 |
| EG | 1 | - | 3 | 3 | - | 4 | 3 | - | 3 | 1 | - | 18 | 0.87 |
| GR * | - | - | 1 | 2 | 1 | 3 | - | - | - | - | 2 | 9 | 0.44 |
| HU * | - | - | 1 | 1 | 1 | 1 | - | - | - | 1 | - | 5 | 0.24 |
| IN | - | 26 | 26 | 13 | 8 | 42 | 19 | 19 | 7 | 18 | 14 | 192 | 9.32 |
| ID | - | 3 | 4 | 1 | 5 | 18 | - | - | 3 | 3 | - | 37 | 1.80 |
| KW | - | - | - | 1 | 1 | 9 | - | 1 | 2 | 2 | - | 16 | 0.78 |
| MY | - | 36 | 28 | 30 | 13 | 16 | 12 | 54 | 26 | 25 | 4 | 244 | 11.85 |
| MX | - | 11 | 13 | 13 | 1 | 12 | 2 | 5 | 3 | 2 | - | 62 | 3.01 |
| PE | - | 8 | 1 | 1 | - | 3 | - | 3 | - | - | 2 | 18 | 0.87 |
| PH | - | - | 2 | 2 | - | 5 | - | - | - | 1 | 2 | 12 | 0.58 |
| PO * | - | 4 | 2 | 1 | - | 8 | - | - | 1 | 5 | 2 | 23 | 1.12 |
| QA | - | 3 | 1 | 5 | 1 | 8 | 2 | 3 | 4 | 3 | 1 | 31 | 1.51 |
| RS * | - | 7 | 1 | - | 1 | 2 | - | - | - | - | 1 | 12 | 0.58 |
| SA | - | 6 | 1 | 3 | 1 | 8 | 1 | 2 | 1 | 2 | - | 25 | 1.21 |
| ZA | 1 | 18 | 17 | 17 | 1 | 19 | 4 | 11 | 12 | 9 | - | 109 | 5.29 |
| KR | - | 2 | 2 | 1 | 1 | 3 | 2 | 3 | - | 1 | - | 15 | 0.73 |
| TW | - | 6 | 4 | 2 | 1 | 9 | 4 | 10 | - | 40 | - | 76 | 3.69 |
| TH | - | 10 | 16 | 12 | 4 | 12 | 6 | 14 | 6 | 4 | 8 | 92 | 4.47 |
| TR | - | 8 | 10 | 5 | 3 | 17 | - | 8 | 3 | 3 | 6 | 63 | 3.06 |
| UA | - | 3 | 1 | 3 | 2 | 19 | 2 | 2 | 1 | 1 | 2 | 36 | 1.75 |
| TOTAL | 3 | 294 | 221 | 192 | 84 | 325 | 152 | 308 | 110 | 265 | 75 | 2059 | 100 |
Note: Table A2. reports the number of sample companies by economic sector and country. The country names are represented by the TR EIKON Code, which are: BR = Brazil, CL = Chile, CN = China, CO = Colombia, CZ = Czech Republic, EG = Egypt, GR = Greece, HU = Hungary, IN = India, ID = Indonesia, KW = Kuwait, MY = Malaysia, MX = Mexico, PE = Peru, PH = Philippines, PO = Poland, and QA = Qatar. RS = Russia, SA = Saudi Arabia, ZA = South Africa, KR = South Korea, TW = Taiwan, TH = Thailand, TR = Turkey and UA = United Arab Emirates. Also considering the TR EIKON database, the eleven investigated economic sectors are: ACD = Academic and Educational Services, BMT = Basic Materials; CCS = Consumer Cyclicals; CNC = Consumer Non-Cyclicals; ENG = Energy; FIN = Financials; HLC = Healthcare; IND = Industrials; RES = Real State; TEC = Technology; UTL = Utilities. * Countries also considered in the Iamandi et al. (2019) [6] sample.
Appendix C. Descriptive Statistics of 2018, 2019, 2020 and 2021
Table A3.
Descriptive Statistics.
Table A3.
Descriptive Statistics.
| 2018 | |||||||||
|---|---|---|---|---|---|---|---|---|---|
| Variable | Min | Max | Mean | 25th Q | Median | 75th Q | SD | Skew | Kurtosis |
| ENV_S | 0.00 | 97.52 | 38.10 | 13.98 | 37.83 | 59.88 | 26.99 | 0.17 | −1.11 |
| SOC_S | 0.31 | 97.15 | 45.22 | 22.68 | 45.44 | 66.66 | 25.79 | −0.01 | −1.11 |
| GOV_S | 0.32 | 98.72 | 48.17 | 30.57 | 48.69 | 65.93 | 22.33 | −0.06 | −0.90 |
| ESG_S | 0.66 | 92.27 | 44.71 | 28.73 | 45.55 | 61.06 | 21.18 | −0.06 | −0.82 |
| ESG.Combined_S | 0.66 | 89.35 | 43.92 | 28.61 | 44.21 | 59.73 | 20.73 | −0.04 | −0.78 |
| ESG.Controversies_S | 1.32 | 100.00 | 95.26 | 100.00 | 100.00 | 100.00 | 16.67 | −3.82 | 14.26 |
| Resource.Use_S | 0.00 | 99.75 | 42.02 | 12.58 | 40.92 | 69.33 | 31.29 | 0.14 | −1.27 |
| Emissions_S | 0.00 | 99.83 | 44.25 | 14.71 | 45.74 | 72.10 | 31.79 | 0.02 | −1.30 |
| Environmental.Innovation_S | 0.00 | 99.69 | 24.58 | 0.00 | 2.72 | 50.00 | 30.07 | 0.84 | −0.69 |
| Workforce_S | 0.24 | 99.80 | 56.67 | 33.33 | 61.43 | 81.38 | 29.27 | −0.36 | −1.02 |
| Human.Rights_S | 0.00 | 98.20 | 30.73 | 0.00 | 19.81 | 59.91 | 32.84 | 0.61 | −1.11 |
| Community_S | 0.70 | 99.86 | 45.39 | 15.11 | 40.13 | 76.75 | 31.99 | 0.22 | −1.44 |
| Product.Responsibility_S | 0.00 | 99.93 | 46.71 | 16.78 | 46.67 | 77.44 | 33.36 | −0.05 | −1.33 |
| Management_S | 0.02 | 99.64 | 48.78 | 24.10 | 48.93 | 72.90 | 28.51 | 0.02 | −1.19 |
| Shareholders_S | 0.13 | 99.87 | 49.70 | 24.69 | 50.00 | 74.82 | 28.83 | 0.01 | −1.20 |
| CSR.Strategy_S | 0.00 | 99.54 | 42.85 | 11.59 | 43.02 | 71.74 | 32.08 | 0.11 | −1.33 |
| ESG.Ow_S | 0.40 | 98.73 | 49.02 | 30.76 | 49.87 | 67.75 | 23.66 | −0.03 | −0.93 |
| ESG.Em_S | 0.24 | 99.80 | 56.67 | 33.33 | 61.43 | 81.38 | 29.27 | −0.36 | −1.02 |
| ESG.Cr_S | 0.00 | 96.26 | 33.15 | 11.84 | 29.52 | 53.10 | 25.96 | 0.46 | −0.83 |
| ESG.Cy_S | 0.20 | 96.26 | 42.19 | 18.69 | 42.51 | 64.35 | 26.84 | 0.05 | −1.17 |
| ESG.S_S | 0.88 | 91.88 | 44.74 | 29.60 | 45.38 | 60.88 | 20.86 | −0.10 | −0.81 |
| ESG.In_S | 1.42 | 96.29 | 51.10 | 37.60 | 51.94 | 67.27 | 20.75 | −0.30 | −0.52 |
| ESG.Ex_S | 0.15 | 94.88 | 39.19 | 18.35 | 39.19 | 58.60 | 24.55 | 0.12 | −1.05 |
| ESG.P_S | 0.88 | 91.88 | 44.74 | 29.60 | 45.38 | 60.88 | 20.86 | −0.10 | −0.81 |
| ESG.St_S | 0.65 | 98.31 | 47.08 | 29.32 | 47.00 | 65.63 | 23.39 | 0.00 | −0.86 |
| ESG.Ta_S | 0.94 | 93.66 | 45.11 | 29.94 | 46.39 | 60.79 | 21.04 | −0.08 | −0.68 |
| ESG.Op_S | 0.00 | 97.43 | 42.26 | 17.90 | 43.32 | 64.67 | 27.55 | 0.05 | −1.19 |
| ESG.ML_S | 0.88 | 91.88 | 44.74 | 29.60 | 45.38 | 60.88 | 20.86 | −0.10 | −0.81 |
| ESG.Po_S | 0.00 | 96.39 | 38.92 | 16.35 | 38.47 | 58.49 | 25.40 | 0.13 | −1.05 |
| ESG.Ho_S | 1.42 | 97.80 | 49.93 | 36.35 | 50.64 | 65.73 | 20.70 | −0.20 | −0.53 |
| ESG.Co_S | 1.72 | 98.95 | 70.42 | 59.02 | 70.15 | 81.80 | 14.38 | −0.18 | −0.22 |
| ESG.F_S | 3.21 | 89.84 | 50.52 | 37.23 | 50.93 | 64.93 | 18.27 | −0.09 | −0.80 |
| 2019 | |||||||||
| Variable | Min | Max | Mean | 25th Q | Median | 75th Q | SD | Skew | Kurtosis |
| ENV_S | 0.00 | 97.26 | 36.80 | 12.72 | 34.64 | 58.47 | 26.84 | 0.25 | −1.08 |
| SOC_S | 0.34 | 97.20 | 43.47 | 20.46 | 43.22 | 64.70 | 25.90 | 0.10 | −1.12 |
| GOV_S | 0.16 | 97.62 | 48.42 | 30.23 | 48.49 | 66.59 | 22.14 | −0.04 | −0.94 |
| ESG_S | 0.72 | 94.30 | 43.60 | 26.97 | 42.82 | 59.63 | 20.91 | 0.09 | −0.86 |
| ESG.Combined_S | 0.72 | 94.30 | 42.76 | 26.76 | 41.79 | 57.74 | 20.34 | 0.11 | −0.81 |
| ESG.Controversies_S | 0.77 | 100.00 | 95.44 | 100.00 | 100.00 | 100.00 | 16.51 | −3.92 | 14.86 |
| Resource.Use_S | 0.00 | 99.85 | 40.49 | 10.18 | 38.58 | 66.77 | 31.23 | 0.21 | −1.25 |
| Emissions_S | 0.00 | 99.86 | 42.30 | 12.52 | 40.90 | 70.30 | 31.72 | 0.12 | −1.28 |
| Environmental.Innovation_S | 0.00 | 99.72 | 24.28 | 0.00 | 3.79 | 50.00 | 29.61 | 0.85 | −0.64 |
| Workforce_S | 0.20 | 99.90 | 54.68 | 30.84 | 57.36 | 80.13 | 29.14 | −0.23 | −1.12 |
| Human.Rights_S | 0.00 | 98.20 | 29.60 | 0.00 | 17.57 | 56.67 | 32.22 | 0.67 | −1.01 |
| Community_S | 0.53 | 99.88 | 43.56 | 14.55 | 35.06 | 74.12 | 31.71 | 0.31 | −1.40 |
| Product.Responsibility_S | 0.00 | 99.93 | 45.42 | 15.48 | 45.49 | 75.75 | 33.05 | 0.02 | −1.32 |
| Management_S | 0.02 | 99.78 | 48.85 | 24.22 | 48.73 | 73.08 | 28.56 | 0.03 | −1.19 |
| Shareholders_S | 0.32 | 99.93 | 50.40 | 25.25 | 50.52 | 75.34 | 28.89 | −0.02 | −1.21 |
| CSR.Strategy_S | 0.00 | 99.74 | 43.34 | 13.54 | 43.84 | 72.09 | 31.68 | 0.11 | −1.29 |
| ESG.Ow_S | 0.19 | 98.56 | 49.25 | 29.80 | 49.51 | 68.76 | 23.69 | −0.03 | −0.99 |
| ESG.Em_S | 0.20 | 99.90 | 54.68 | 30.84 | 57.36 | 80.13 | 29.14 | −0.23 | −1.12 |
| ESG.Cr_S | 0.00 | 98.17 | 32.47 | 12.13 | 28.23 | 52.55 | 25.56 | 0.50 | −0.78 |
| ESG.Cy_S | 0.18 | 96.20 | 40.75 | 16.76 | 40.10 | 62.78 | 26.87 | 0.15 | −1.17 |
| ESG.S_S | 1.02 | 93.80 | 43.77 | 27.45 | 43.25 | 59.16 | 20.55 | 0.06 | −0.85 |
| ESG.In_S | 1.18 | 95.08 | 50.58 | 36.30 | 51.20 | 66.21 | 20.24 | −0.16 | −0.57 |
| ESG.Ex_S | 0.14 | 95.36 | 37.83 | 15.78 | 36.29 | 57.88 | 24.59 | 0.21 | −1.06 |
| ESG.P_S | 1.02 | 93.80 | 43.77 | 27.45 | 43.25 | 59.16 | 20.55 | 0.06 | −0.85 |
| ESG.St_S | 0.49 | 97.92 | 46.74 | 28.64 | 46.20 | 64.25 | 22.75 | 0.07 | −0.85 |
| ESG.Ta_S | 0.73 | 97.65 | 44.20 | 28.53 | 44.16 | 59.01 | 20.72 | 0.08 | −0.70 |
| ESG.Op_S | 0.00 | 95.93 | 40.68 | 15.41 | 39.75 | 63.53 | 27.57 | 0.14 | −1.19 |
| ESG.ML_S | 1.02 | 93.80 | 43.77 | 27.45 | 43.25 | 59.16 | 20.55 | 0.06 | −0.85 |
| ESG.Po_S | 0.00 | 96.37 | 37.63 | 15.02 | 36.84 | 57.89 | 25.32 | 0.21 | −1.04 |
| ESG.Ho_S | 1.18 | 97.79 | 49.26 | 35.06 | 49.18 | 64.32 | 20.25 | −0.06 | −0.58 |
| ESG.Co_S | 14.25 | 99.41 | 70.04 | 59.10 | 69.22 | 81.15 | 13.95 | −0.07 | −0.31 |
| ESG.F_S | 12.34 | 94.51 | 49.69 | 35.45 | 49.14 | 63.21 | 17.91 | 0.07 | −0.84 |
| 2020 | |||||||||
| Variable | Min | Max | Mean | 25th Q | Median | 75th Q | SD | Skew | Kurtosis |
| ENV_S | 0.00 | 98.28 | 38.23 | 14.64 | 36.14 | 60.26 | 26.99 | 0.21 | −1.09 |
| SOC_S | 0.35 | 98.36 | 44.40 | 21.29 | 44.00 | 66.11 | 25.93 | 0.09 | −1.15 |
| GOV_S | 0.56 | 95.44 | 49.56 | 32.38 | 49.74 | 67.36 | 21.70 | −0.04 | −0.95 |
| ESG_S | 1.27 | 93.60 | 44.68 | 28.04 | 44.29 | 60.99 | 20.78 | 0.05 | −0.90 |
| ESG.Combined_S | 1.27 | 92.79 | 43.79 | 27.96 | 43.18 | 59.24 | 20.13 | 0.07 | −0.83 |
| ESG.Controversies_S | 0.98 | 100.00 | 94.76 | 100.00 | 100.00 | 100.00 | 16.74 | −3.51 | 11.96 |
| Resource.Use_S | 0.00 | 99.87 | 42.11 | 11.80 | 40.96 | 69.31 | 31.57 | 0.14 | −1.29 |
| Emissions_S | 0.00 | 99.89 | 43.77 | 16.09 | 42.74 | 71.09 | 31.45 | 0.08 | −1.26 |
| Environmental.Innovation_S | 0.00 | 99.76 | 25.80 | 0.00 | 7.48 | 50.00 | 30.55 | 0.78 | −0.78 |
| Workforce_S | 0.24 | 99.93 | 54.70 | 30.12 | 57.33 | 80.72 | 29.24 | −0.20 | −1.17 |
| Human.Rights_S | 0.00 | 97.50 | 30.75 | 0.00 | 18.26 | 59.48 | 32.50 | 0.62 | −1.09 |
| Community_S | 0.00 | 99.94 | 44.79 | 17.26 | 37.37 | 74.08 | 30.72 | 0.30 | −1.35 |
| Product.Responsibility_S | 0.00 | 99.94 | 47.36 | 20.42 | 46.12 | 76.62 | 32.54 | −0.02 | −1.29 |
| Management_S | 0.27 | 99.71 | 50.07 | 25.70 | 50.00 | 74.43 | 28.35 | 0.00 | −1.19 |
| Shareholders_S | 0.05 | 99.95 | 51.22 | 26.66 | 52.03 | 75.72 | 28.52 | −0.03 | −1.20 |
| CSR.Strategy_S | 0.00 | 99.94 | 44.58 | 15.99 | 43.06 | 72.83 | 31.19 | 0.08 | −1.28 |
| ESG.Ow_S | 0.69 | 97.66 | 50.37 | 31.14 | 50.60 | 69.21 | 23.13 | −0.04 | −0.96 |
| ESG.Em_S | 0.24 | 99.93 | 54.70 | 30.12 | 57.33 | 80.72 | 29.24 | −0.20 | −1.17 |
| ESG.Cr_S | 0.00 | 97.66 | 34.15 | 12.57 | 30.34 | 54.15 | 25.78 | 0.47 | −0.80 |
| ESG.Cy_S | 0.00 | 96.65 | 42.15 | 18.09 | 41.97 | 64.42 | 26.82 | 0.10 | −1.19 |
| ESG.S_S | 1.68 | 94.08 | 44.93 | 28.50 | 44.87 | 61.18 | 20.48 | 0.03 | −0.89 |
| ESG.In_S | 2.18 | 94.99 | 51.32 | 36.72 | 51.66 | 66.59 | 19.94 | −0.14 | −0.65 |
| ESG.Ex_S | 0.00 | 98.05 | 39.34 | 17.73 | 38.90 | 58.76 | 24.61 | 0.18 | −1.04 |
| ESG.P_S | 1.68 | 94.08 | 44.93 | 28.50 | 44.87 | 61.18 | 20.48 | 0.03 | −0.89 |
| ESG.St_S | 0.62 | 98.39 | 47.97 | 29.86 | 47.85 | 65.19 | 22.34 | 0.00 | −0.90 |
| ESG.Ta_S | 1.06 | 96.21 | 44.85 | 28.49 | 44.36 | 60.01 | 20.89 | 0.10 | −0.74 |
| ESG.Op_S | 0.00 | 98.29 | 42.25 | 16.98 | 41.57 | 65.26 | 27.53 | 0.09 | −1.19 |
| ESG.ML_S | 1.68 | 94.08 | 44.93 | 28.50 | 44.87 | 61.18 | 20.48 | 0.03 | −0.89 |
| ESG.Po_S | 0.00 | 98.10 | 39.23 | 17.60 | 39.13 | 59.19 | 25.38 | 0.17 | −1.02 |
| ESG.Ho_S | 2.18 | 97.30 | 49.99 | 35.37 | 49.73 | 64.85 | 19.99 | −0.05 | −0.65 |
| ESG.Co_S | 18.66 | 99.40 | 70.29 | 59.77 | 69.59 | 80.70 | 13.54 | 0.00 | −0.48 |
| ESG.F_S | 8.11 | 94.76 | 50.63 | 36.56 | 50.80 | 64.52 | 17.78 | 0.03 | −0.85 |
| 2021 | |||||||||
| Variable | Min | Max | Mean | 25th Q | Median | 75th Q | SD | Skew | Kurtosis |
| ENV_S | 0.00 | 98.76 | 37.02 | 14.76 | 34.11 | 57.48 | 25.94 | 0.30 | −0.97 |
| SOC_S | 0.75 | 98.67 | 42.60 | 21.19 | 40.04 | 62.08 | 24.91 | 0.27 | −0.99 |
| GOV_S | 1.01 | 95.77 | 50.98 | 34.10 | 50.99 | 68.32 | 21.12 | −0.06 | −0.98 |
| ESG_S | 2.59 | 91.88 | 43.91 | 28.15 | 42.67 | 58.26 | 19.65 | 0.21 | −0.80 |
| ESG.Combined_S | 2.59 | 91.88 | 43.36 | 28.02 | 42.06 | 57.21 | 19.21 | 0.22 | −0.75 |
| ESG.Controversies_S | 0.83 | 100.00 | 97.09 | 100.00 | 100.00 | 100.00 | 12.99 | −5.02 | 26.00 |
| Resource.Use_S | 0.00 | 99.88 | 41.01 | 12.35 | 38.92 | 67.11 | 30.62 | 0.22 | −1.22 |
| Emissions_S | 0.00 | 99.89 | 42.68 | 16.67 | 40.75 | 68.43 | 30.29 | 0.15 | −1.18 |
| Environmental.Innovation_S | 0.00 | 99.24 | 24.46 | 0.00 | 0.00 | 50.00 | 29.98 | 0.85 | −0.66 |
| Workforce_S | 0.41 | 99.90 | 53.04 | 27.41 | 54.50 | 77.11 | 28.17 | −0.05 | −1.22 |
| Human.Rights_S | 0.00 | 97.16 | 27.85 | 0.00 | 15.96 | 50.31 | 31.50 | 0.83 | −0.71 |
| Community_S | 0.00 | 99.91 | 43.28 | 17.50 | 34.09 | 70.89 | 29.75 | 0.41 | −1.24 |
| Product.Responsibility_S | 0.00 | 99.90 | 46.60 | 22.06 | 44.21 | 74.53 | 31.63 | 0.04 | −1.24 |
| Management_S | 0.27 | 99.81 | 51.73 | 27.71 | 52.13 | 76.24 | 28.19 | −0.06 | −1.19 |
| Shareholders_S | 0.14 | 99.95 | 51.64 | 27.14 | 52.63 | 75.58 | 28.08 | −0.05 | −1.19 |
| CSR.Strategy_S | 0.00 | 99.95 | 46.22 | 20.29 | 46.15 | 73.62 | 30.26 | 0.05 | −1.24 |
| ESG.Ow_S | 1.14 | 98.12 | 51.71 | 33.40 | 52.27 | 70.38 | 22.63 | −0.07 | −0.98 |
| ESG.Em_S | 0.41 | 99.90 | 53.04 | 27.41 | 54.50 | 77.11 | 28.17 | −0.05 | −1.22 |
| ESG.Cr_S | 0.00 | 99.18 | 33.03 | 12.52 | 28.70 | 51.77 | 24.81 | 0.56 | −0.63 |
| ESG.Cy_S | 0.00 | 96.29 | 41.08 | 19.16 | 39.21 | 61.42 | 25.66 | 0.25 | −1.05 |
| ESG.S_S | 2.45 | 91.14 | 44.37 | 28.47 | 43.27 | 58.82 | 19.33 | 0.17 | −0.82 |
| ESG.In_S | 1.22 | 96.24 | 51.64 | 37.41 | 51.58 | 66.12 | 19.00 | −0.05 | −0.67 |
| ESG.Ex_S | 0.00 | 97.56 | 38.02 | 17.99 | 35.87 | 55.62 | 23.29 | 0.33 | −0.85 |
| ESG.P_S | 2.45 | 91.14 | 44.37 | 28.47 | 43.27 | 58.82 | 19.33 | 0.17 | −0.82 |
| ESG.St_S | 1.17 | 97.01 | 48.83 | 31.94 | 48.84 | 64.92 | 21.56 | 0.04 | −0.83 |
| ESG.Ta_S | 0.92 | 95.65 | 43.71 | 27.68 | 42.91 | 57.86 | 19.86 | 0.20 | −0.70 |
| ESG.Op_S | 0.00 | 98.04 | 40.99 | 18.32 | 39.19 | 62.86 | 26.19 | 0.22 | −1.08 |
| ESG.ML_S | 2.45 | 91.14 | 44.37 | 28.47 | 43.27 | 58.82 | 19.33 | 0.17 | −0.82 |
| ESG.Po_S | 0.00 | 97.91 | 38.13 | 17.85 | 36.48 | 56.70 | 24.11 | 0.28 | −0.88 |
| ESG.Ho_S | 1.22 | 95.87 | 49.87 | 35.53 | 49.26 | 63.70 | 19.02 | 0.05 | −0.64 |
| ESG.Co_S | 20.57 | 99.07 | 71.30 | 61.12 | 70.34 | 81.23 | 12.90 | 0.08 | −0.48 |
| ESG.F_S | 13.33 | 92.15 | 50.40 | 36.49 | 49.60 | 63.23 | 16.90 | 0.17 | −0.80 |
Note: Table A3. reports the descriptive statistics of the ESG variables considered in this paper. The columns’ results correspond to minimum, maximum, mean, first quartile, median, fourth quartile, standard deviation, skewness, and kurtosis.
Appendix D. Number of Companies across Sample Countries between the ESG Clusters
Table A4.
Number of companies across sample countries between the ESG clusters.
Table A4.
Number of companies across sample countries between the ESG clusters.
| 2018 | Kohonen SOM Cluster Solution | |||||
|---|---|---|---|---|---|---|
| Higher ESG | Middle ESG | Lower ESG | ||||
| Country | Count | % Within Country | Count | % Within Country | Count | % Within Country |
| BR | 54 | 58.70% | 25 | 27.17% | 13 | 14.13% |
| CL | 20 | 47.62% | 9 | 21.43% | 13 | 30.95% |
| CN | 63 | 19.15% | 153 | 46.50% | 113 | 34.35% |
| CO | 13 | 61.90% | 8 | 38.10% | - | 0.00% |
| CZ * | 1 | 33.33% | 2 | 66.67% | - | 0.00% |
| EG | 3 | 30.00% | 2 | 20.00% | 5 | 50.00% |
| GR * | 14 | 48.28% | 7 | 24.14% | 8 | 27.59% |
| HU * | 3 | 60.00% | 1 | 20.00% | 1 | 20.00% |
| IN | 72 | 63.16% | 33 | 28.95% | 9 | 7.89% |
| ID | 19 | 44.19% | 17 | 39.53% | 7 | 16.28% |
| KW | 3 | 27.27% | 4 | 36.36% | 4 | 36.36% |
| MY | 40 | 68.97% | 15 | 25.86% | 3 | 5.17% |
| MX | 28 | 56.00% | 11 | 22.00% | 11 | 22.00% |
| PE | 11 | 36.67% | 9 | 30.00% | 10 | 33.33% |
| PH | 12 | 46.15% | 9 | 34.62% | 5 | 19.23% |
| PO * | 17 | 42.50% | 16 | 40.00% | 7 | 17.50% |
| QA | 1 | 5.88% | 7 | 41.18% | 9 | 52.94% |
| RS * | 21 | 48.84% | 14 | 32.56% | 8 | 18.60% |
| SA | 7 | 20.59% | 9 | 26.47% | 18 | 52.94% |
| ZA | 69 | 61.06% | 34 | 30.09% | 10 | 8.85% |
| KR | 71 | 51.82% | 24 | 17.52% | 42 | 30.66% |
| TW | 100 | 71.43% | 23 | 16.43% | 17 | 12.14% |
| TH | 29 | 69.05% | 12 | 28.57% | 1 | 2.38% |
| TR | 36 | 66.67% | 12 | 22.22% | 6 | 11.11% |
| UA | 4 | 25.00% | 5 | 31.25% | 7 | 43.75% |
| Total | 711 | - | 461 | - | 327 | - |
| 2019 | Kohonen SOM Cluster Solution | |||||
| Higher ESG | Middle ESG | Lower ESG | ||||
| Country | Count | % Within Country | Count | % Within Country | Count | % Within Country |
| BR | 57 | 50.89% | 27 | 24.11% | 28 | 25.00% |
| CL | 22 | 52.38% | 9 | 21.43% | 11 | 26.19% |
| CN | 86 | 14.10% | 302 | 49.51% | 222 | 36.39% |
| CO | 13 | 65.00% | 7 | 35.00% | - | 0.00% |
| CZ * | 2 | 66.67% | 1 | 33.33% | - | 0.00% |
| EG | 2 | 20.00% | 2 | 20.00% | 6 | 60.00% |
| GR * | 13 | 48.15% | 8 | 29.63% | 6 | 22.22% |
| HU * | 3 | 60.00% | 1 | 20.00% | 1 | 20.00% |
| IN | 74 | 47.44% | 64 | 41.03% | 18 | 11.54% |
| ID | 18 | 39.13% | 19 | 41.30% | 9 | 19.57% |
| KW | 3 | 23.08% | 3 | 23.08% | 7 | 53.85% |
| MY | 38 | 61.29% | 20 | 32.26% | 4 | 6.45% |
| MX | 24 | 46.15% | 21 | 40.38% | 7 | 13.46% |
| PE | 10 | 33.33% | 15 | 50.00% | 5 | 16.67% |
| PH | 10 | 38.46% | 14 | 53.85% | 2 | 7.69% |
| PO * | 16 | 41.03% | 18 | 46.15% | 5 | 12.82% |
| QA | 1 | 5.26% | 8 | 42.11% | 10 | 52.63% |
| RS * | 21 | 48.84% | 19 | 44.19% | 3 | 6.98% |
| SA | 5 | 13.89% | 16 | 44.44% | 15 | 41.67% |
| ZA | 59 | 50.43% | 43 | 36.75% | 15 | 12.82% |
| KR | 75 | 48.08% | 30 | 19.23% | 51 | 32.69% |
| TW | 97 | 65.10% | 39 | 26.17% | 13 | 8.72% |
| TH | 41 | 41.00% | 40 | 40.00% | 19 | 19.00% |
| TR | 39 | 65.00% | 15 | 25.00% | 6 | 10.00% |
| UA | 3 | 17.65% | 6 | 35.29% | 8 | 47.06% |
| Total | 732 | - | 747 | -- | 471 | - |
| 2020 | Kohonen SOM Cluster Solution | |||||
| Higher ESG | Middle ESG | Lower ESG | ||||
| Country | Count | % Within Country | Count | % Within Country | Count | % Within Country |
| BR | 51 | 44.35% | 42 | 36.52% | 22 | 19.13% |
| CL | 21 | 51.22% | 14 | 34.15% | 6 | 14.63% |
| CN | 92 | 11.46% | 323 | 40.22% | 388 | 48.32% |
| CO | 11 | 57.89% | 7 | 36.84% | 1 | 5.26% |
| CZ * | 1 | 33.33% | 2 | 66.67% | - | 0.00% |
| EG | 3 | 20.00% | 6 | 40.00% | 6 | 40.00% |
| GR * | 12 | 48.00% | 8 | 32.00% | 5 | 20.00% |
| HU* | 3 | 50.00% | 1 | 16.67% | 2 | 33.33% |
| IN | 64 | 38.79% | 87 | 52.73% | 14 | 8.48% |
| ID | 16 | 31.37% | 24 | 47.06% | 11 | 21.57% |
| KW | 2 | 12.50% | 7 | 43.75% | 7 | 43.75% |
| MY | 34 | 47.89% | 33 | 46.48% | 4 | 5.63% |
| MX | 22 | 44.00% | 22 | 44.00% | 6 | 12.00% |
| PE | 10 | 34.48% | 13 | 44.83% | 6 | 20.69% |
| PH | 7 | 24.14% | 19 | 65.52% | 3 | 10.34% |
| PO * | 12 | 30.77% | 22 | 56.41% | 5 | 12.82% |
| QA | 1 | 2.27% | 5 | 11.36% | 38 | 86.36% |
| RS * | 18 | 41.86% | 18 | 41.86% | 7 | 16.28% |
| SA | 6 | 14.63% | 10 | 24.39% | 25 | 60.98% |
| ZA | 49 | 41.53% | 56 | 47.46% | 13 | 11.02% |
| KR | 74 | 51.75% | 29 | 20.28% | 40 | 27.97% |
| TW | 95 | 62.09% | 41 | 26.80% | 17 | 11.11% |
| TH | 50 | 37.04% | 57 | 42.22% | 28 | 20.74% |
| TR | 56 | 69.14% | 18 | 22.22% | 7 | 8.64% |
| UA | 4 | 16.00% | 11 | 44.00% | 10 | 40.00% |
| Total | 714 | - | 875 | - | 671 | - |
| 2021 | Kohonen SOM Cluster Solution | |||||
| Higher ESG | Middle ESG | Lower ESG | ||||
| Country | Count | % Within Country | Count | % Within Country | Count | % Within Country |
| BR | 15 | 60.00% | 7 | 28.00% | 3 | 12.00% |
| CL | 13 | 48.15% | 9 | 33.33% | 5 | 18.52% |
| CN | 103 | 11.44% | 222 | 24.67% | 575 | 63.89% |
| CO | 5 | 50.00% | 4 | 40.00% | 1 | 10.00% |
| CZ * | 0.00% | 1 | 50.00% | 1 | 50.00% | |
| EG | 1 | 5.56% | 2 | 11.11% | 15 | 83.33% |
| GR * | 5 | 55.56% | 1 | 11.11% | 3 | 33.33% |
| HU * | 3 | 60.00% | 0.00% | 2 | 40.00% | |
| IN | 63 | 32.81% | 81 | 42.19% | 48 | 25.00% |
| ID | 12 | 32.43% | 10 | 27.03% | 15 | 40.54% |
| KW | 1 | 6.25% | 4 | 25.00% | 11 | 68.75% |
| MY | 48 | 19.67% | 83 | 34.02% | 113 | 46.31% |
| MX | 16 | 25.81% | 21 | 33.87% | 25 | 40.32% |
| PE | 5 | 27.78% | 7 | 38.89% | 6 | 33.33% |
| PH | 2 | 16.67% | 8 | 66.67% | 2 | 16.67% |
| PO * | 7 | 30.43% | 11 | 47.83% | 5 | 21.74% |
| QA | 1 | 3.23% | 2 | 6.45% | 28 | 90.32% |
| RS * | 5 | 41.67% | 5 | 41.67% | 2 | 16.67% |
| SA | 1 | 4.00% | 8 | 32.00% | 16 | 64.00% |
| ZA | 40 | 36.70% | 46 | 42.20% | 23 | 21.10% |
| KR | 6 | 40.00% | 4 | 26.67% | 5 | 33.33% |
| TW | 50 | 65.79% | 19 | 25.00% | 7 | 9.21% |
| TH | 28 | 30.43% | 41 | 44.57% | 23 | 25.00% |
| TR | 45 | 71.43% | 8 | 12.70% | 10 | 15.87% |
| UA | 4 | 11.11% | 7 | 19.44% | 25 | 69.44% |
| Total | 479 | - | 611 | - | 969 | - |
Note: Table A4. reports the number of companies across sample countries between the ESG clusters. The country names are represented by the TR EIKON Code, which are: BR = Brazil, CL = Chile, CN = China, CO = Colombia, CZ = Czech Republic, EG = Egypt, GR = Greece, HU = Hungary, IN = India, ID = Indonesia, KW = Kuwait, MY = Malaysia, MX = Mexico, PE = Peru, PH = Philippines, PO = Poland, and QA = Qatar. RS = Russia, SA = Saudi Arabia, ZA = South Africa, KR = South Korea, TW = Taiwan, TH = Thailand, TR = Turkey and UA= United Arab Emirates. * Countries also considered in the Iamandi et al. (2019) [6] sample.
Appendix E. Number of Sample Companies Across Economic Sectors between the ESG Clusters
Table A5.
Number of sample companies across economic sectors between the ESG clusters.
Table A5.
Number of sample companies across economic sectors between the ESG clusters.
| 2018 | Economic Sector | ||||||||||||
|---|---|---|---|---|---|---|---|---|---|---|---|---|---|
| ACD | BMT | CCS | CNC | ENG | FIN | HLC | IND | RES | TEC | UTL | TOT. | ||
| Higher ESG | Count | - | 98 | 60 | 71 | 53 | 143 | 19 | 98 | 20 | 101 | 48 | 711 |
| % within cluster | 0.00 | 13.78 | 8.44 | 9.99 | 7.45 | 20.11 | 2.67 | 13.78 | 2.81 | 14.21 | 6.75 | 100.0 | |
| % within ec.sector | 0.00 | 52.41 | 39.22 | 46.10 | 66.25 | 47.99 | 26.03 | 50.78 | 27.03 | 53.44 | 50.53 | 47.43 | |
| % of total | 0.00 | 6.54 | 4.00 | 4.74 | 3.54 | 9.54 | 1.27 | 6.54 | 1.33 | 6.74 | 3.20 | 47.43 | |
| Middle ESG | Count | 3 | 46 | 48 | 35 | 17 | 110 | 27 | 57 | 36 | 55 | 27 | 461 |
| % within cluster | 0.65 | 9.98 | 10.41 | 7.59 | 3.69 | 23.86 | 5.86 | 12.36 | 7.81 | 11.93 | 5.86 | 100.0 | |
| % within ec.sector | 100.0 | 24.60 | 31.37 | 22.73 | 21.25 | 36.91 | 36.99 | 29.53 | 48.65 | 29.10 | 28.42 | 30.75 | |
| % of total | 0.20 | 3.07 | 3.20 | 2.33 | 1.13 | 7.34 | 1.80 | 3.80 | 2.40 | 3.67 | 1.80 | 30.75 | |
| Lower ESG | Count | - | 43 | 45 | 48 | 10 | 45 | 27 | 38 | 18 | 33 | 20 | 327 |
| % within cluster | 0.00 | 13.15 | 13.76 | 14.68 | 3.06 | 13.76 | 8.26 | 11.62 | 5.50 | 10.09 | 6.12 | 100.0 | |
| % within ec.sector | 0.00 | 22.99 | 29.41 | 31.17 | 12.50 | 15.10 | 36.99 | 19.69 | 24.32 | 17.46 | 21.05 | 21.81 | |
| % of total | 0.00 | 2.87 | 3.00 | 3.20 | 0.67 | 3.00 | 1.80 | 2.54 | 1.20 | 2.20 | 1.33 | 21.81 | |
| Total | Count | 3 | 187 | 153 | 154 | 80 | 298 | 73 | 193 | 74 | 189 | 95 | 1.499 |
| % within cluster | 0.20 | 12.47 | 10.21 | 10.27 | 5.34 | 19.88 | 4.87 | 12.88 | 4.94 | 12.61 | 6.34 | 100.0 | |
| % within ec.sector | 100.0 | 100.0 | 100.0 | 100.0 | 100.0 | 100.0 | 100.0 | 100.0 | 100.0 | 100.0 | 100.0 | 100.0 | |
| % of total | 0.20 | 12.47 | 10.21 | 10.27 | 5.34 | 19.88 | 4.87 | 12.88 | 4.94 | 12.61 | 6.34 | 100.0 | |
| 2019 | Economic Sector | ||||||||||||
| ACD | BMT | CCS | CNC | ENG | FIN | HLC | IND | RES | TEC | UTL | TOT. | ||
| Higher ESG | Count | 1 | 105 | 61 | 74 | 61 | 136 | 23 | 104 | 26 | 94 | 47 | 732 |
| % within cluster | 0.14 | 14.34 | 8.33 | 10.11 | 8.33 | 18.58 | 3.14 | 14.21 | 3.55 | 12.84 | 6.42 | 100.0 | |
| % within ec.sector | 20.00 | 44.49 | 28.37 | 37.56 | 66.30 | 39.88 | 18.25 | 40.47 | 25.24 | 35.21 | 42.34 | 37.54 | |
| % of total | 0.05 | 5.38 | 3.13 | 3.79 | 3.13 | 6.97 | 1.18 | 5.33 | 1.33 | 4.82 | 2.41 | 37.54 | |
| Middle ESG | Count | 4 | 94 | 82 | 64 | 19 | 129 | 61 | 93 | 48 | 105 | 48 | 747 |
| % within cluster | 0.54 | 12.58 | 10.98 | 8.57 | 2.54 | 17.27 | 8.17 | 12.45 | 6.43 | 14.06 | 6.43 | 100.0 | |
| % within ec.sector | 80.00 | 39.83 | 38.14 | 32.49 | 20.65 | 37.83 | 48.41 | 36.19 | 46.60 | 39.33 | 43.24 | 38.31 | |
| % of total | 0.21 | 4.82 | 4.21 | 3.28 | 0.97 | 6.62 | 3.13 | 4.77 | 2.46 | 5.38 | 2.46 | 38.31 | |
| Lower ESG | Count | - | 37 | 72 | 59 | 12 | 76 | 42 | 60 | 29 | 68 | 16 | 471 |
| % within cluster | 0.00 | 7.86 | 15.29 | 12.53 | 2.55 | 16.14 | 8.92 | 12.74 | 6.16 | 14.44 | 3.40 | 100.0 | |
| % within ec.sector | 0.00 | 15.68 | 33.49 | 29.95 | 13.04 | 22.29 | 33.33 | 23.35 | 28.16 | 25.47 | 14.41 | 24.15 | |
| % of total | 0.00 | 1.90 | 3.69 | 3.03 | 0.62 | 3.90 | 2.15 | 3.08 | 1.49 | 3.49 | 0.82 | 24.15 | |
| Total | Count | 5 | 236 | 215 | 197 | 92 | 341 | 126 | 257 | 103 | 267 | 111 | 1950 |
| % within cluster | 0.26 | 12.10 | 11.03 | 10.10 | 4.72 | 17.49 | 6.46 | 13.18 | 5.28 | 13.69 | 5.69 | 100.0 | |
| % within ec.sector | 100.0 | 100.0 | 100.0 | 100.0 | 100.0 | 100.0 | 100.0 | 100.0 | 100.0 | 100.0 | 100.0 | 100.0 | |
| % of total | 0.26 | 12.10 | 11.03 | 10.10 | 4.72 | 17.49 | 6.46 | 13.18 | 5.28 | 13.69 | 5.69 | 100.0 | |
| 2020 | Economic Sector | ||||||||||||
| ACD | BMT | CCS | CNC | ENG | FIN | HLC | IND | RES | TEC | UTL | TOT. | ||
| Higher ESG | Count | - | 102 | 71 | 69 | 54 | 130 | 27 | 90 | 34 | 91 | 46 | 714 |
| % within cluster | 0.00 | 14.29 | 9.94 | 9.66 | 7.56 | 18.21 | 3.78 | 12.61 | 4.76 | 12.75 | 6.44 | 100.0 | |
| % within ec.sector | 0.00 | 34.81 | 27.95 | 30.26 | 52.43 | 34.67 | 18.75 | 29.13 | 29.06 | 29.64 | 36.80 | 31.59 | |
| % of total | 0.00 | 4.51 | 3.14 | 3.05 | 2.39 | 5.75 | 1.19 | 3.98 | 1.50 | 4.03 | 2.04 | 31.59 | |
| Middle ESG | Count | 5 | 107 | 95 | 79 | 34 | 155 | 66 | 119 | 44 | 122 | 49 | 875 |
| % within cluster | 0.57 | 12.23 | 10.86 | 9.03 | 3.89 | 17.71 | 7.54 | 13.60 | 5.03 | 13.94 | 5.60 | 100.0 | |
| % within ec.sector | 100.0 | 36.52 | 37.40 | 34.65 | 33.01 | 41.33 | 45.83 | 38.51 | 37.61 | 39.74 | 39.20 | 38.72 | |
| % of total | 0.22 | 4.73 | 4.20 | 3.50 | 1.50 | 6.86 | 2.92 | 5.27 | 1.95 | 5.40 | 2.17 | 38.72 | |
| Lower ESG | Count | - | 84 | 88 | 80 | 15 | 90 | 51 | 100 | 39 | 94 | 30 | 671 |
| % within cluster | 0.00 | 12.52 | 13.11 | 11.92 | 2.24 | 13.41 | 7.60 | 14.90 | 5.81 | 14.01 | 4.47 | 100.0 | |
| % within ec.sector | 0.00 | 28.67 | 34.65 | 35.09 | 14.56 | 24.00 | 35.42 | 32.36 | 33.33 | 30.62 | 24.00 | 29.69 | |
| % of total | 0.00 | 3.72 | 3.89 | 3.54 | 0.66 | 3.98 | 2.26 | 4.42 | 1.73 | 4.16 | 1.33 | 29.69 | |
| Total | Count | 5 | 293 | 254 | 228 | 103 | 375 | 144 | 309 | 117 | 307 | 125 | 2260 |
| % within cluster | 0.22 | 12.96 | 11.24 | 10.09 | 4.56 | 16.59 | 6.37 | 13.67 | 5.18 | 13.58 | 5.53 | 100.0 | |
| % within ec.sector | 100.0 | 100.0 | 100.0 | 100.0 | 100.0 | 100.0 | 100.0 | 100.0 | 100.0 | 100.0 | 100.0 | 100.0 | |
| % of total | 0.22 | 12.96 | 11.24 | 10.09 | 4.56 | 16.59 | 6.37 | 13.67 | 5.18 | 13.58 | 5.53 | 100.0 | |
| 2021 | Economic Sector | ||||||||||||
| ACD | BMT | CCS | CNC | ENG | FIN | HLC | IND | RES | TEC | UTL | TOT. | ||
| Higher ESG | Count | 1 | 66 | 49 | 48 | 34 | 97 | 20 | 58 | 22 | 69 | 15 | 479 |
| % within cluster | 0.21 | 13.78 | 10.23 | 10.02 | 7.10 | 20.25 | 4.18 | 12.11 | 4.59 | 14.41 | 3.13 | 100.0 | |
| % within ec.sector | 33.33 | 22.22 | 21.97 | 24.87 | 40.48 | 29.04 | 12.82 | 18.47 | 19.64 | 25.84 | 19.74 | 23.26 | |
| % of total | 0.05 | 3.21 | 2.38 | 2.33 | 1.65 | 4.71 | 0.97 | 2.82 | 1.07 | 3.35 | 0.73 | 23.26 | |
| Middle ESG | Count | 1 | 78 | 67 | 50 | 27 | 111 | 63 | 79 | 31 | 78 | 26 | 611 |
| % within cluster | 0.16 | 12.77 | 10.97 | 8.18 | 4.42 | 18.17 | 10.31 | 12.93 | 5.07 | 12.77 | 4.26 | 100.0 | |
| % within ec.sector | 33.33 | 26.26 | 30.04 | 25.91 | 32.14 | 33.23 | 40.38 | 25.16 | 27.68 | 29.21 | 34.21 | 29.67 | |
| % of total | 0.05 | 3.79 | 3.25 | 2.43 | 1.31 | 5.39 | 3.06 | 3.84 | 1.51 | 3.79 | 1.26 | 29.67 | |
| Lower ESG | Count | 1 | 153 | 107 | 95 | 23 | 126 | 73 | 177 | 59 | 120 | 35 | 969 |
| % within cluster | 0.10 | 15.79 | 11.04 | 9.80 | 2.37 | 13.00 | 7.53 | 18.27 | 6.09 | 12.38 | 3.61 | 100.0 | |
| % within ec.sector | 33.33 | 51.52 | 47.98 | 49.22 | 27.38 | 37.72 | 46.79 | 56.37 | 52.68 | 44.94 | 46.05 | 47.06 | |
| % of total | 0.05 | 7.43 | 5.20 | 4.61 | 1.12 | 6.12 | 3.55 | 8.60 | 2.87 | 5.83 | 1.70 | 47.06 | |
| Total | Count | 3 | 297 | 223 | 193 | 84 | 334 | 156 | 314 | 112 | 267 | 76 | 2059 |
| % within cluster | 0.15 | 14.42 | 10.83 | 9.37 | 4.08 | 16.22 | 7.58 | 15.25 | 5.44 | 12.97 | 3.69 | 100.0 | |
| % within ec.sector | 100.0 | 100.0 | 100.0 | 100.0 | 100.0 | 100.0 | 100.0 | 100.0 | 100.0 | 100.0 | 100.0 | 100.0 | |
| % of total | 0.15 | 14.42 | 10.83 | 9.37 | 4.08 | 16.22 | 7.58 | 15.25 | 5.44 | 12.97 | 3.69 | 100.0 | |
Note: Table A5 reports the number of sample companies across economic sectors between the ESG clusters. Considering the TR EIKON database, the eleven investigated economic sectors are: ACD= Academic and Educational Services, BMT = Basic Materials; CCS = Consumer Cyclicals; CNC = Consumer Non-Cyclicals; ENG = Energy; FIN = Financials; HLC = Healthcare; IND = Industrials; RES = Real State; TEC = Technology; UTL = Utilities.
Appendix F. Clusters’ Medians
Table A6.
ESG score cluster medians.
Table A6.
ESG score cluster medians.
| Year | Cluster | ESG_S | ENV_S | SOC_S | GOV_S | Combined_S |
|---|---|---|---|---|---|---|
| 2018 | Higher ESG | 61.87 | 60.70 | 67.64 | 61.14 | 60.47 |
| Middle ESG | 36.51 | 21.97 | 35.70 | 50.00 | 36.39 | |
| Lower ESG | 16.32 | 3.72 | 11.87 | 24.67 | 16.32 | |
| 2019 | Higher ESG | 63.98 | 64.36 | 69.34 | 61.89 | 62.44 |
| Middle ESG | 38.55 | 28.36 | 37.06 | 53.13 | 38.23 | |
| Lower ESG | 17.53 | 4.37 | 12.41 | 27.61 | 17.53 | |
| 2020 | Higher ESG | 67.23 | 68.94 | 72.61 | 59.90 | 65.44 |
| Middle ESG | 43.68 | 33.94 | 44.53 | 53.70 | 42.97 | |
| Lower ESG | 20.68 | 6.94 | 13.54 | 37.63 | 20.68 | |
| 2021 | Higher ESG | 69.98 | 68.97 | 74.03 | 64.36 | 67.56 |
| Middle ESG | 50.56 | 43.71 | 53.28 | 51.41 | 50.19 | |
| Lower ESG | 27.31 | 14.53 | 20.17 | 43.46 | 27.18 |
Note: Table A6 reports the ESG score cluster medians.
Table A7.
ESG thematic score cluster medians.
Table A7.
ESG thematic score cluster medians.
| 2018 | 2019 | 2020 | 2021 | |||||||||
|---|---|---|---|---|---|---|---|---|---|---|---|---|
| Variable | Higher | Middle | Lower | Higher | Middle | Lower | Higher | Middle | Lower | Higher | Middle | Lower |
| Resource.Use | 76.96 | 52.13 | 8.10 | 75.88 | 48.41 | 5.80 | 80.56 | 49.81 | 4.51 | 80.68 | 56.08 | 12.14 |
| Emissions | 79.29 | 56.32 | 9.35 | 76.98 | 51.48 | 6.15 | 81.33 | 48.42 | 7.30 | 80.67 | 53.99 | 17.69 |
| Environmental.Innovation | 50.00 | 17.87 | 0.00 | 46.58 | 25.70 | 0.00 | 49.18 | 24.29 | 0.00 | 50.00 | 16.55 | 0.00 |
| Workforce | 85.78 | 68.92 | 29.42 | 84.29 | 67.61 | 26.04 | 87.69 | 63.75 | 22.62 | 87.04 | 67.78 | 27.34 |
| Human.Rights | 73.19 | 25.19 | 0.00 | 72.17 | 18.45 | 0.00 | 71.86 | 23.24 | 0.00 | 78.91 | 28.15 | 0.00 |
| Community | 81.93 | 41.09 | 15.98 | 79.51 | 31.01 | 14.77 | 80.66 | 43.31 | 15.97 | 83.62 | 43.83 | 19.70 |
| Product.Responsibility | 76.62 | 65.95 | 15.64 | 75.06 | 52.67 | 16.28 | 77.97 | 60.97 | 15.05 | 78.13 | 58.66 | 25.71 |
| Management | 64.15 | 50.99 | 37.50 | 62.60 | 49.28 | 38.68 | 64.24 | 51.16 | 39.24 | 64.61 | 56.09 | 44.88 |
| Shareholders | 53.92 | 50.00 | 45.36 | 53.18 | 49.78 | 49.78 | 55.92 | 50.76 | 50.00 | 56.57 | 49.50 | 51.62 |
| CSR.Strategy | 74.29 | 48.82 | 8.33 | 72.87 | 53.26 | 6.60 | 79.82 | 45.21 | 7.30 | 79.27 | 59.93 | 23.44 |
Note: Table A7 reports the ESG thematic score cluster medians.
Table A8.
ESG strategic views score cluster medians.
Table A8.
ESG strategic views score cluster medians.
| 2018 | 2019 | 2020 | 2021 | |||||||||
|---|---|---|---|---|---|---|---|---|---|---|---|---|
| Variable | Higher | Middle | Lower | Higher | Middle | Lower | Higher | Middle | Lower | Higher | Middle | Lower |
| ESG.Ow_S | 69.72 | 33.16 | 44.59 | 66.08 | 41.09 | 44.21 | 59.81 | 56.73 | 36.73 | 67.70 | 30.74 | 43.46 |
| ESG.Em_S | 82.30 | 65.84 | 25.78 | 87.11 | 70.79 | 28.54 | 82.05 | 52.24 | 21.91 | 78.73 | 72.67 | 27.38 |
| ESG.Cr_S | 52.56 | 36.60 | 8.76 | 64.06 | 25.84 | 13.28 | 49.27 | 33.63 | 11.10 | 51.15 | 34.19 | 14.40 |
| ESG.Cy_S | 67.53 | 46.87 | 12.46 | 74.01 | 49.28 | 15.40 | 66.64 | 35.66 | 12.81 | 64.25 | 55.01 | 19.16 |
| ESG.S_S | 66.66 | 46.28 | 23.99 | 69.40 | 48.69 | 26.46 | 62.53 | 43.76 | 23.08 | 63.66 | 49.10 | 28.25 |
| ESG.In_S | 71.48 | 47.20 | 19.80 | 68.10 | 47.31 | 24.53 | 75.83 | 54.09 | 34.10 | 71.21 | 49.13 | 28.54 |
| ESG.Ex_S | 62.57 | 30.77 | 6.17 | 60.48 | 26.79 | 8.19 | 65.57 | 47.43 | 14.38 | 61.49 | 27.42 | 16.68 |
| ESG.P_S | 65.70 | 38.95 | 14.09 | 61.59 | 35.90 | 16.37 | 70.51 | 50.62 | 25.16 | 64.94 | 40.67 | 21.75 |
| ESG.St_S | 71.70 | 54.14 | 27.23 | 73.27 | 54.42 | 31.15 | 66.72 | 41.83 | 19.19 | 67.79 | 60.78 | 30.86 |
| ESG.Ta_S | 72.07 | 49.64 | 25.23 | 73.10 | 49.73 | 26.95 | 61.62 | 37.52 | 16.92 | 68.50 | 48.00 | 26.14 |
| ESG.Op_S | 77.73 | 51.90 | 14.03 | 79.69 | 54.22 | 13.74 | 69.12 | 28.84 | 6.31 | 76.82 | 47.16 | 16.65 |
| ESG.ML_S | 72.57 | 51.67 | 24.85 | 75.67 | 52.90 | 25.45 | 63.74 | 36.42 | 15.35 | 71.28 | 50.96 | 26.61 |
| ESG.Po_S | 62.99 | 30.32 | 4.25 | 56.34 | 33.10 | 10.31 | 58.17 | 59.07 | 18.70 | 59.11 | 56.37 | 19.91 |
| ESG.Ho_S | 68.30 | 45.54 | 14.67 | 63.28 | 50.84 | 28.50 | 64.55 | 58.47 | 37.79 | 64.34 | 67.76 | 37.93 |
| ESG.Co_S | 85.78 | 64.72 | 53.51 | 81.43 | 62.64 | 58.00 | 82.34 | 47.74 | 61.78 | 83.50 | 58.72 | 63.17 |
| ESG.F_S | 68.76 | 44.63 | 20.56 | 63.29 | 47.02 | 29.39 | 65.51 | 56.05 | 36.93 | 65.41 | 59.56 | 37.62 |
Note: Table A8 reports the ESG strategic views score cluster medians.
References
- Hübel, B.; Scholz, H. Integrating sustainability risks in asset management: The role of ESG exposures and ESG ratings. J. Asset Manag. 2020, 21, 52–69. [Google Scholar] [CrossRef]
- Bassen, A.; Meyer, K.; Schlange, J. The Influence of Corporate Responsibility on the Cost of Capital (Working Paper Series); University of Hamburg: Hamburg, Germany, 2006. [Google Scholar]
- Orlitzky, M.; Benjamin, J.D. Corporate social performance, and firm risk: A metanalytic review. Bus. Soc. 2001, 40, 369–396. [Google Scholar] [CrossRef]
- Widyawati, L. A systematic literature review of socially responsible investment and environmental social governance metrics. Bus. Strategy Environ. 2020, 29, 619–637. [Google Scholar] [CrossRef]
- Aldowaish, A.; Kokuryo, J.; Almazyad, O.; Goi, H.C. Environmental, Social, and Governance Integration into the Business Model: Literature Review and Research Agenda. Sustainability 2022, 14, 2959. [Google Scholar] [CrossRef]
- Iamandi, I.E.; Constantin, L.G.; Munteanu, S.M.; Cernat-Gruici, B. Mapping the ESG Behavior of European Companies. A Holistic Kohonen Approach. Sustainability 2019, 11, 3276. [Google Scholar] [CrossRef]
- Goyal, P.; Rahman, Z. Corporate sustainability performance and firm performance: Literature review and future research agenda. Manag. Decis. 2013, 51, 361–379. [Google Scholar] [CrossRef]
- Engert, S.; Baumgartner, R.J. Corporate sustainability strategy—Bridging the gap between formulation and implementation. J. Clean. Prod. 2016, 113, 822–834. [Google Scholar] [CrossRef]
- Ortas, E.; Álvarez, I.; Jaussaud, J.; Garayar, A. The impact of institutional and social context on corporate environmental, social and governance performance of companies committed to voluntary corporate social responsibility initiatives. J. Clean. Prod. 2015, 108, 673–684. [Google Scholar] [CrossRef]
- Cunha, F.A.F.S.; Oliveira, E.M.; Orsato, R.J.; Klotzle, M.C.; Oliveira, F.L.C.; Caiado, R.G.G. Can sustainable investments outperform traditional benchmarks? Evidence from global stock markets. Bus. Strategy Environ. 2020, 29, 682–697. [Google Scholar] [CrossRef]
- Drempetic, S.; Klein, C.; Zwergel, B. The Influence of Firm Size on the ESG Score: Corporate Sustainability Ratings Under Review. J. Bus. Ethics 2020, 167, 333–360. [Google Scholar] [CrossRef]
- Porter, M.E.; Hills, G.; Pfitzer, M.; Patscheke, S.; Hawkins, E. Measuring Shared Value: How to Unlock Value by Linking Business and Social Results. Foundation Strategy Group (FSG). 2012. Available online: https://www.hbs.edu/faculty/Pages/item.aspx?num=46910 (accessed on 1 July 2022).
- Eccles, R.G.; Ioannou, I.; Serafeim, G. The impact of corporate sustainability on organizational processes and performance. Manag. Sci. 2014, 60, 2835–2857. [Google Scholar] [CrossRef]
- Birindelli, G.; Dell’Atti, S.; Iannuzzi, A.P.; Savioli, M. Composition and activity of the board of directors: Impact on ESG performance in the banking system. Sustainability 2018, 10, 4699. [Google Scholar] [CrossRef]
- Disli, M.; Yilmaz, M.K.; Mohamed, F.F.M. Board characteristics and sustainability performance: Empirical evidence from emerging markets. Sustain. Account. Manag. Policy J. 2022, 13, 929–952. [Google Scholar] [CrossRef]
- Ioannou, I.; Serafeim, G. The Consequences of Mandatory Corporate Sustainability Reporting (1 May 2017). Harvard Business School Research Working Paper No. 11-100. Available online: https://ssrn.com/abstract=1799589 (accessed on 9 September 2023).
- Jitmaneeroj, B. Reform priorities for corporate sustainability: Environmental, social, governance, or economic performance? Manag. Decis. 2016, 54, 1497–1521. [Google Scholar] [CrossRef]
- Engelhardt, N.; Ekkenga, J.; Posch, P. ESG Ratings and Stock Performance during the COVID-19 Crisis. Sustainability 2021, 13, 7133. [Google Scholar] [CrossRef]
- Giese, G.; Nagy, Z.; Lee, L.E. Deconstructing ESG Ratings Performance: Risk and Return for E, S, and G by Time Horizon, Sector, and Weighting. J. Portf. Manag. 2021, 47, 94–111. [Google Scholar] [CrossRef]
- Miralles-Quirós, M.M.; Miralles-Quirós, J.L.; Gonçalves, L.M.V. The Value Relevance of Environmental, Social, and Governance Performance: The Brazilian Case. Sustainability 2018, 10, 574. [Google Scholar] [CrossRef]
- Alsayegh, M.F.; Rahman, R.A.; Homayoun, S. Corporate Economic, Environmental, and Social Sustainability Performance Transformation through ESG Disclosure. Sustainability 2020, 12, 3910. [Google Scholar] [CrossRef]
- Friede, G.; Busch, T.; Bassen, A. ESG and financial performance: Aggregated evidence from more than 2000 empirical studies. J. Sustain. Financ. Invest. 2015, 5, 210–233. [Google Scholar] [CrossRef]
- Badia, G.; Cortez, M.; Ferruz, L. Socially responsible investing worldwide: Do markets value corporate social responsibility? Corp. Soc. Responsib. Environ. Manag. 2020, 27, 2751–2764. [Google Scholar] [CrossRef]
- Ramirez, A.G.; Monsalve, J.; González-Ruiz, J.D.; Almonacid, P.; Peña, A. Relationship between the cost of capital and environmental, social, and governance scores: Evidence from latin america. Sustainability 2022, 14, 5012. [Google Scholar] [CrossRef]
- Boldeanu, F.T.; Clemente-Almendros, J.A.; Tache, I.; Seguí-Amortegui, L.A. Is ESG relevant to electricity companies during pandemics? A case study on European firms during COVID-19. Sustainability 2022, 14, 852. [Google Scholar] [CrossRef]
- Bansal, R.; Wu, D.A.; Yaron, A. Socially Responsible Investing in Good and Bad Times. Rev. Financ. Stud. 2022, 35, 2067–2099. [Google Scholar] [CrossRef]
- Jia, J.; Li, Z. Does external uncertainty matter in corporate sustainability performance? J. Corp. Financ. 2020, 65, 101743. [Google Scholar] [CrossRef]
- Kluza, K.; Ziolo, M.; Spoz, A. Innovation and environmental, social, and governance factors influencing sustainable business models—Meta-analysis. J. Clean. Prod. 2021, 303, 127015. [Google Scholar] [CrossRef]
- Kohonen, T. Self-Organizing Maps, 3rd ed.; Springer: New York, NY, USA, 2001. [Google Scholar]
- Kaski, S.; Kohonen, T. Winners-Takes-All network. In Triennial Report (1994–1996). Neural Networks Research Centre & Laboratory of Computer and Information Science; Helsinky University of Technology: Helsinky, Finland, 1997. [Google Scholar]
- Wehrens, R.; Kruisselbrink, J. Flexible Self-Organizing Maps in kohonen 3.0. J. Stat. Softw. 2018, 87, 1–18. [Google Scholar] [CrossRef]
- Wehrens, R.; Buydens, L.M.C. Self- and Super-Organizing Maps in R: The kohonen Package. J. Stat. Softw. 2007, 21, 1–19. [Google Scholar] [CrossRef]
- Boelaert, J.; Ollion, E.; Sodoge, J. aweSOM: Interactive Self-Organizing Maps. R Package Version 1.2. 2021. Available online: https://CRAN.R-project.org/package=aweSOM (accessed on 9 September 2023).
- Kuhn, M. caret: Classification and Regression Training. R Package Version 6.0-92. 2022. Available online: https://CRAN.R-project.org/package=caret (accessed on 9 September 2023).
- Maechler, M.; Rousseeuw, P.; Struyf, A.; Hubert, M.; Hornik, K. Cluster: Cluster Analysis Basics and Extensions. R package version 2.1.3. 2022. Available online: https://cir.nii.ac.jp/crid/1370290617548437512 (accessed on 9 September 2023).
- Rousseeuw, P.J. Silhouettes: A Graphical Aid to the Interpretation and Validation of Cluster Analysis. J. Comput. Appl. Math. 1987, 20, 53–65. [Google Scholar] [CrossRef]
- Garcia, A.S.; Mendes-Da-Silva, W.; Orsato, R.J. Sensitive industries produce better ESG performance: Evidence from emerging markets. J. Clean. Prod. 2017, 150, 135–147. [Google Scholar] [CrossRef]
- Berglund, E.; Sitte, J. The parameterless self-organizing map algorithm. IEEE Trans. Neural Netw. 2006, 17, 305–316. [Google Scholar] [CrossRef][Green Version]
- Bauer, H.; Herrmann, M.; Villmann, T. Neural maps and topographic vector quantization. Neural Netw. 1999, 12, 659–676. [Google Scholar] [CrossRef] [PubMed]
- Aouadi, A.; Marsat, S. Do ESG controversies matter for firm value? Evidence from international data. J. Bus. Ethics 2018, 151, 1027–1047. [Google Scholar] [CrossRef]
- De Franco, C. ESG Controversies and Their Impact on Performance. J. Invest. ESG 2020, 29, 33–45. [Google Scholar] [CrossRef]
- Porter, M.E.; Kramer, M.R. Creating Shared Value. Harv. Bus. Rev. 2011, 89, 62–77. [Google Scholar]
- Nicolaescu, E.; Alpopi, C.; Zaharia, C. Measuring Corporate Sustainability Performance. Sustainability 2015, 7, 851–865. [Google Scholar] [CrossRef]
- Brammer, S.; Millington, A. Does it pay to be different? An analysis of the relationship between corporate social and financial performance. Strateg. Manag. J. 2008, 29, 1325–1343. [Google Scholar] [CrossRef]
- Vitaliano, D.F. Corporate social responsibility, and labor turnover. Corp. Gov. 2010, 10, 563–573. [Google Scholar] [CrossRef]
Disclaimer/Publisher’s Note: The statements, opinions and data contained in all publications are solely those of the individual author(s) and contributor(s) and not of MDPI and/or the editor(s). MDPI and/or the editor(s) disclaim responsibility for any injury to people or property resulting from any ideas, methods, instructions or products referred to in the content. |
© 2024 by the authors. Licensee MDPI, Basel, Switzerland. This article is an open access article distributed under the terms and conditions of the Creative Commons Attribution (CC BY) license (https://creativecommons.org/licenses/by/4.0/).